SMO Exclusive: Strength Report Consumer Sector 2024-04-05

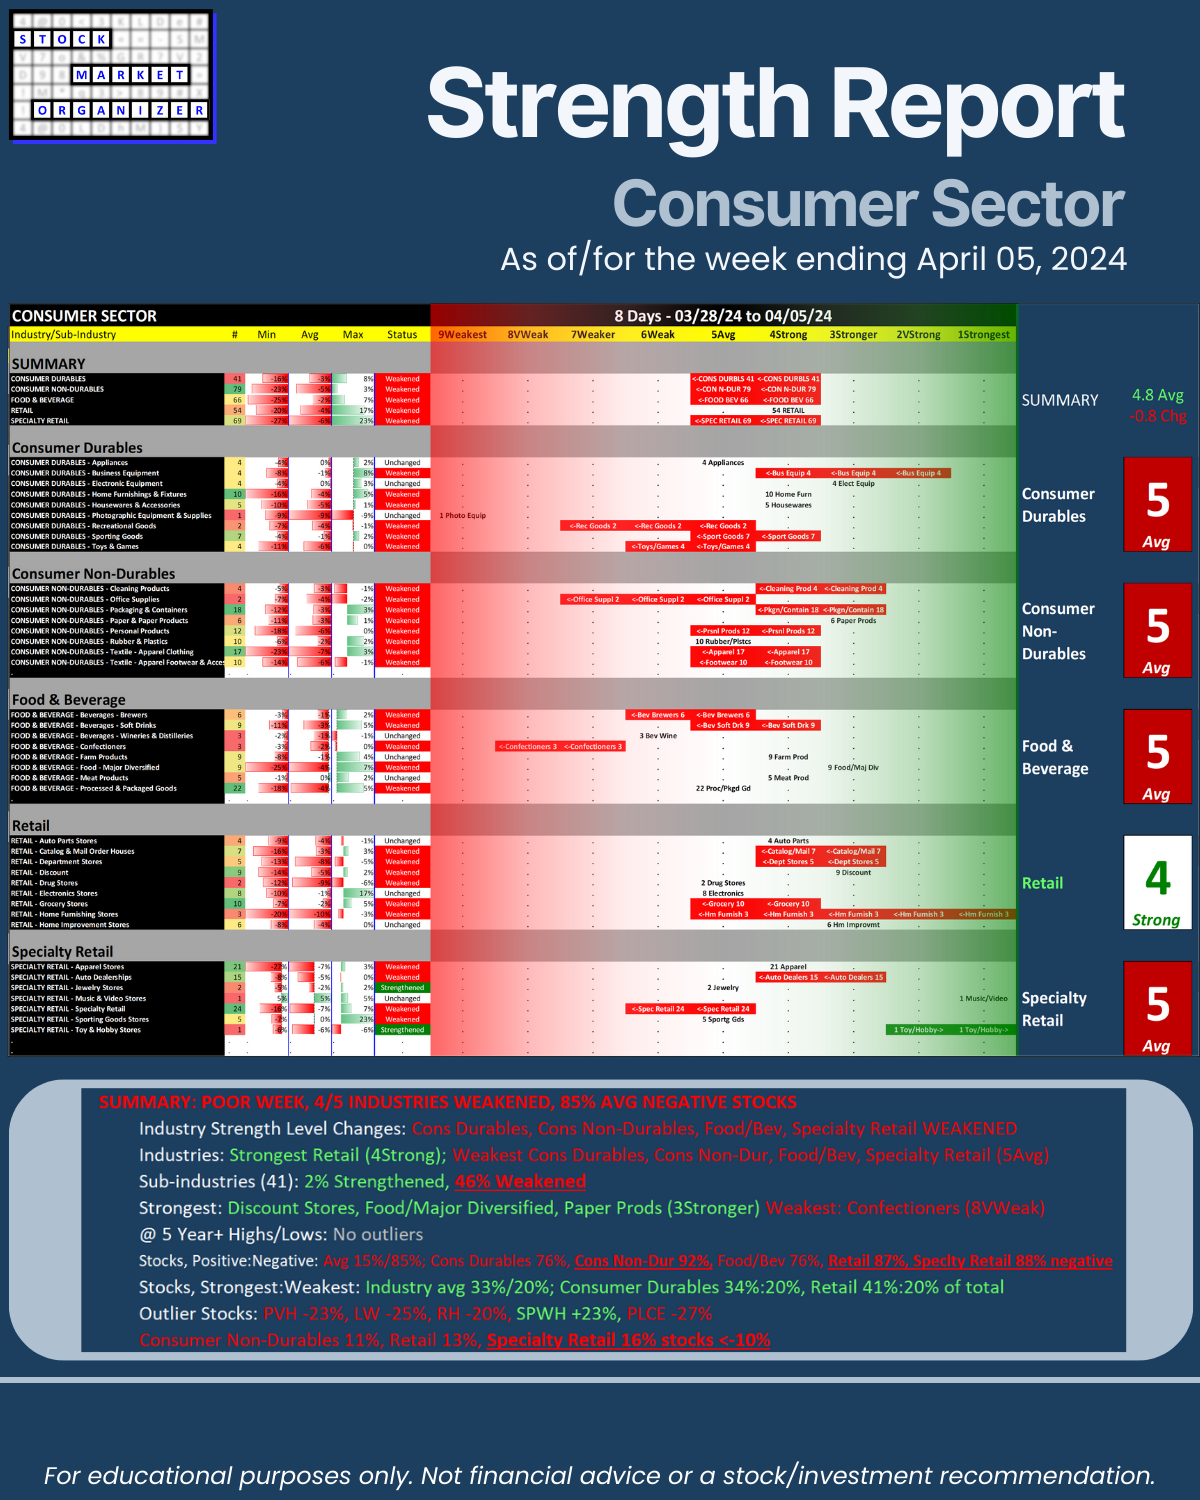
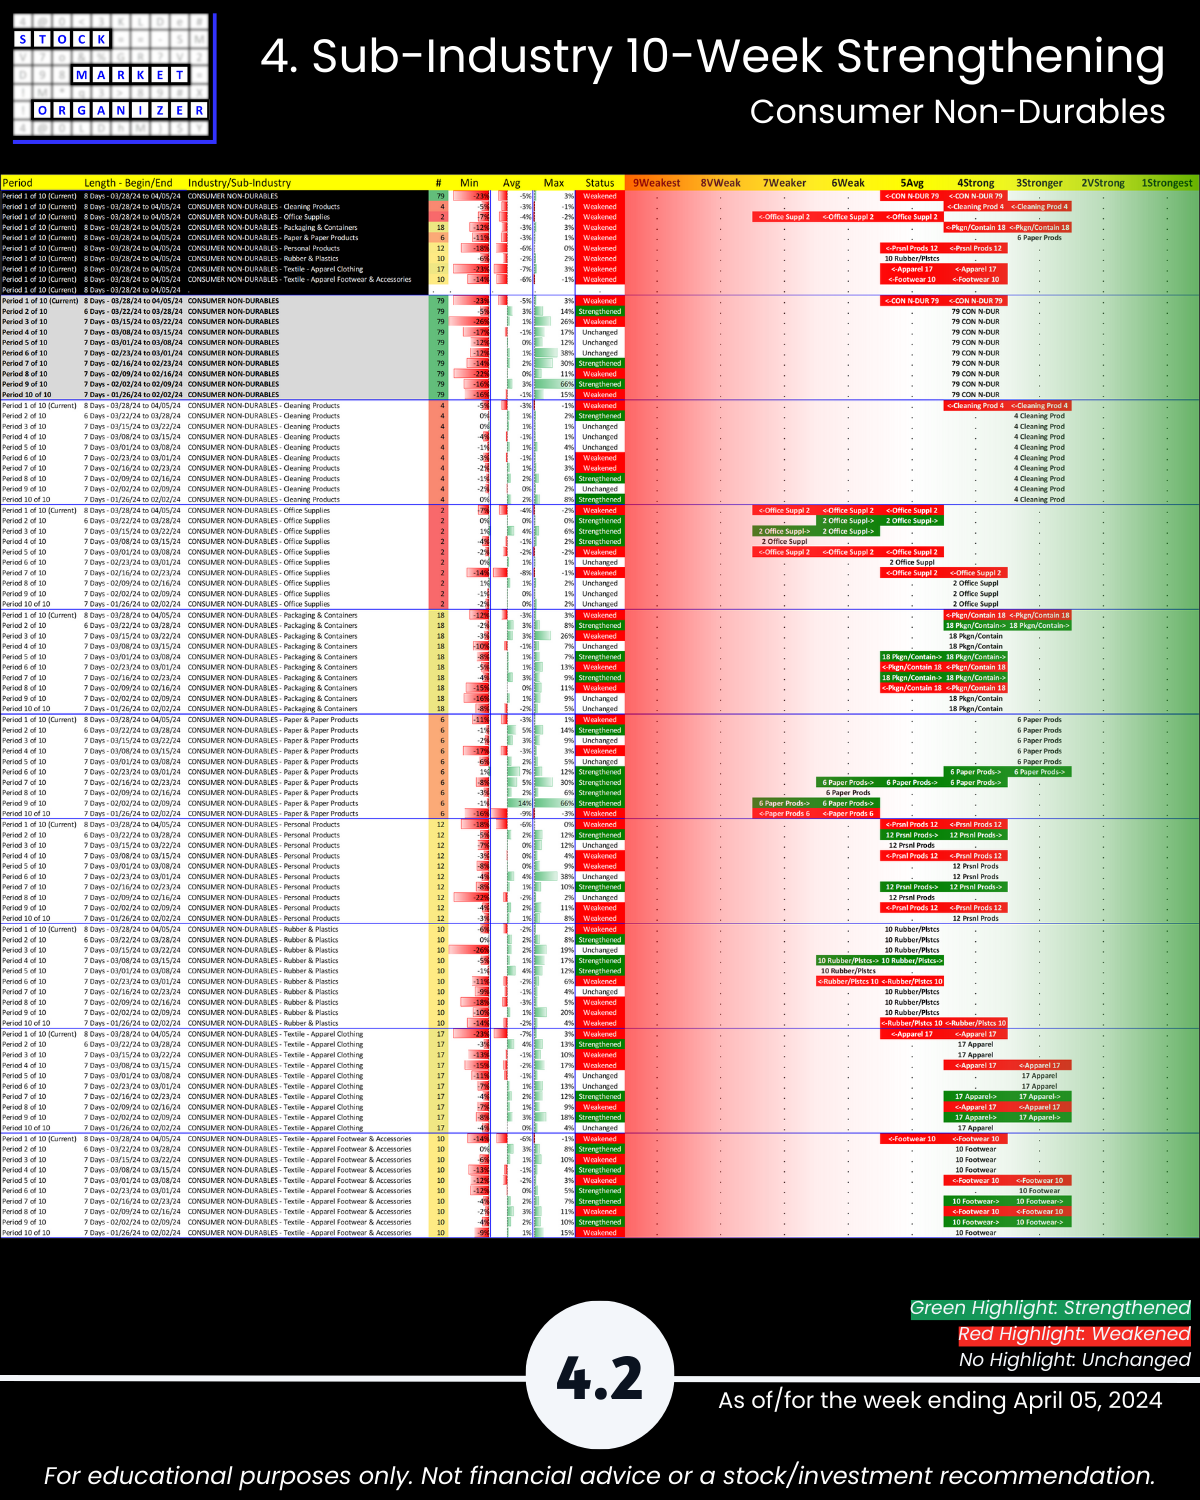
Consumer Sector 4/5/24 follows the weakening examples of Financials and Tech. With the market not far from all-time highs, could the long-awaited inverted yield curve-signaling recession finally be under way? Who knows. But it has to start somewhere. If it’s going to happen at all. Unique U.S. Stock Market strength-based insights: 🔹 4 of 5 industries weakened as the average strength score falls 0.8 (a large drop) to 4.8 – barely better than the 5.0 Average, 🔹 85% average negative stocks with Consumer Non-Durables at 92%, Specialty Retail 88%, and Retail 87%,🔹 3 industries with more than 10% of stocks falling more than -10% (Specialty Retail 16%, Retail 13%, and Consumer Non-Durables 11), 🔹 46% of 41 sub-industries weakened (6 of 8 Consumer Non-Durables sub-industries weakened).
LOWLIGHTS YOU PROBABLY DON’T KNOW
POOR WEEK, 4/5 INDUSTRIES WEAKENED, 85% AVG NEGATIVE STOCKS
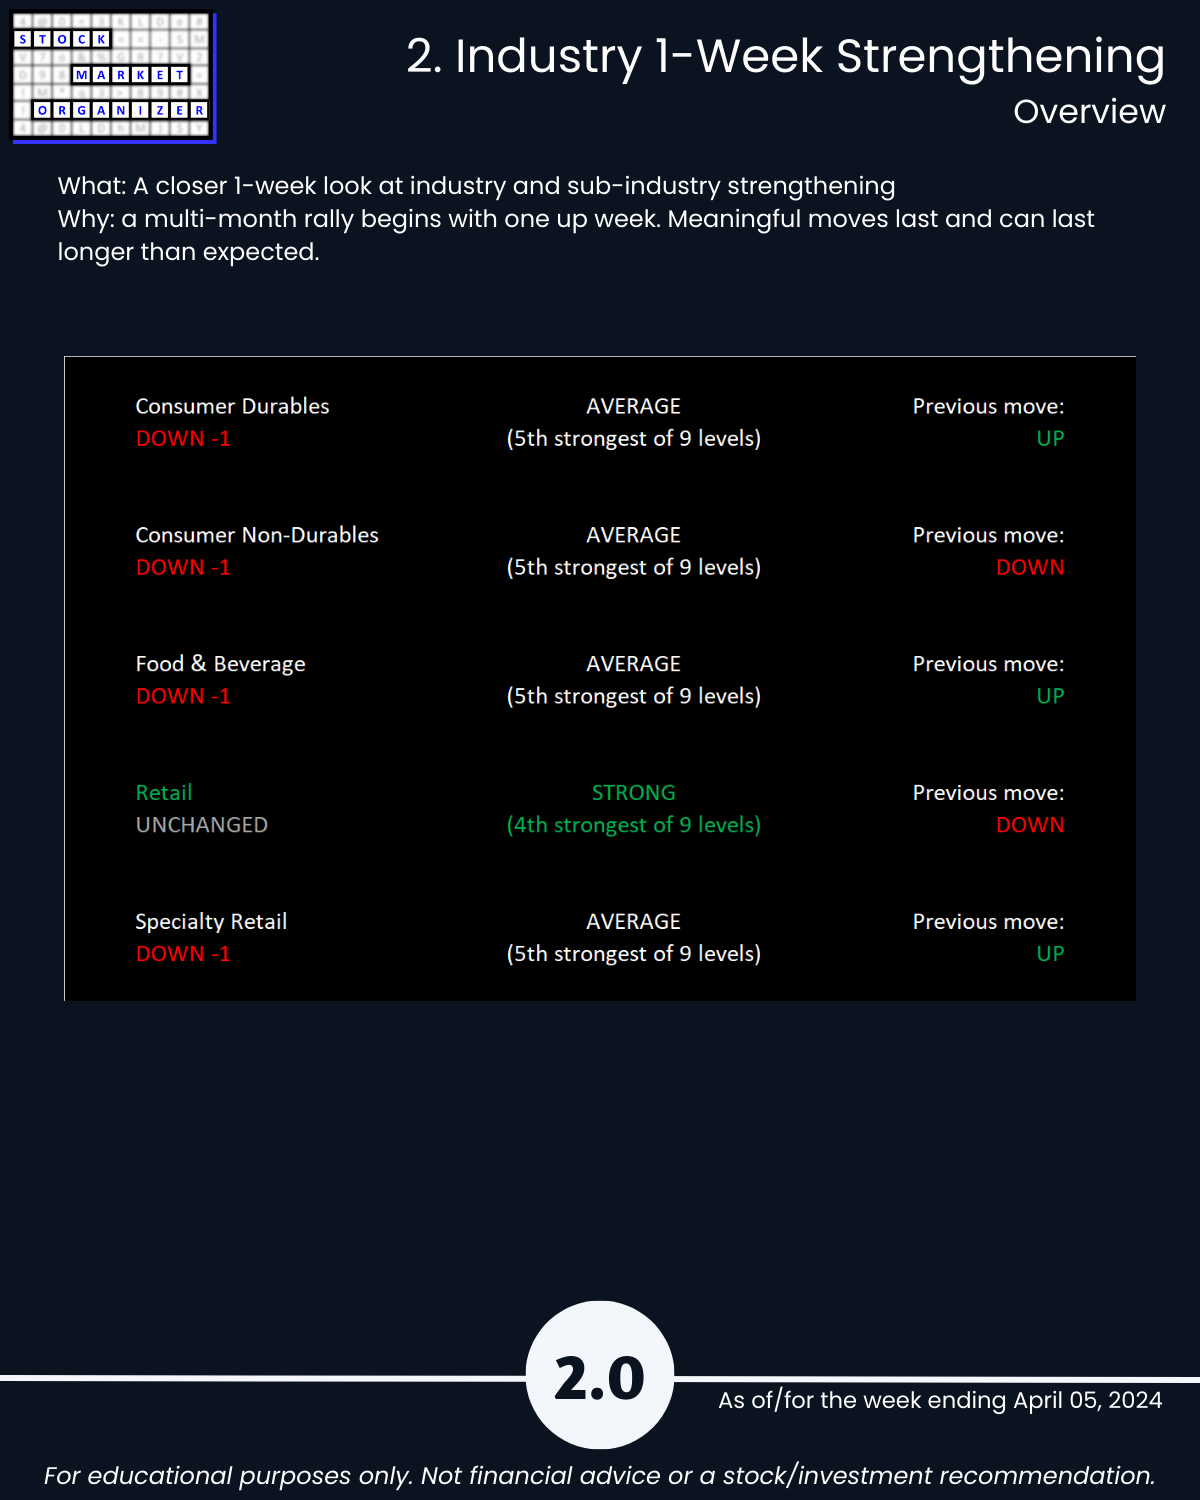
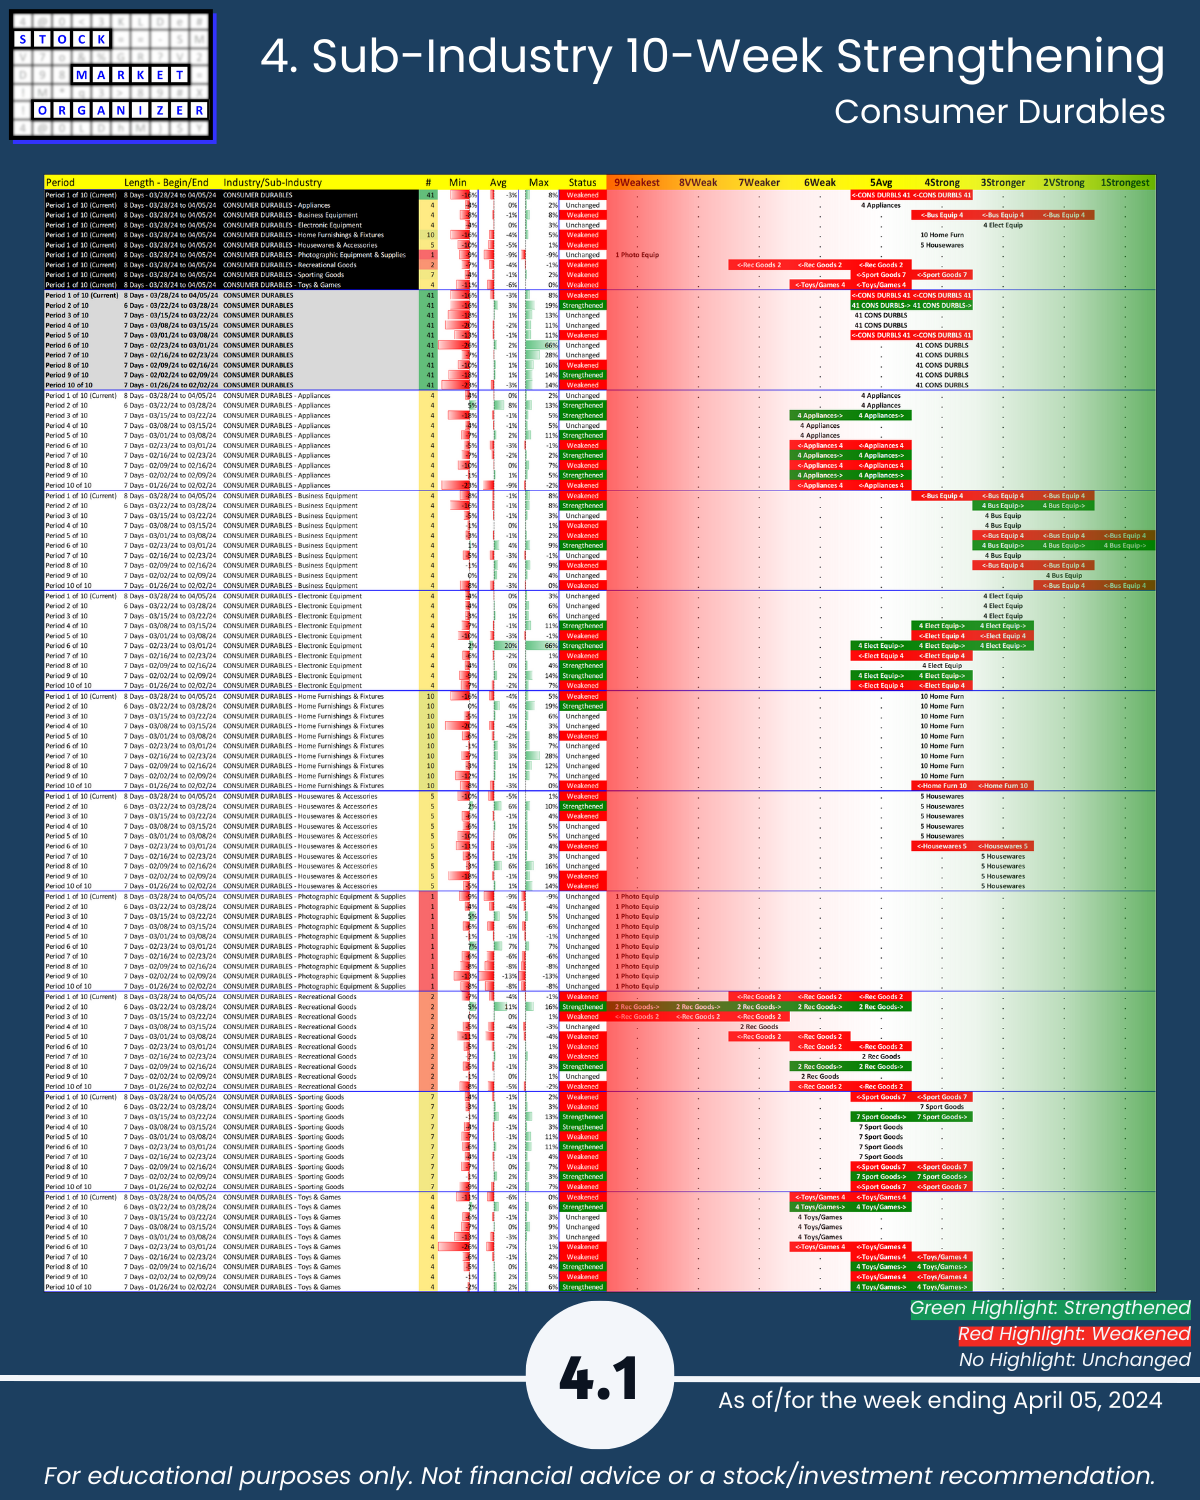
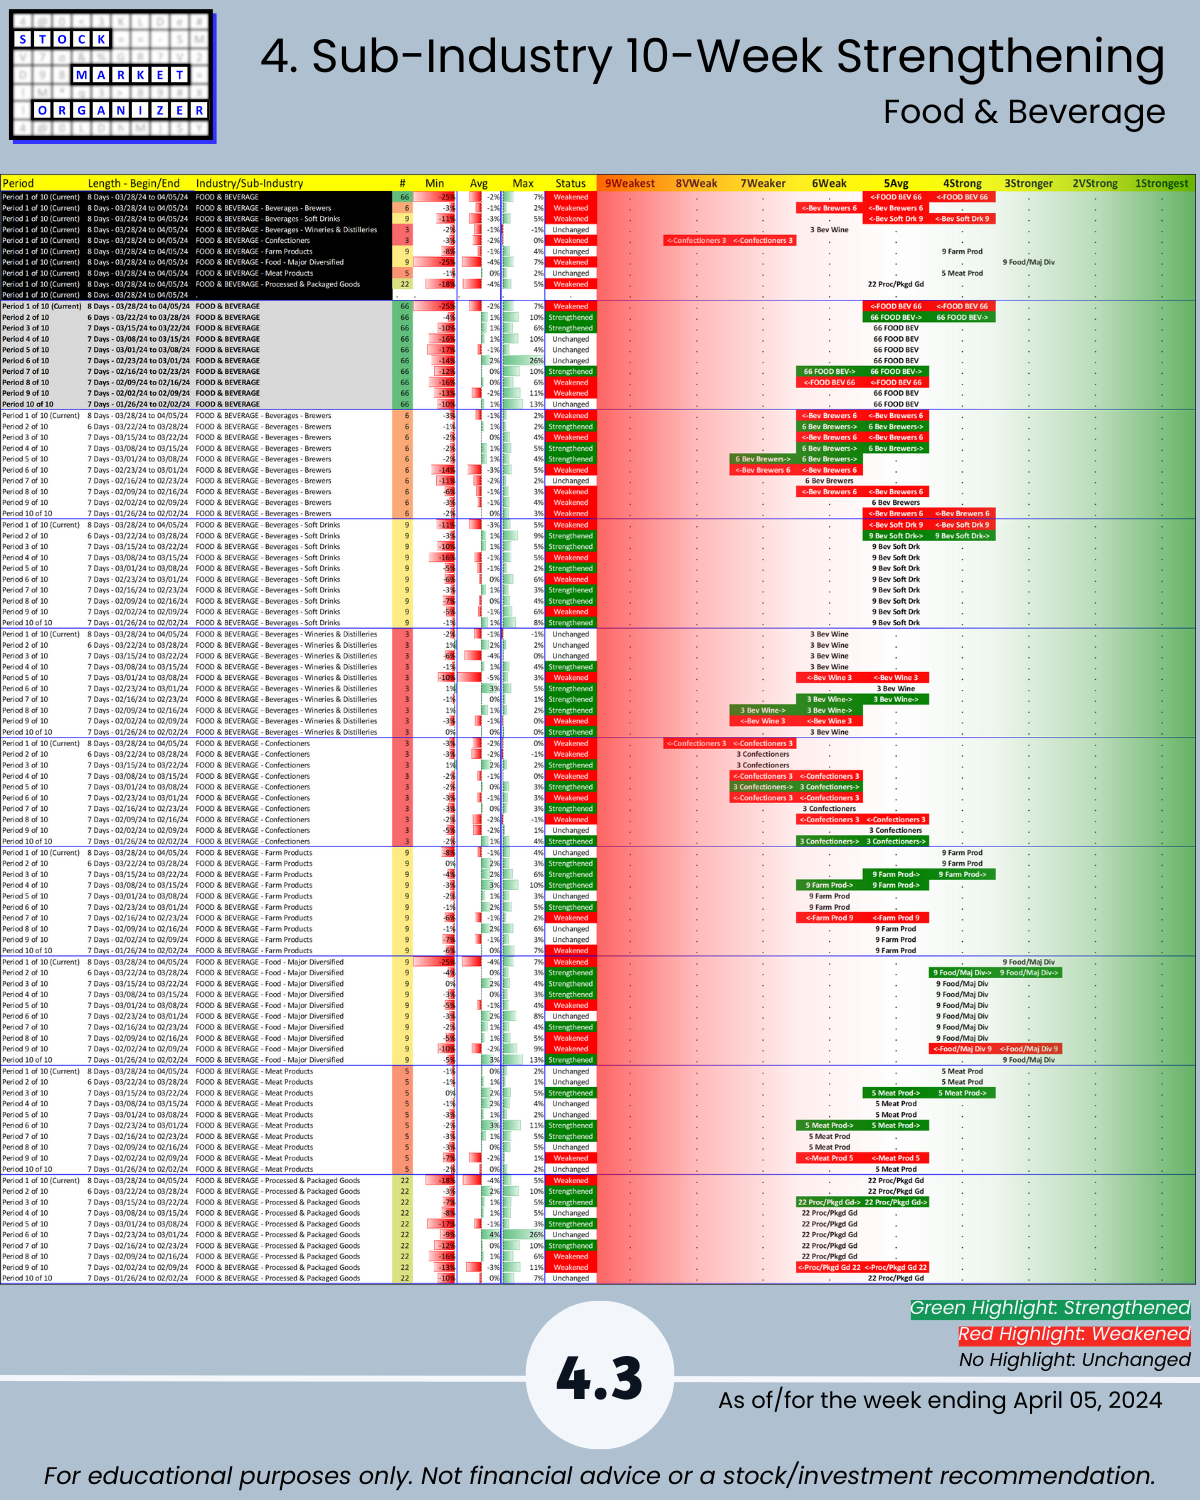
🔹 Industry Strength Level Changes: Cons Durables, Consumer Non-Durables, Food & Beverage, Specialty Retail WEAKENED
🔹 Industries:
- Strongest Retail (4Strong)
- Weakest Consumer Durables, Consumer Non-Durables, Food & Beverage, Specialty Retail (5Avg)
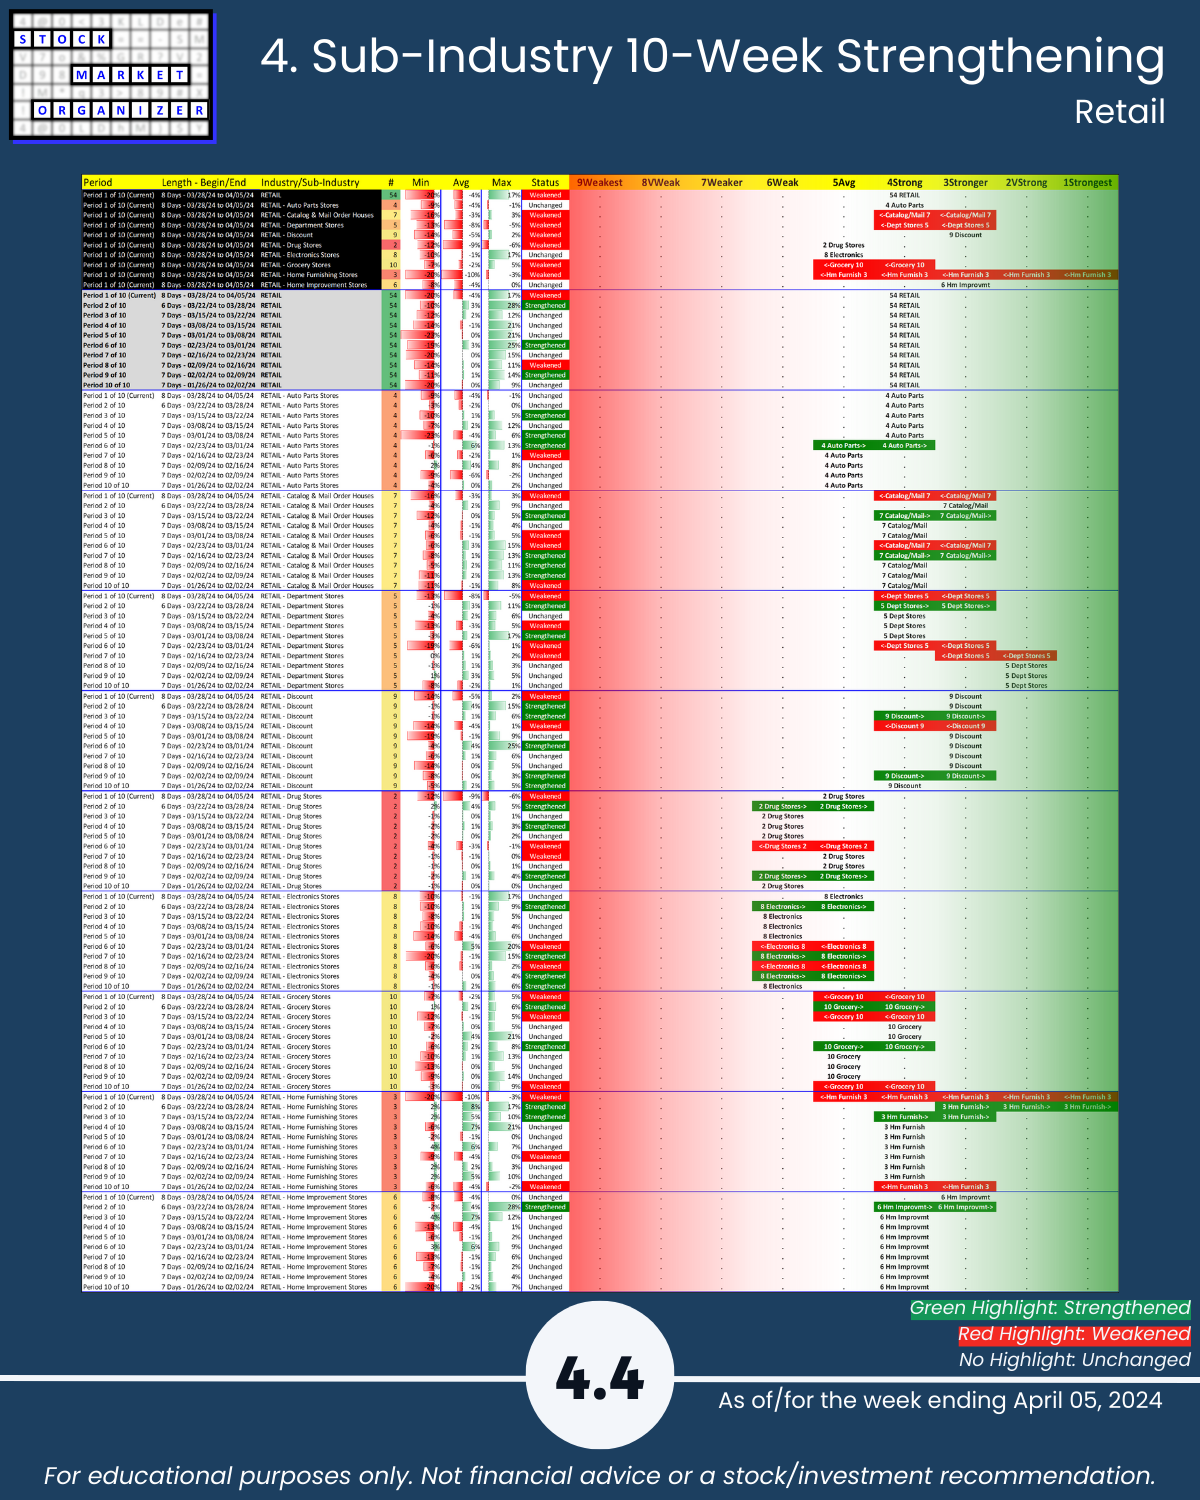
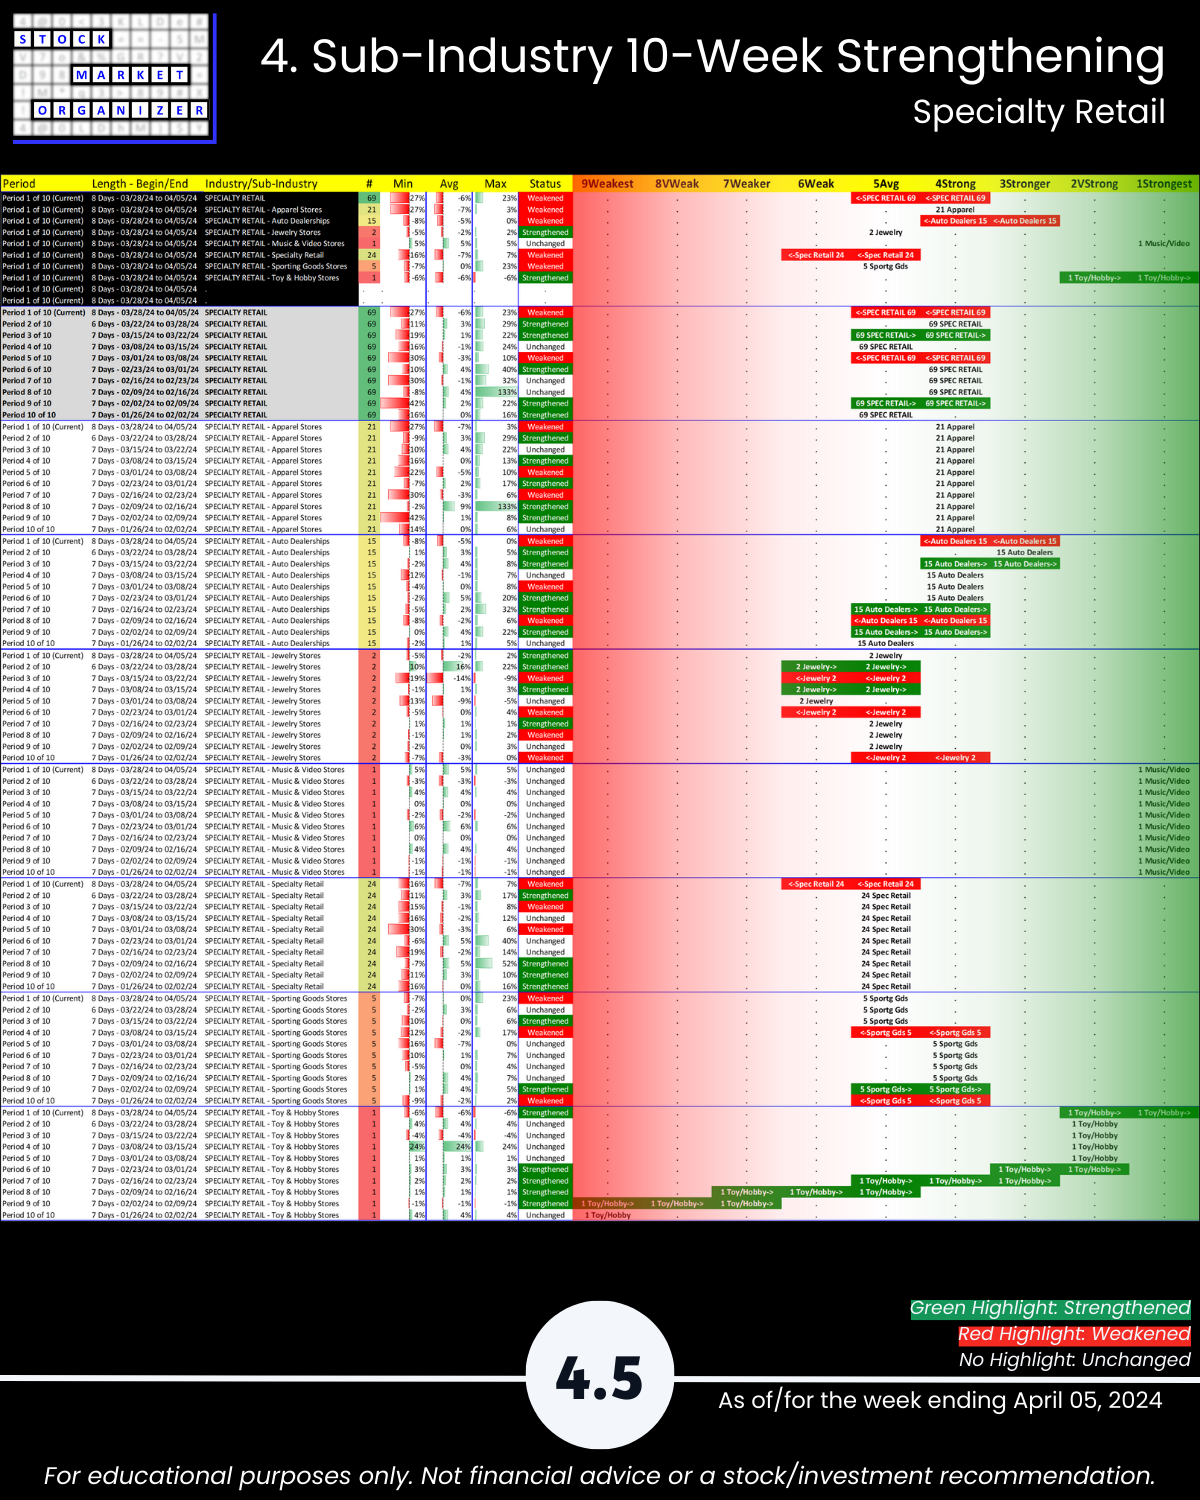
🔹 Sub-industries (41):
- 2% Strengthened, 46% Weakened
- Strongest: Discount Stores, Food/Major Diversified, Paper Products (3Stronger)
- Weakest: Confectioners (8VWeak)
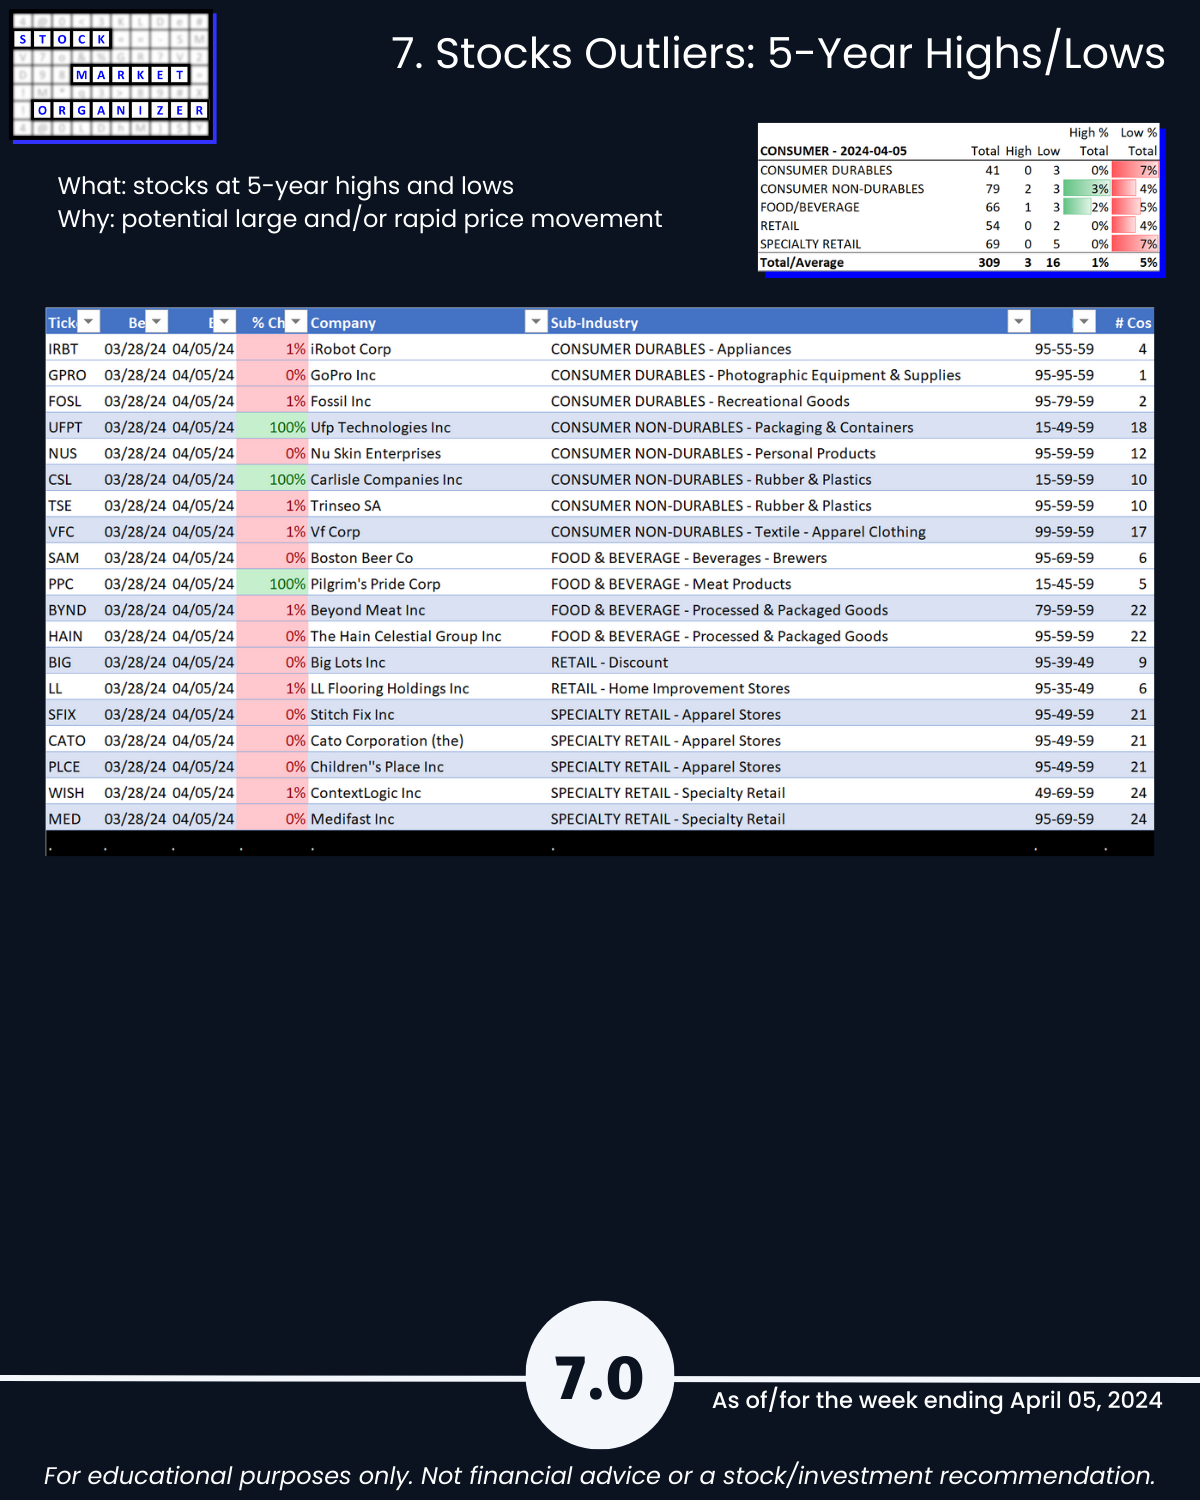
- @ 5 Year+ Highs/Lows: No outliers
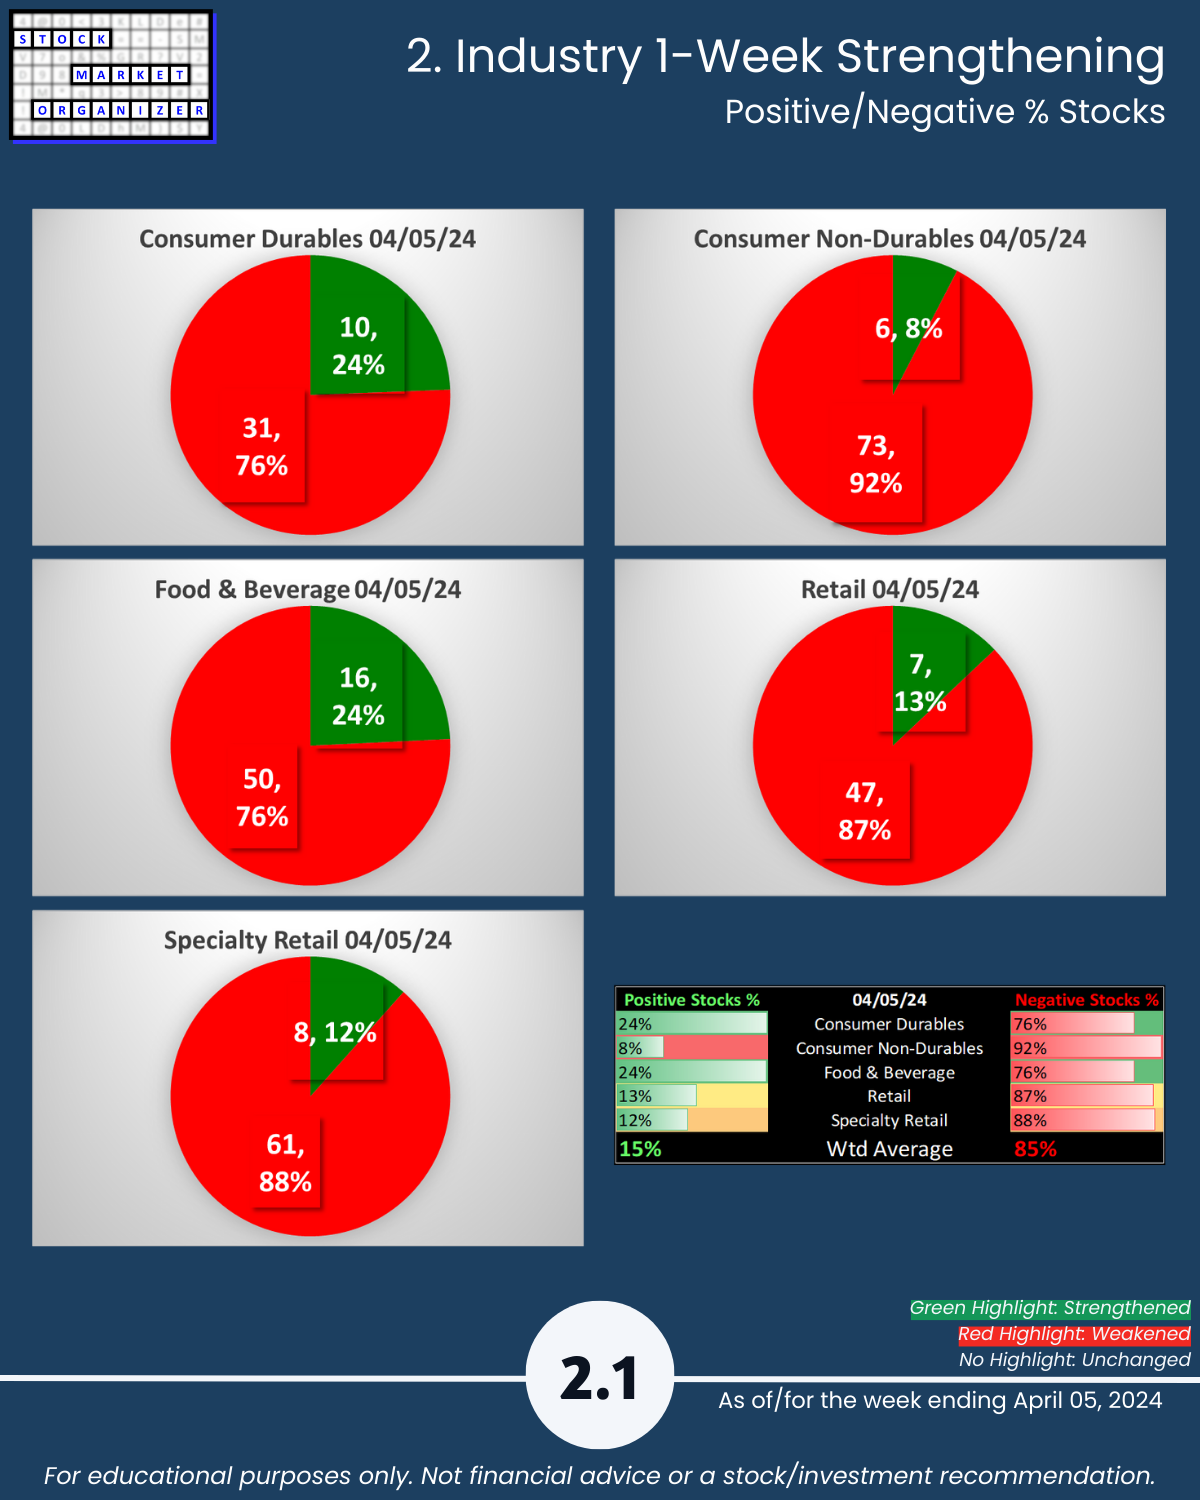
🔹 Stocks
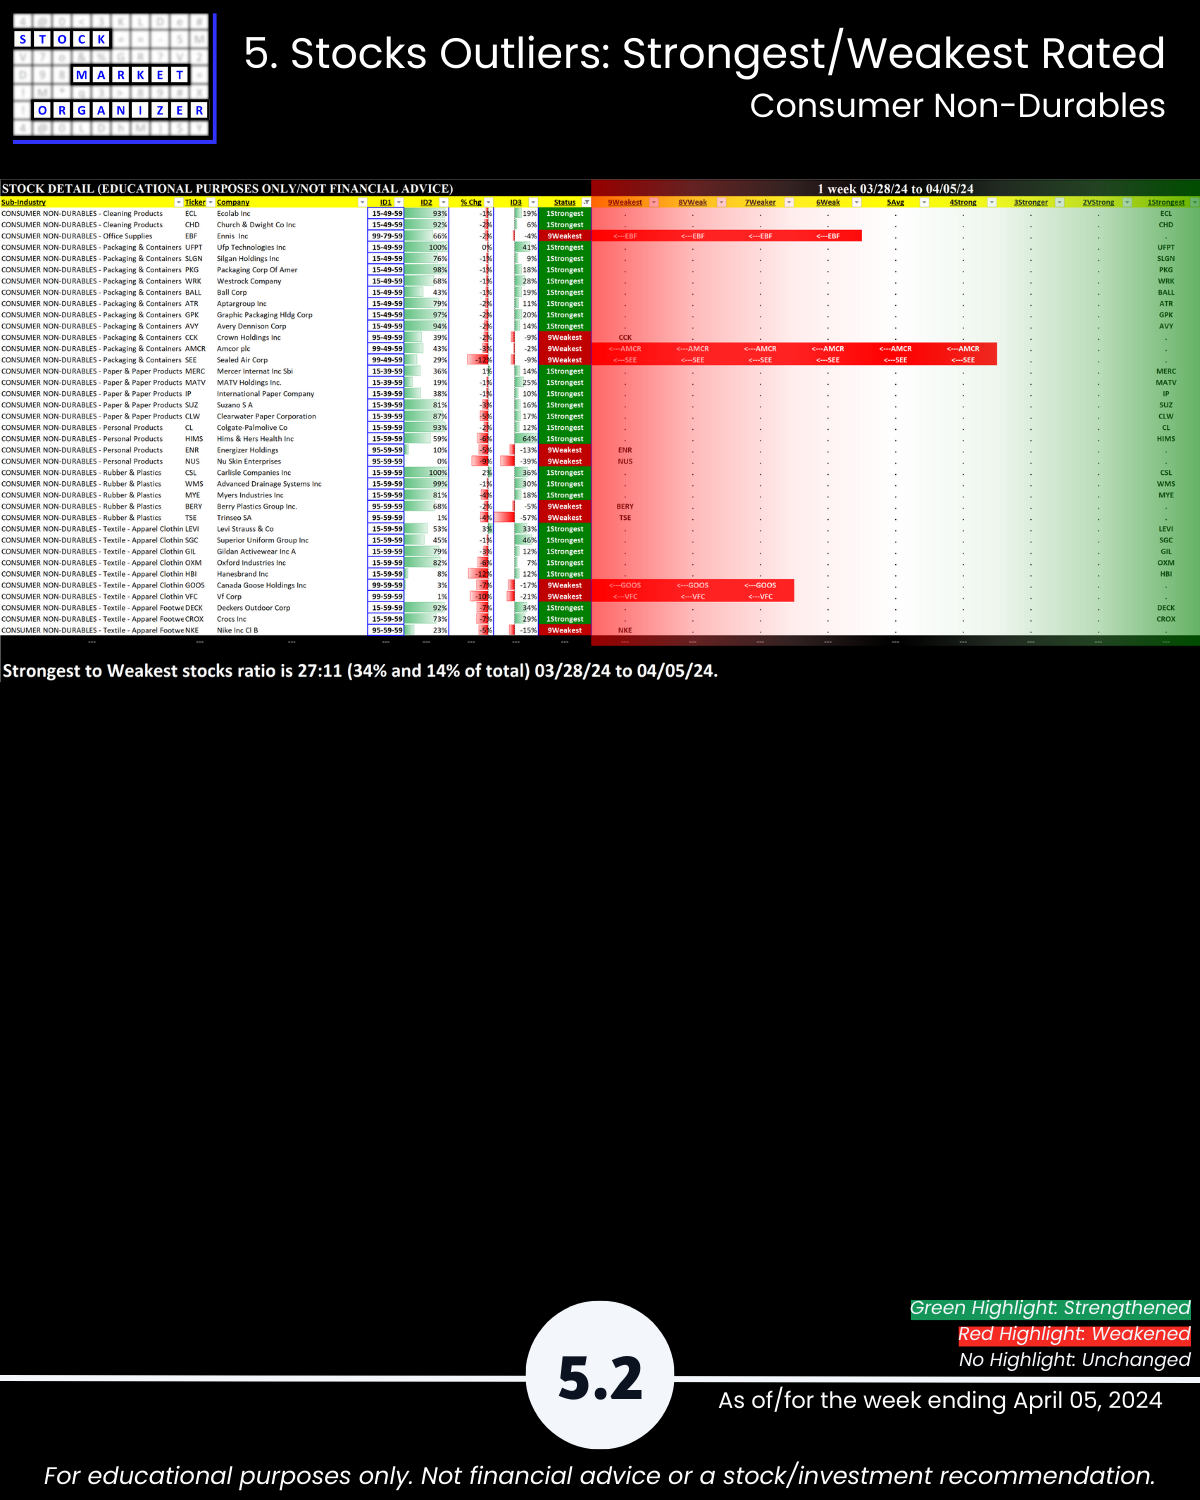
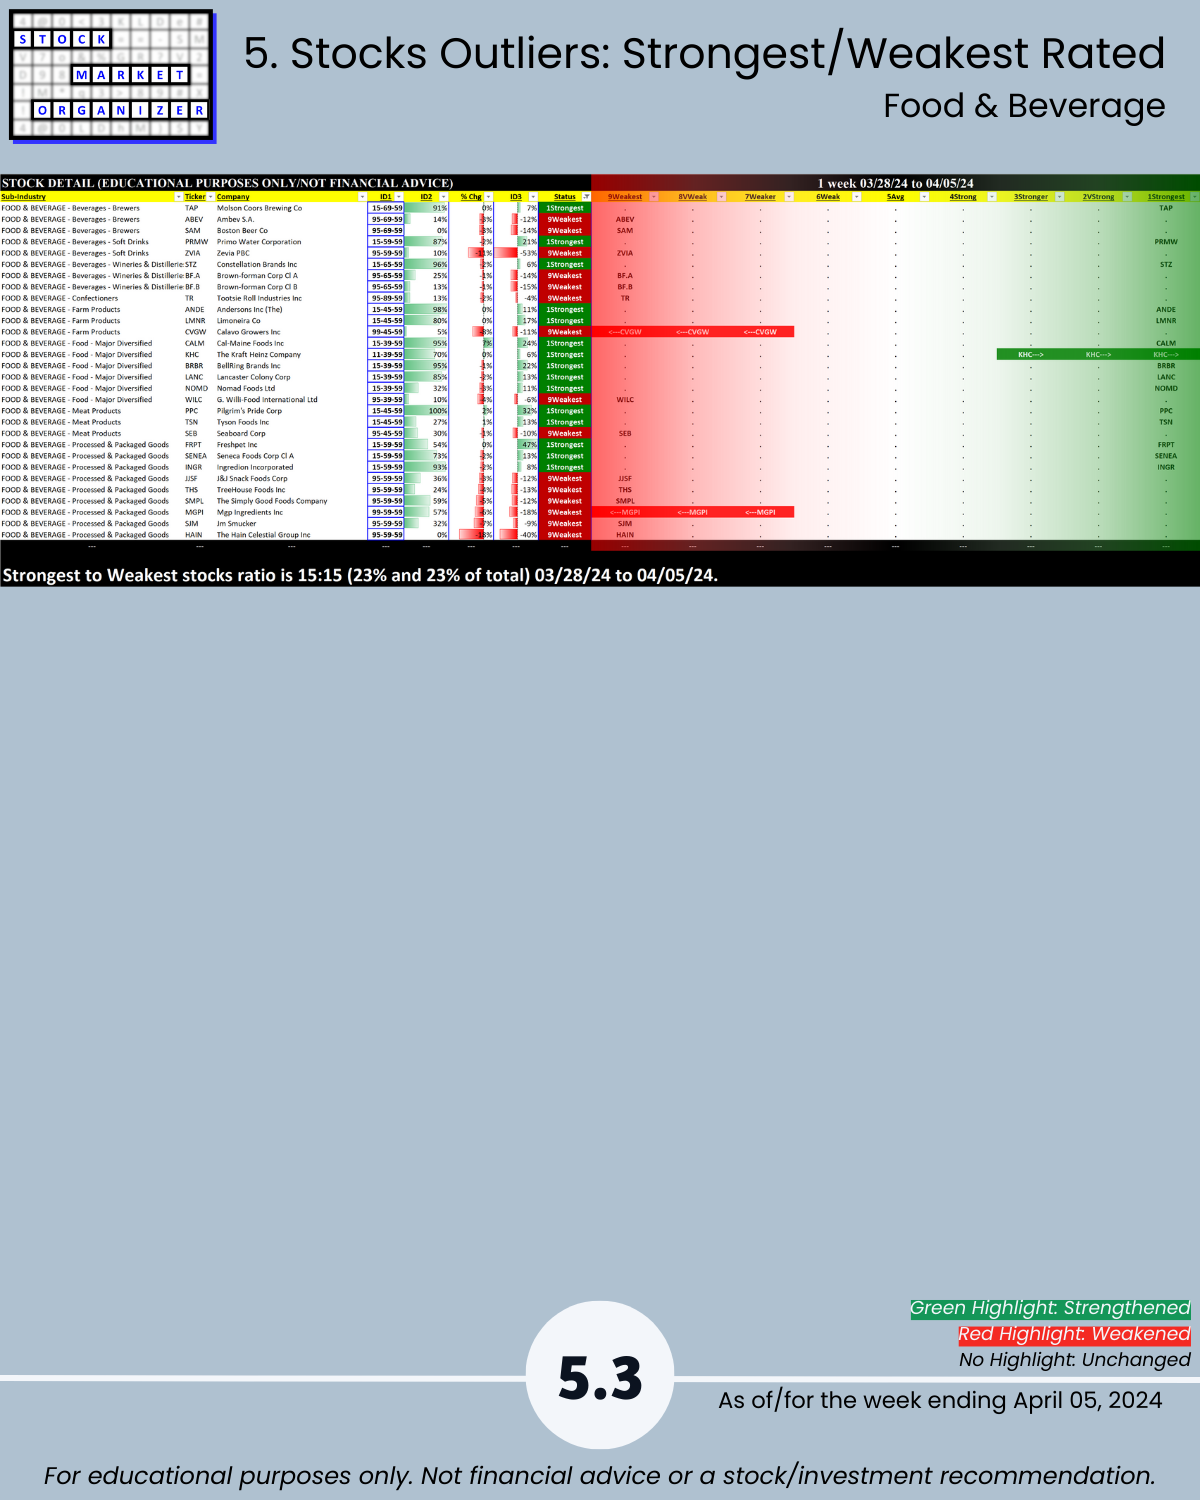
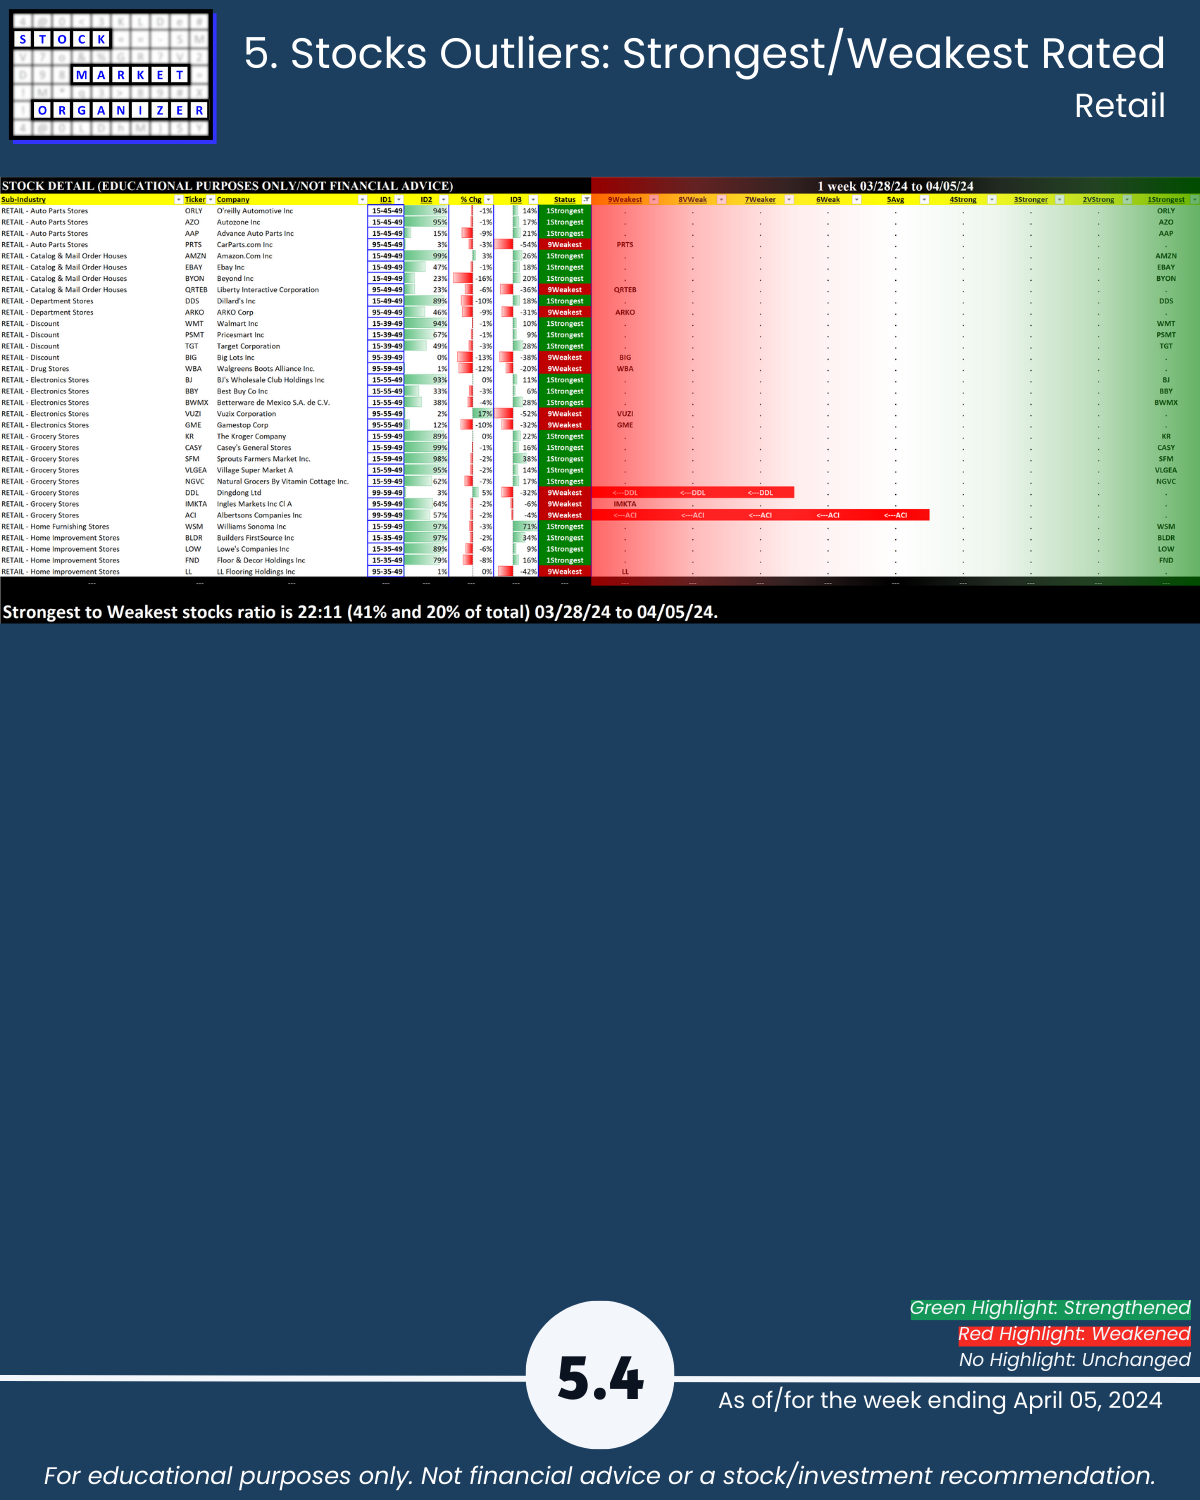
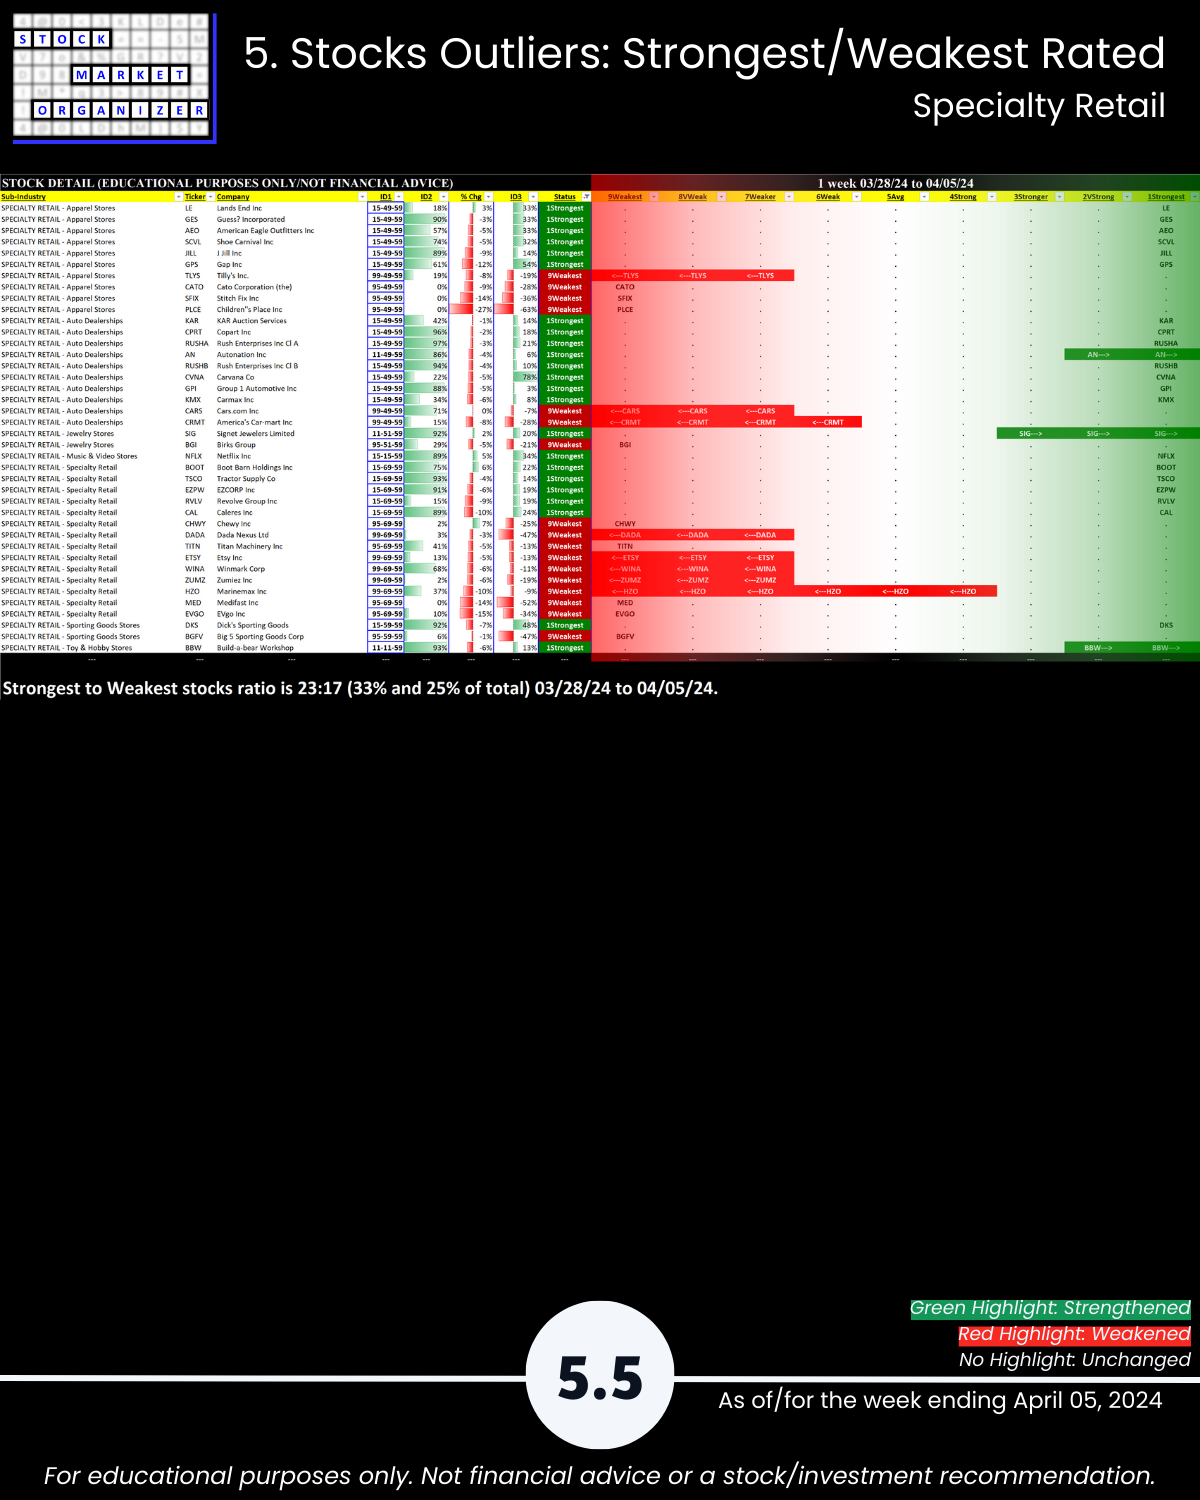
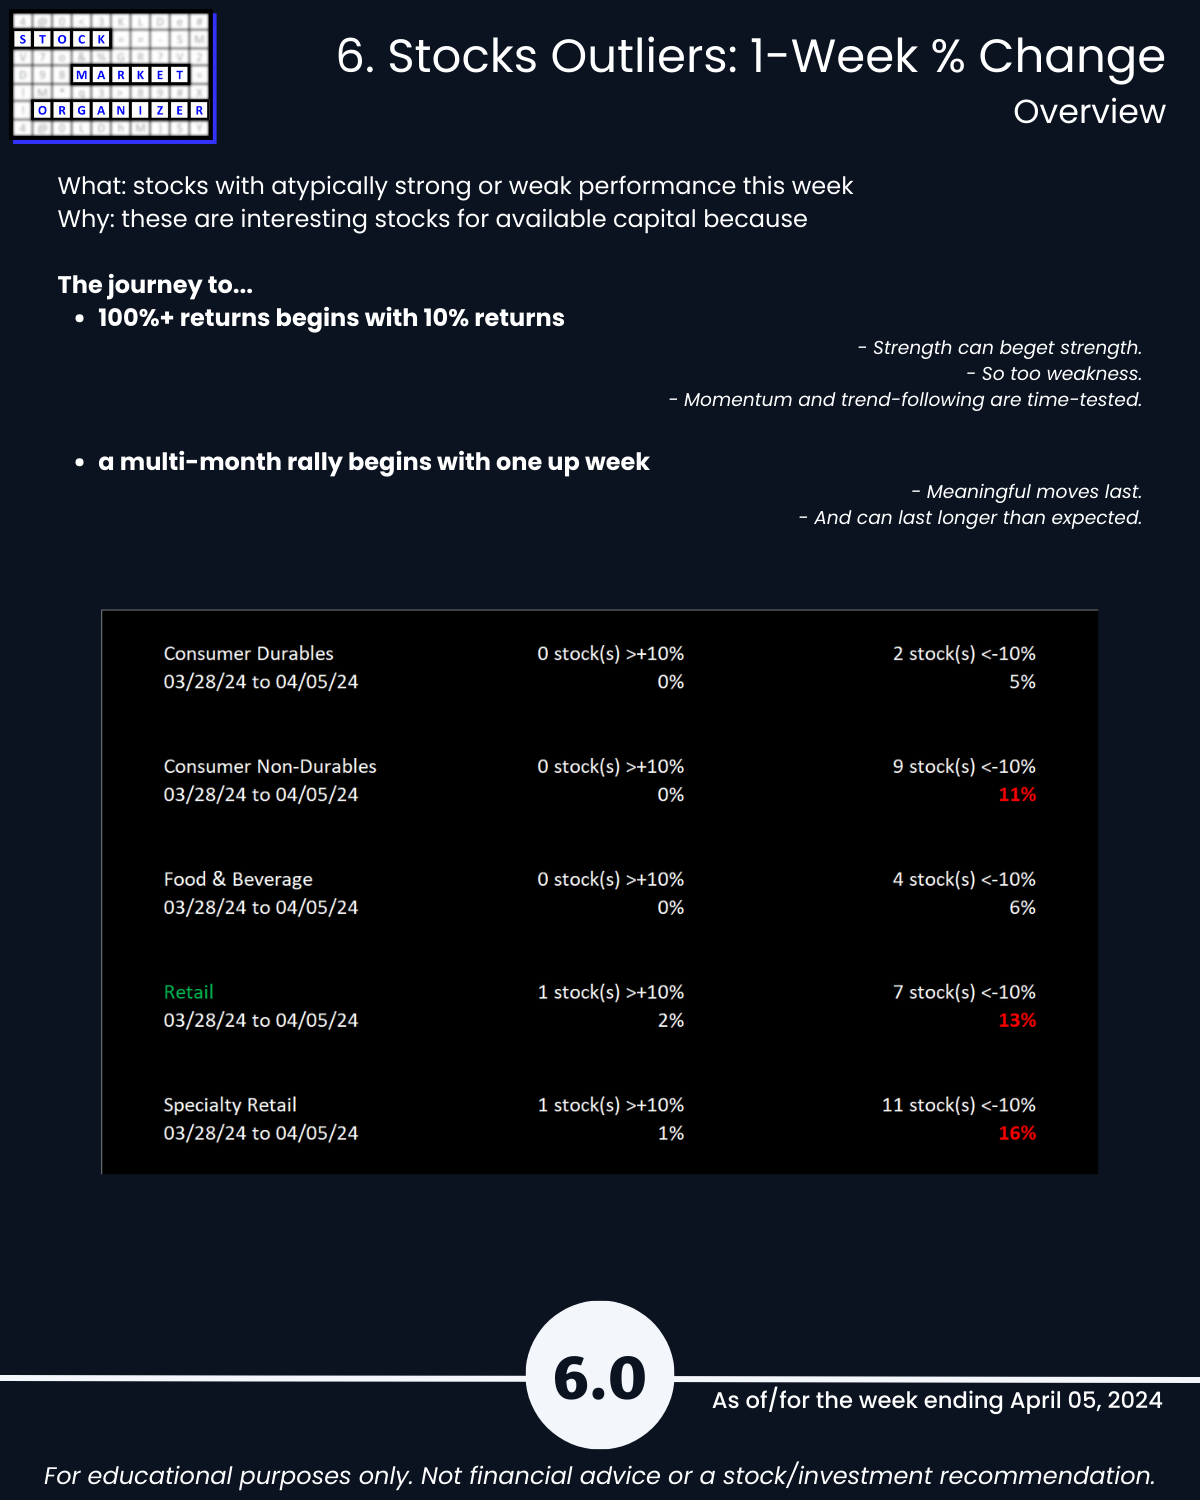
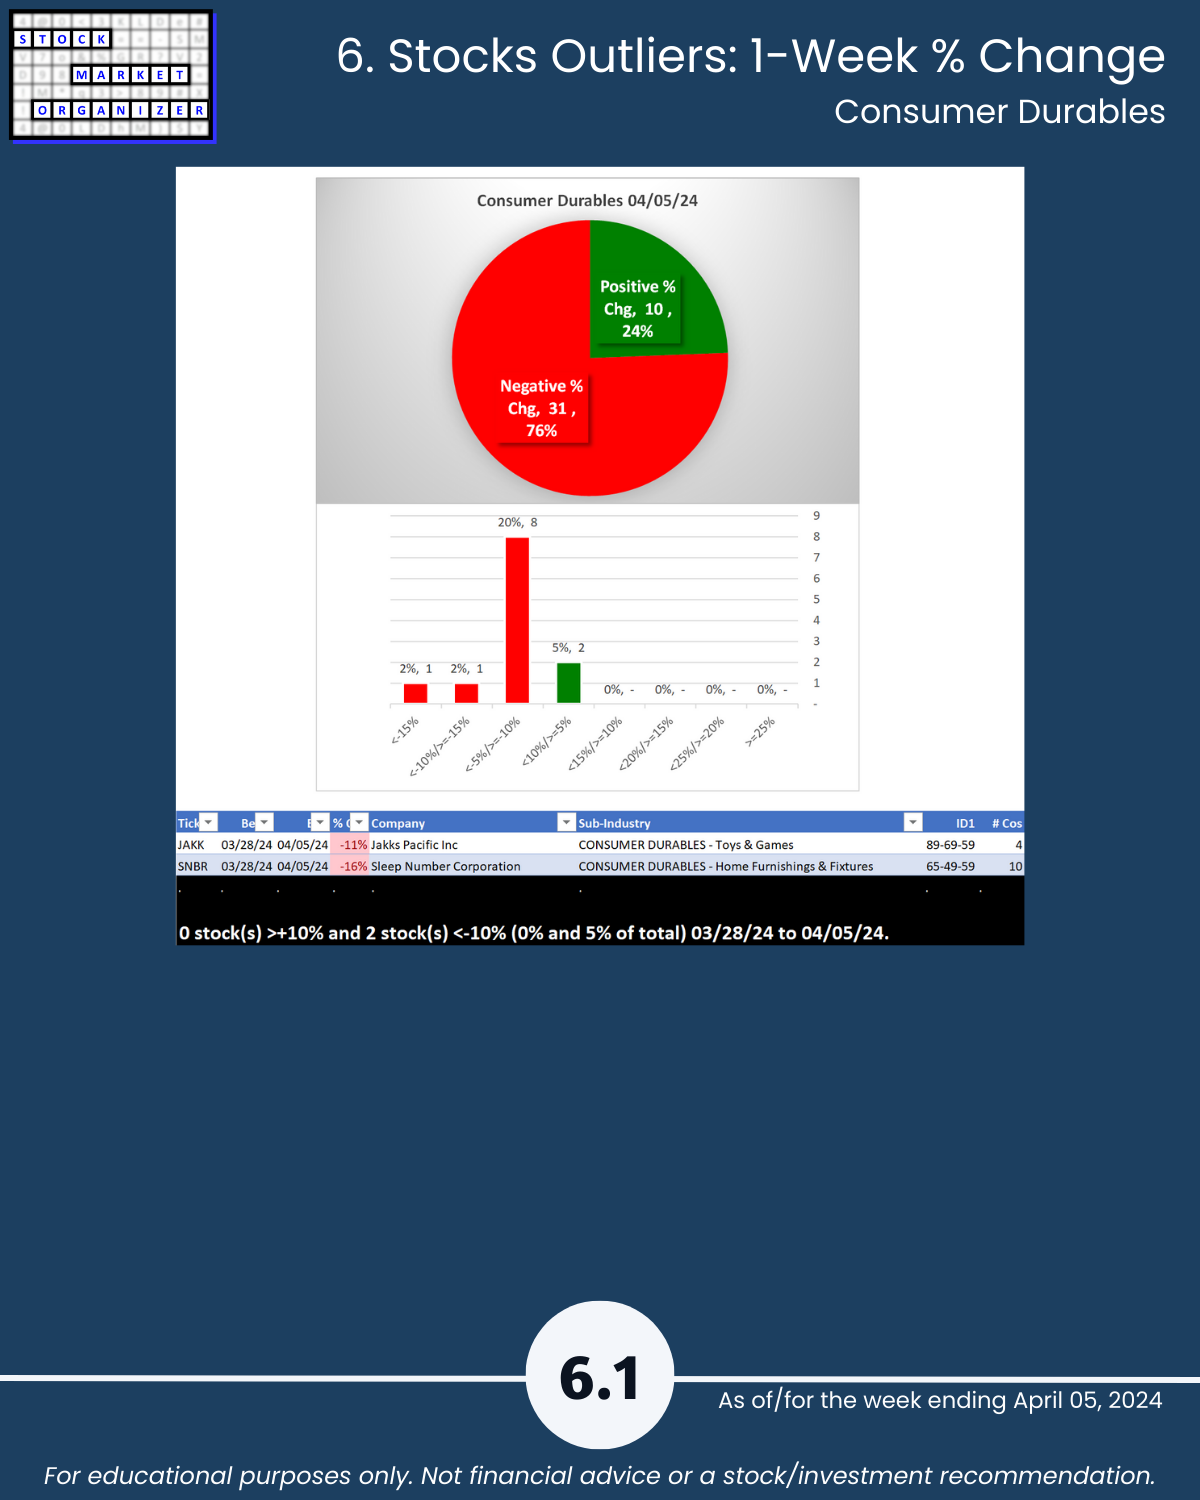
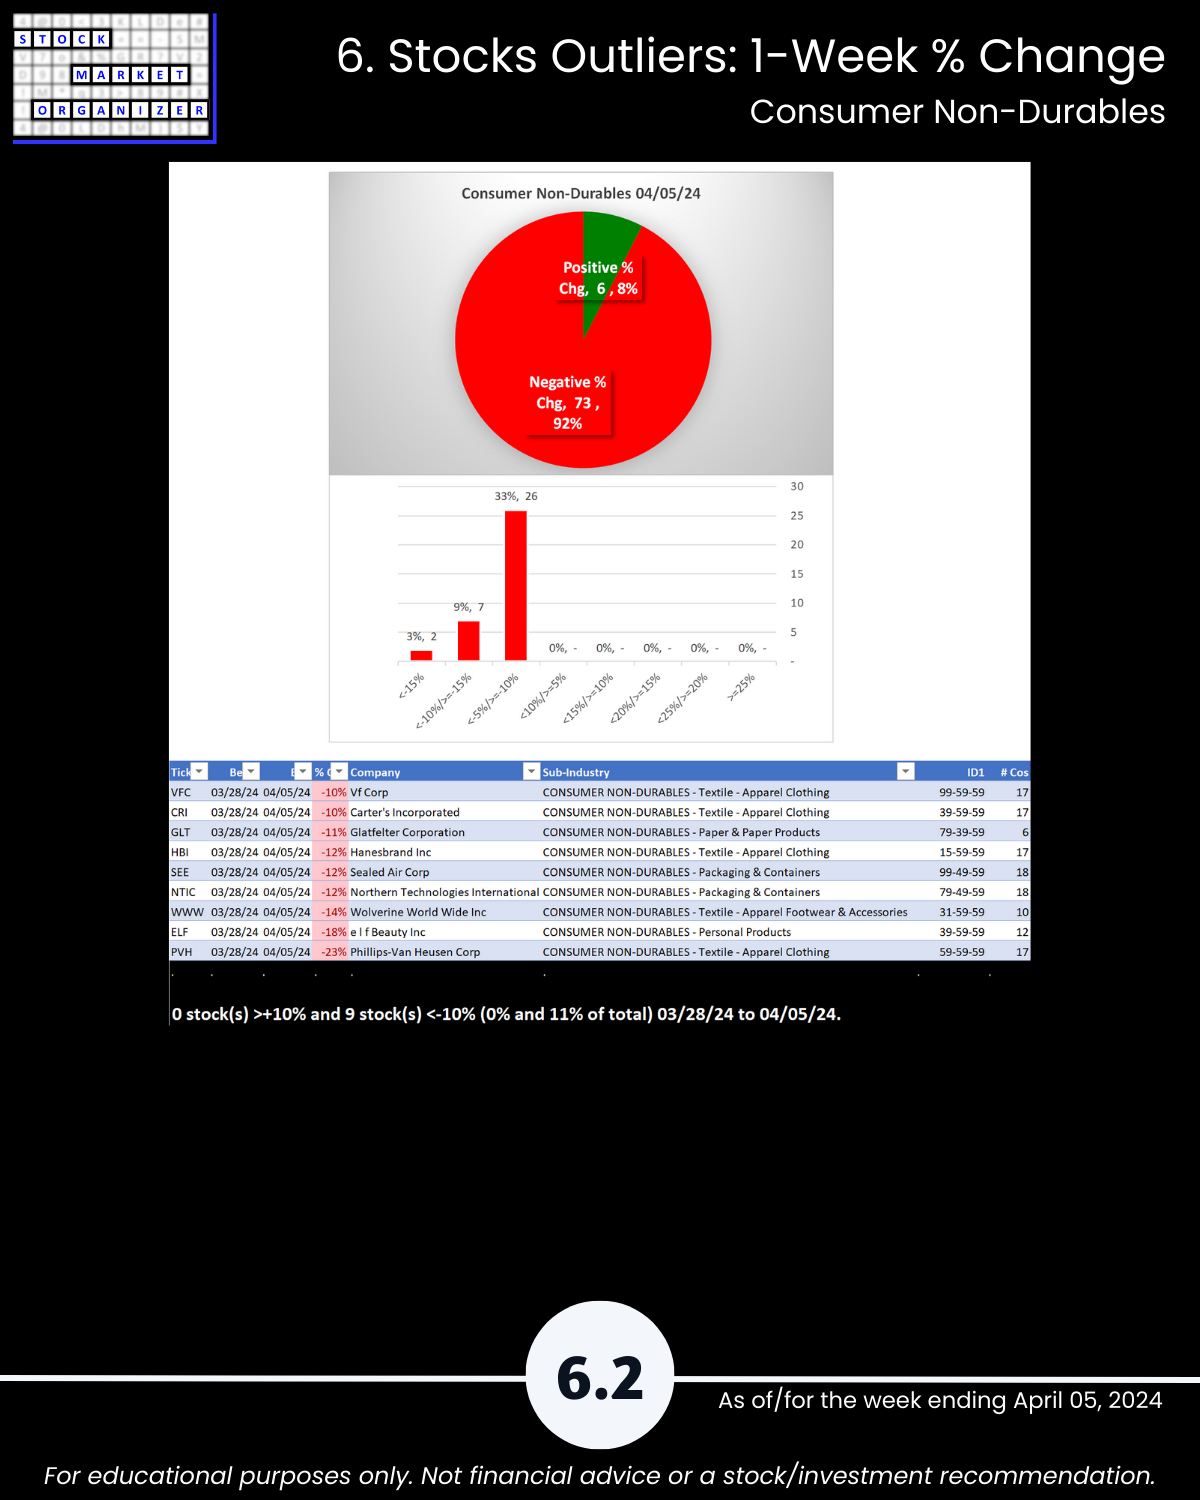
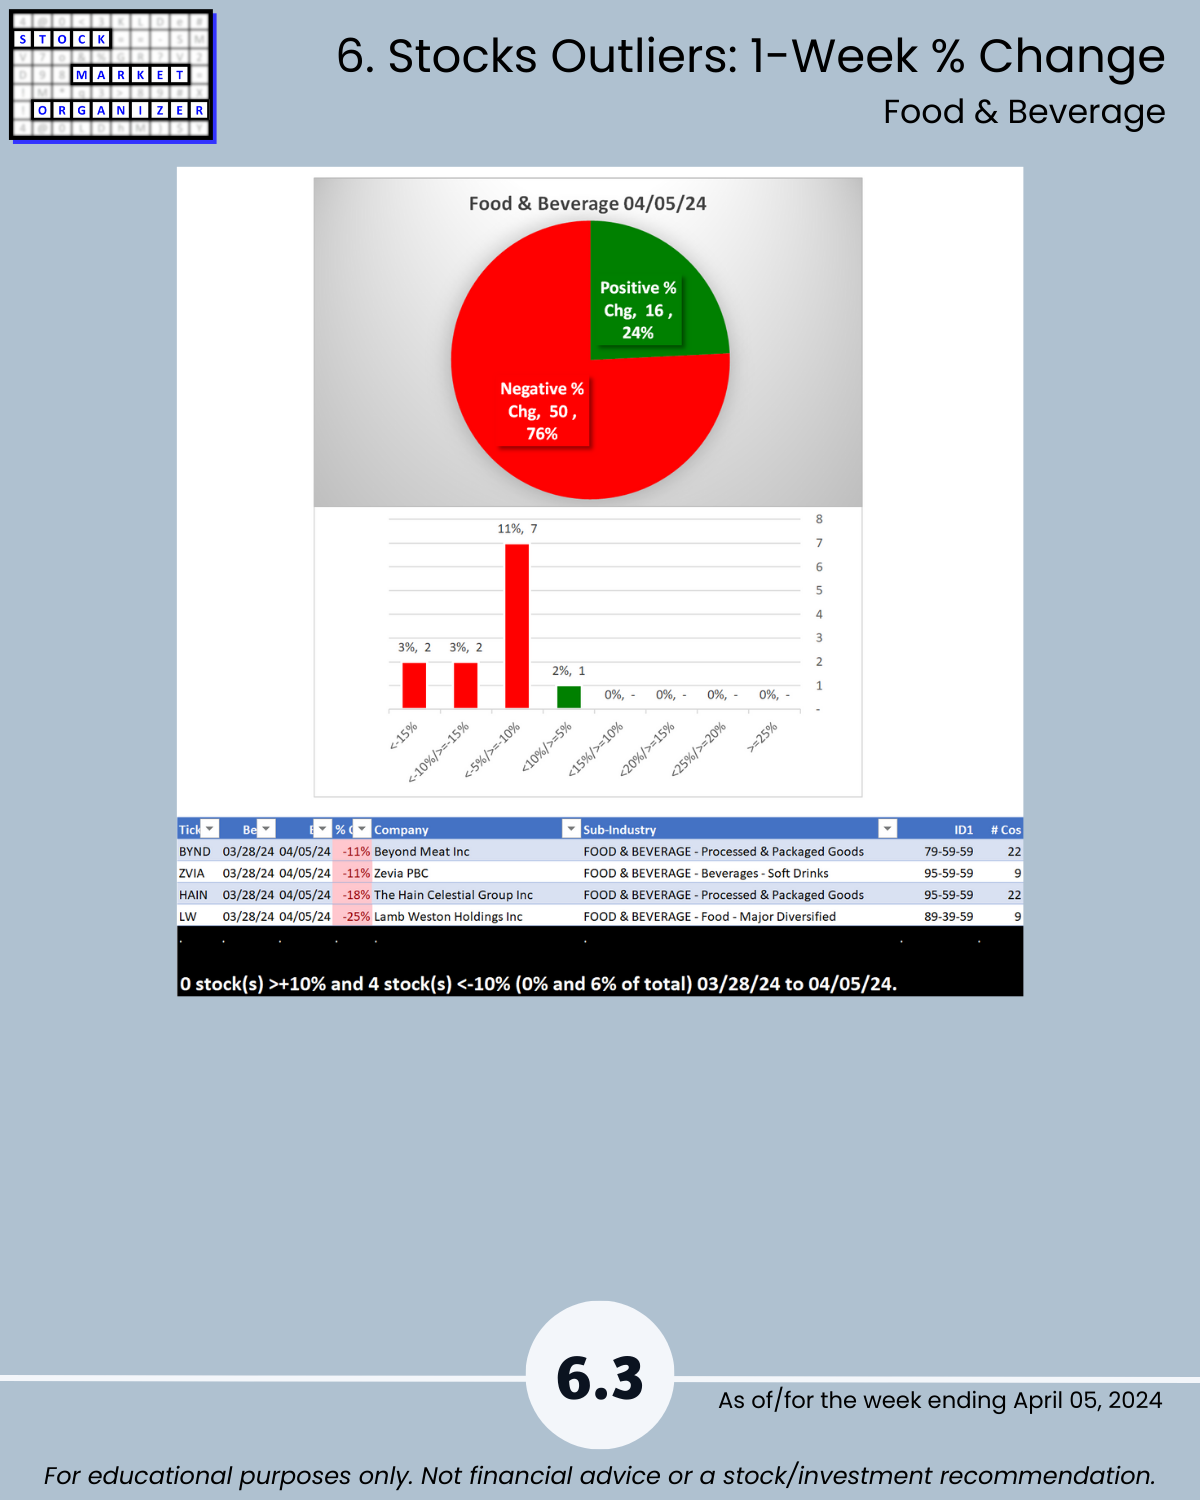
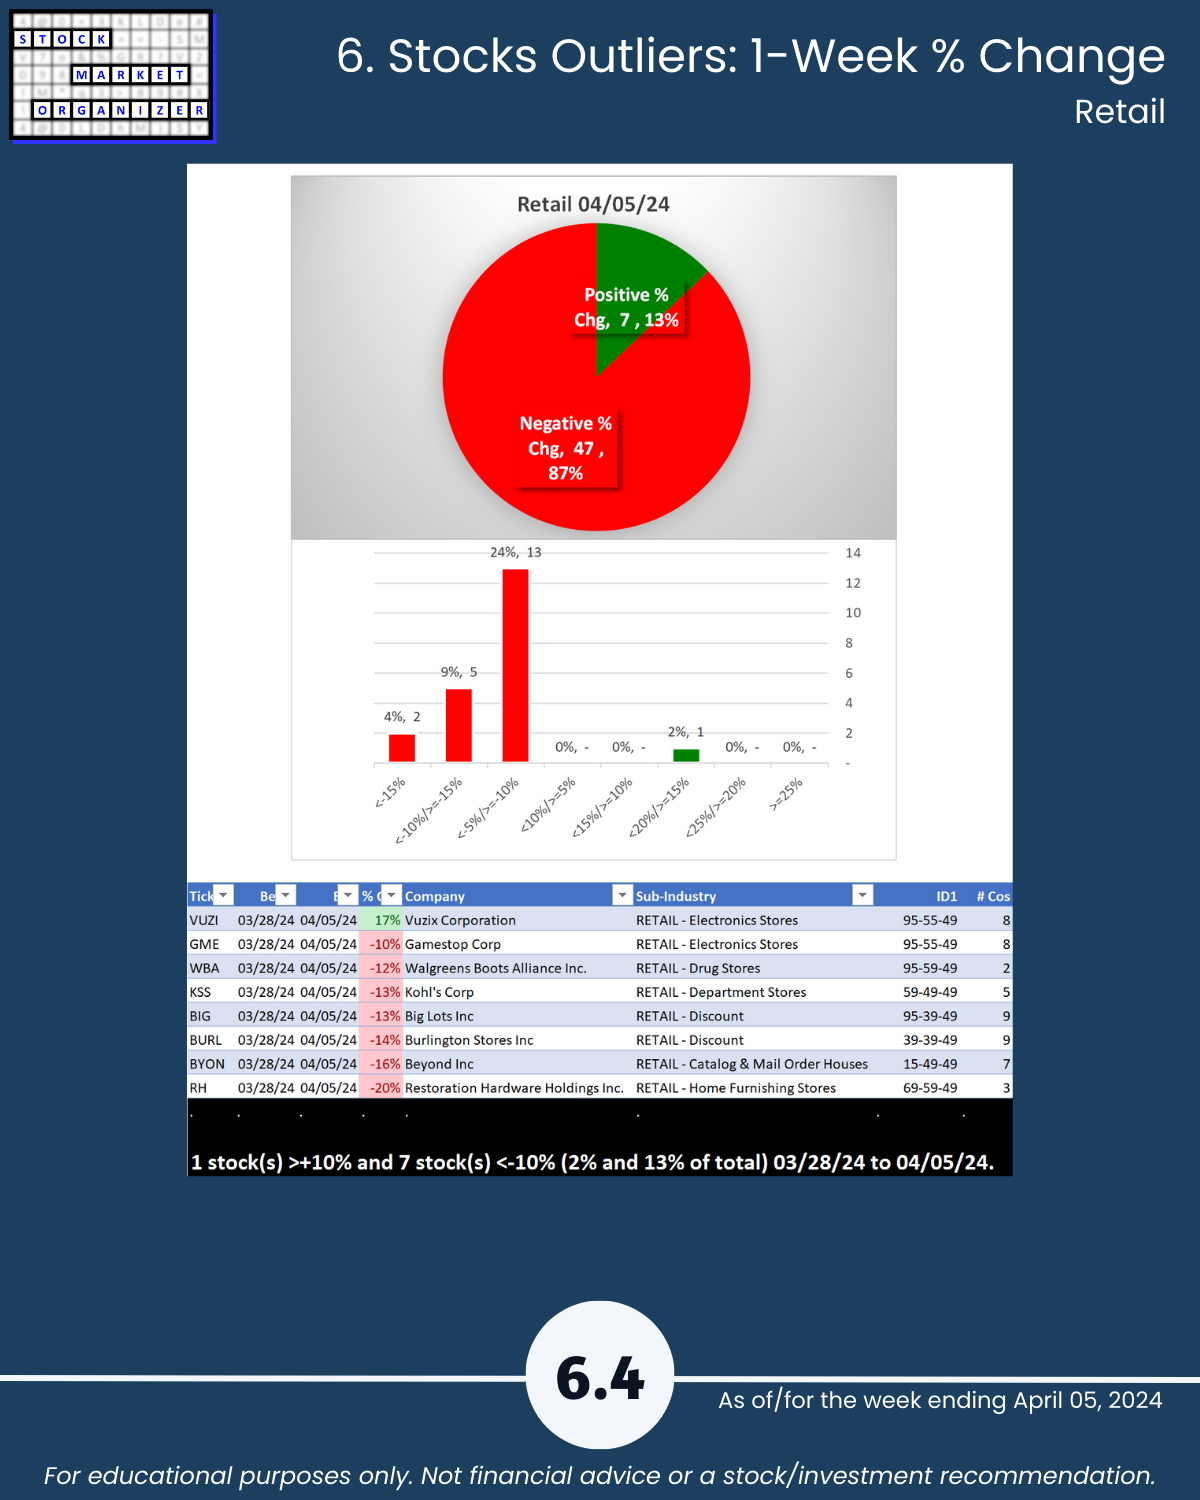
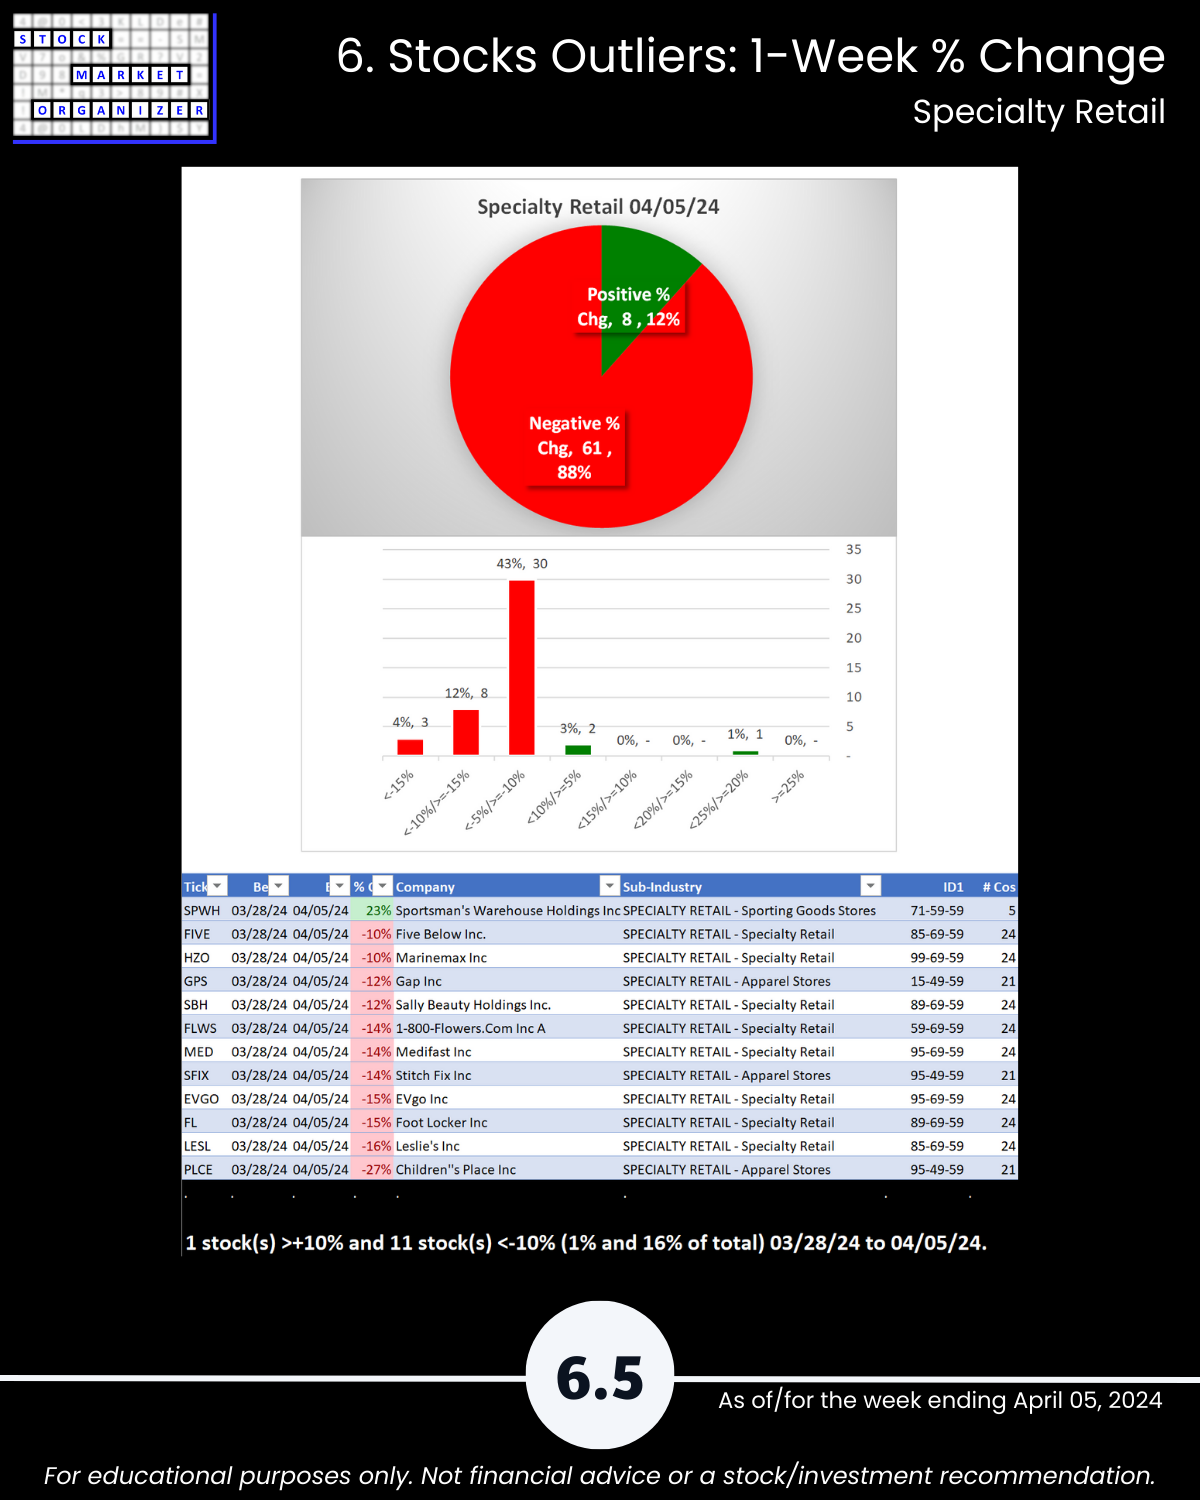
- Positive:Negative: Industry average 15%/85%; Cons Durables 76%, Consumer Non-Durables 92%, Food & Beverage 76%, Retail 87%, Specialty Retail 88% negative
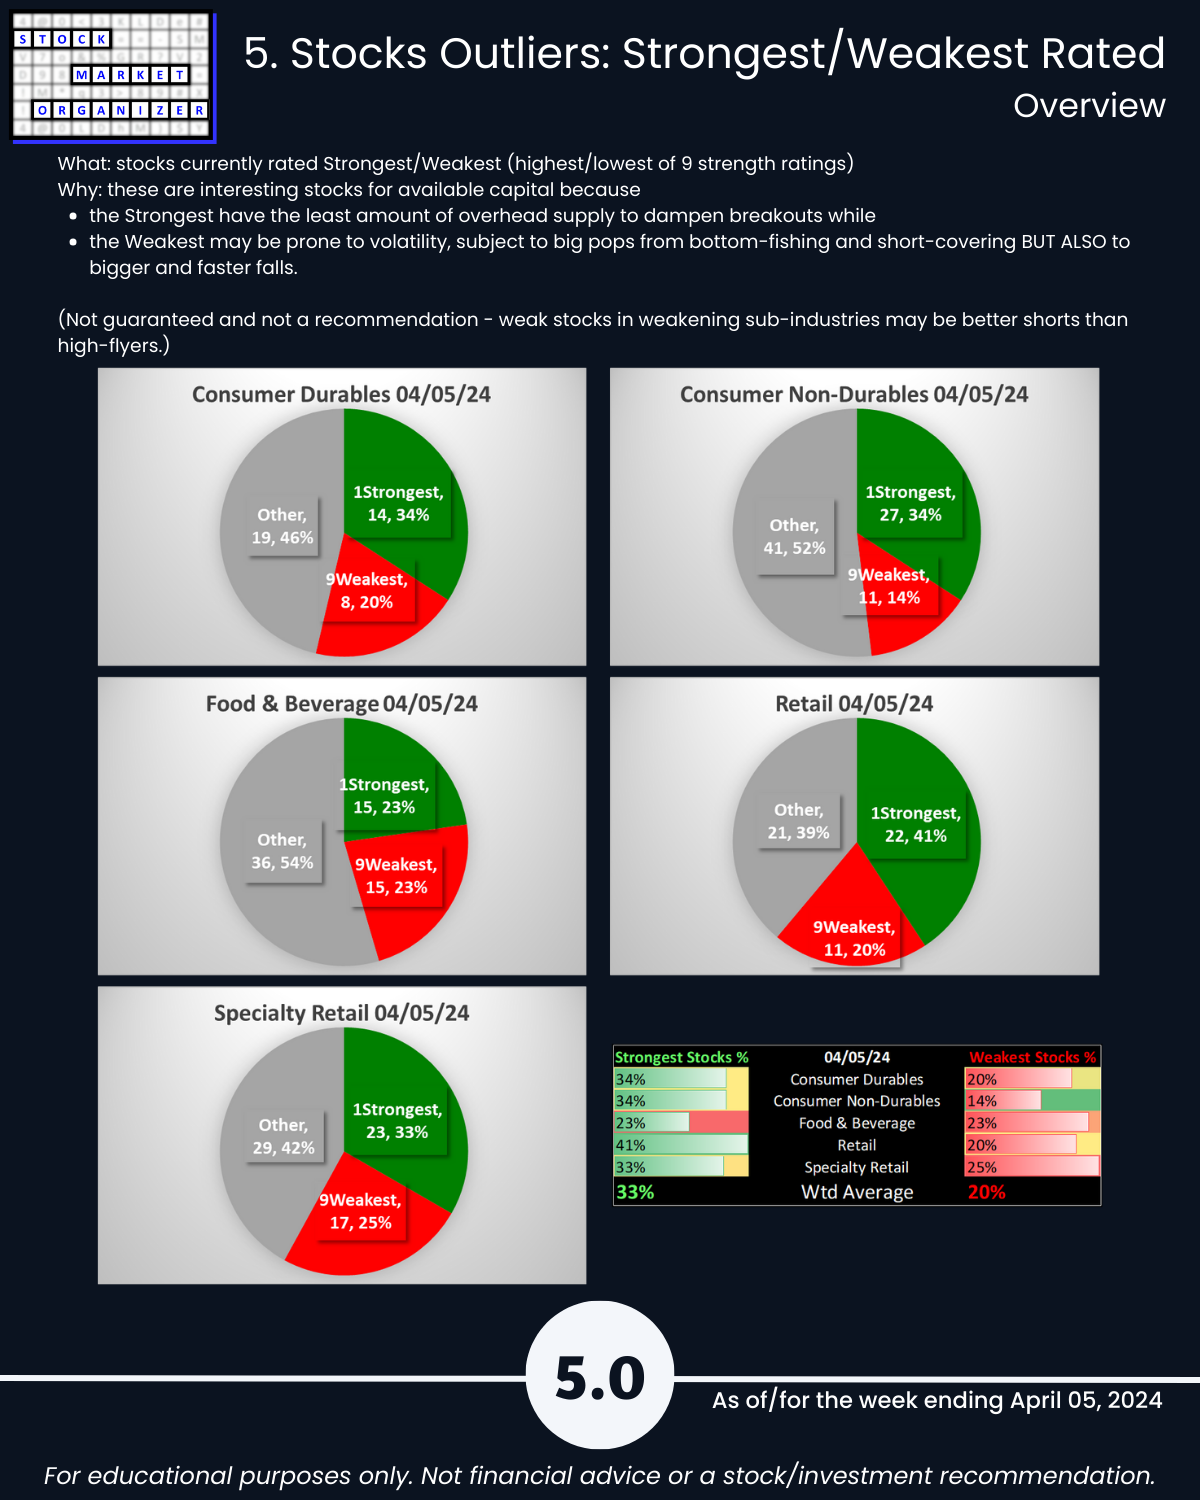
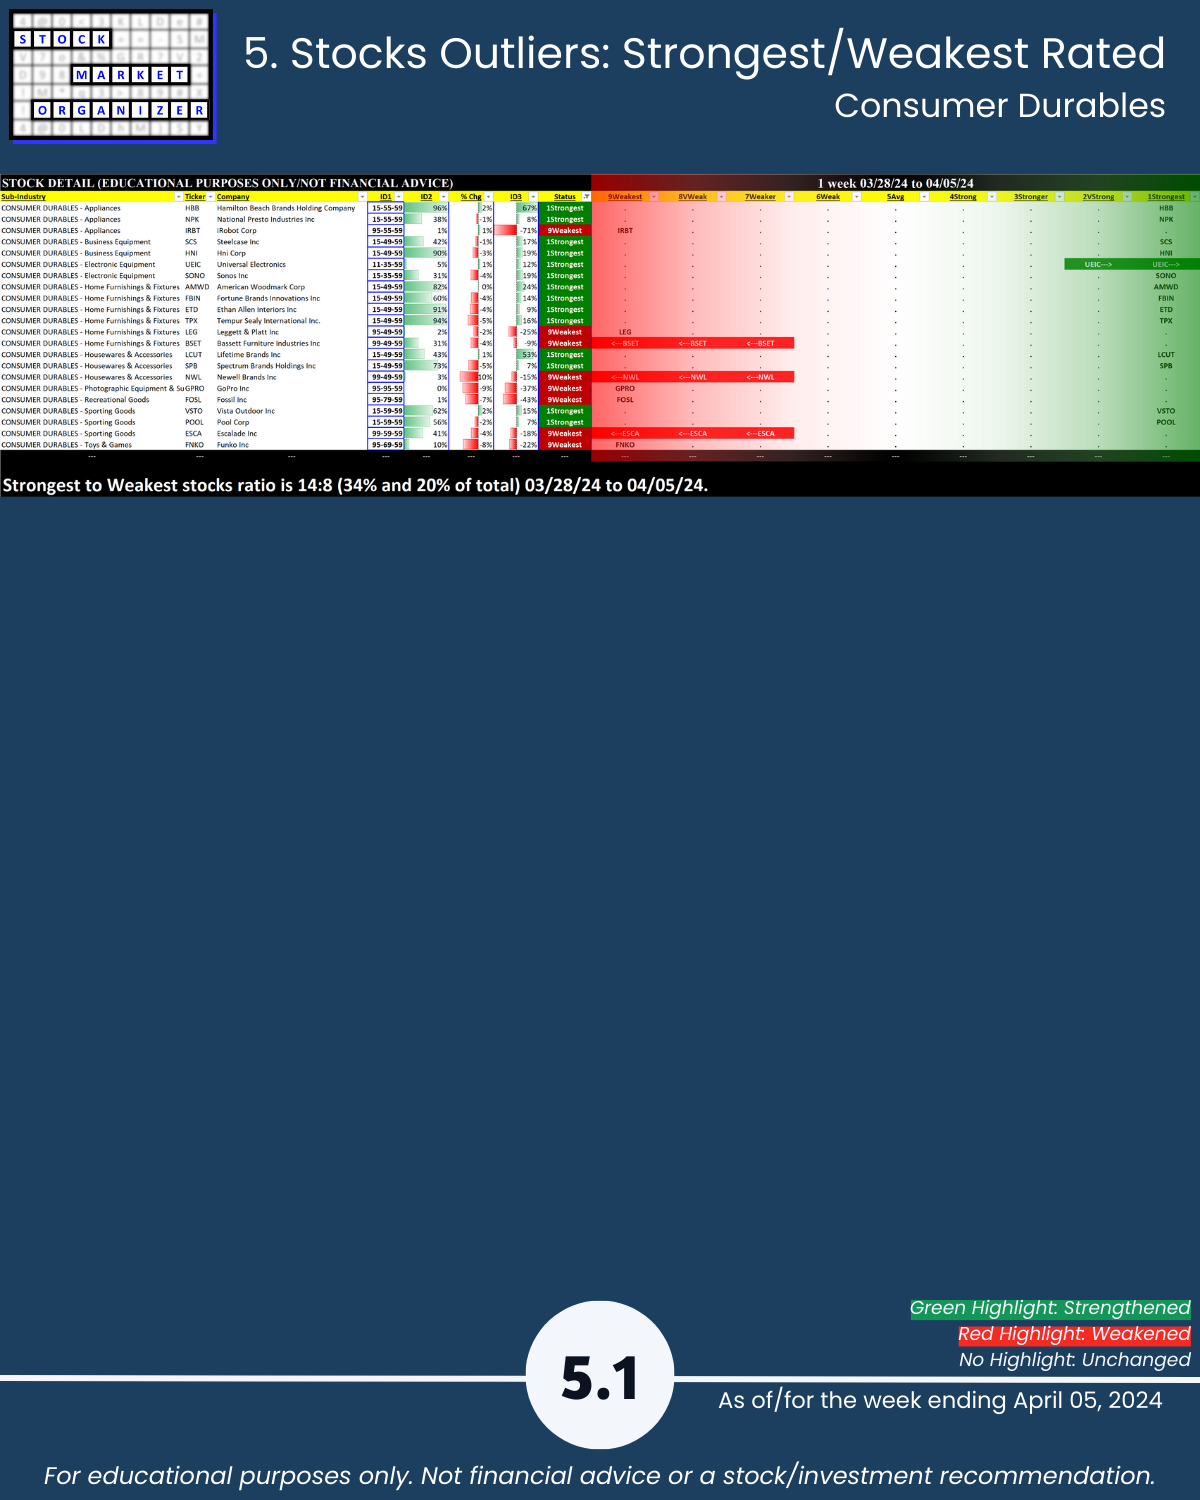
- Strongest:Weakest: Industry average 33%/20%; Consumer Durables 34%:20%, Retail 41%:20% of total
- Outlier Stocks: PVH -23%, LW -25%, RH -20%, SPWH +23%, PLCE -27%
- Stocks falling more than -10%: Consumer Non-Durables 11%, Retail 13%, Specialty Retail 16%
WHAT’S HAPPENING HERE?
I am…
Finding U.S. Stock Market strength from the
top down,
inside out,
and bottom up, because
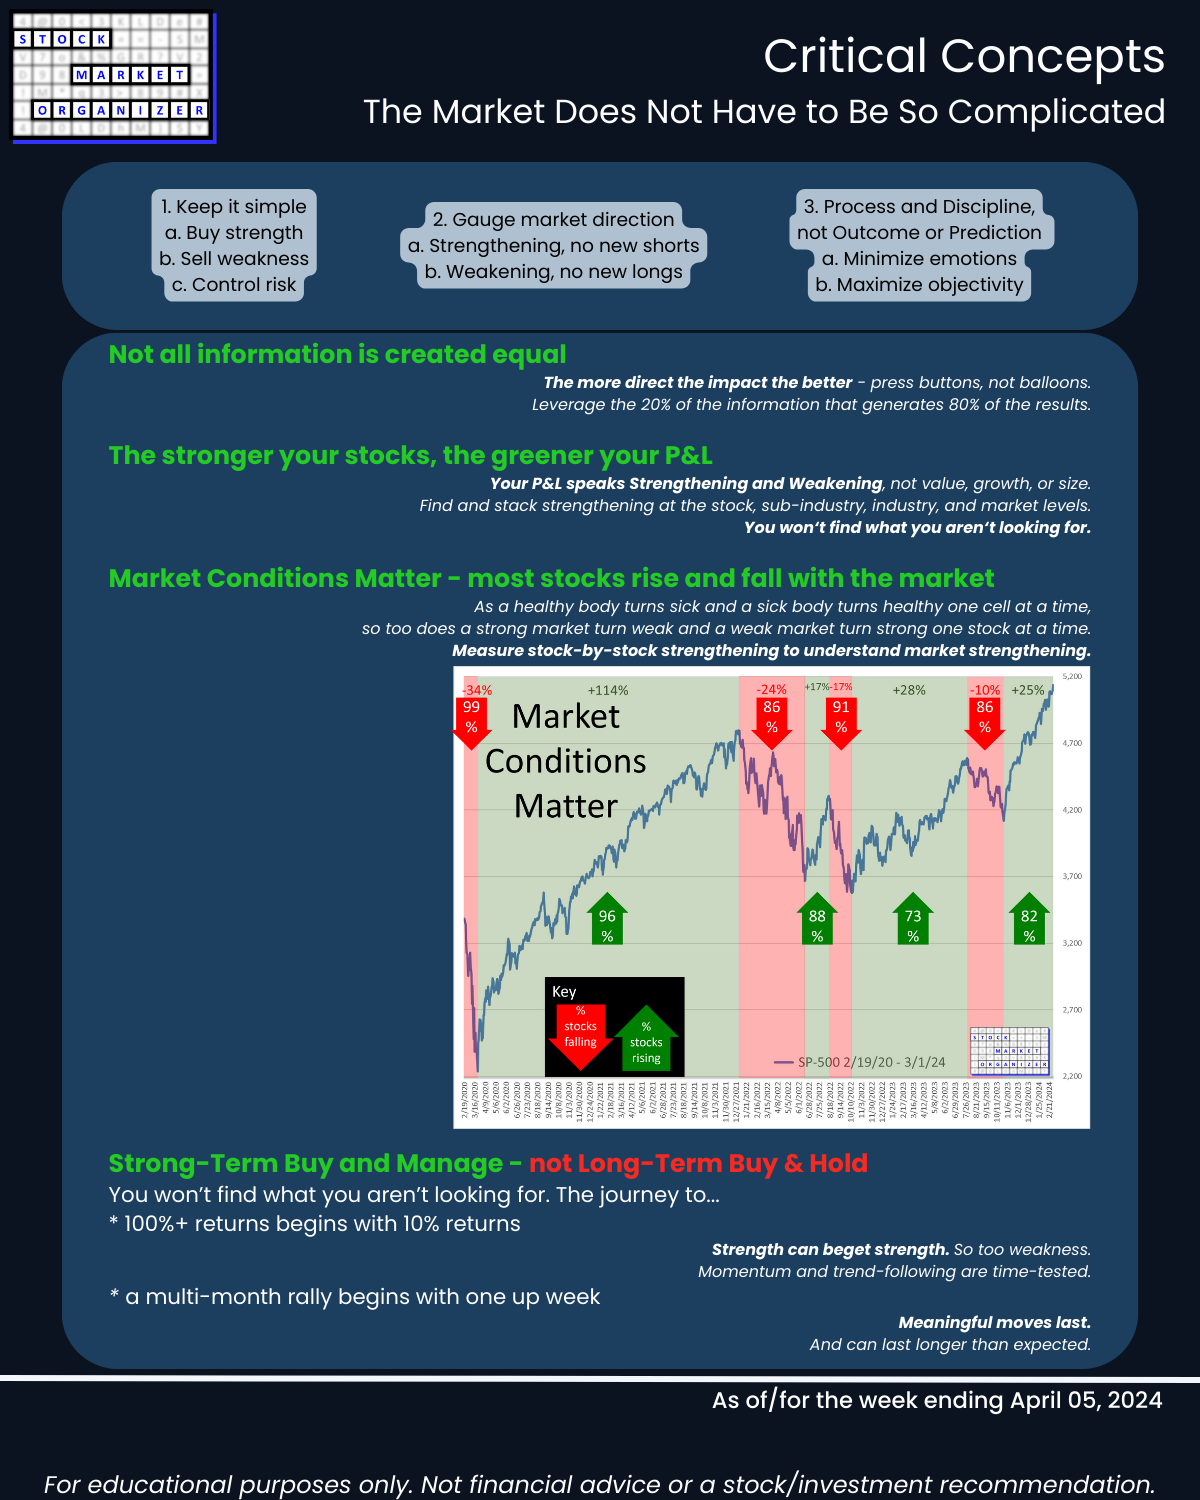
the stronger your stocks, the greener your P&L.
THE “WHY” BEHIND THIS METHOD (SEEKING STRENGTH MARKETWIDE)
The stronger your stocks the greener your P&L.
The journey to 100%+ returns begins with 10% returns.
The journey to multi-month rallies begins with one up week.
You won’t find what you aren’t looking for.
Look at any number of triple-digit gainers over the past year or less - obviously NVDA, certainly CVNA, SKYW, POWL, ANF, SMCI.
Each started with 10% gains.
Maybe 10% gainers keep going, and maybe they don’t.
But if you aren’t looking for them, and what might keep them rising (strengthening sub-industry, industry, and market), then you won’t find them.
The market does not have to be so complicated.
Following are galleries with page-by-page views of this report.
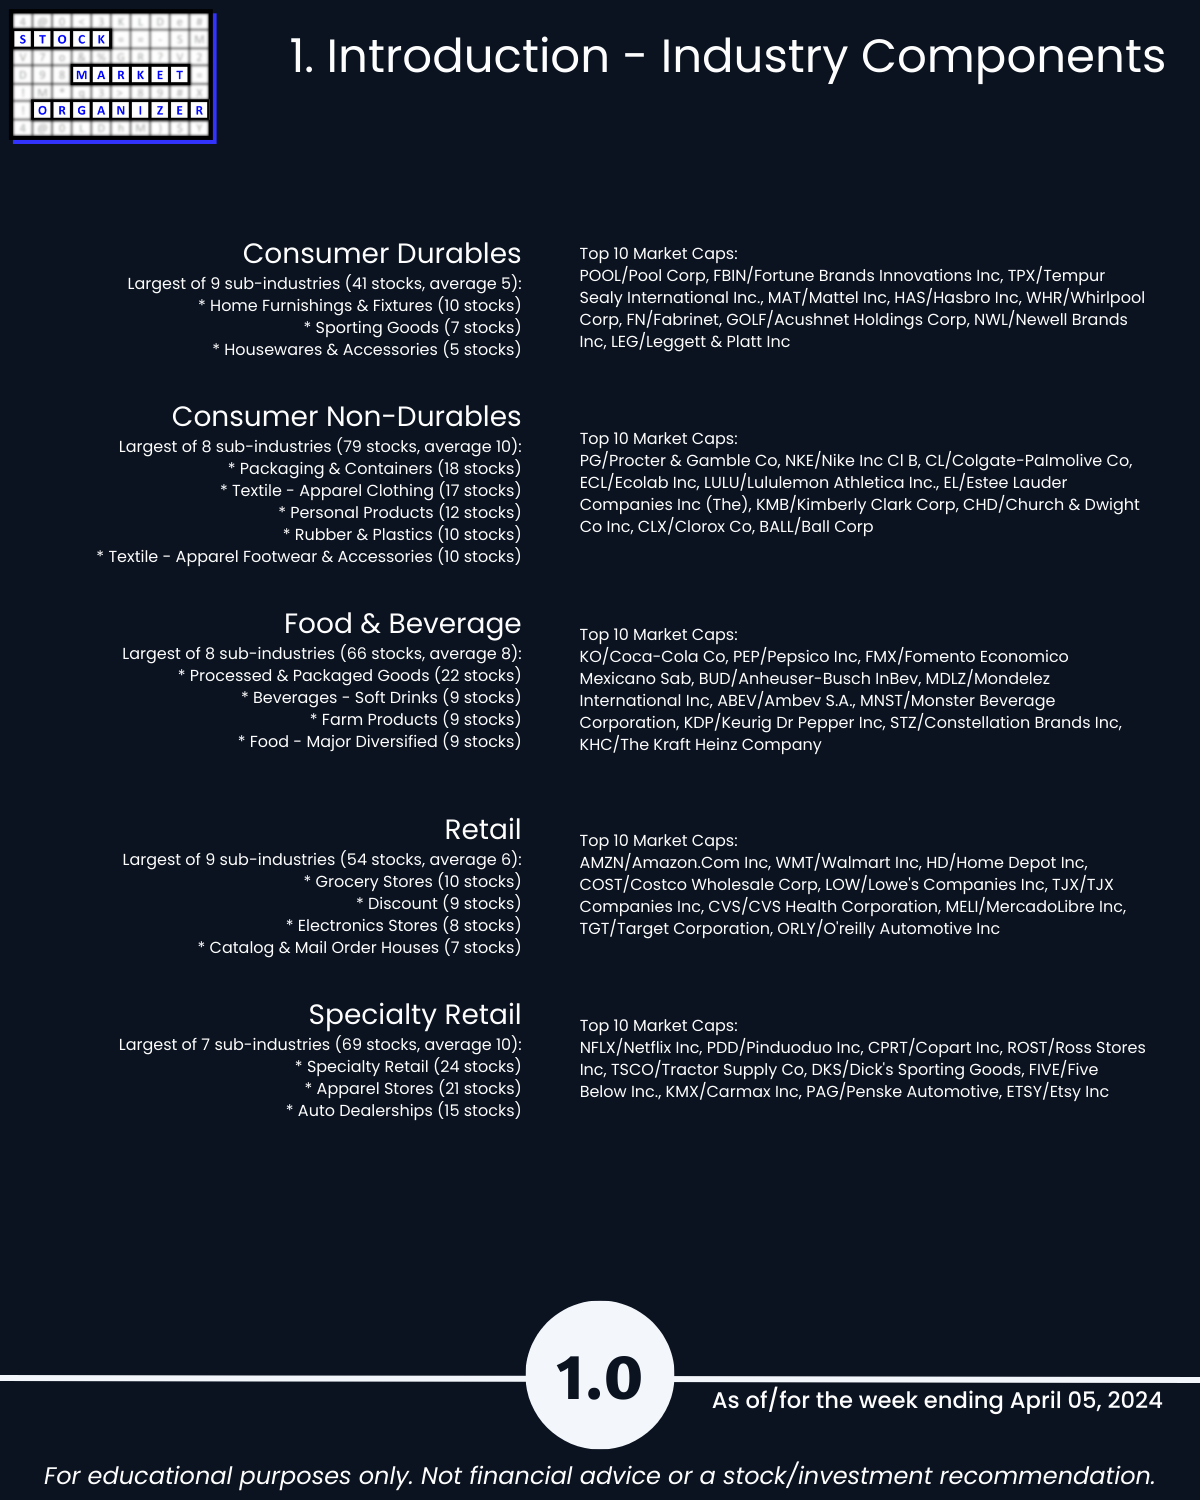
1. Introduction
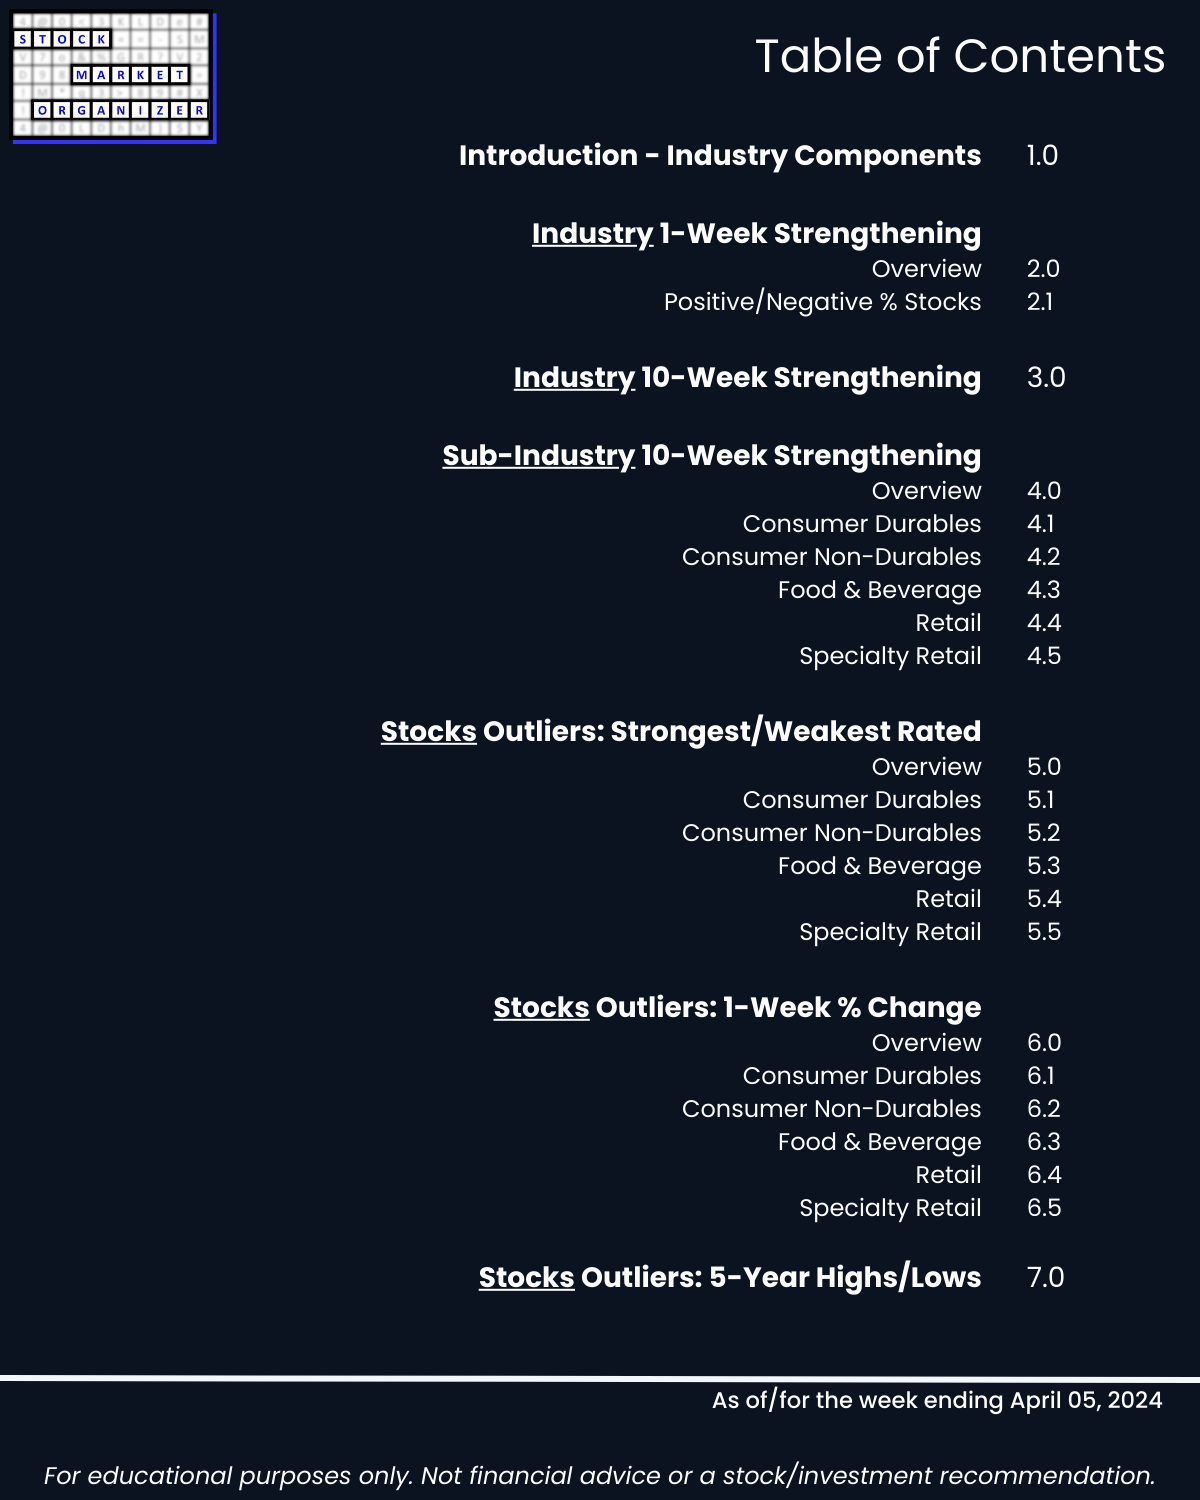
2. Industry 1-Week Strengthening
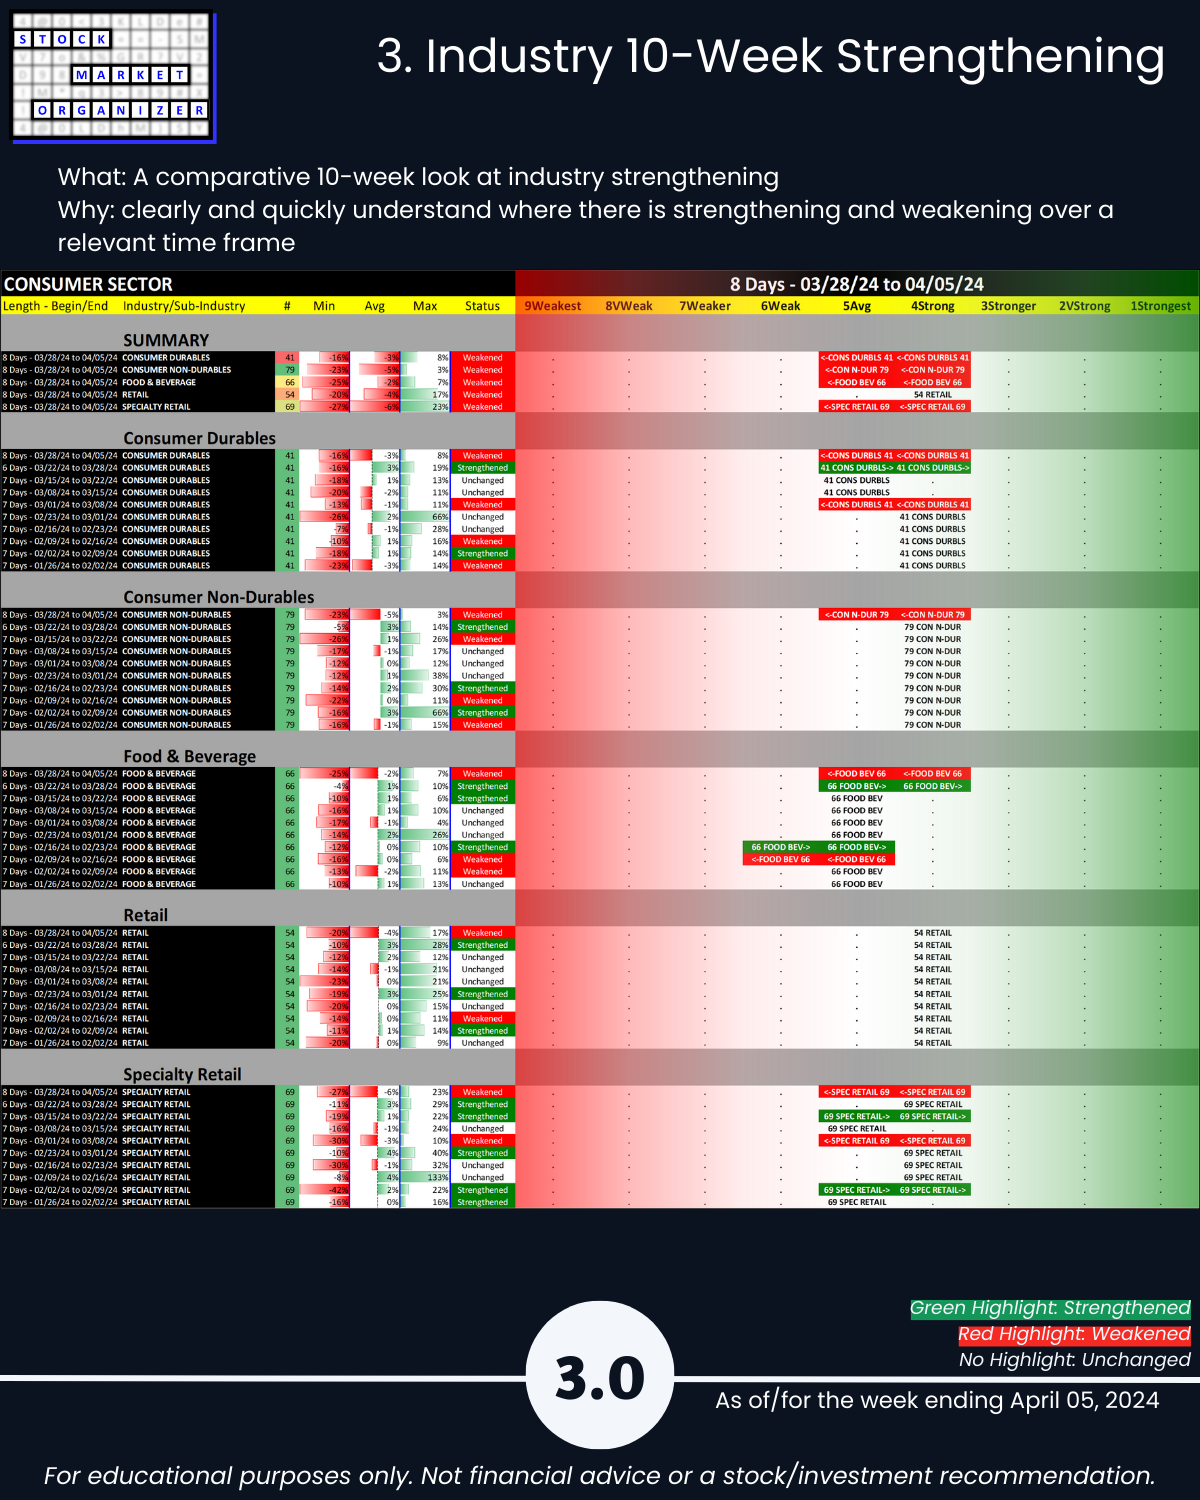
3. Industry 10-Week Strengthening
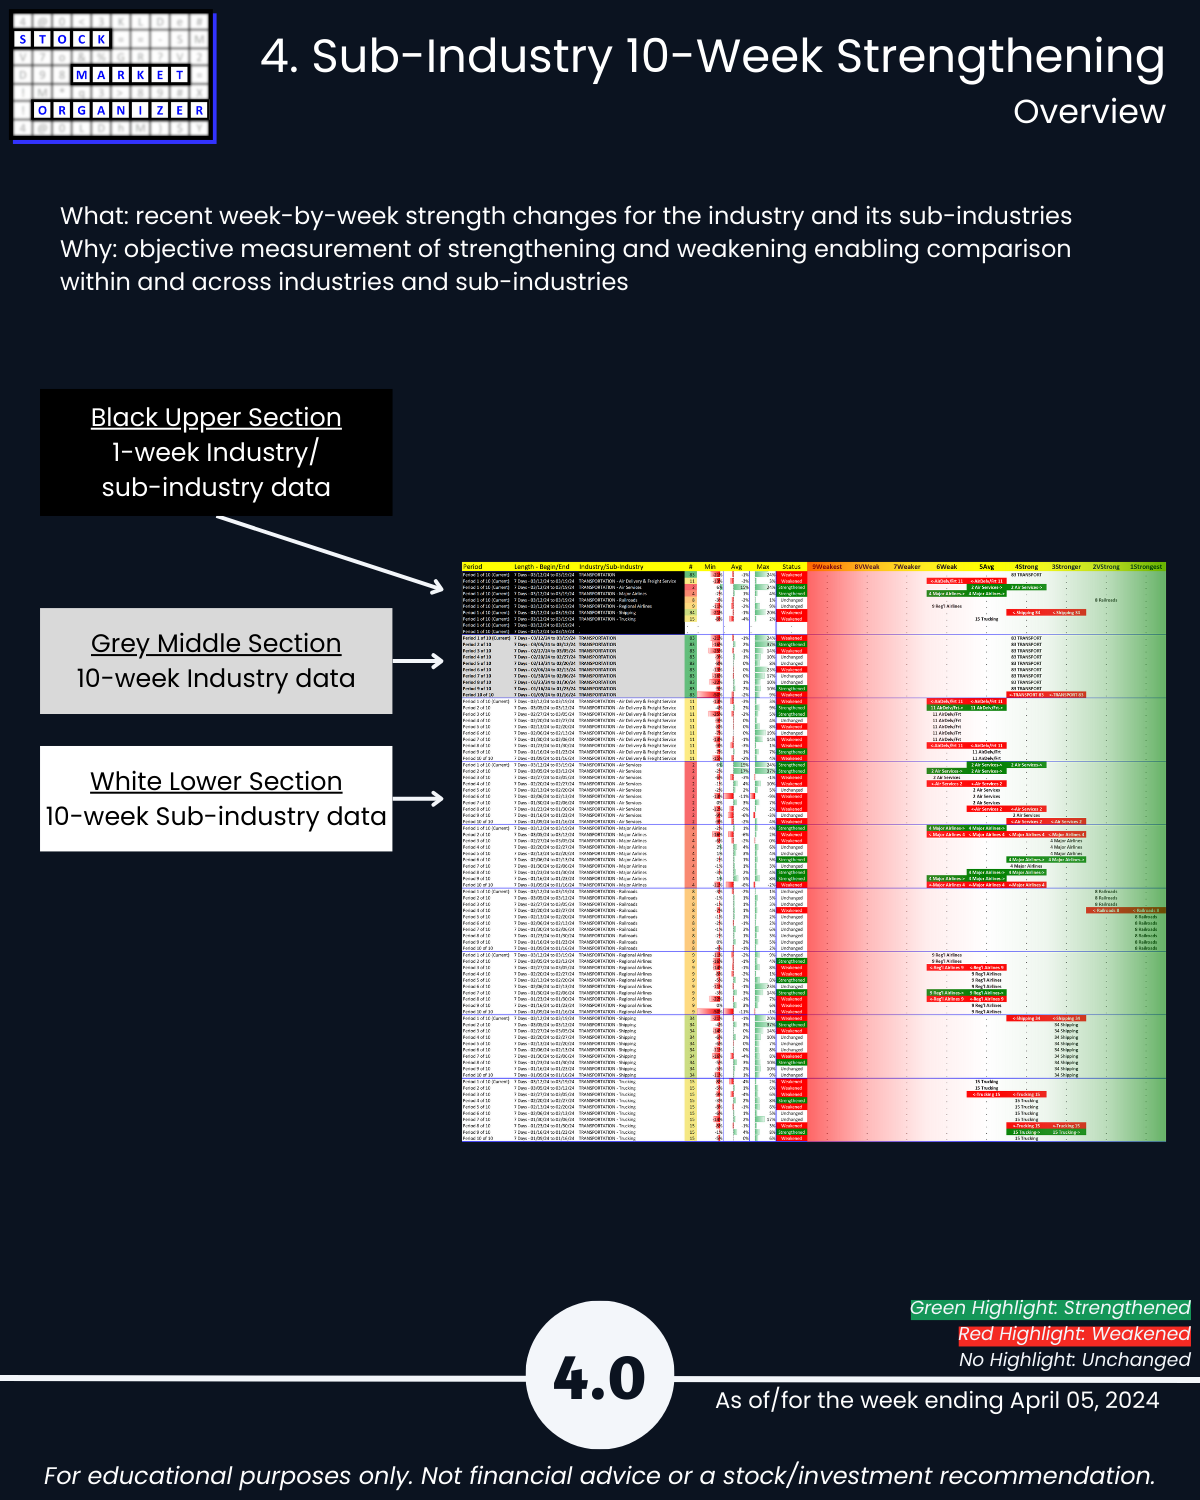
4. Sub-Industry 10-Week Strengthening
5. Stocks Outliers: Strongest/Weakest Rated
6. Stocks Outliers: 1-Week % Change
7. Stocks Outliers: 5-Year Highs/Lows