SMO Exclusive: Strength Report Consumer Sector 2024-02-16

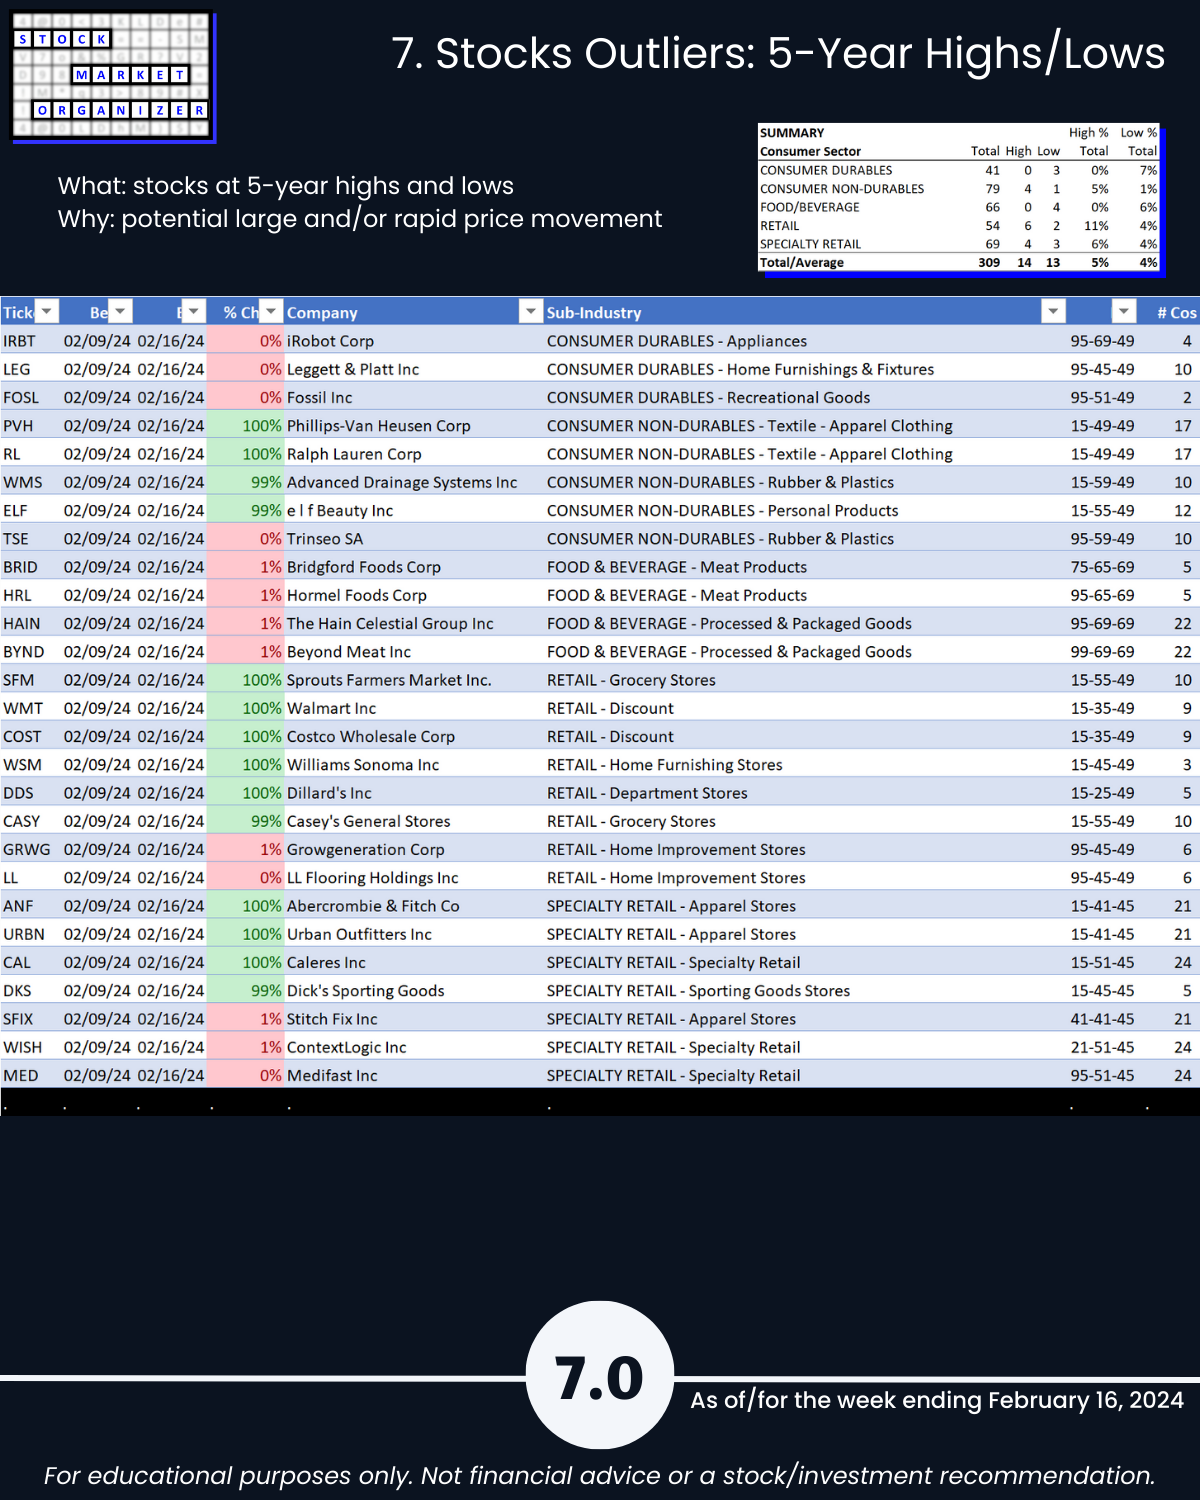
Consumer Sector analysis 2/16/24, home of ANF +454% since 5/4/23 vs. NVDA +163%. Definitely a cherry-picked start date but the point is it’s not just AI! AI!! AI!!! these days. If you watch the entire market all the time it’s possible to see beyond AI. See page 7.0 for 5-year highs/lows and wonder if you own laggards like LEG, HRL, BYND, and MED how you could have known to dump them before they became such portfolio anchors. Perhaps the fundamental stories are too compelling to punt now? Or, is it ridiculous to short these weak links because they might be the next PLCE (+133%)?
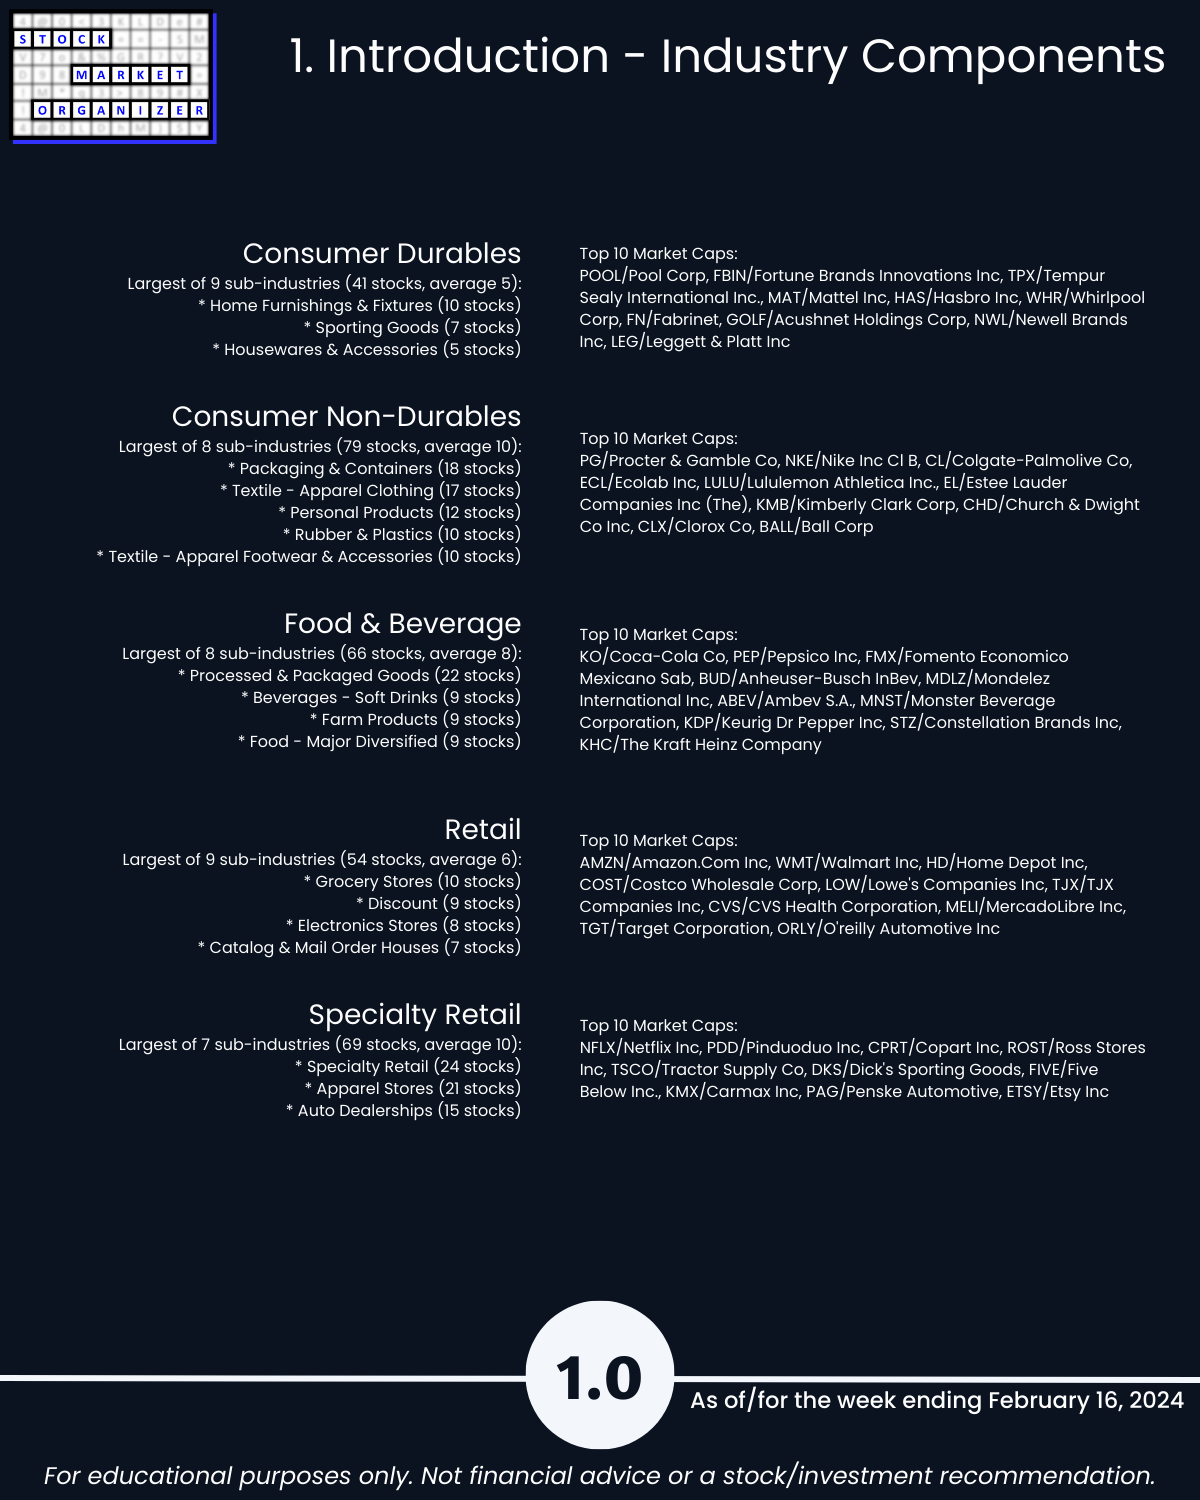
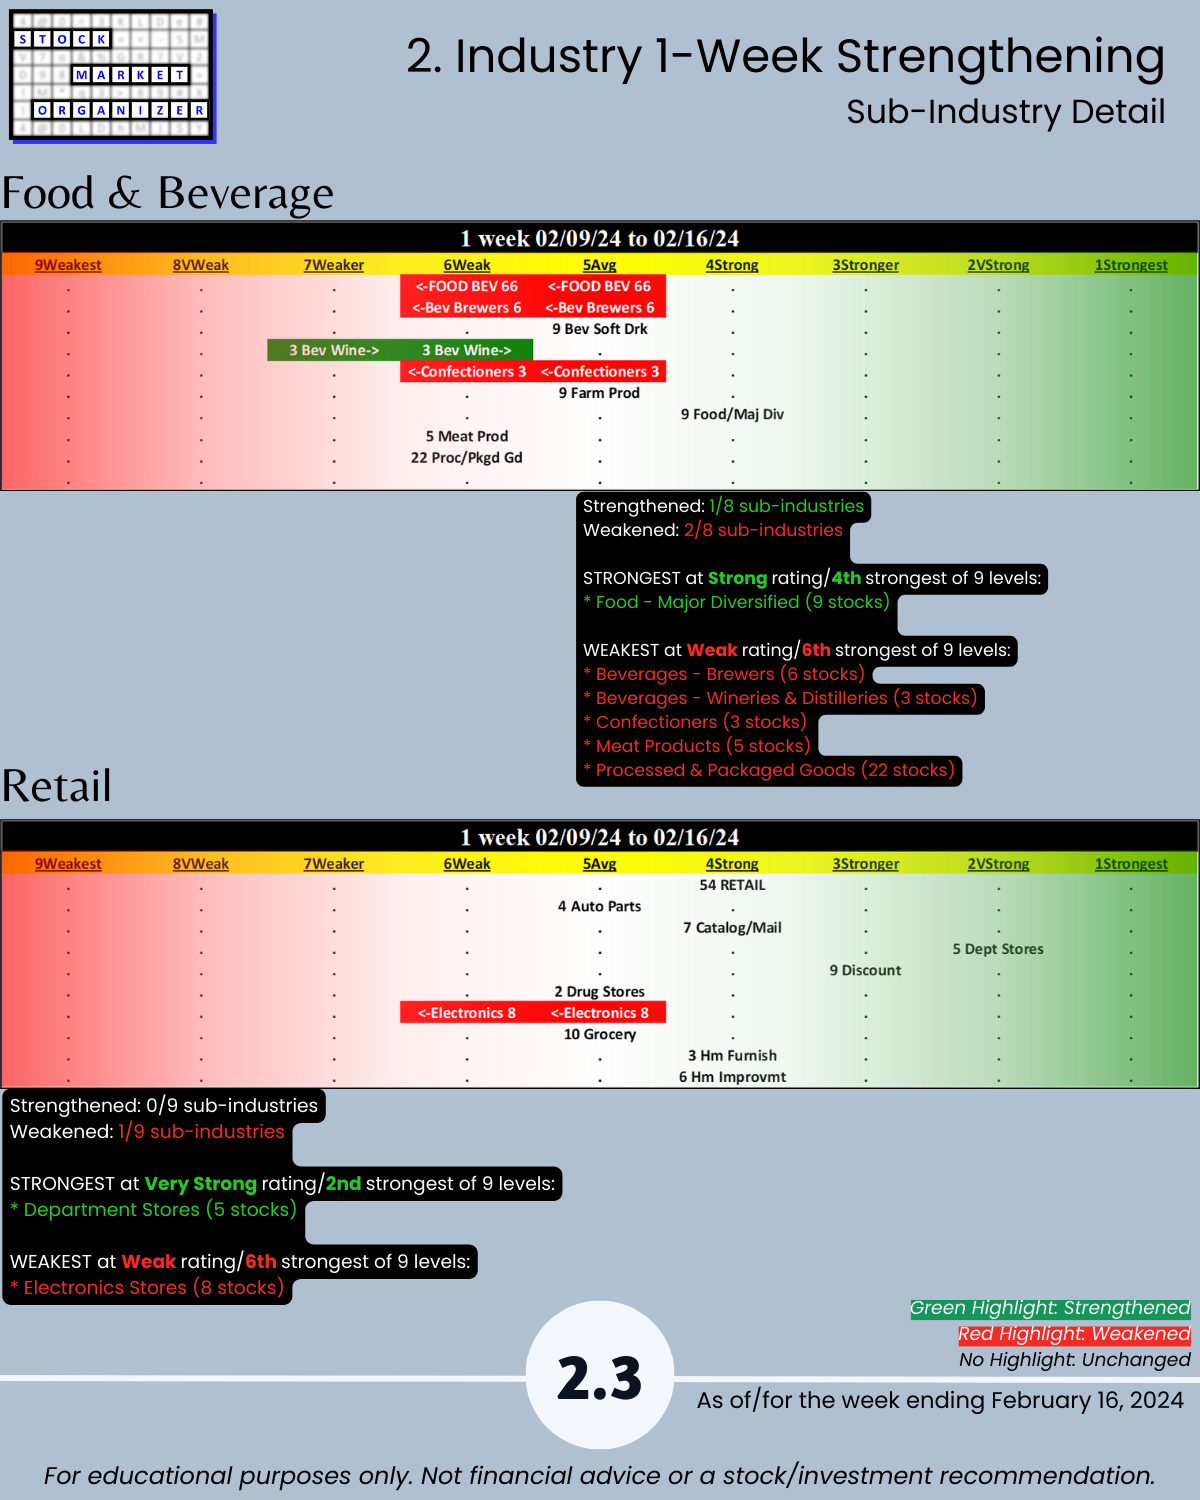
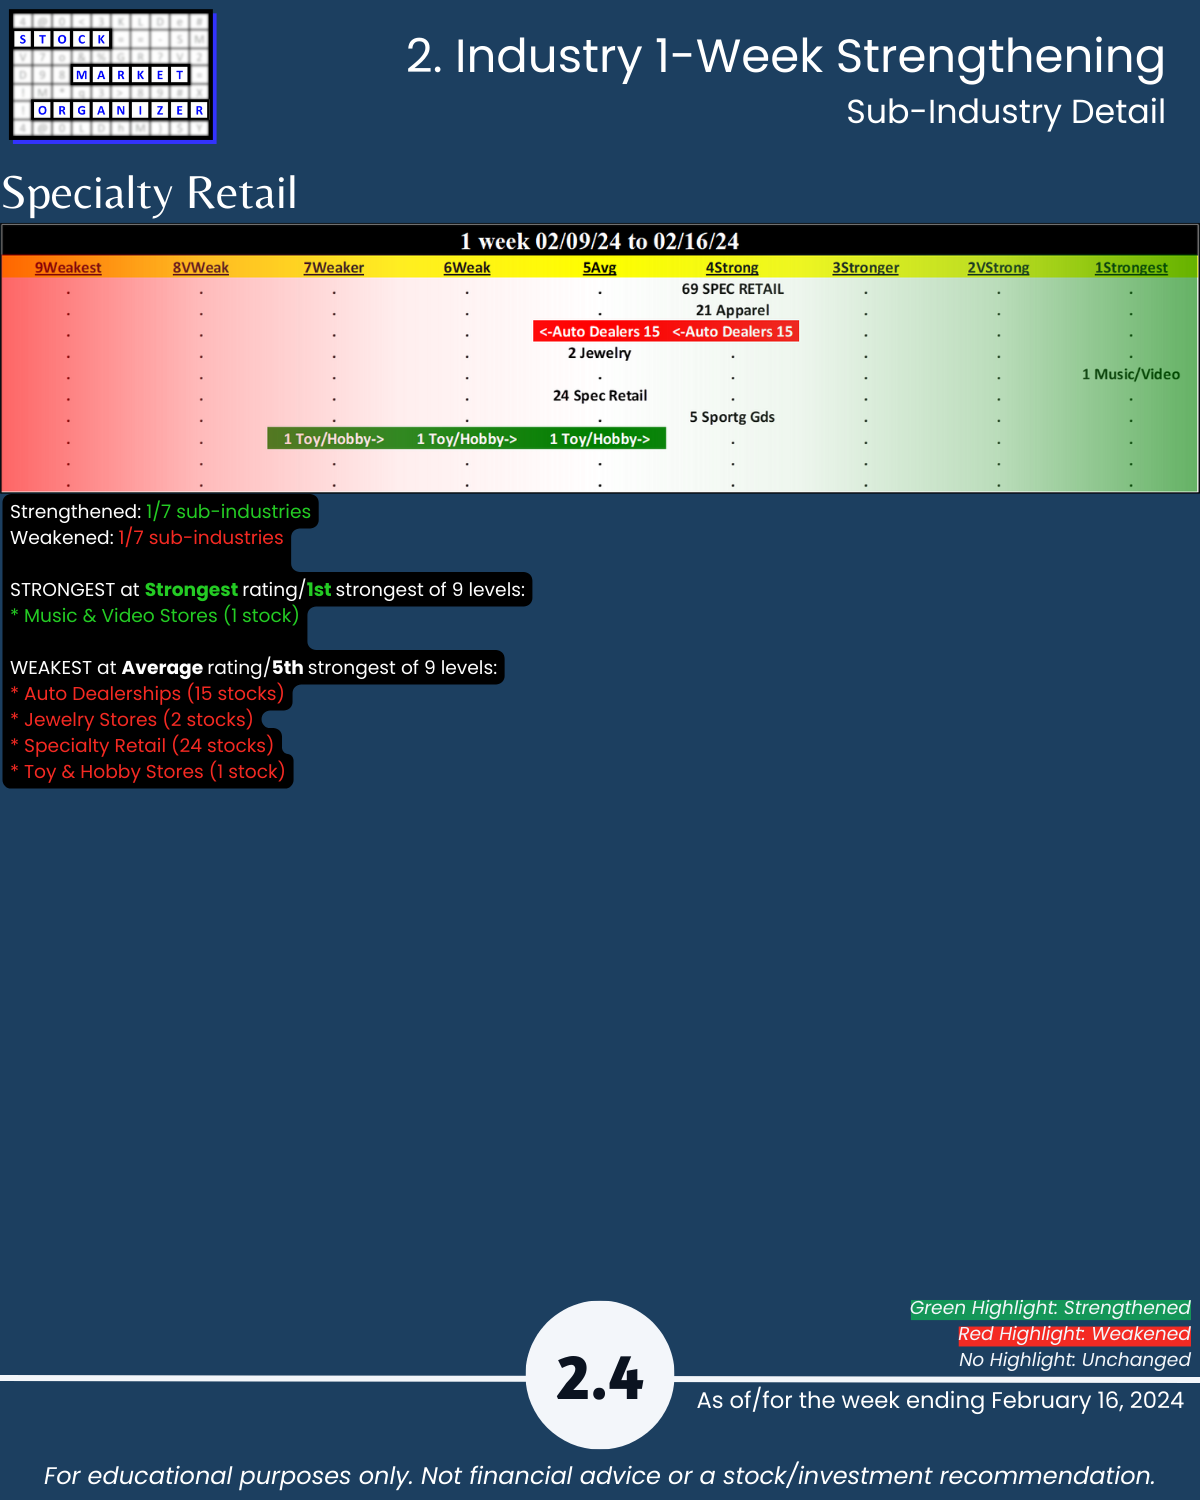
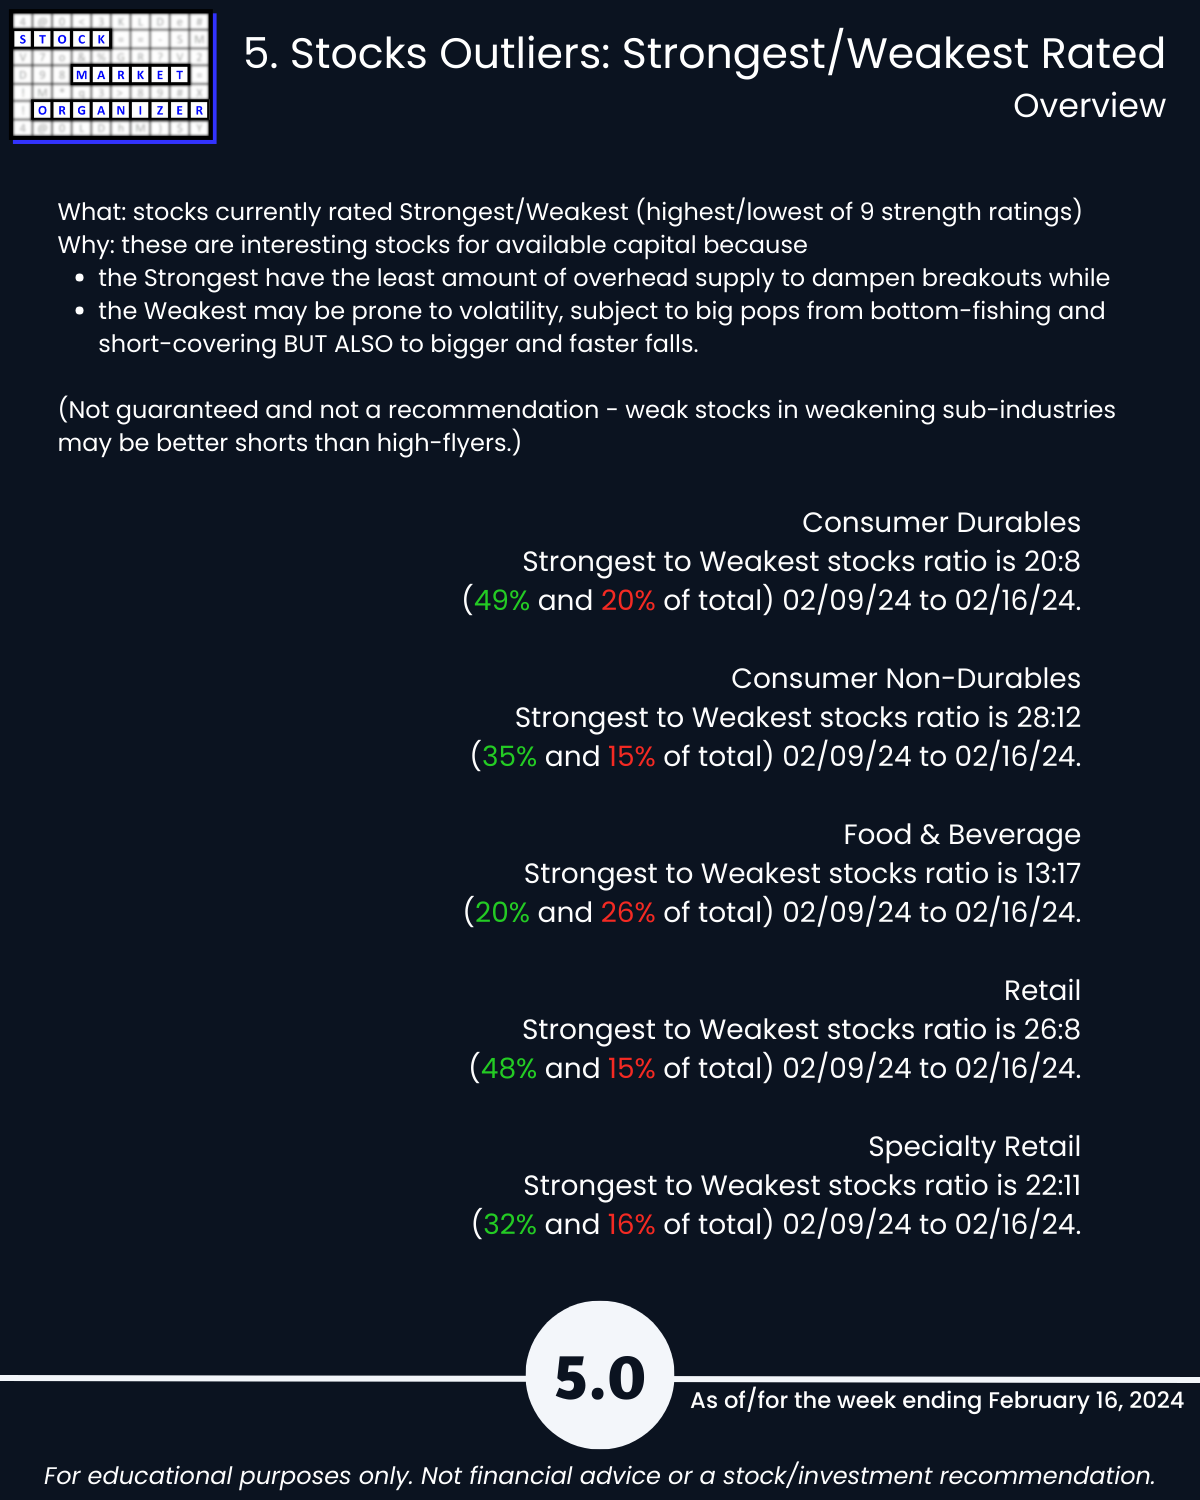
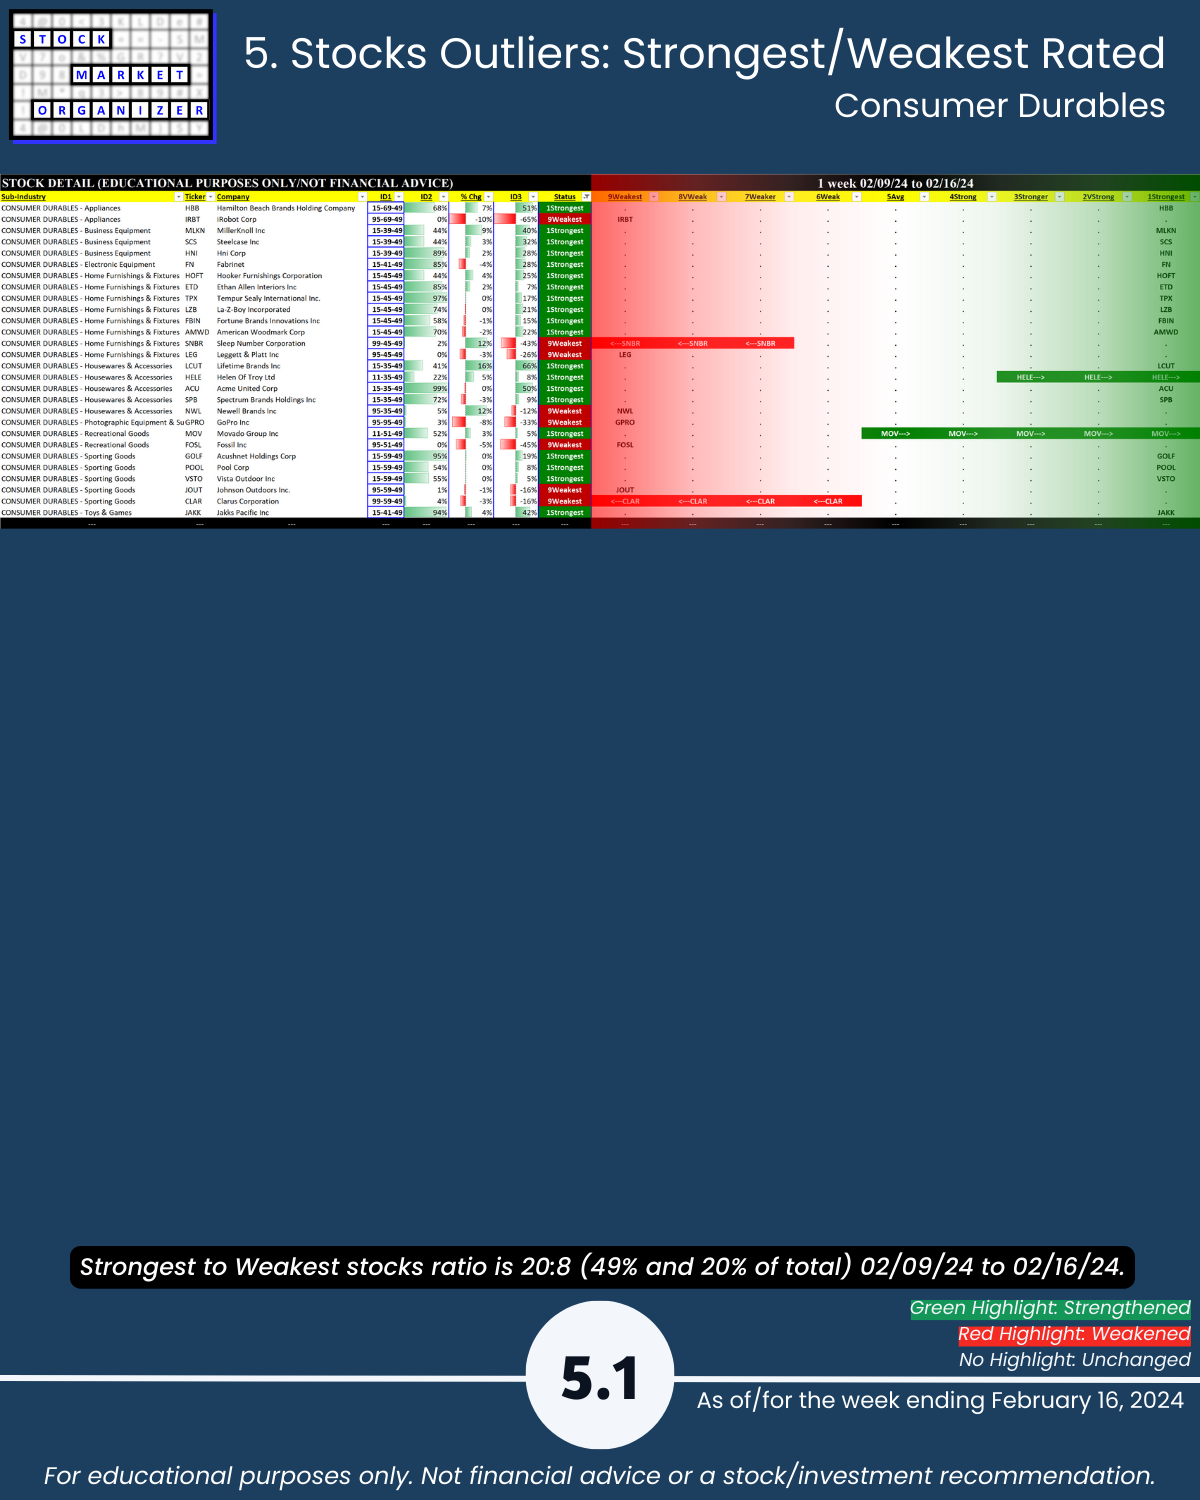
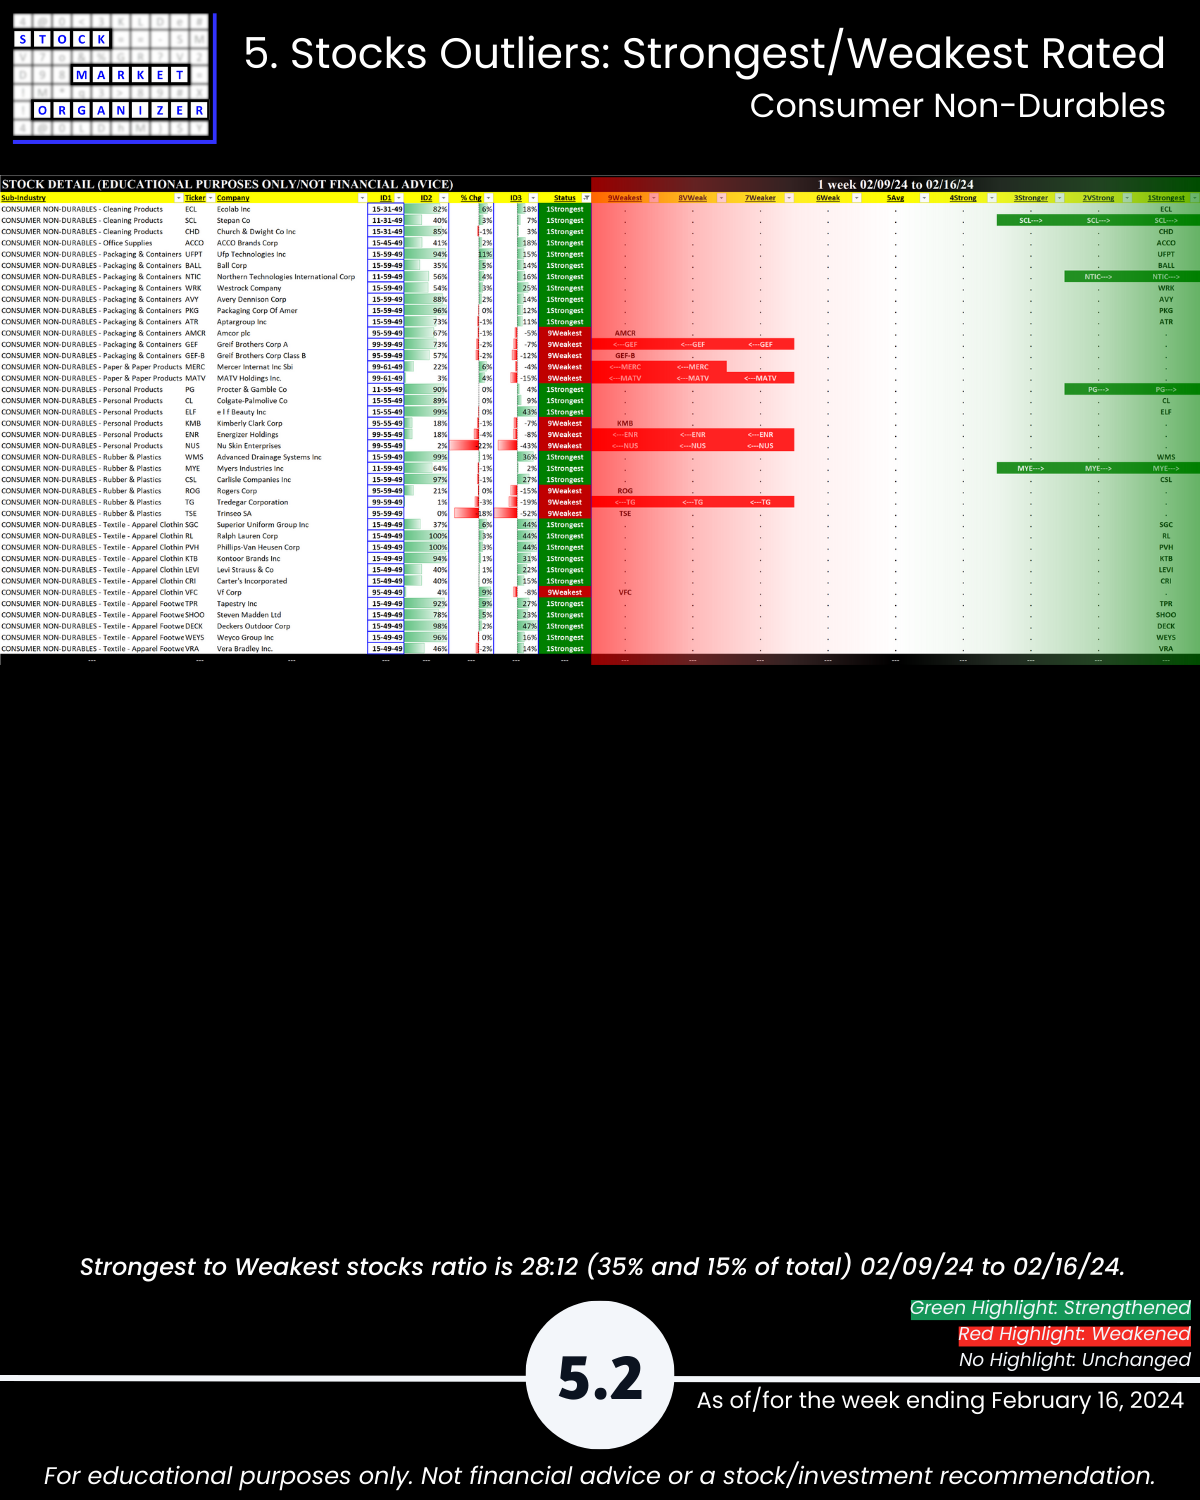
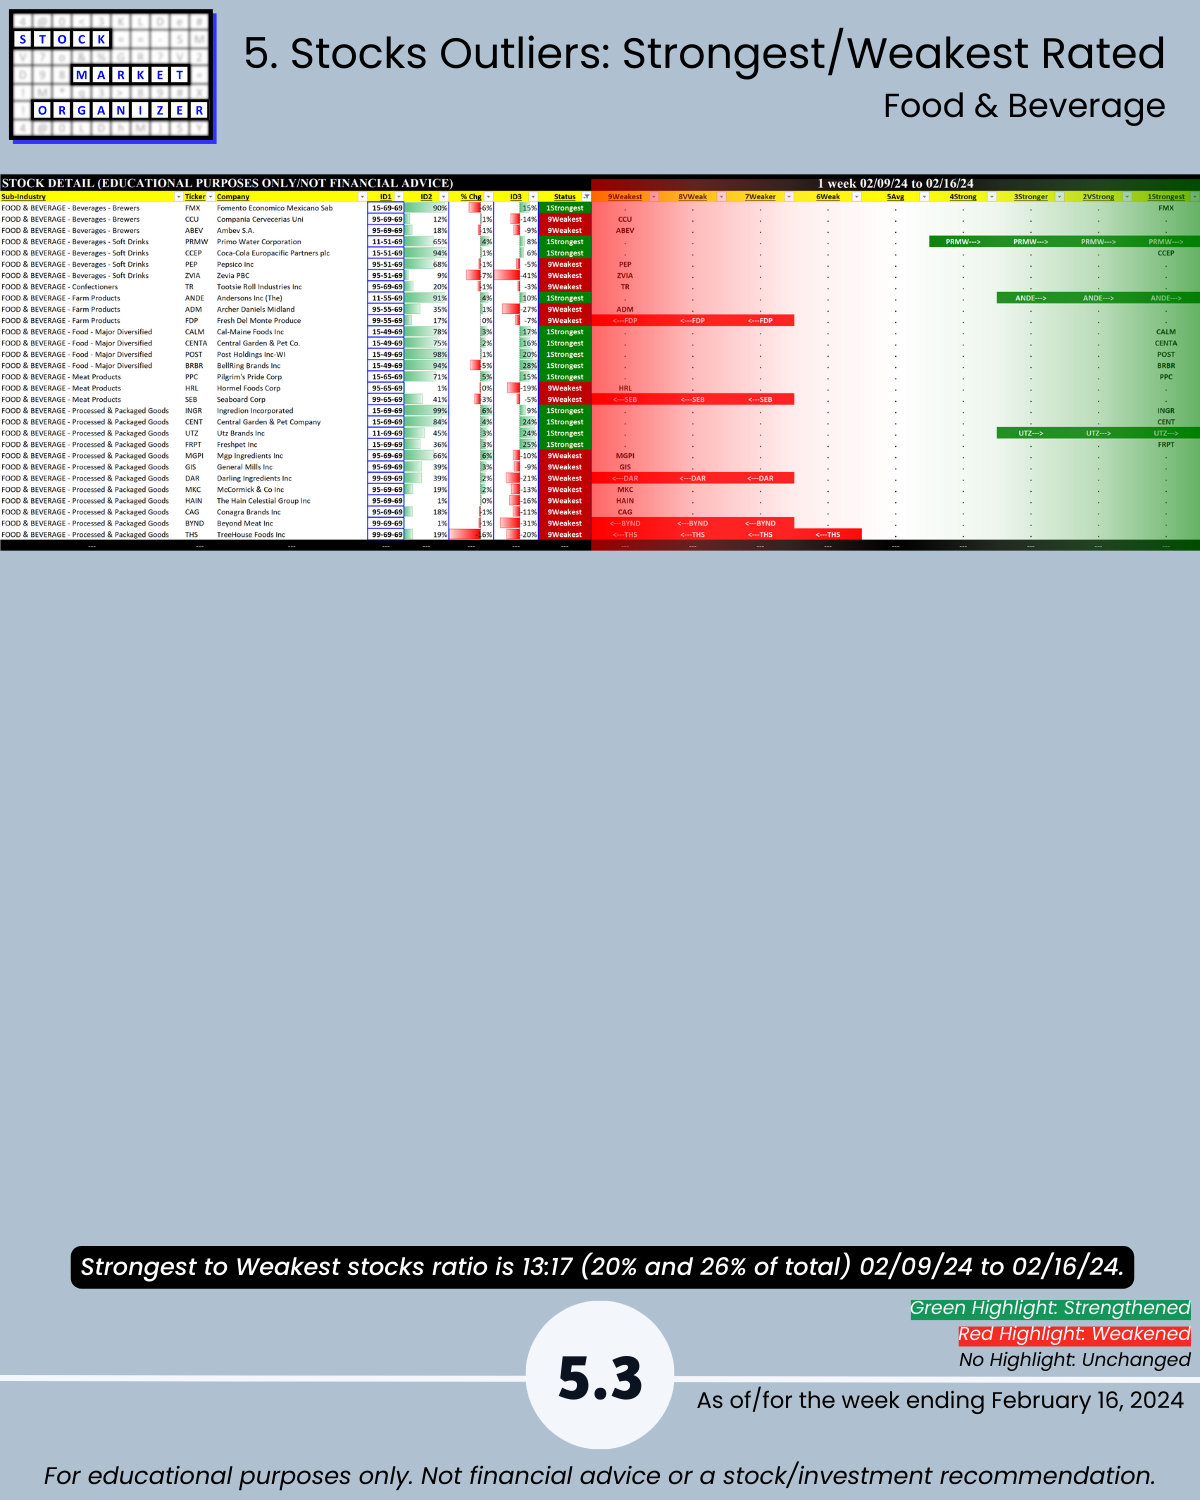
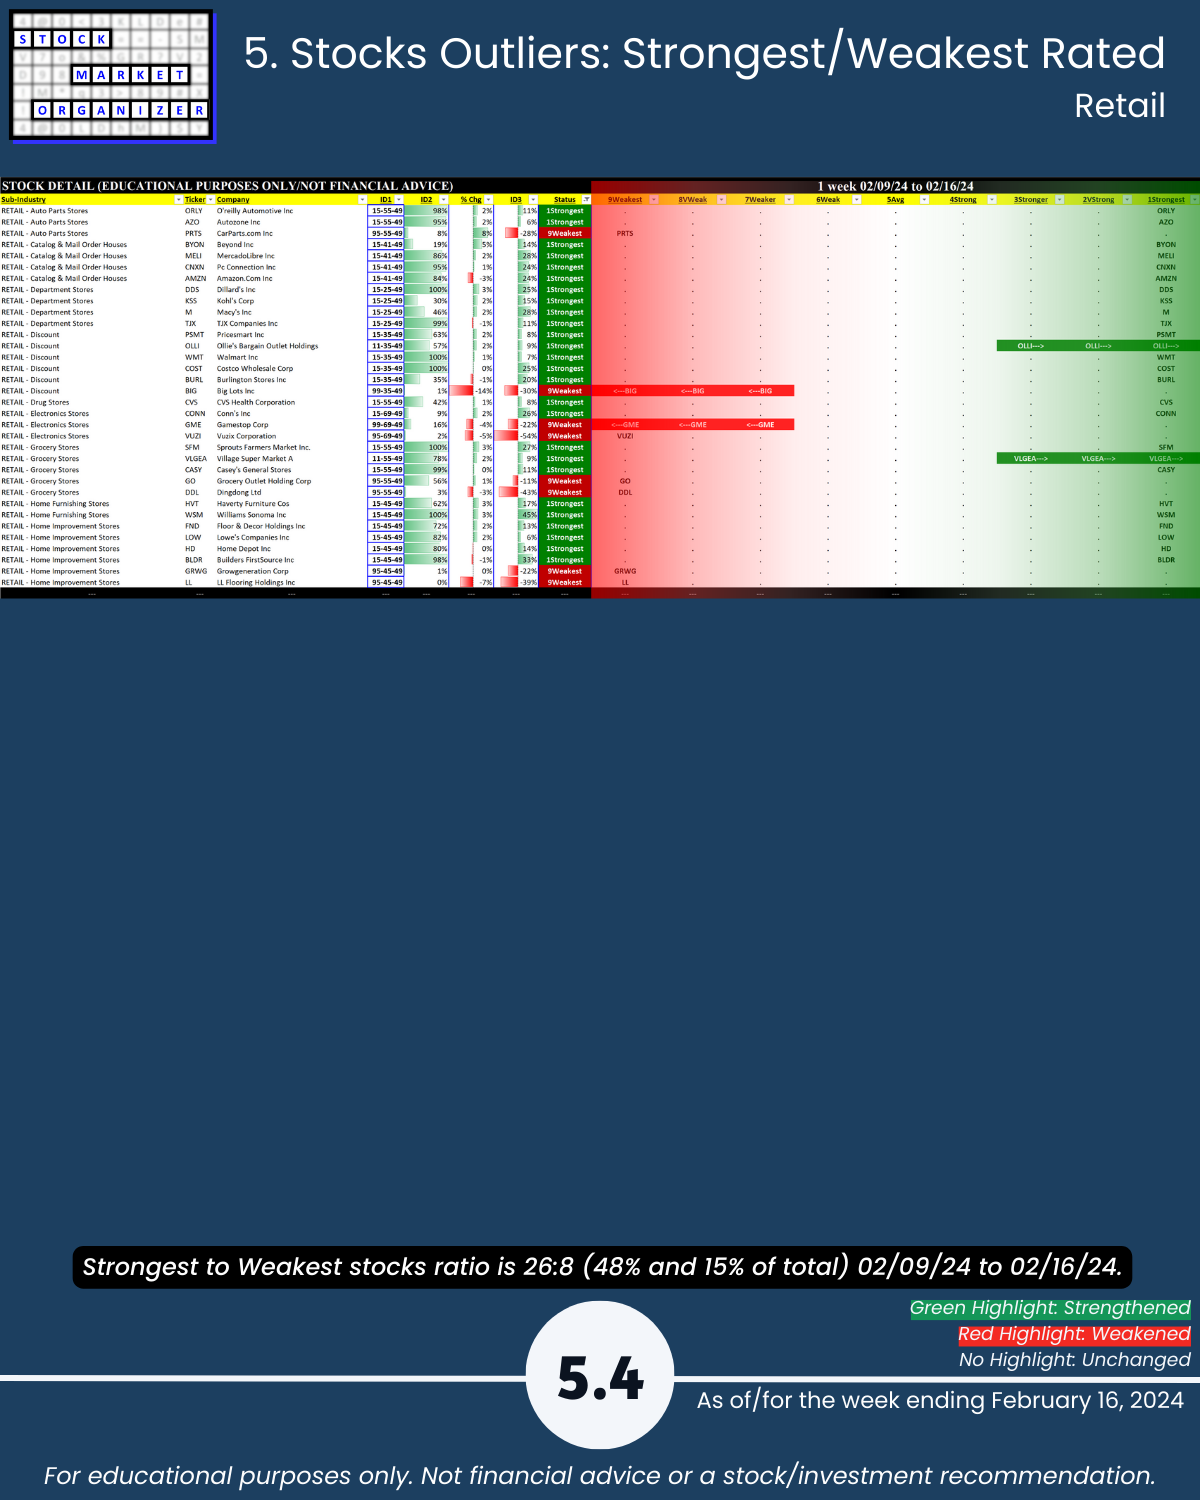
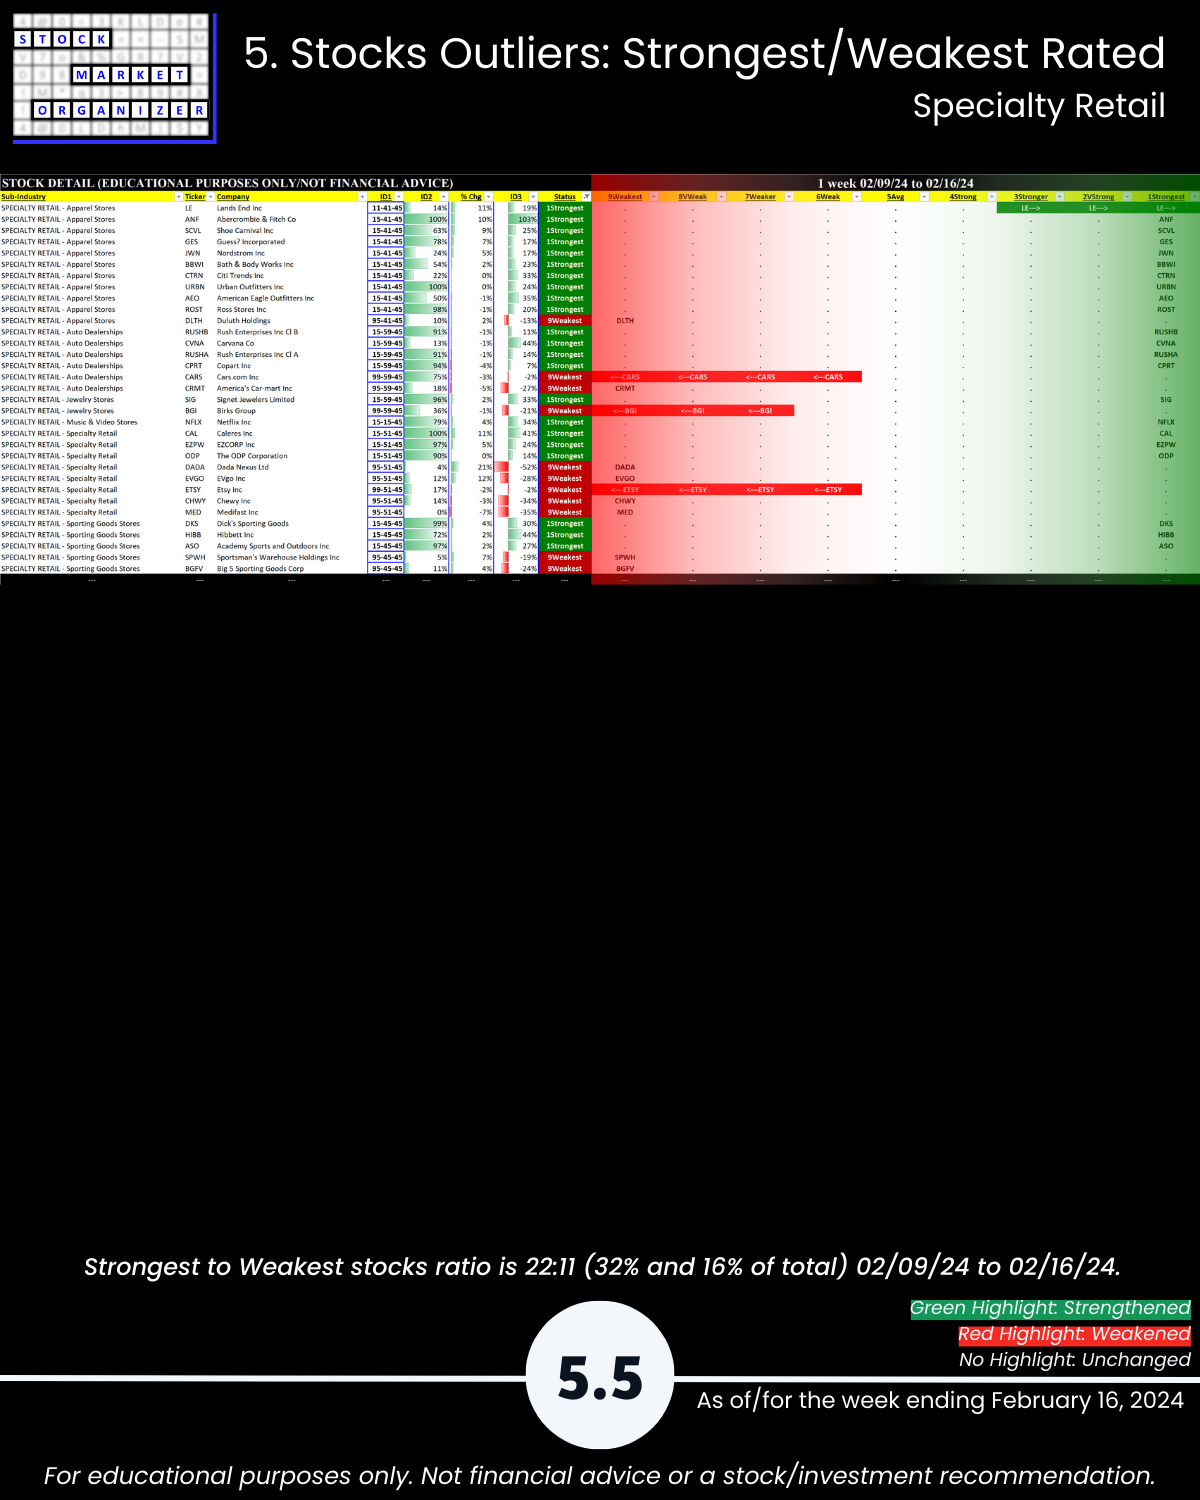
Attached: Strongest- and Weakest-rated Stock Market Organizer stocks and objective strengthening/weakening measurements in the Consumer Durables, Consumer Non-Durables, Food & Beverage, Retail, and Specialty Retail industries.
Takeaways:
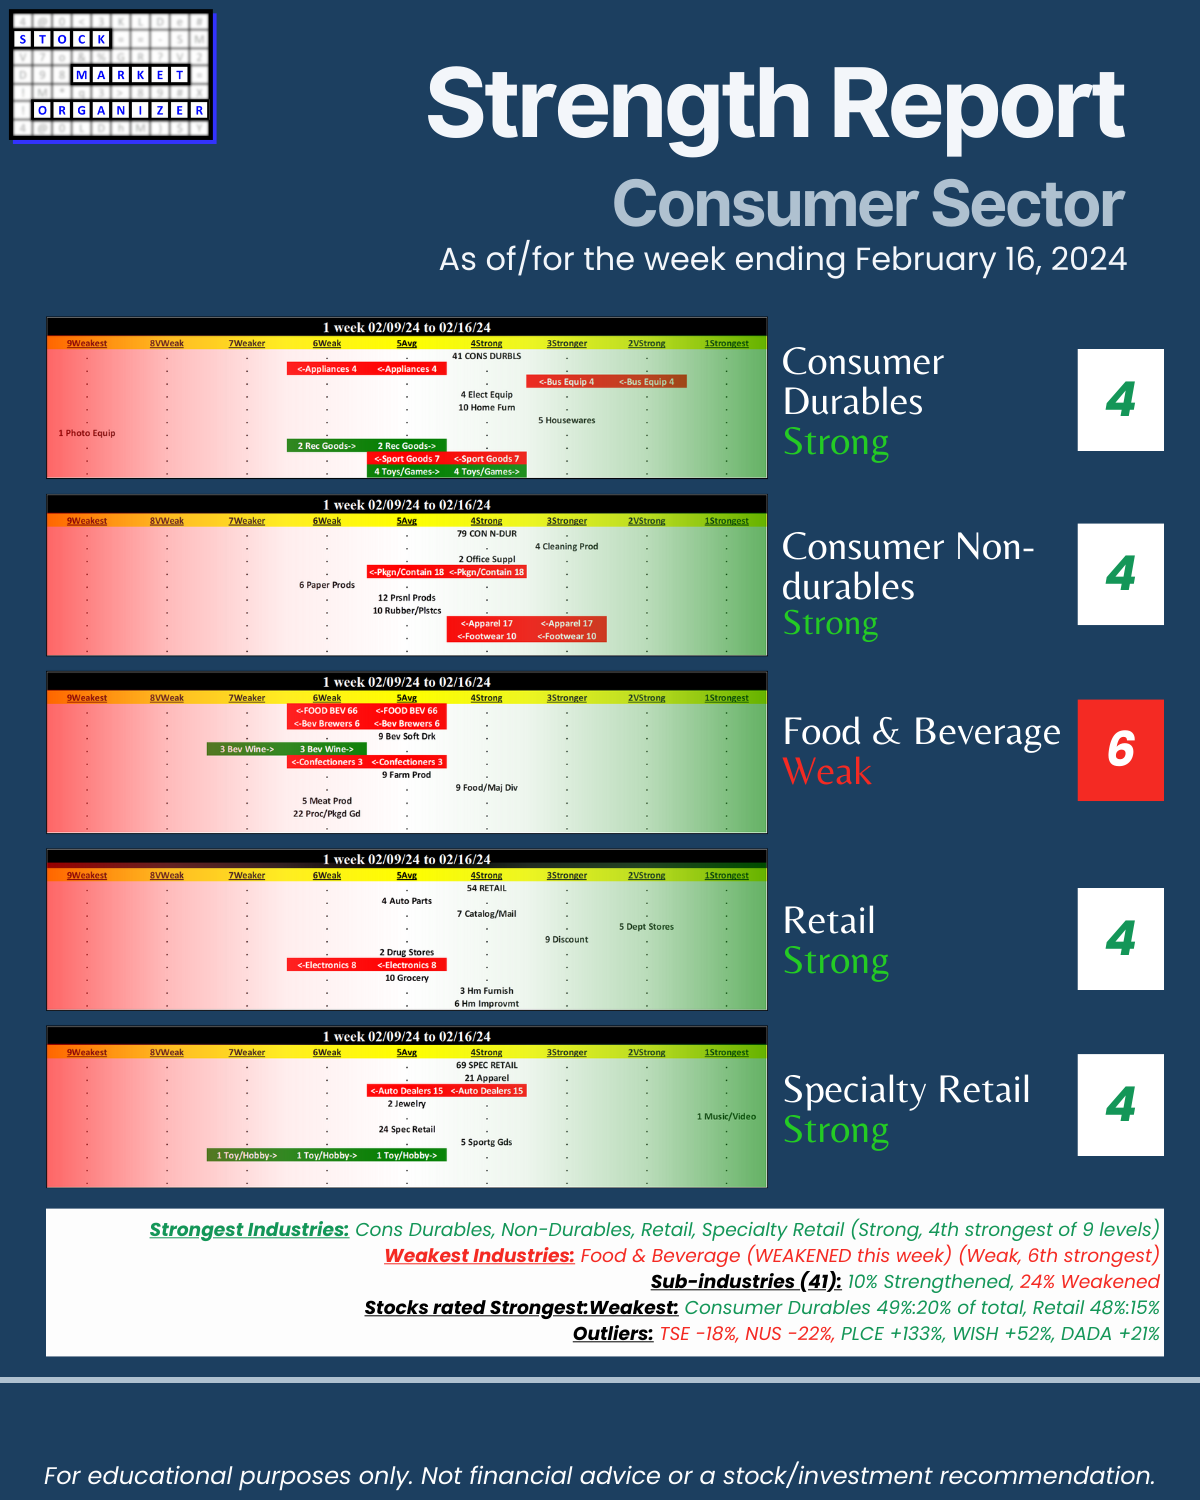
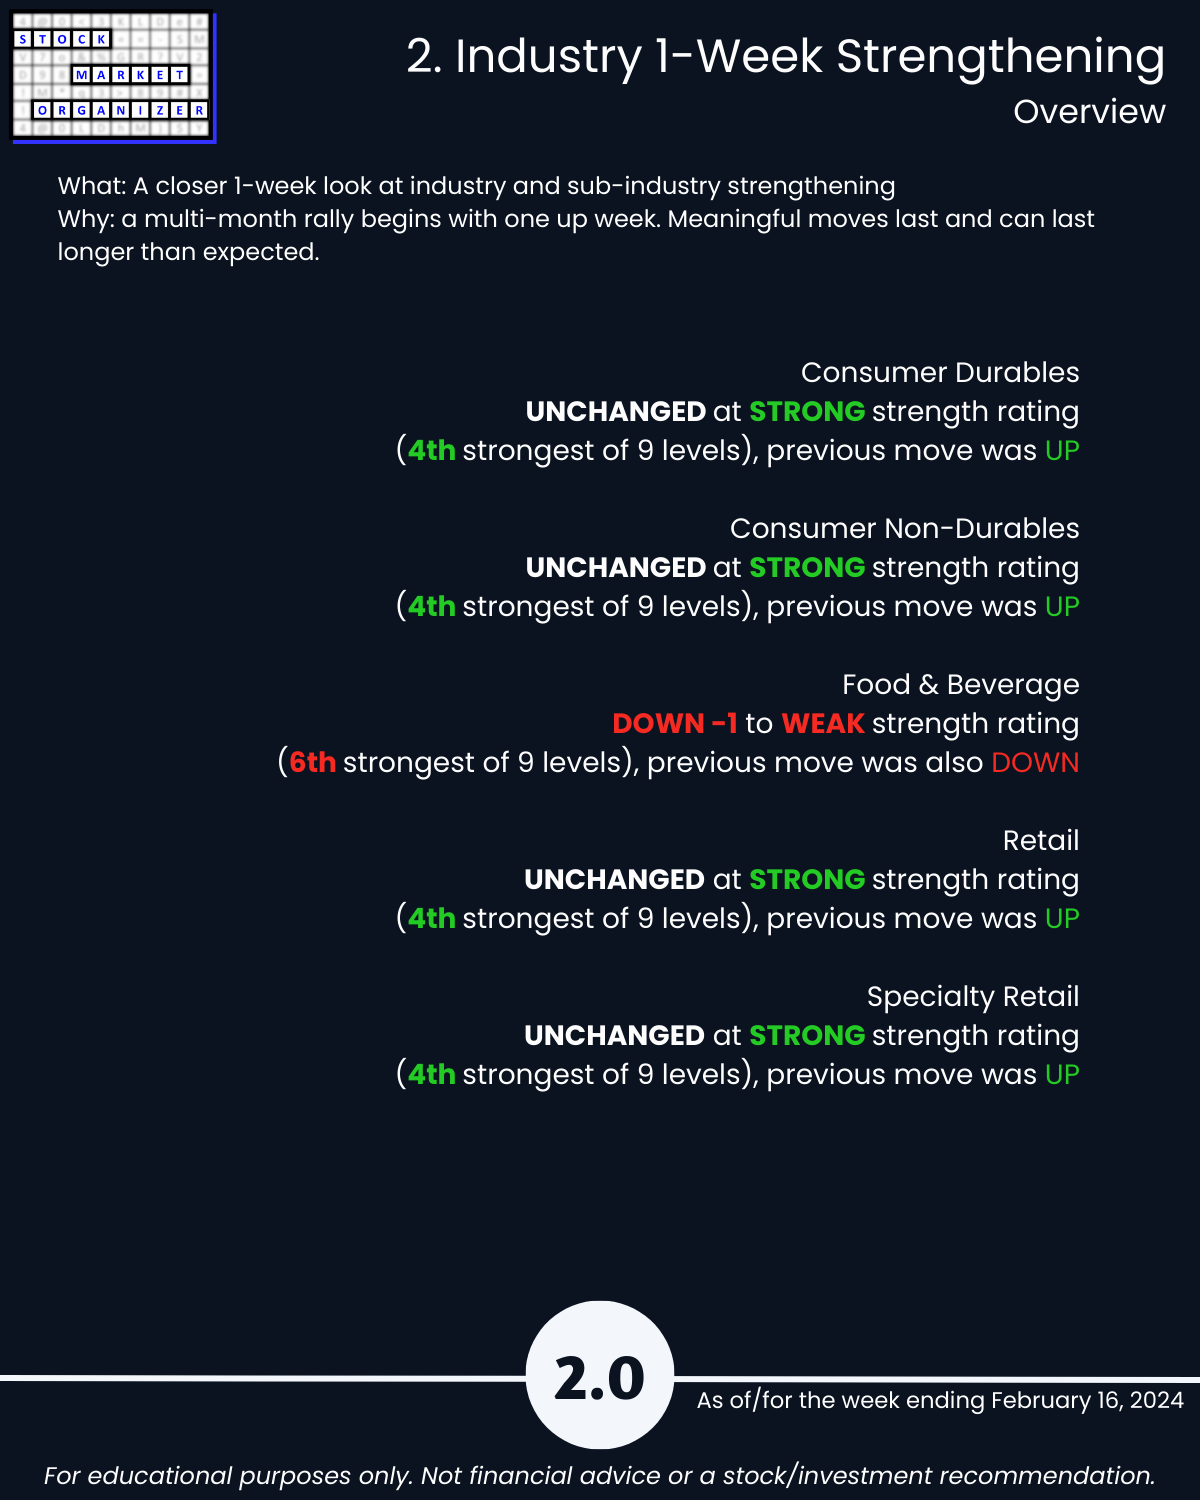
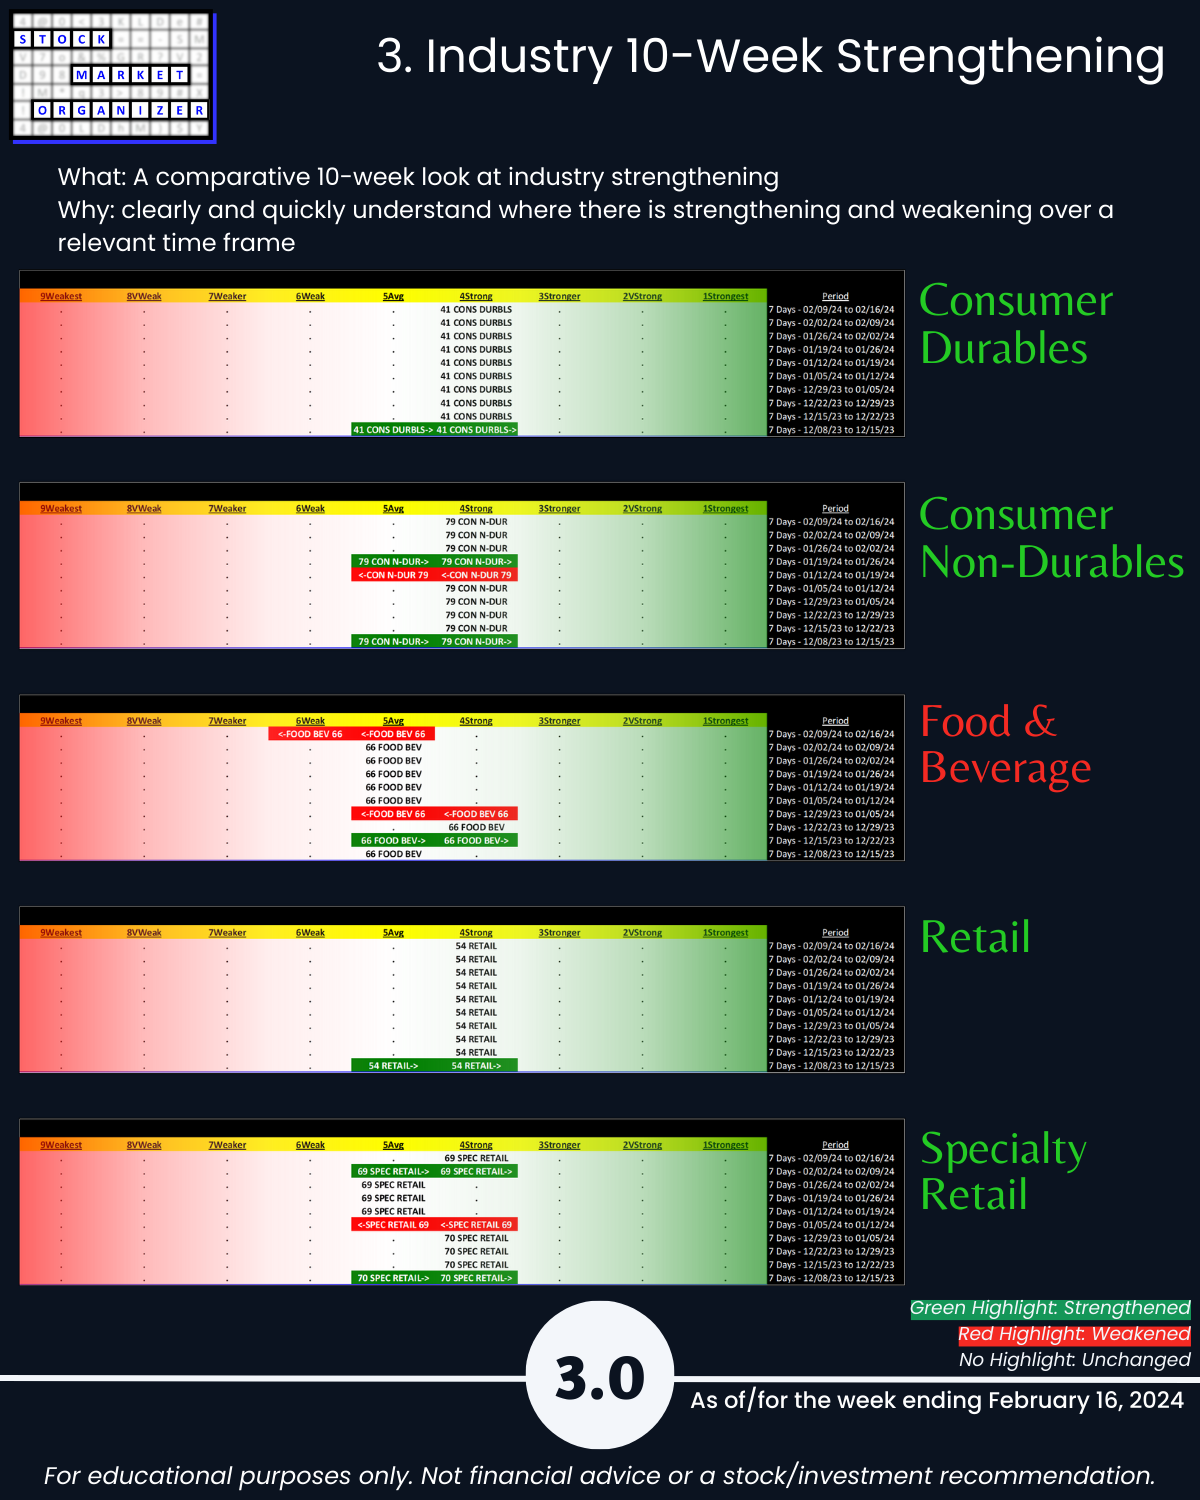
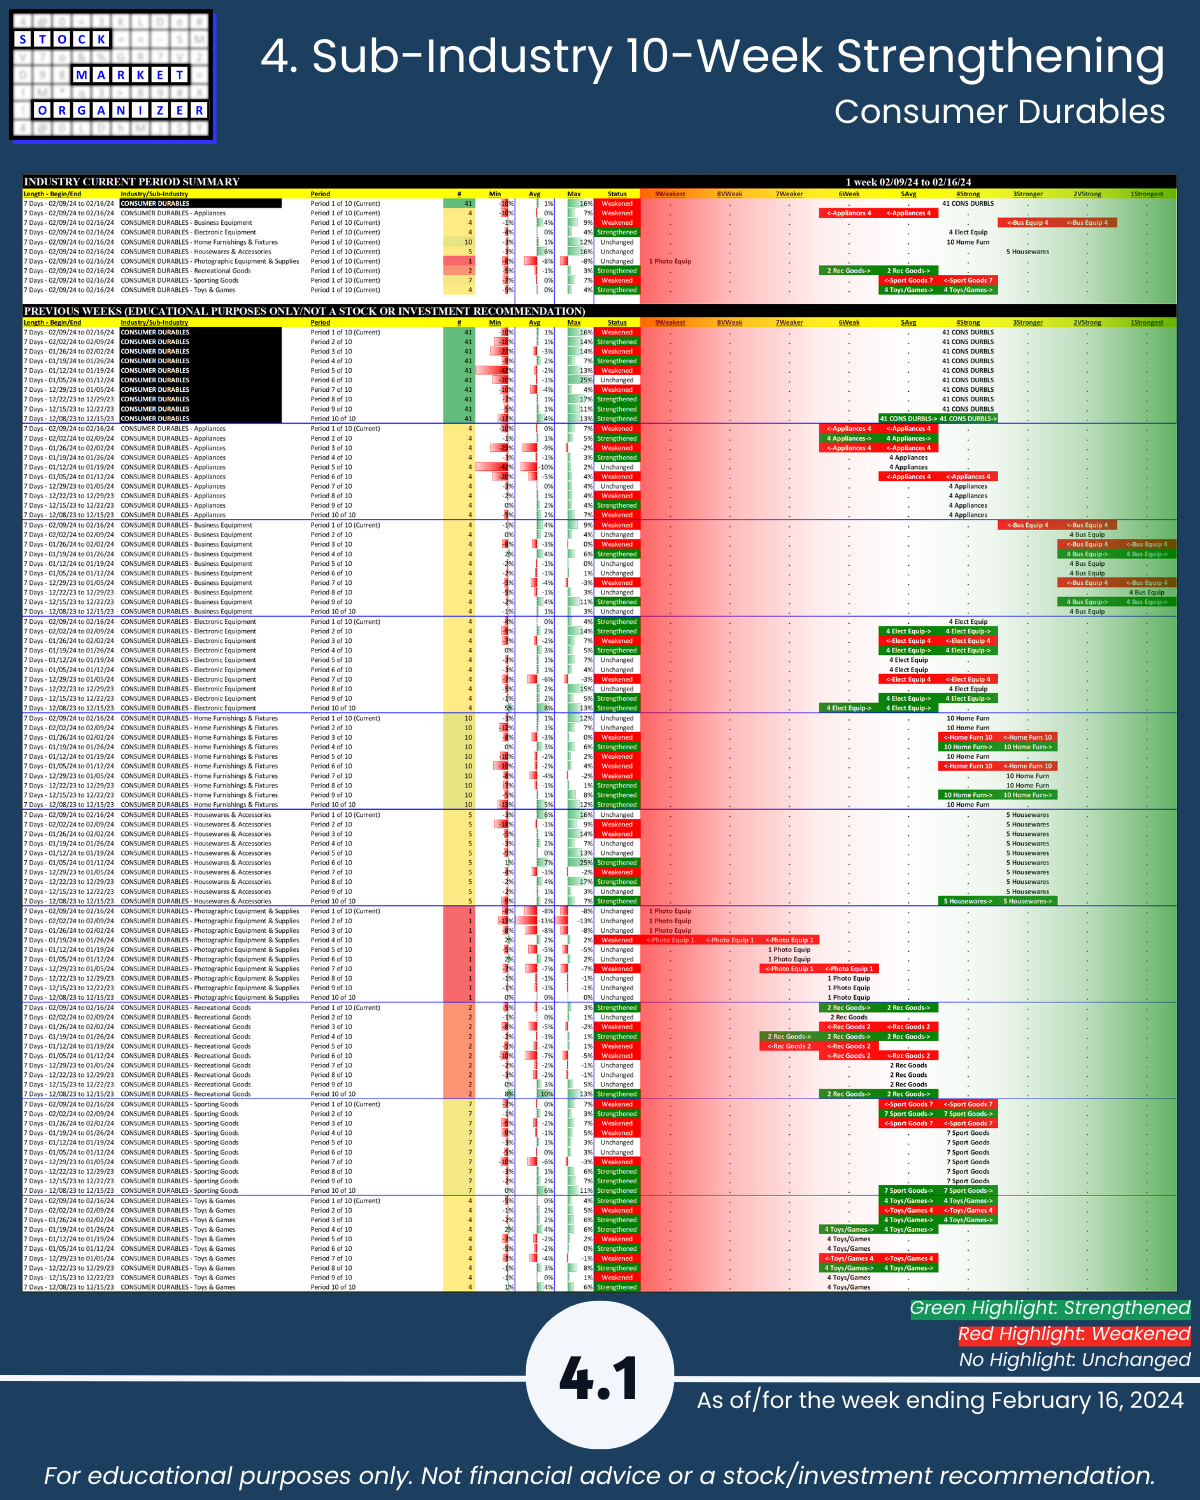
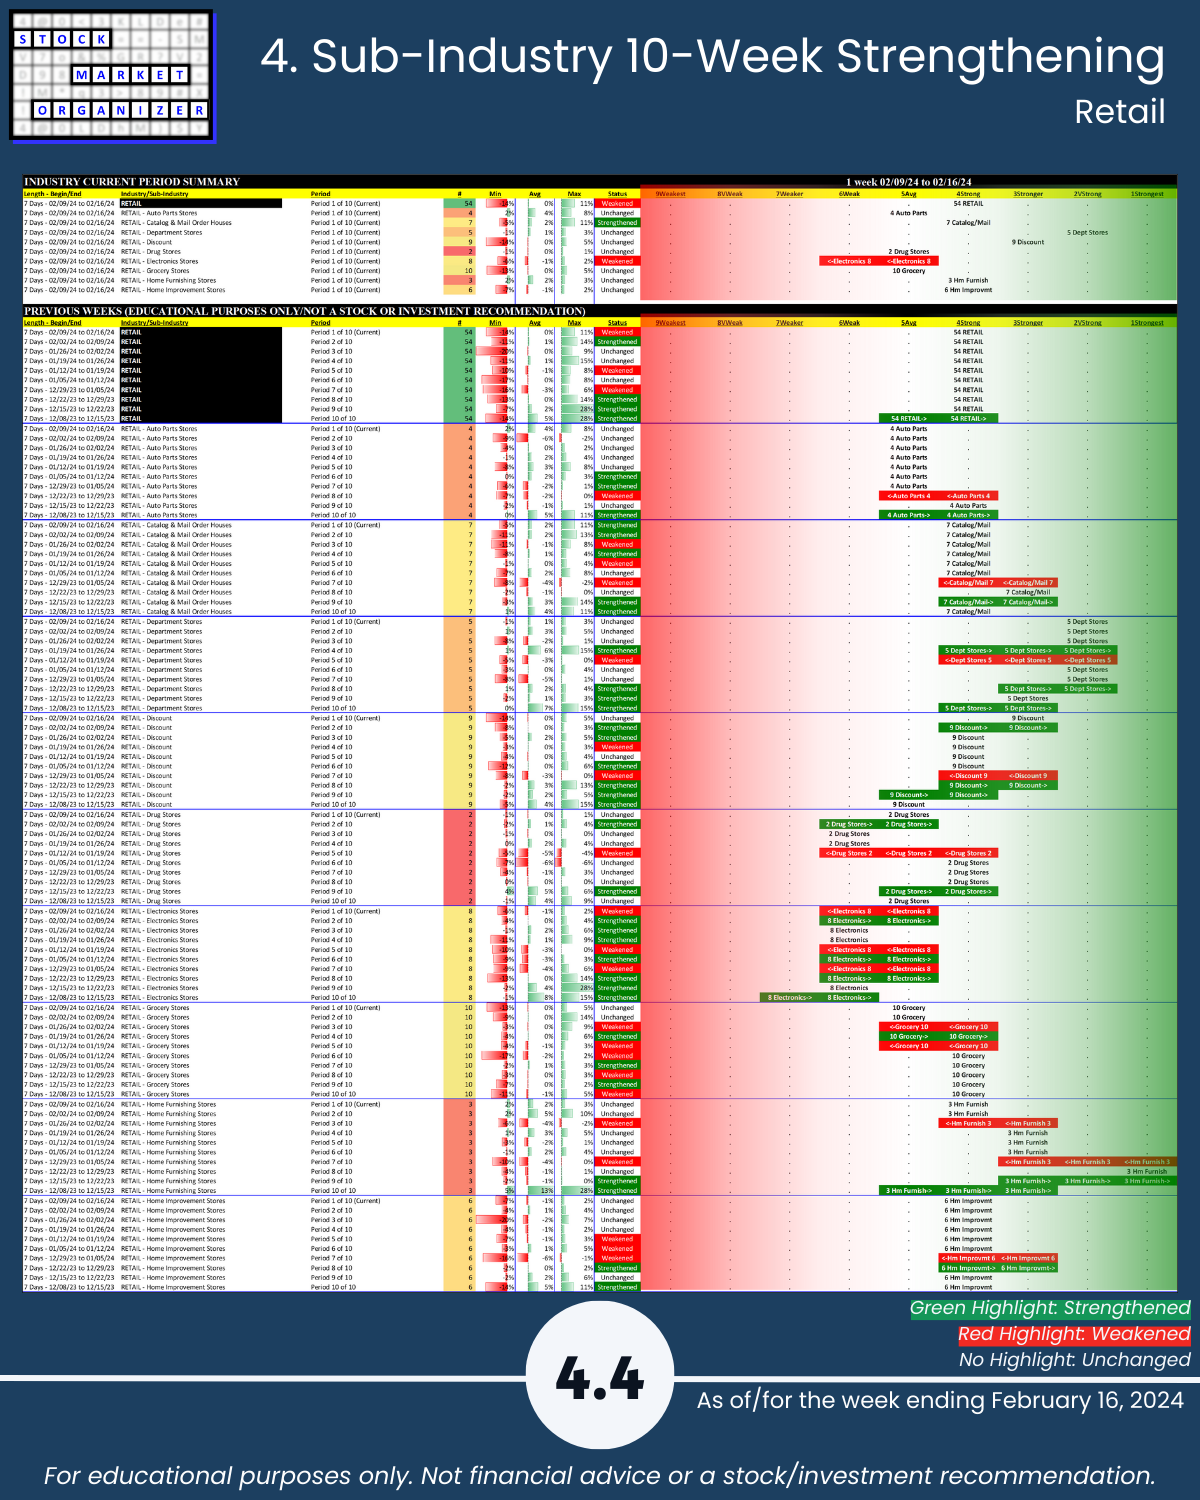
🔹 Strongest Industries: Cons Durables, Non-Durables, Retail, Specialty Retail (Strong, 4th strongest of 9 levels)
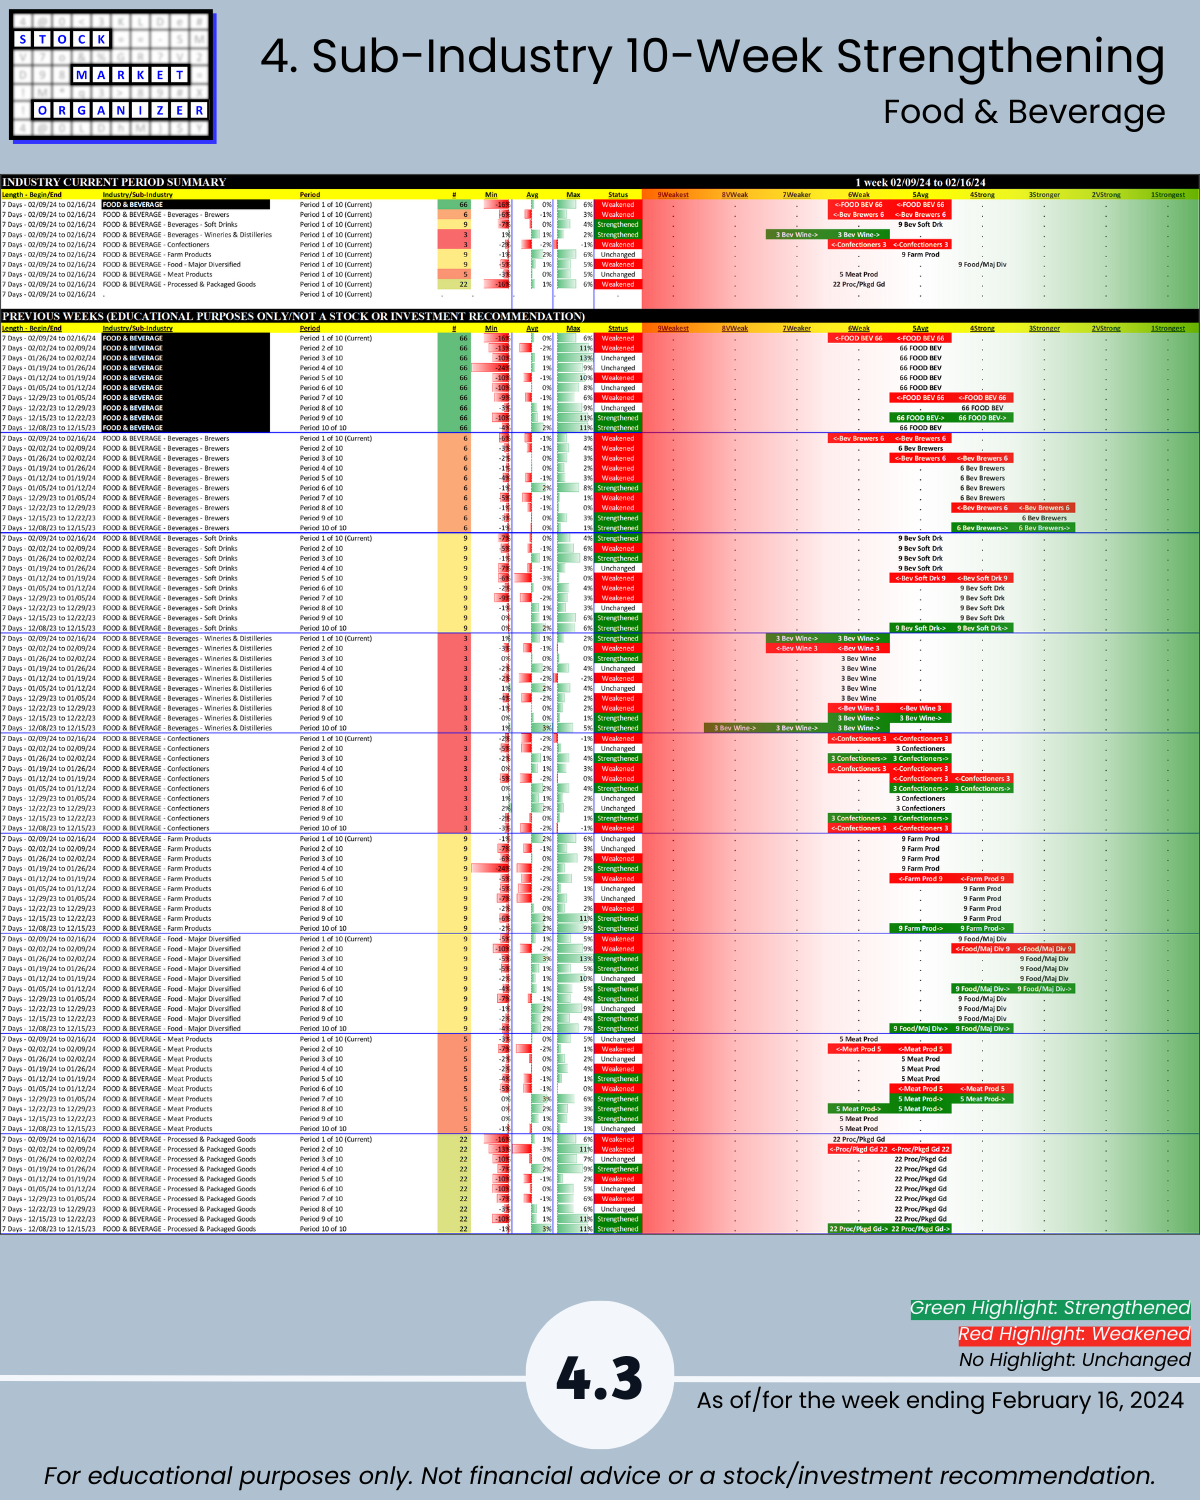
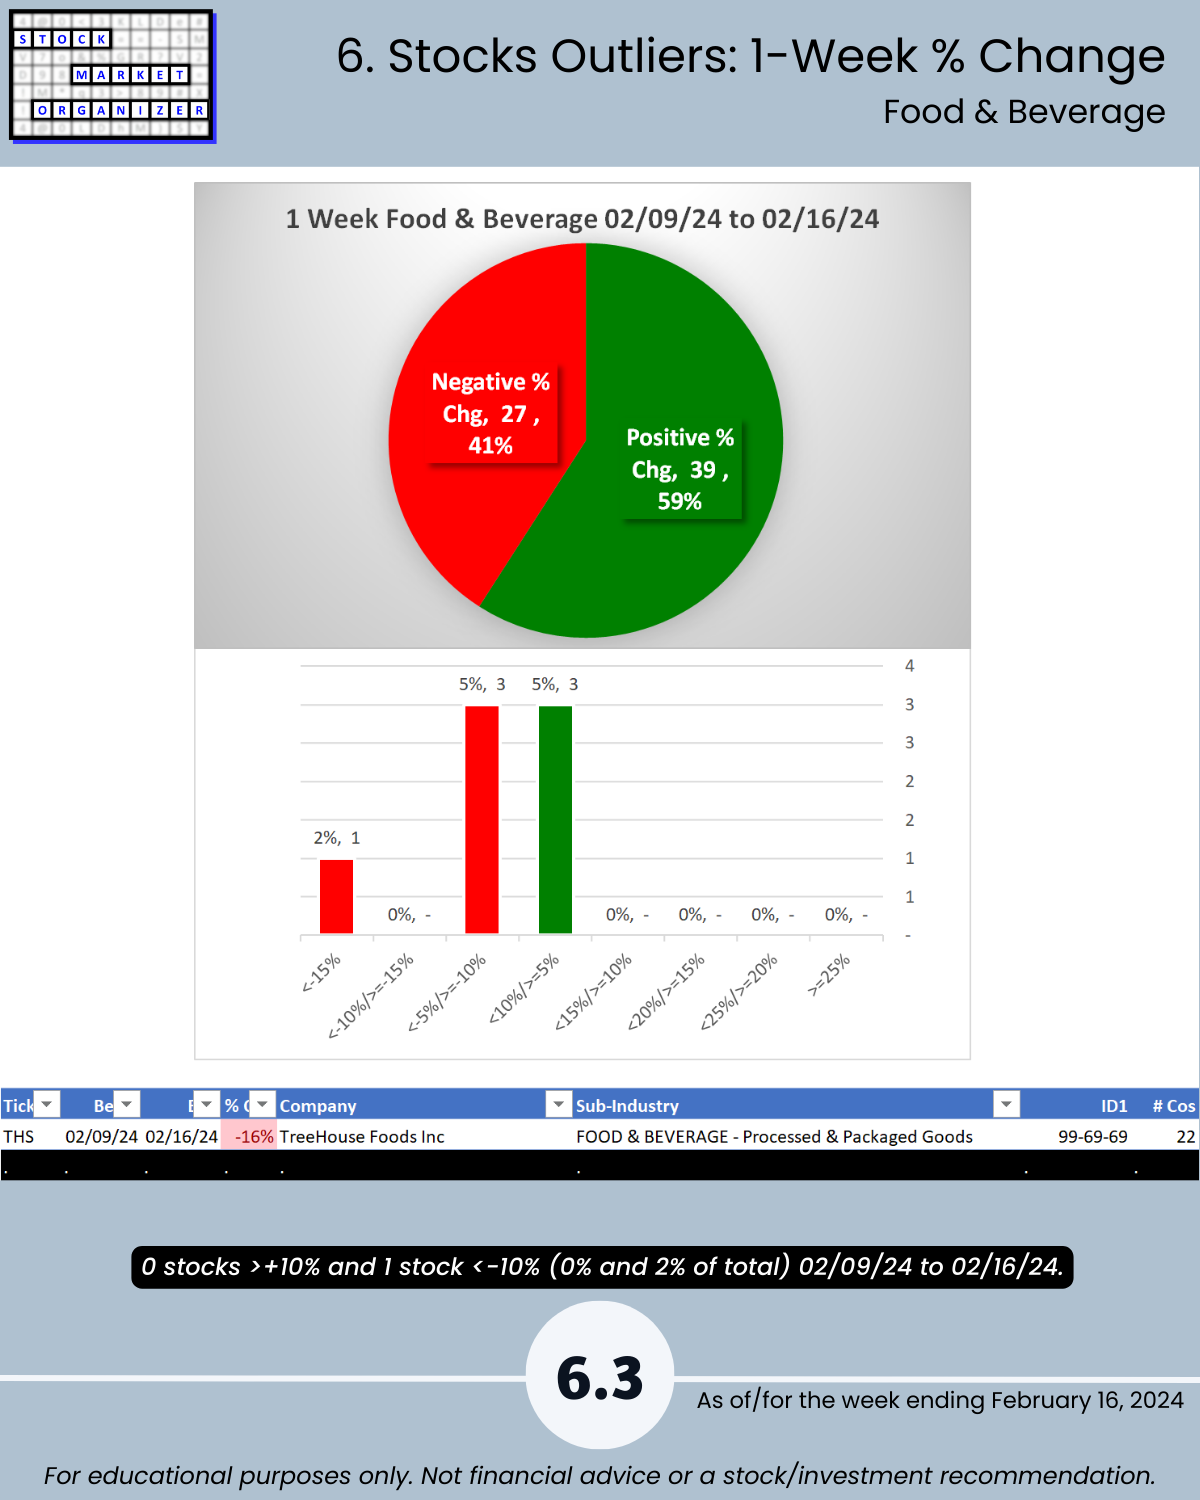
🔹 Weakest Industry: Food & Beverage (WEAKENED this week) (Weak, 6th strongest)
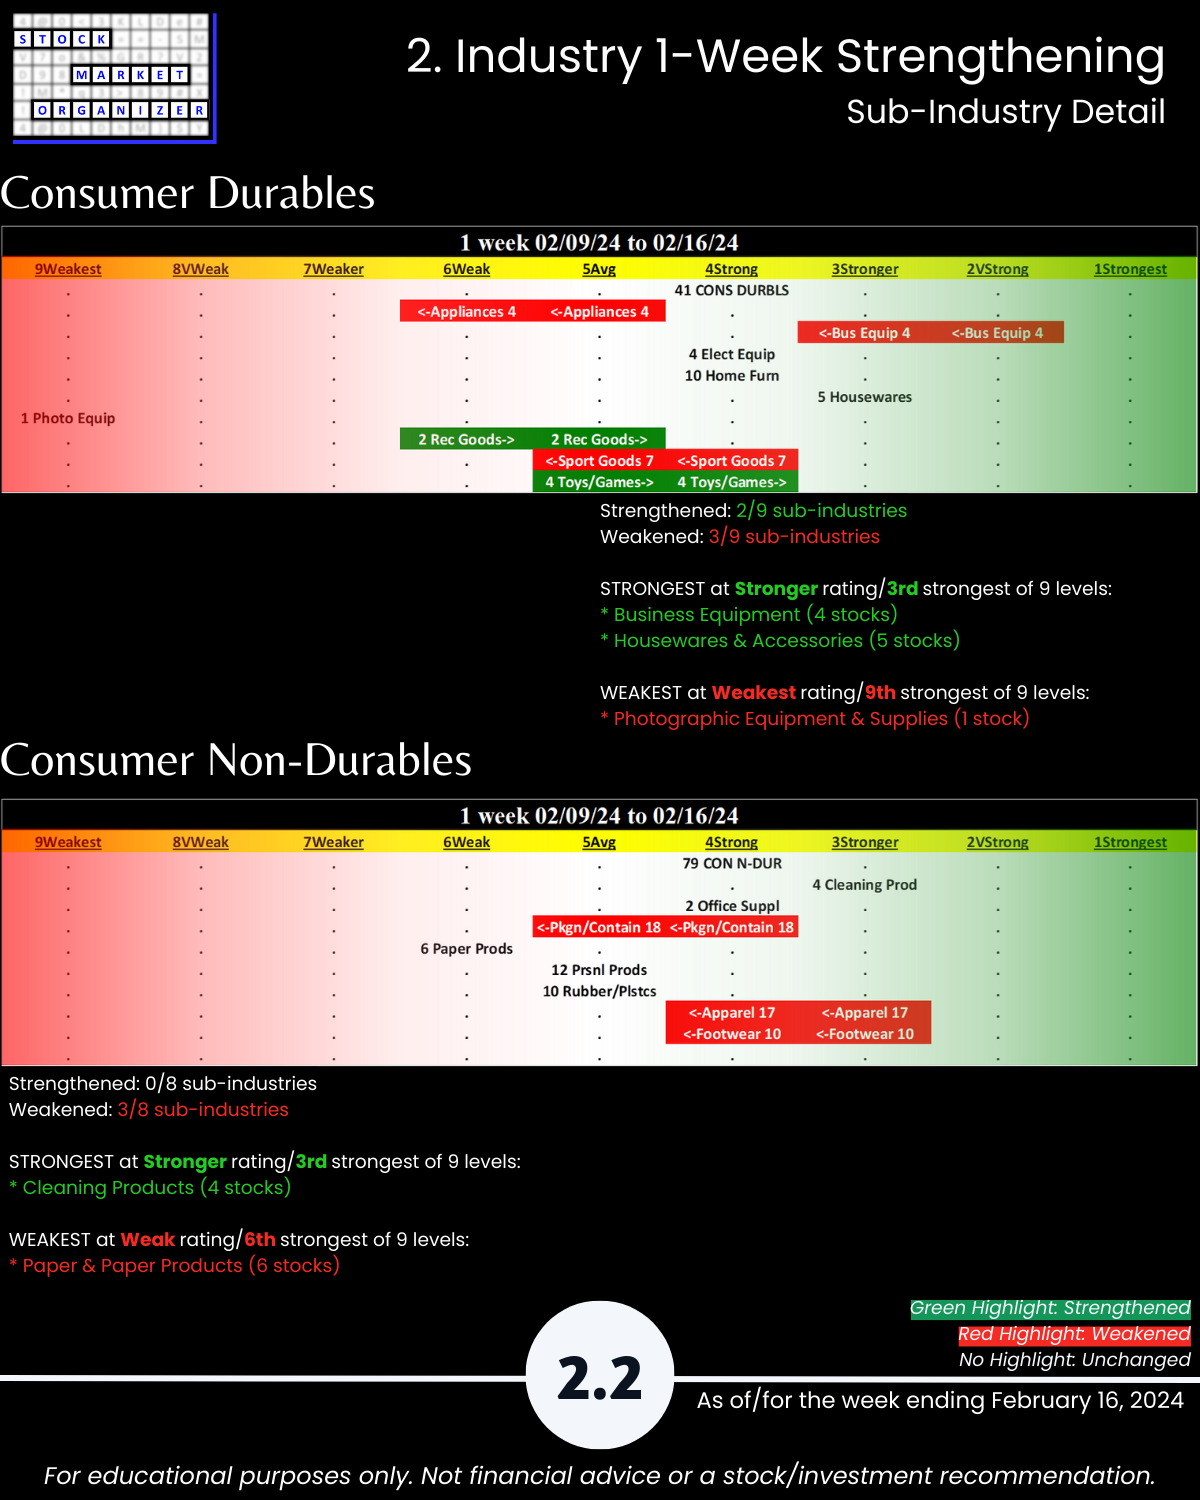
🔹 Sub-industries (41): 10% Strengthened, 24% Weakened
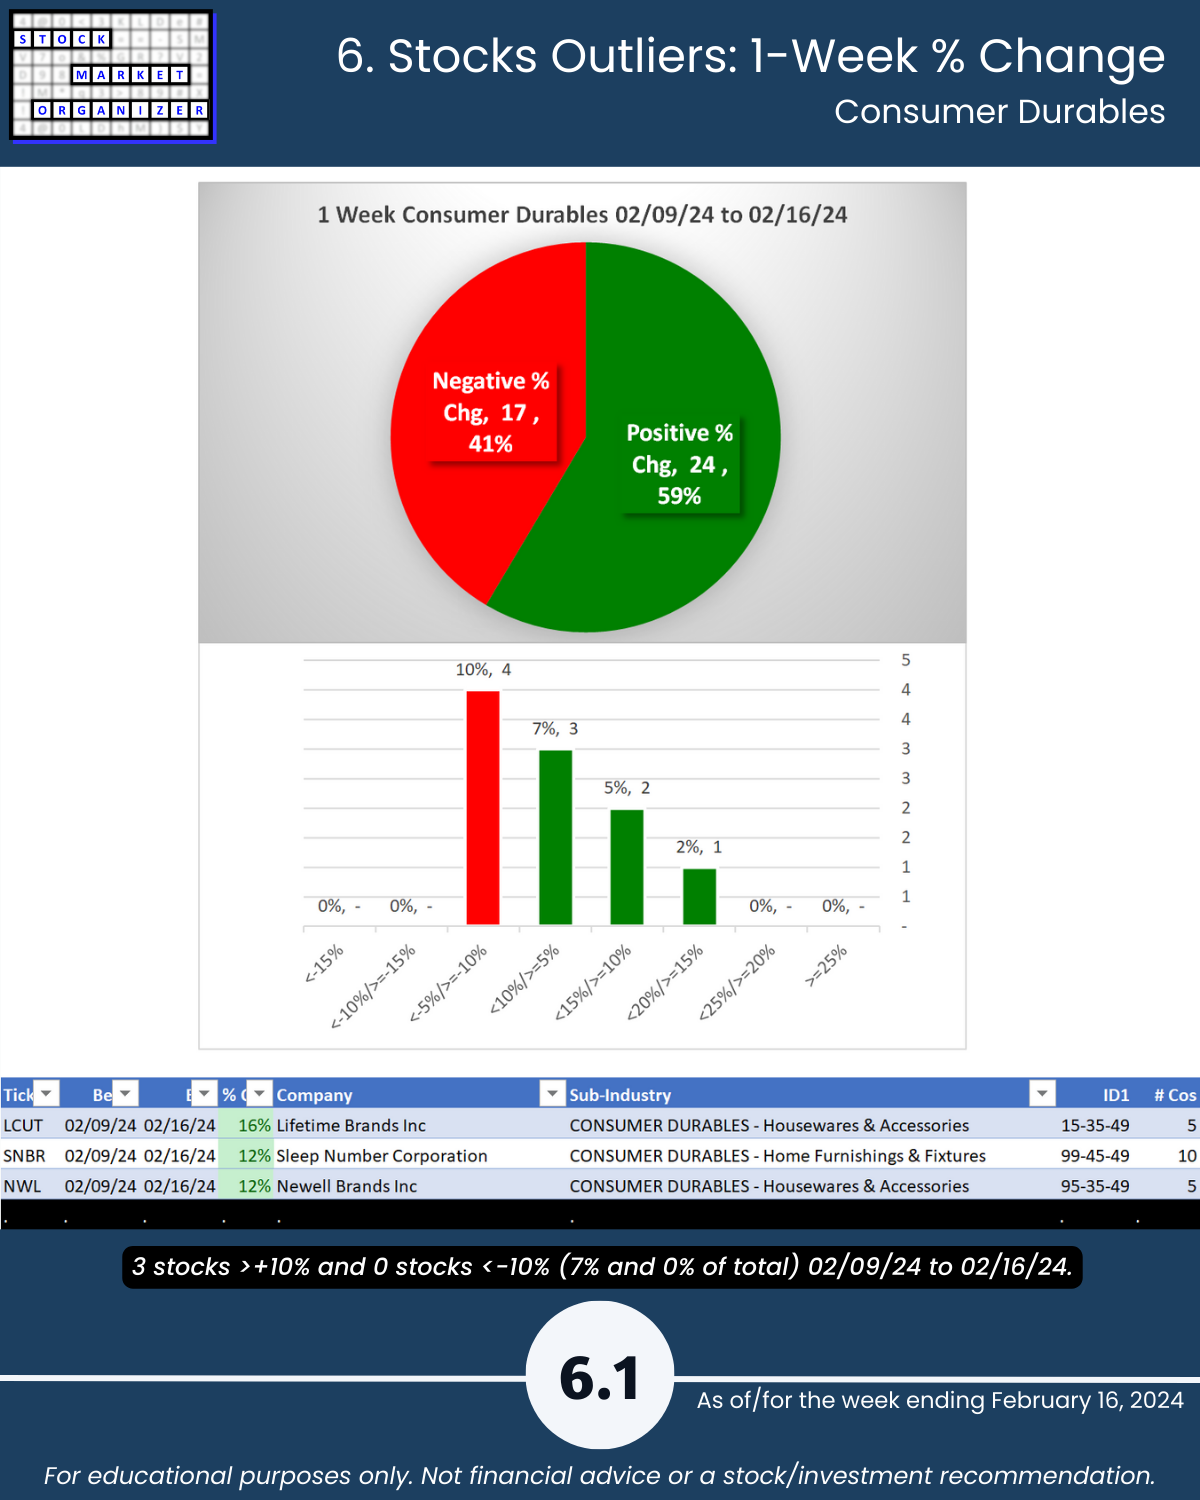
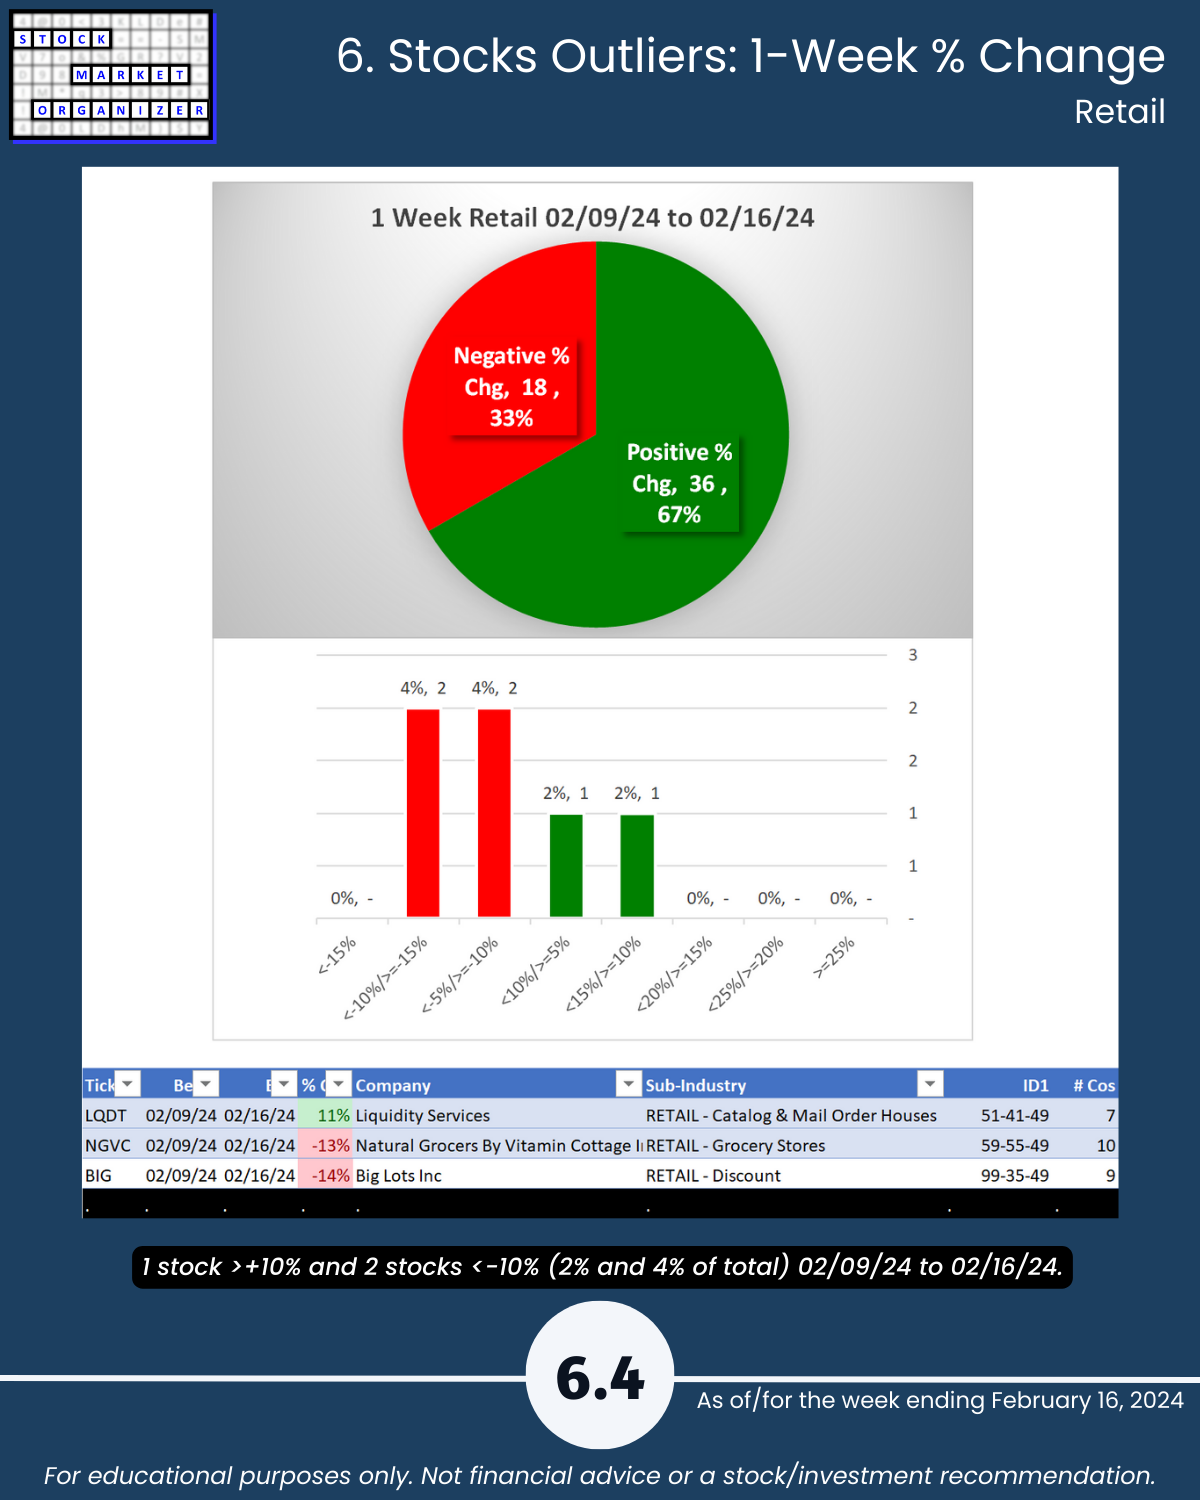
🔹 Stocks rated Strongest:Weakest: Consumer Durables 49%:20% of total, Retail 48%:15%
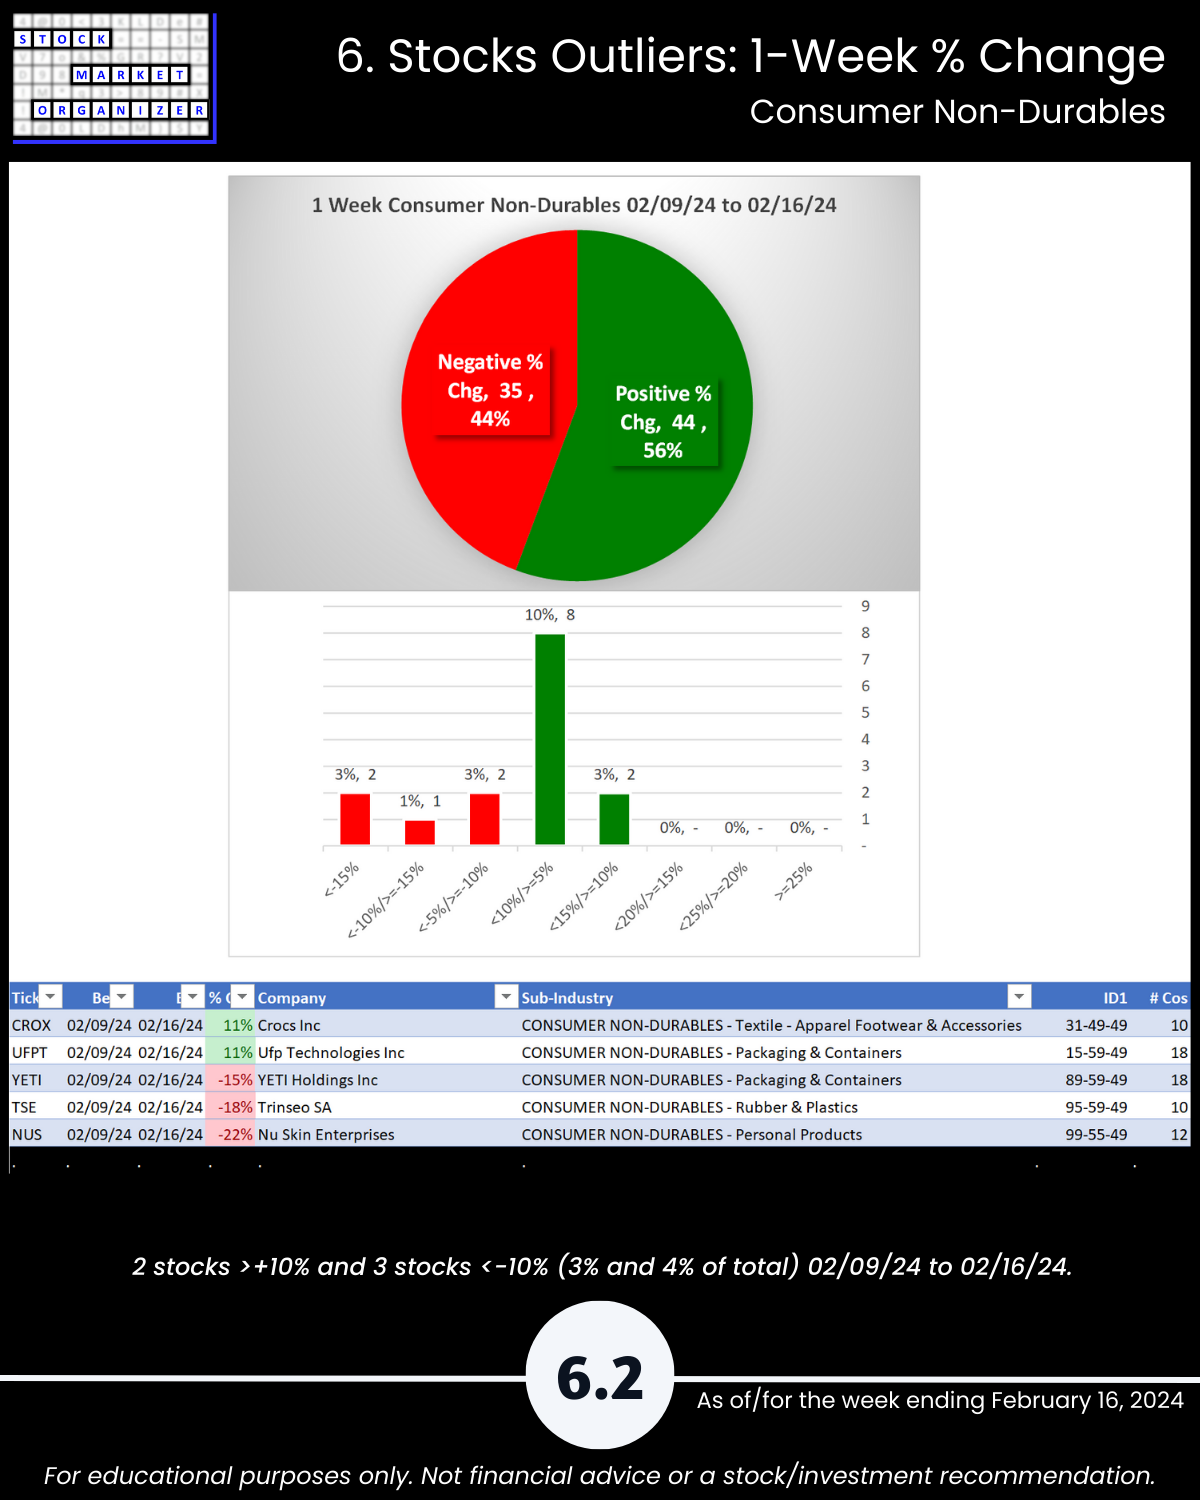
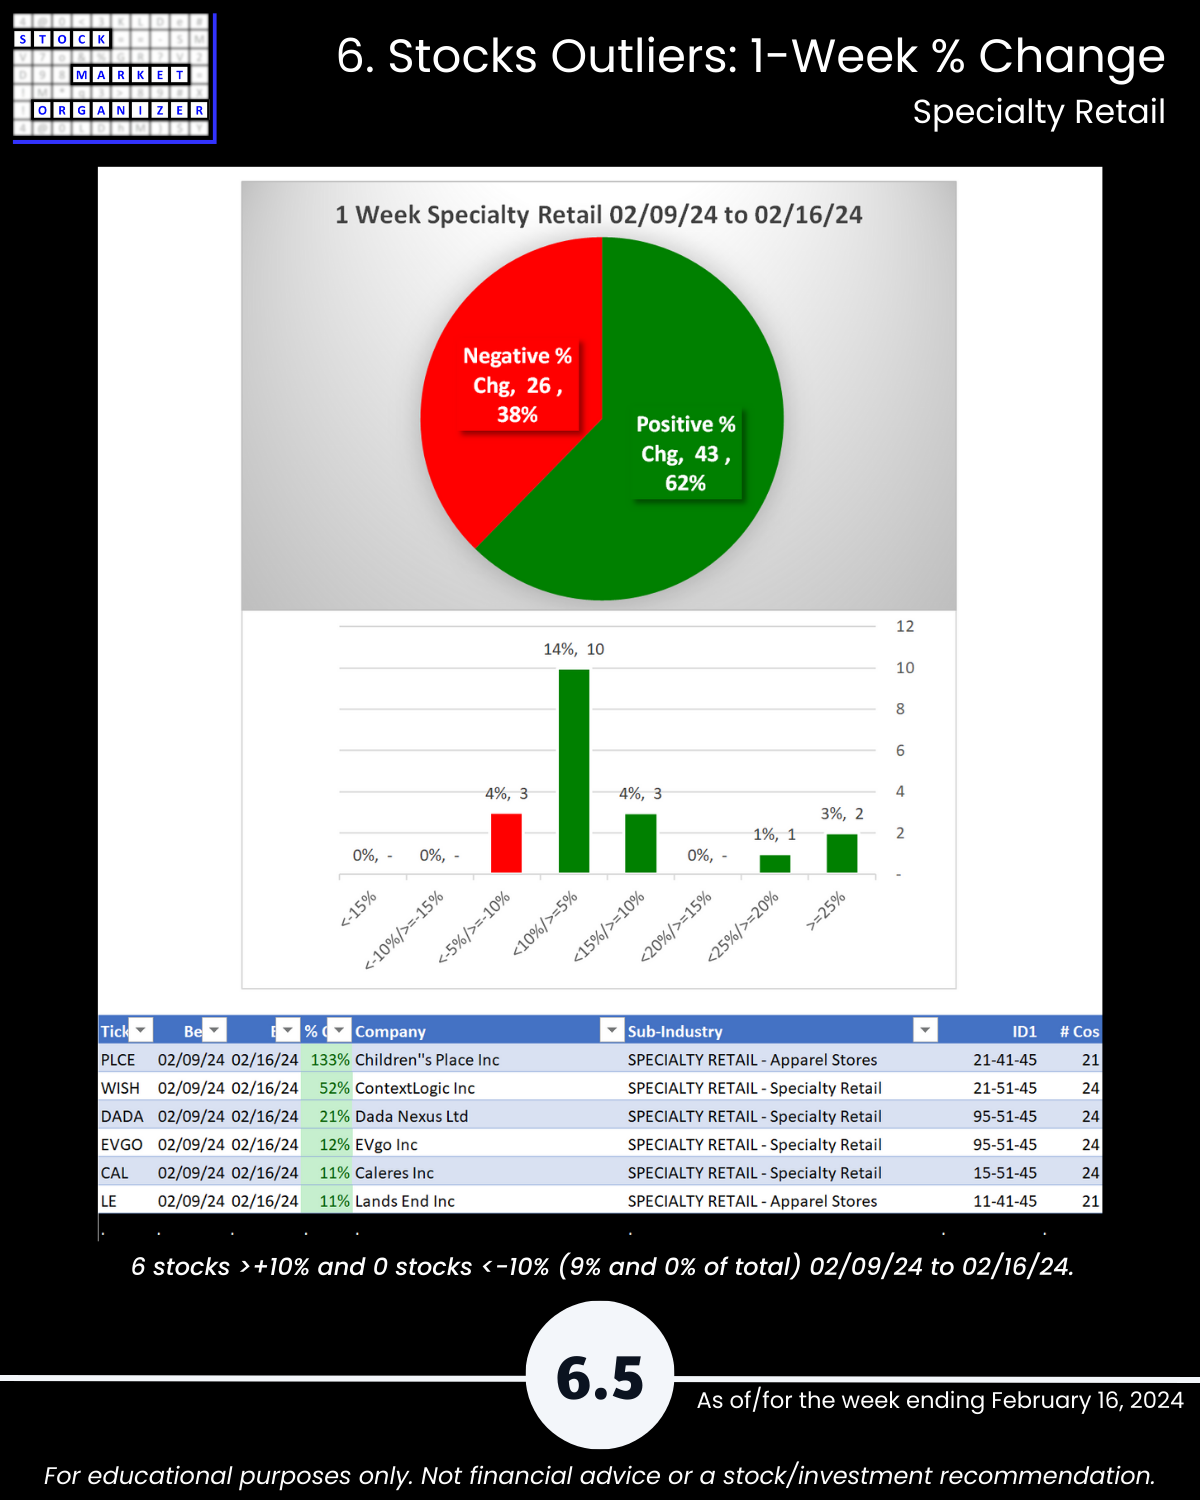
🔹 Outliers: TSE -18%, NUS -22%, PLCE +133%, WISH +52%, DADA +21%
YOU’LL CARE IF:
You subscribe to the concepts of
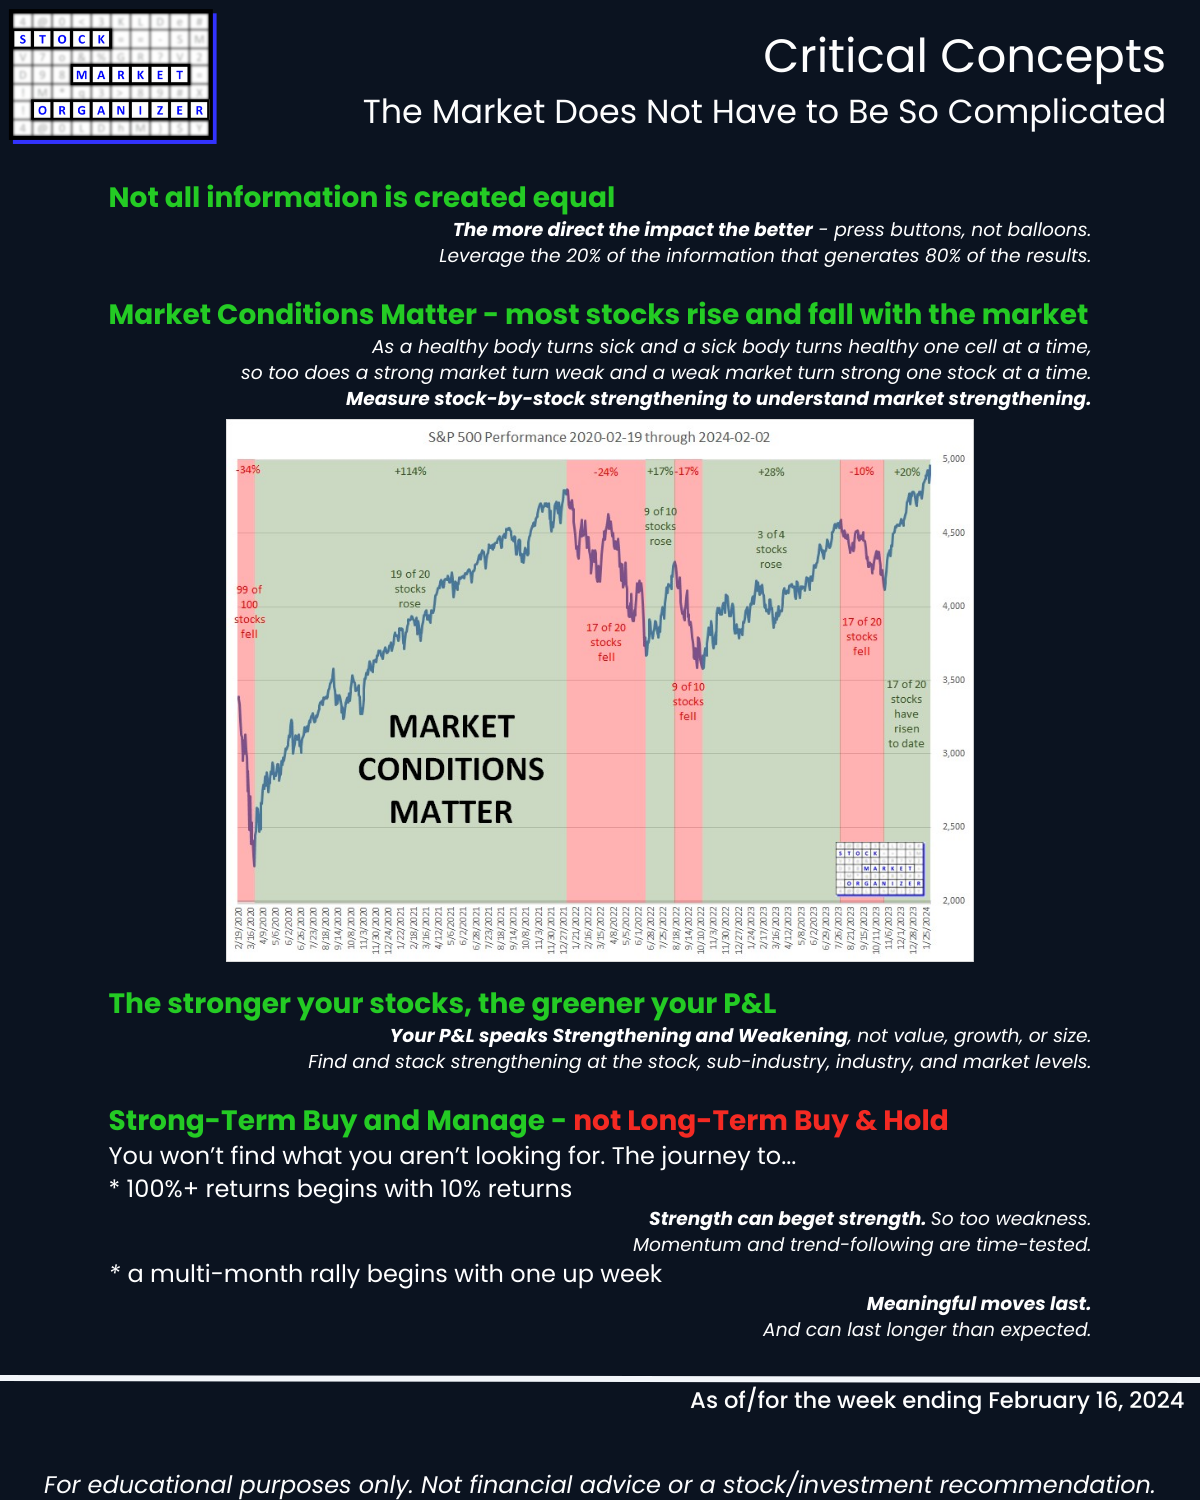
🔹 The stronger your stocks, the greener your P&L, and
🔹 It doesn’t have to be so complicated.
WHAT THIS ANALYSIS CAN TELL YOU:
🔹 The strongest stocks in an industry/sub-industry, proven by their price action to be those which others are favoring.
SO WHAT? See if there are better options than whatever you may currently own.
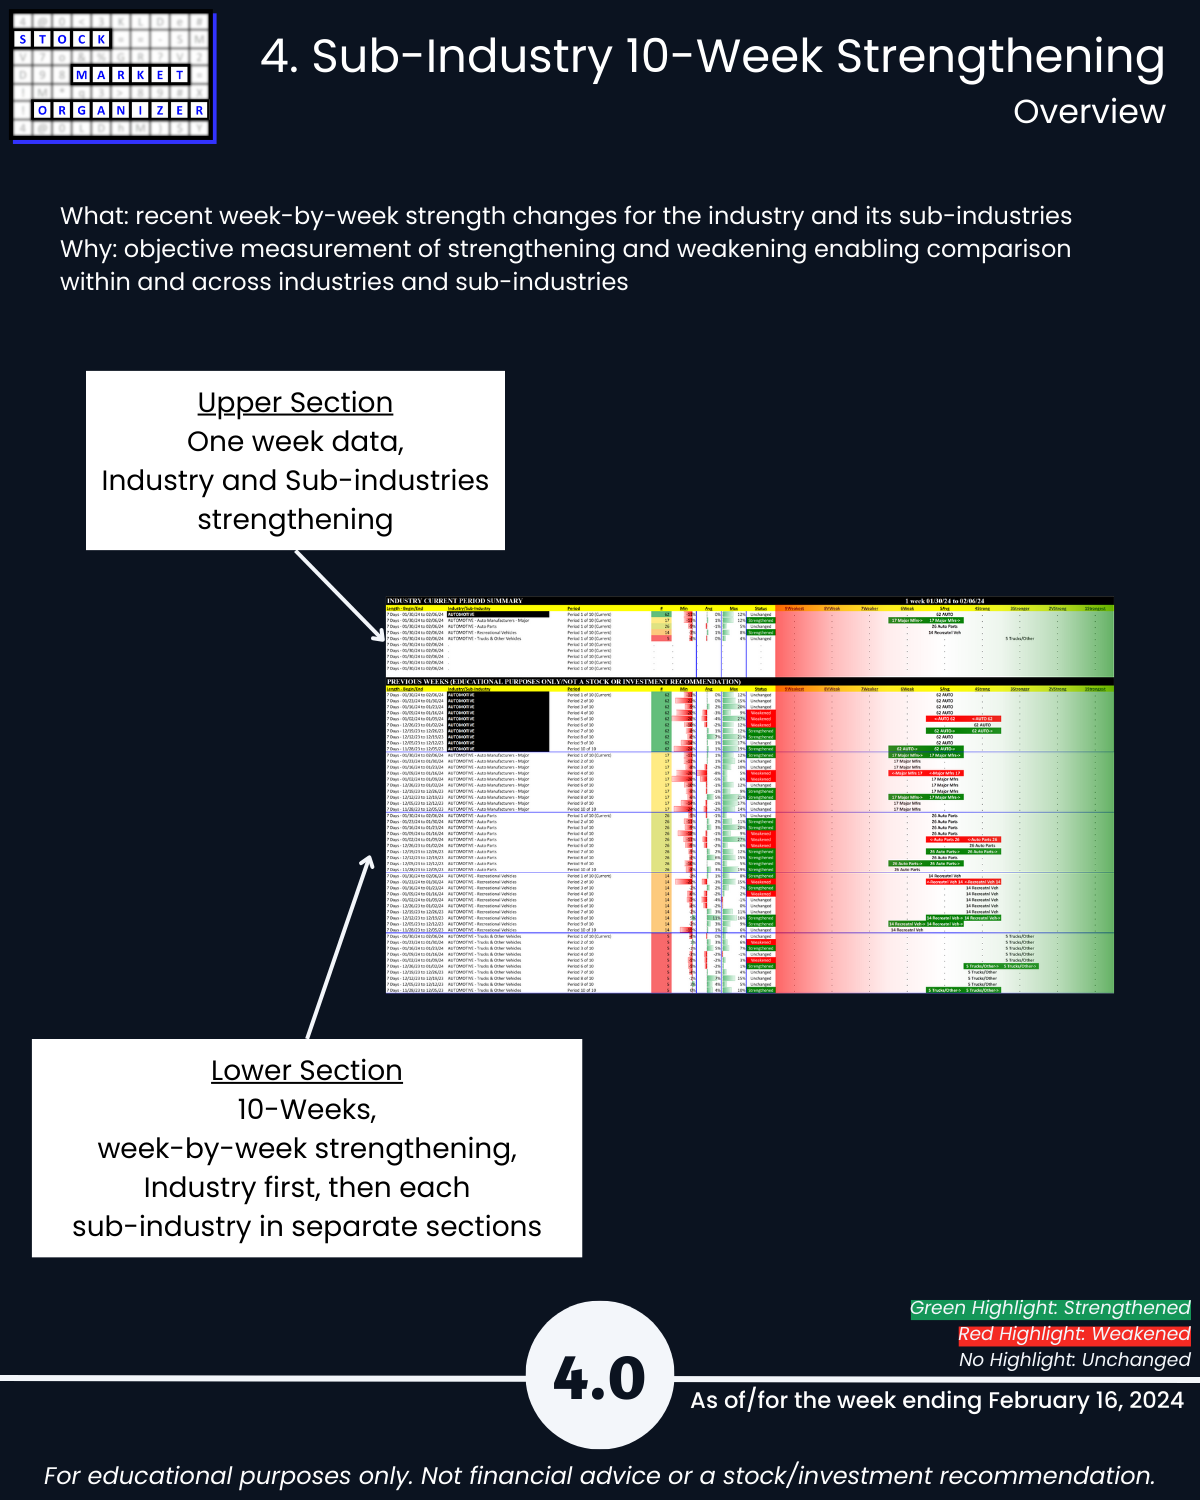
🔹 Objective strengthening measurements of all stocks in a sub-industry and industry.
SO WHAT? Quickly see the best and worst stocks and ignore the rest.
🔹 If a stock’s sub-industry and industry are currently strengthening.
SO WHAT? Know if the sub-industry and industry currently support new entries, or if you are better off waiting.
🔹 If now is a good time for new long positions based on current market strengthening or weakening.
SO WHAT? Know if the market currently supports new entries, or if you are better off waiting.
HOW?
By tracking strengthening and weakening from the individual stock level up through the market level.
This report may particularly be of interest if the following 5 concepts resonate with you:
- The stronger your stocks, the greener your P&L.
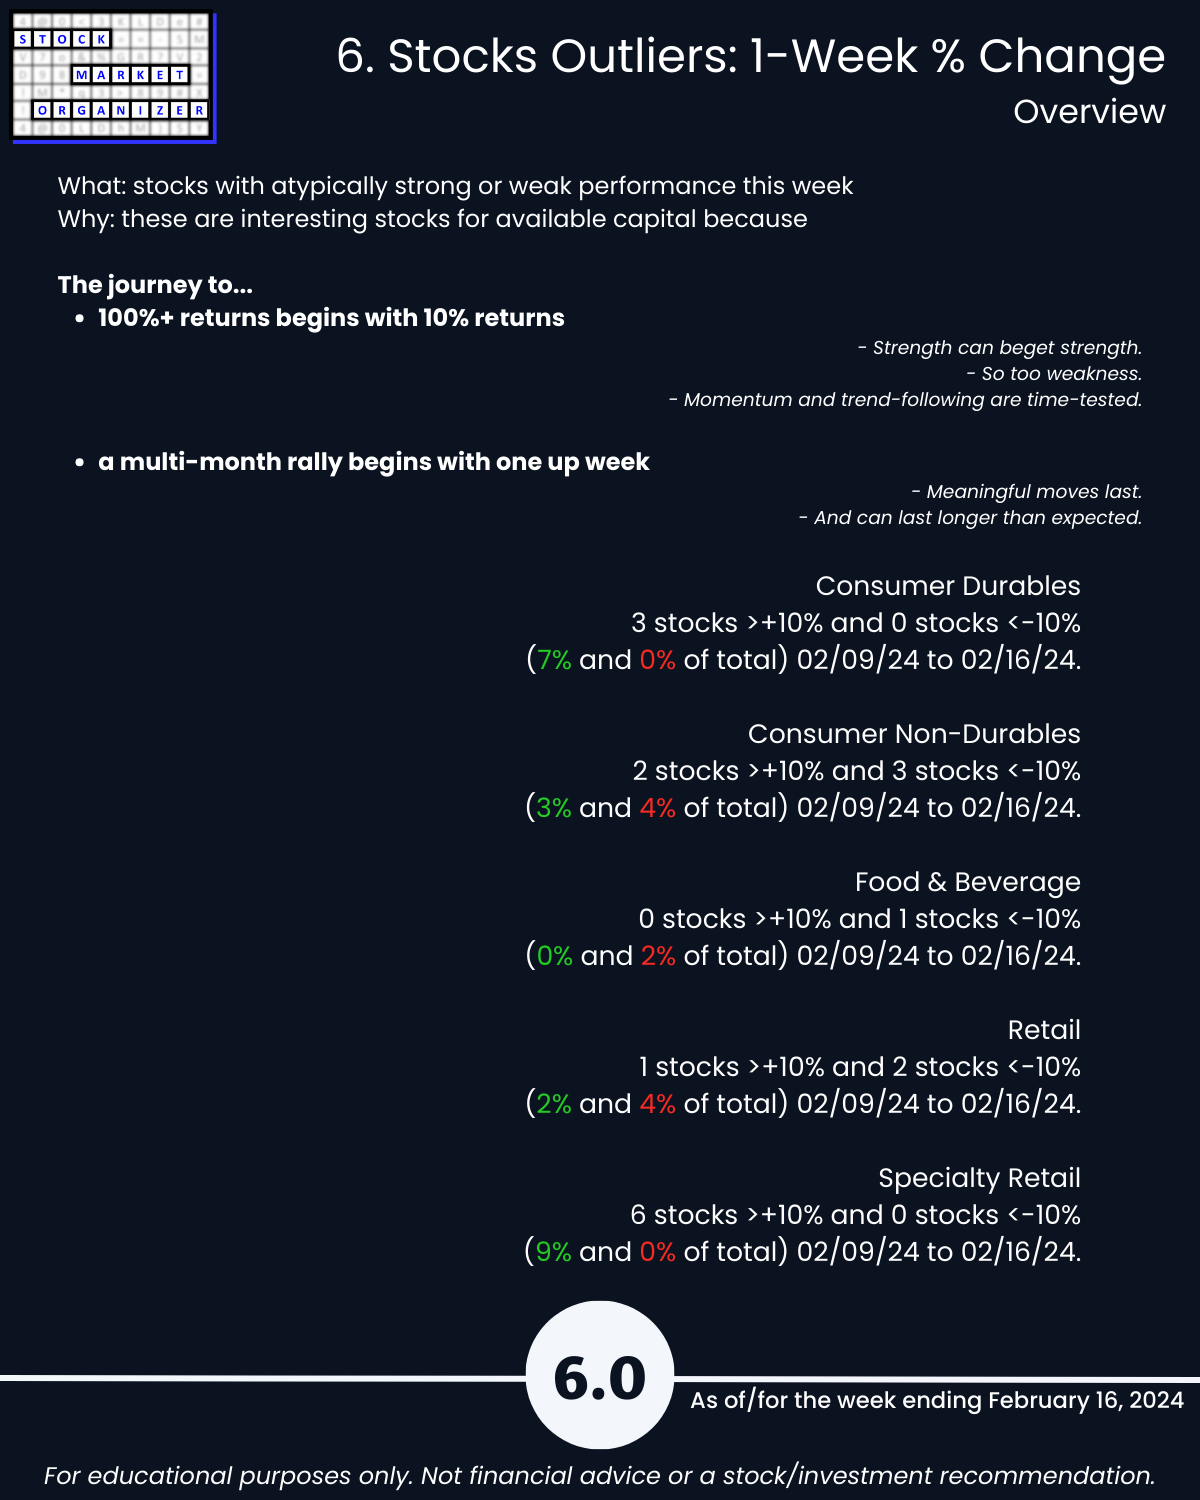
- The journey to 100%+ returns begins with 10% returns.
- The journey to a multi-month rally begins with one up week.
- Most stocks do what the market does. (While the market can only do what its underlying stocks, sub-industries, and industries do.)
- 80/20: not all information is created equal. (Press buttons, not balloons.)
Following are galleries with page-by-page views of this report.
1. Introduction
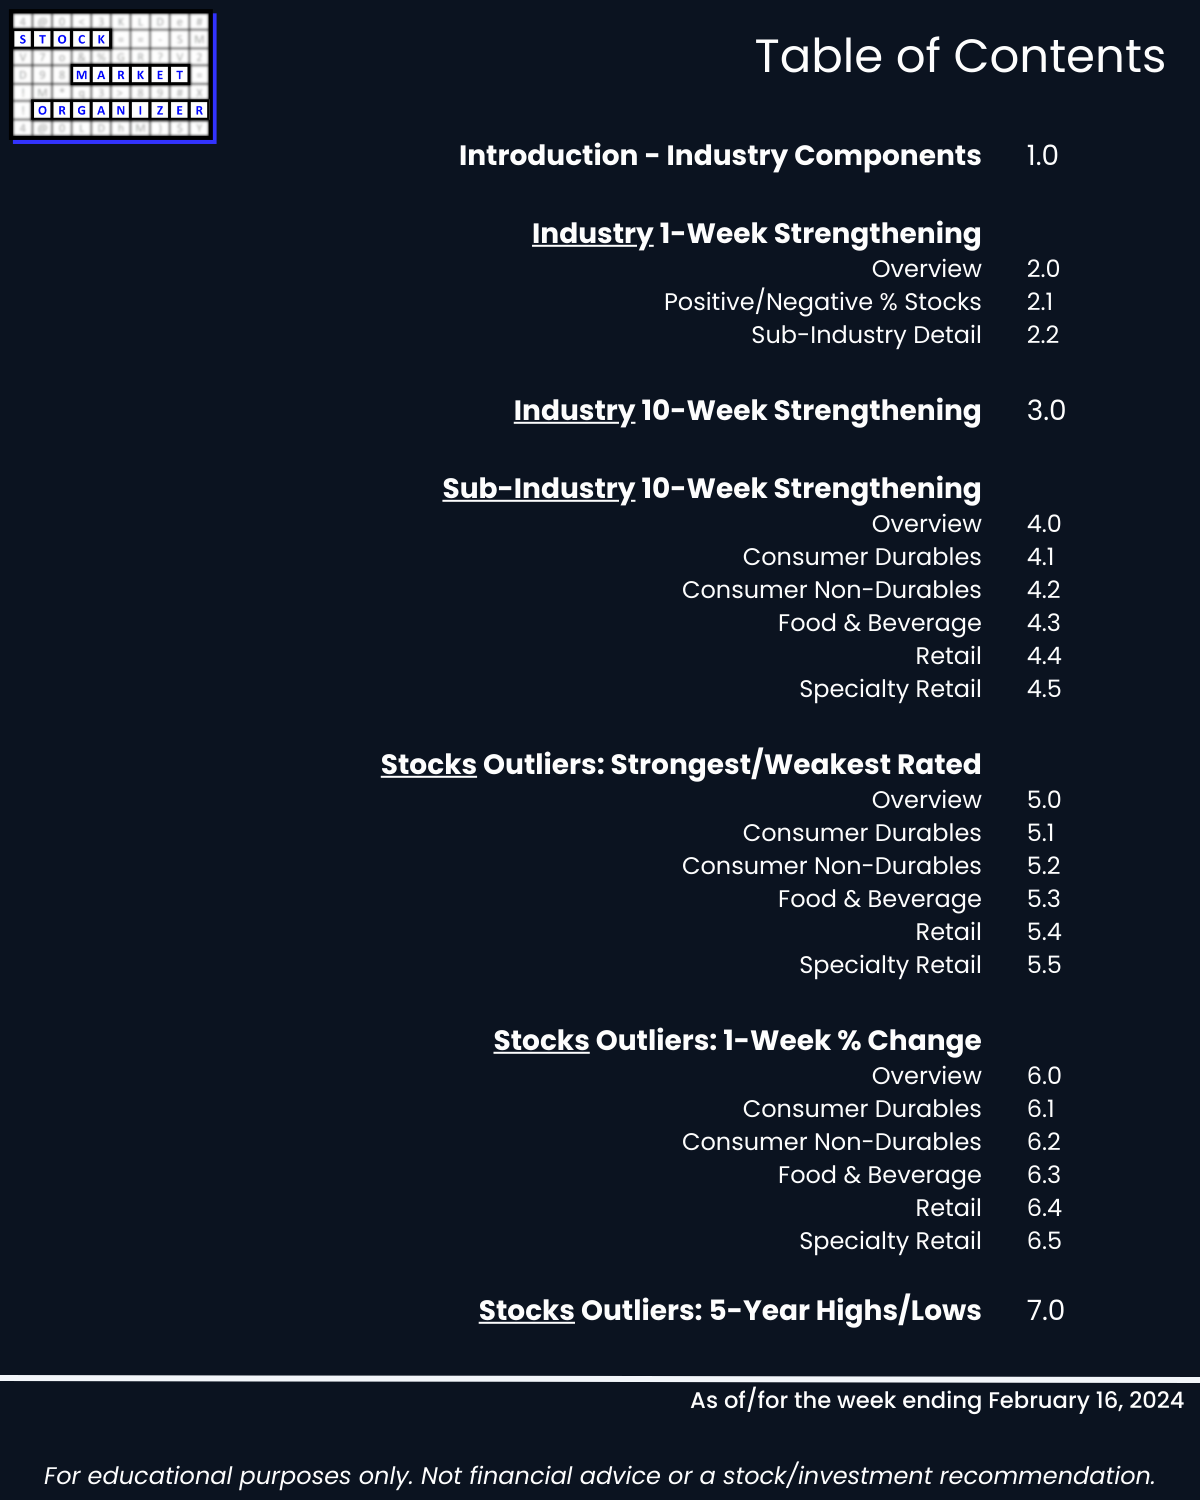
2. Industry 1-Week Strengthening
3. Industry 10-Week Strengthening
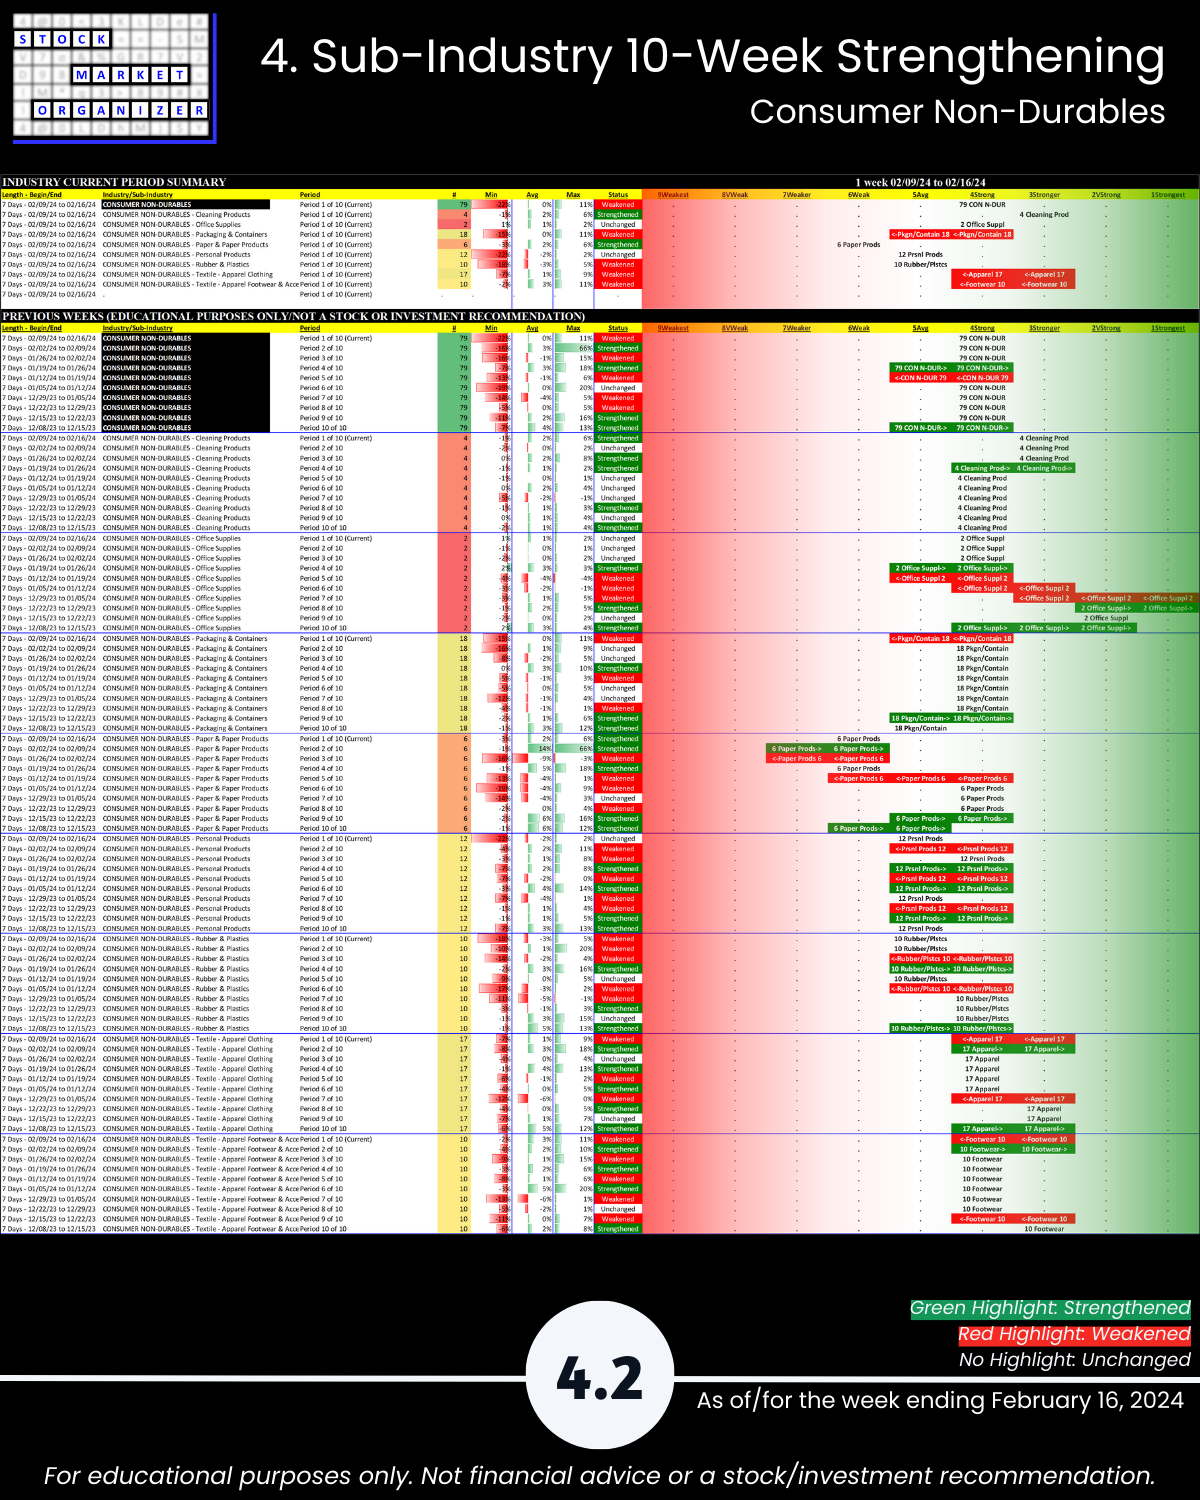
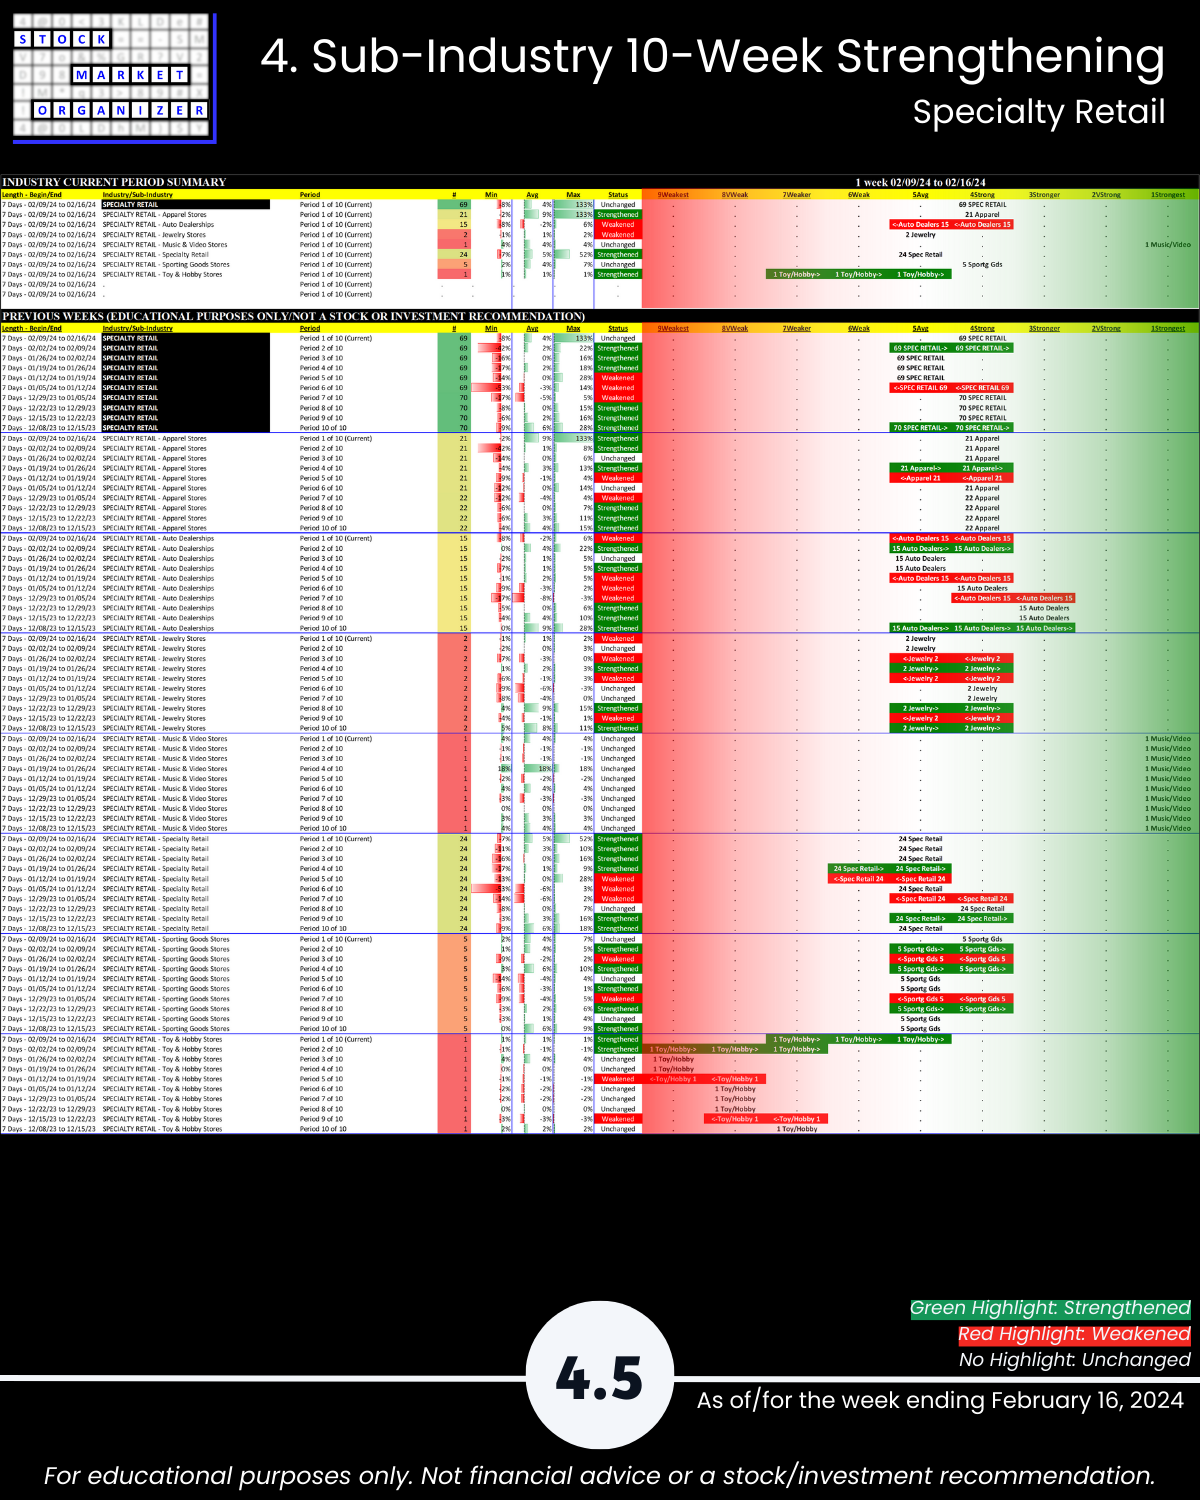
4. Sub-industry 10-Week Strengthening
5. Stocks Outliers: Strongest/Weakest Rated
6. Stocks Outliers: 1-Week % Change
7. Stocks Outliers: 5-Year Highs/Lows