SMO Exclusive: Stock Report 2023-11-17
Did you know? Past week = huge change in strengthening vs. weakening stocks, sub-industries, and industries.
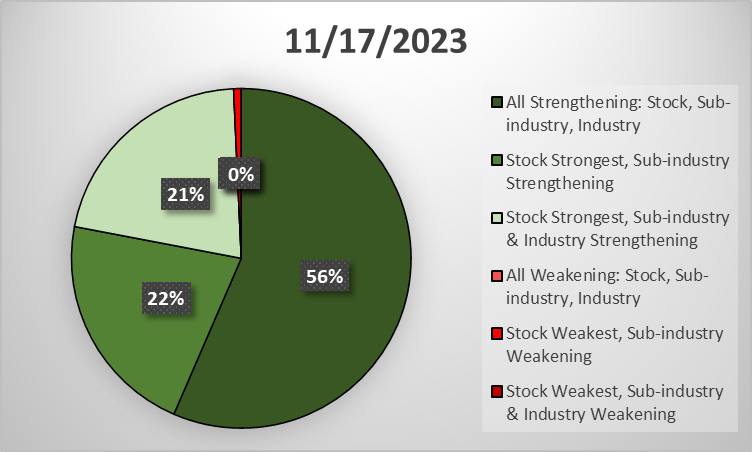
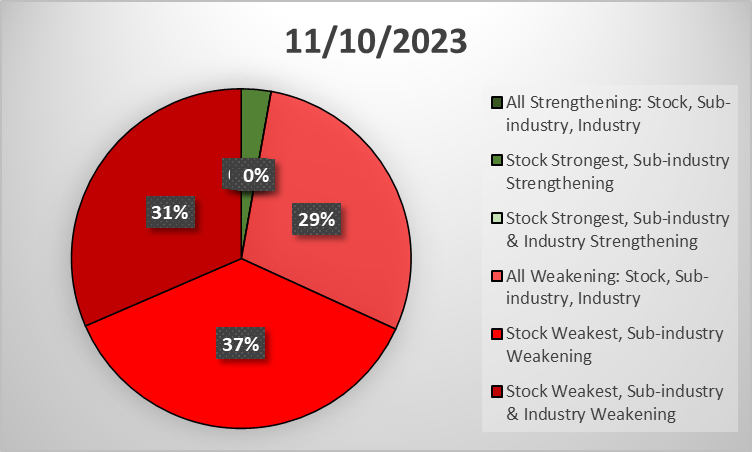
The pie charts below reveal (among other strengthening statistics) that 56% of stocks are now strengthening in strengthening sub-industries and strengthening industries vs. 0% for the previous week ending 11/10/23.
Here's a text summary of the above:
Category —///—Week ending 11/10/23 vs. 11/17/23:
1. All Strengthening: Stock, Sub-industry, Industry —///—0% vs. 56%
2. Stock Strongest, Sub-industry Strengthening —///—3% vs. 22%
3. Stock Strongest, Sub-industry & Industry Strengthening —///—0% vs. 21%
4. All Weakening: Stock, Sub-industry, Industry —///—29% vs. 0%
5. Stock Weakest, Sub-industry Weakening —///—27% vs. 1%
6. Stock Weakest, Sub-industry & Industry Weakening —///—31% vs. 0%
What’s happening beneath the surface of the market indexes? Strengthening and weakening – at the Sector, Industry, Sub-Industry, and Stock levels.
Why do you care? Because this makes it possible to find Strong stocks in strengthening Sub-Industries and strengthening Industries. Or Weak stocks in weakening Sub-Industries and weakening Industries.
Below: a sample report listing
A. Category 3 = Stocks rated Strongest in Strengthening Industries and Strengthening Sub-industries
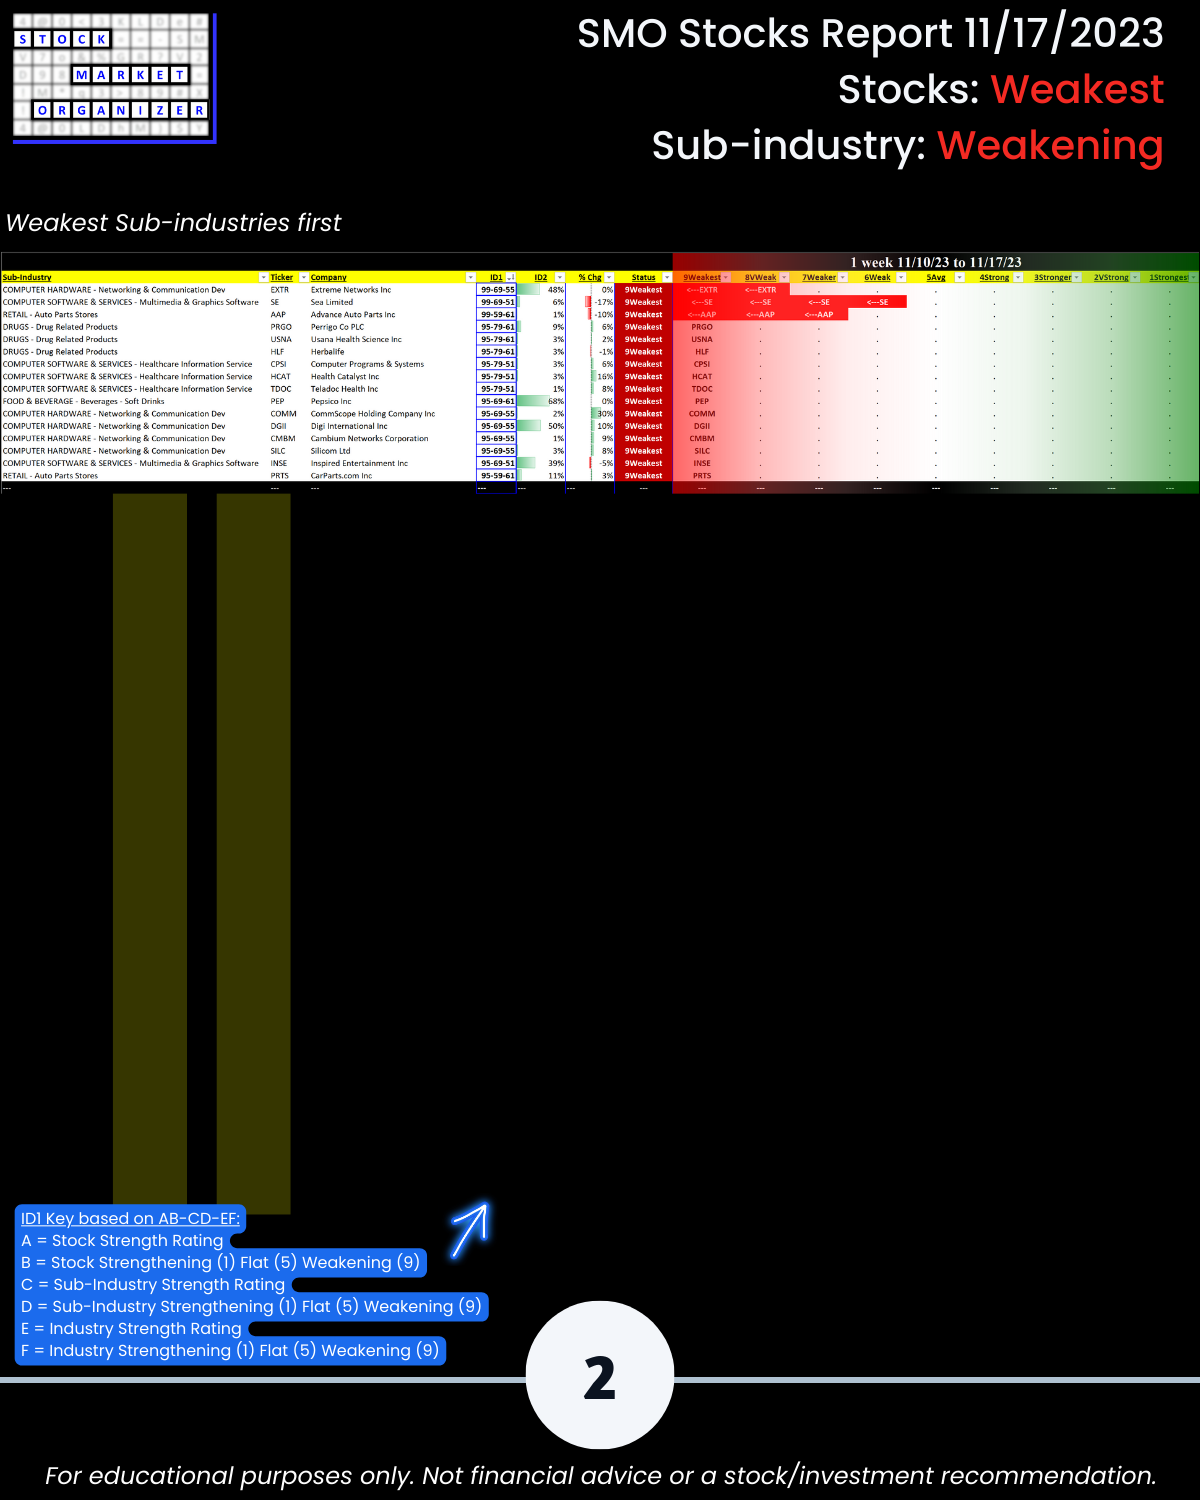
B. Category 5 = Stocks rated Weakest in Weakening Sub-Industries
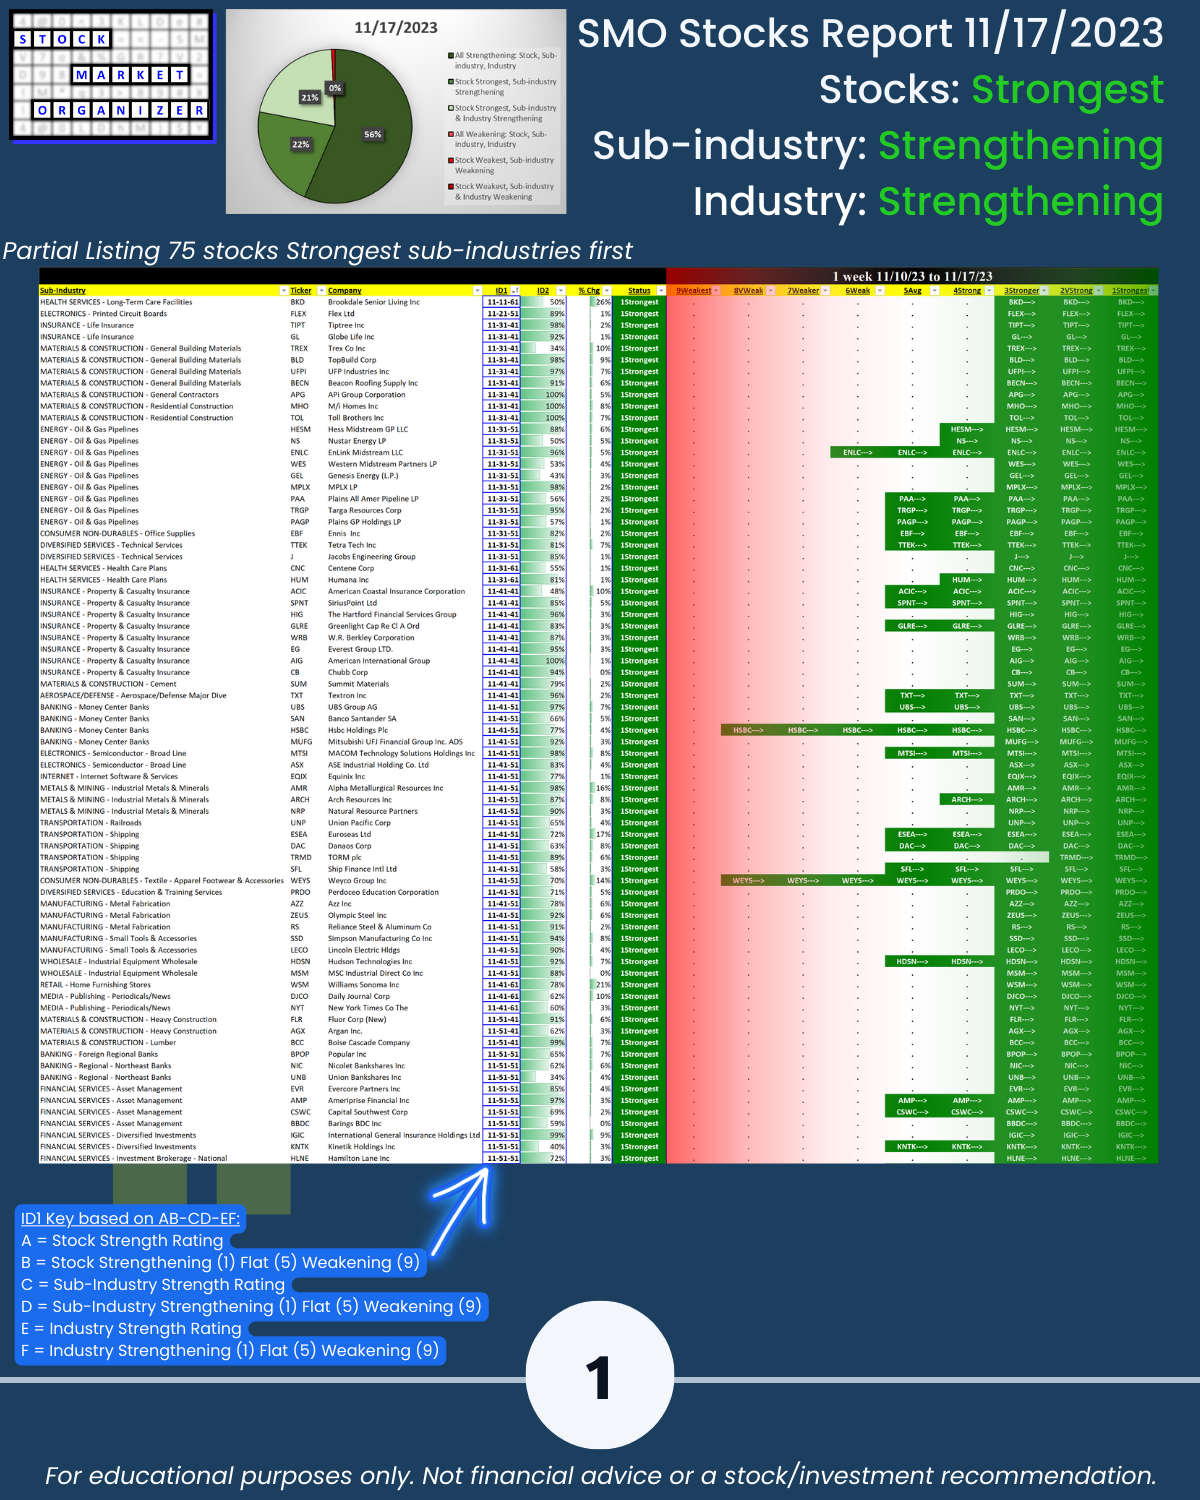
This information is usable regardless of your style.
🔹 Like going with the trend? Look in A. above for longs and B. above for shorts.
🔹 Mean reverter? Look in B. above for longs and A. above for shorts. (It’s not my style.)
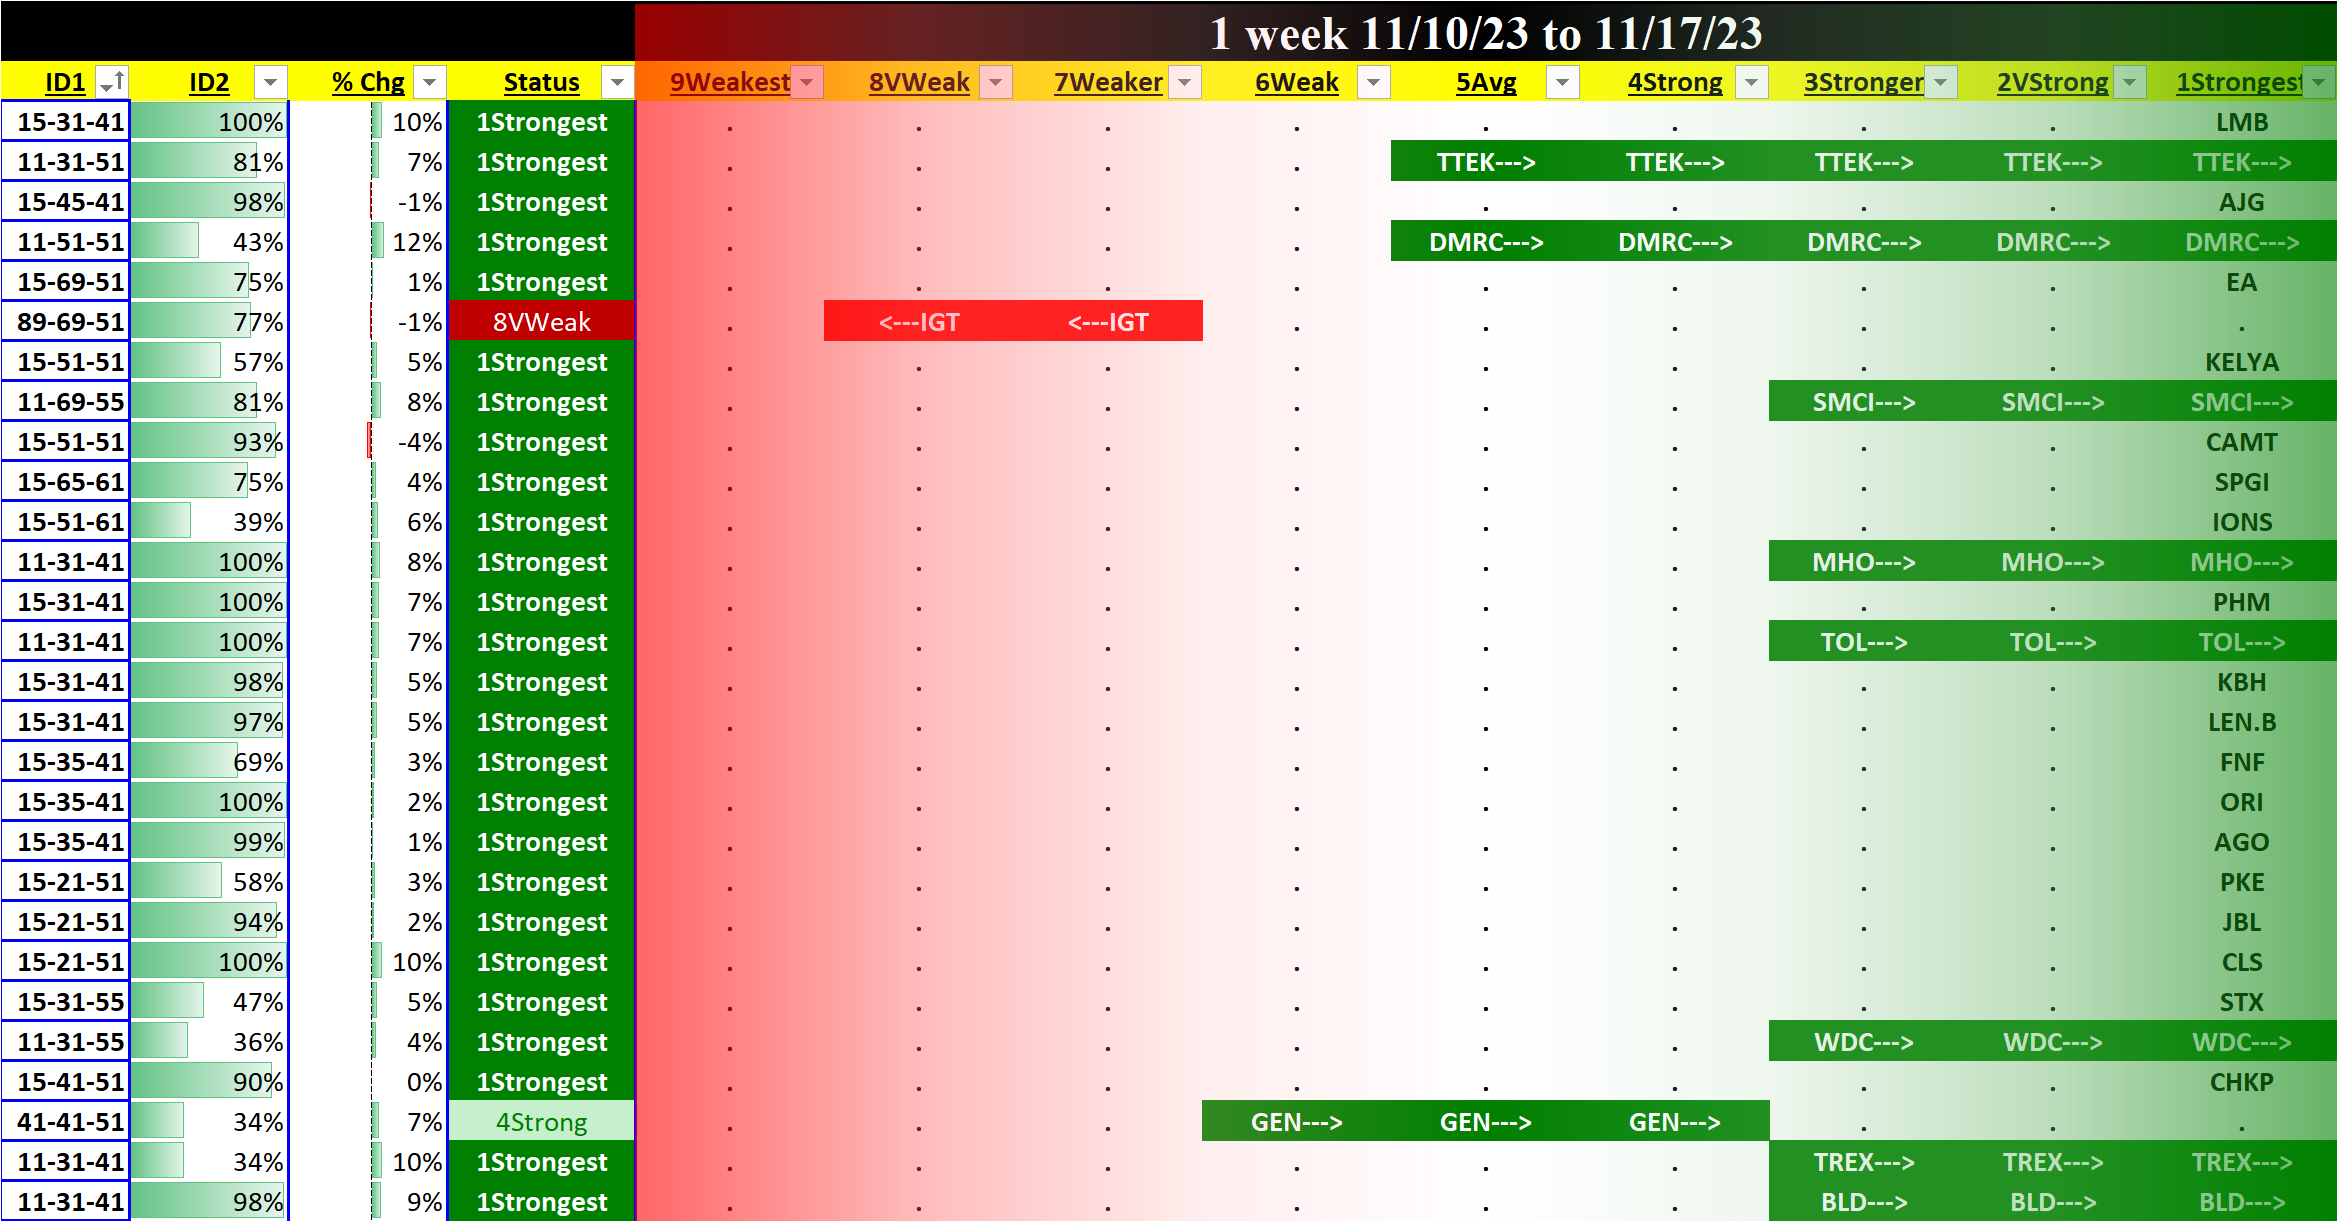
Key Instructions
Focus on the ID1 Key column based on AB-CD-EF digits where:
A = Stock Strength Rating
B = Stock Strengthening (1) Flat (5) Weakening (9)
C = Sub-Industry Strength Rating
D = Sub-Industry Strengthening (1) Flat (5) Weakening (9)
E = Industry Strength Rating
F = Industry Strengthening (1) Flat (5) Weakening (9)
An 11-35-69 stock is
- rated Strongest (strongest of 9 strength levels) and is STRENGTHENING,
- is in a sub-industry rated Stronger (3rd strongest) and is FLAT, and
- is in an industry rated Weak (6th strongest) and is WEAKENING
Suggestion
I go with the flow (the trend) so I would use A. to find longs when the market is strengthening and B. to find shorts when the market is weakening.
Most stocks do what the market does. BUT – by definition, the market can only do what its underlying stocks do. So, one way to discern overall market trend – in my world, strengthening vs. weakening – is to measure individual stock strengthening and weakening, then aggregate this into objective perspectives of Sub-industry, Industry, Sector, and Market strengthening and weakening.
The suggestion? Look to the two reports linked below to discern where there is strengthening in the market and its components, and to in turn determine exactly when and when not to open new long and short positions:
🔹 SMO Current Market Status Report 2023-11-17
🔹 SMO 10 Week Industry Strength Report 2023-11-17