SMO Exclusive: SPDR Sector ETFs Strength Report Tuesday 2025-01-21 Strengthened +0.6 to 4.5 Strength Score

This post consists of the following five sections:
I. Introduction
II. Weekly Returns
III. Spectrum Graph Analysis
IV. Today's Market Context
V. Detailed Sector ETF Analysis
Last Tuesday's report is available here.
I. Introduction
Background
This analysis consists of the Stock Market Organizer stock-by-stock strength analysis applied to the 500 stocks that comprise the 11 SPDR Select ETFs.
These results are combined with overall market environment readings - the Market Strength Score and the Sector Risk Gauge, which reflect "risk ON" as of Thursday, January 16, 2025 - to discern appropriate portfolio exposure given prevailing market and sector conditions.
Why do you care?
This dynamic market analysis provides a continuously updated, apples-to-apples comparison of the strengthening and weakening trends in the US market. By tracking the 500 large-cap stocks across 11 key sectors (via SPDR ETFs), this analysis offers valuable insights for investors seeking to harness momentum in their portfolios.
Each week, the analysis clearly identifies which sectors and stocks have gained, remained flat, or lost ground. With this data, investors can objectively assess sector and stock strength, refining their timing and positioning for new investments. Ultimately, this approach aims to enhance long-term portfolio performance by leveraging momentum – a proven market factor – to inform data-driven investment decisions.
Most Important Ranking: Strengthening Status
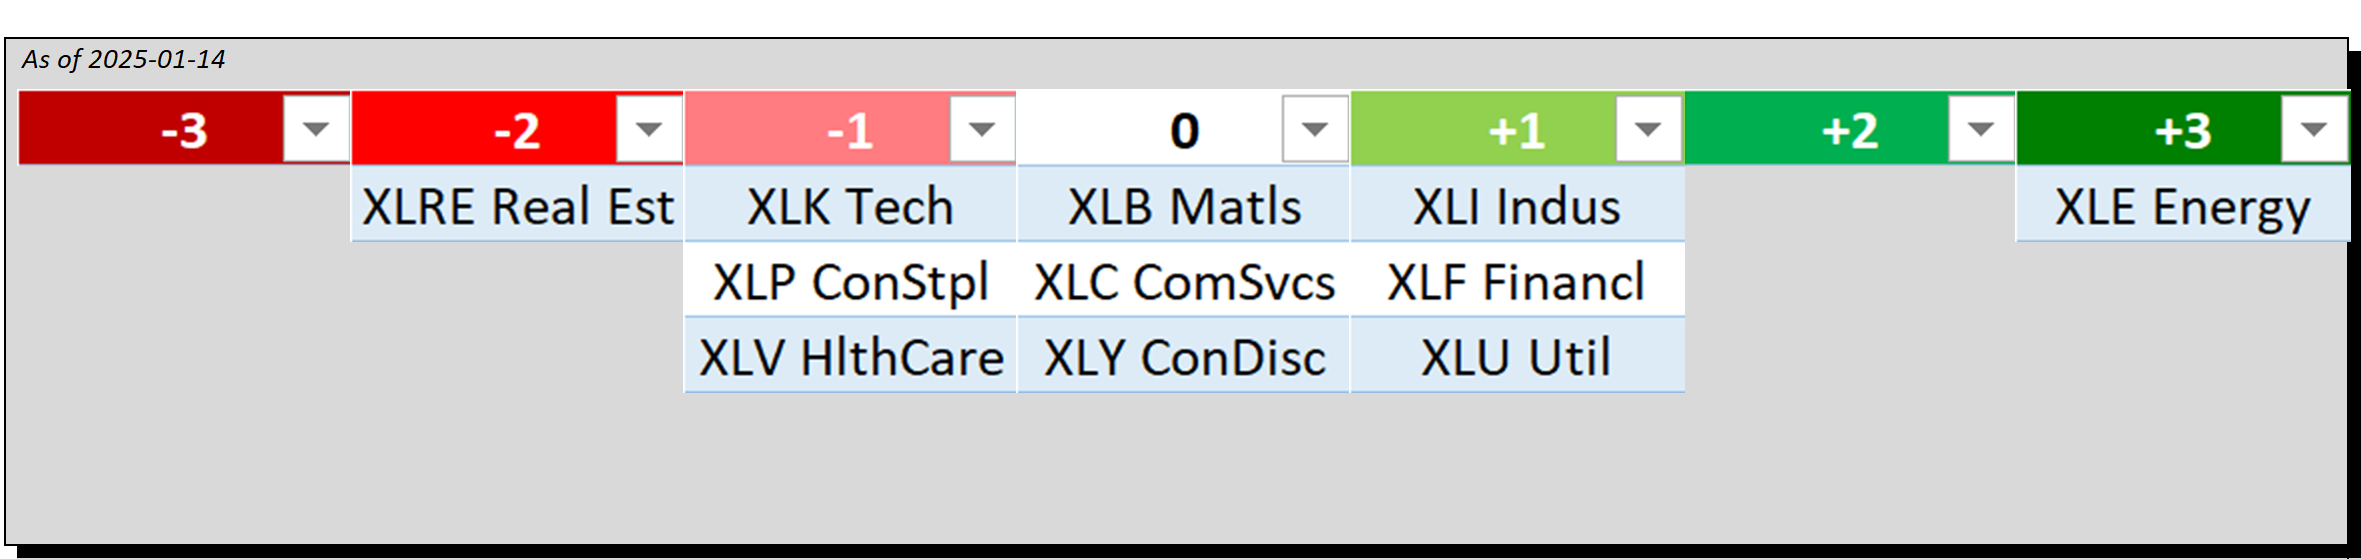
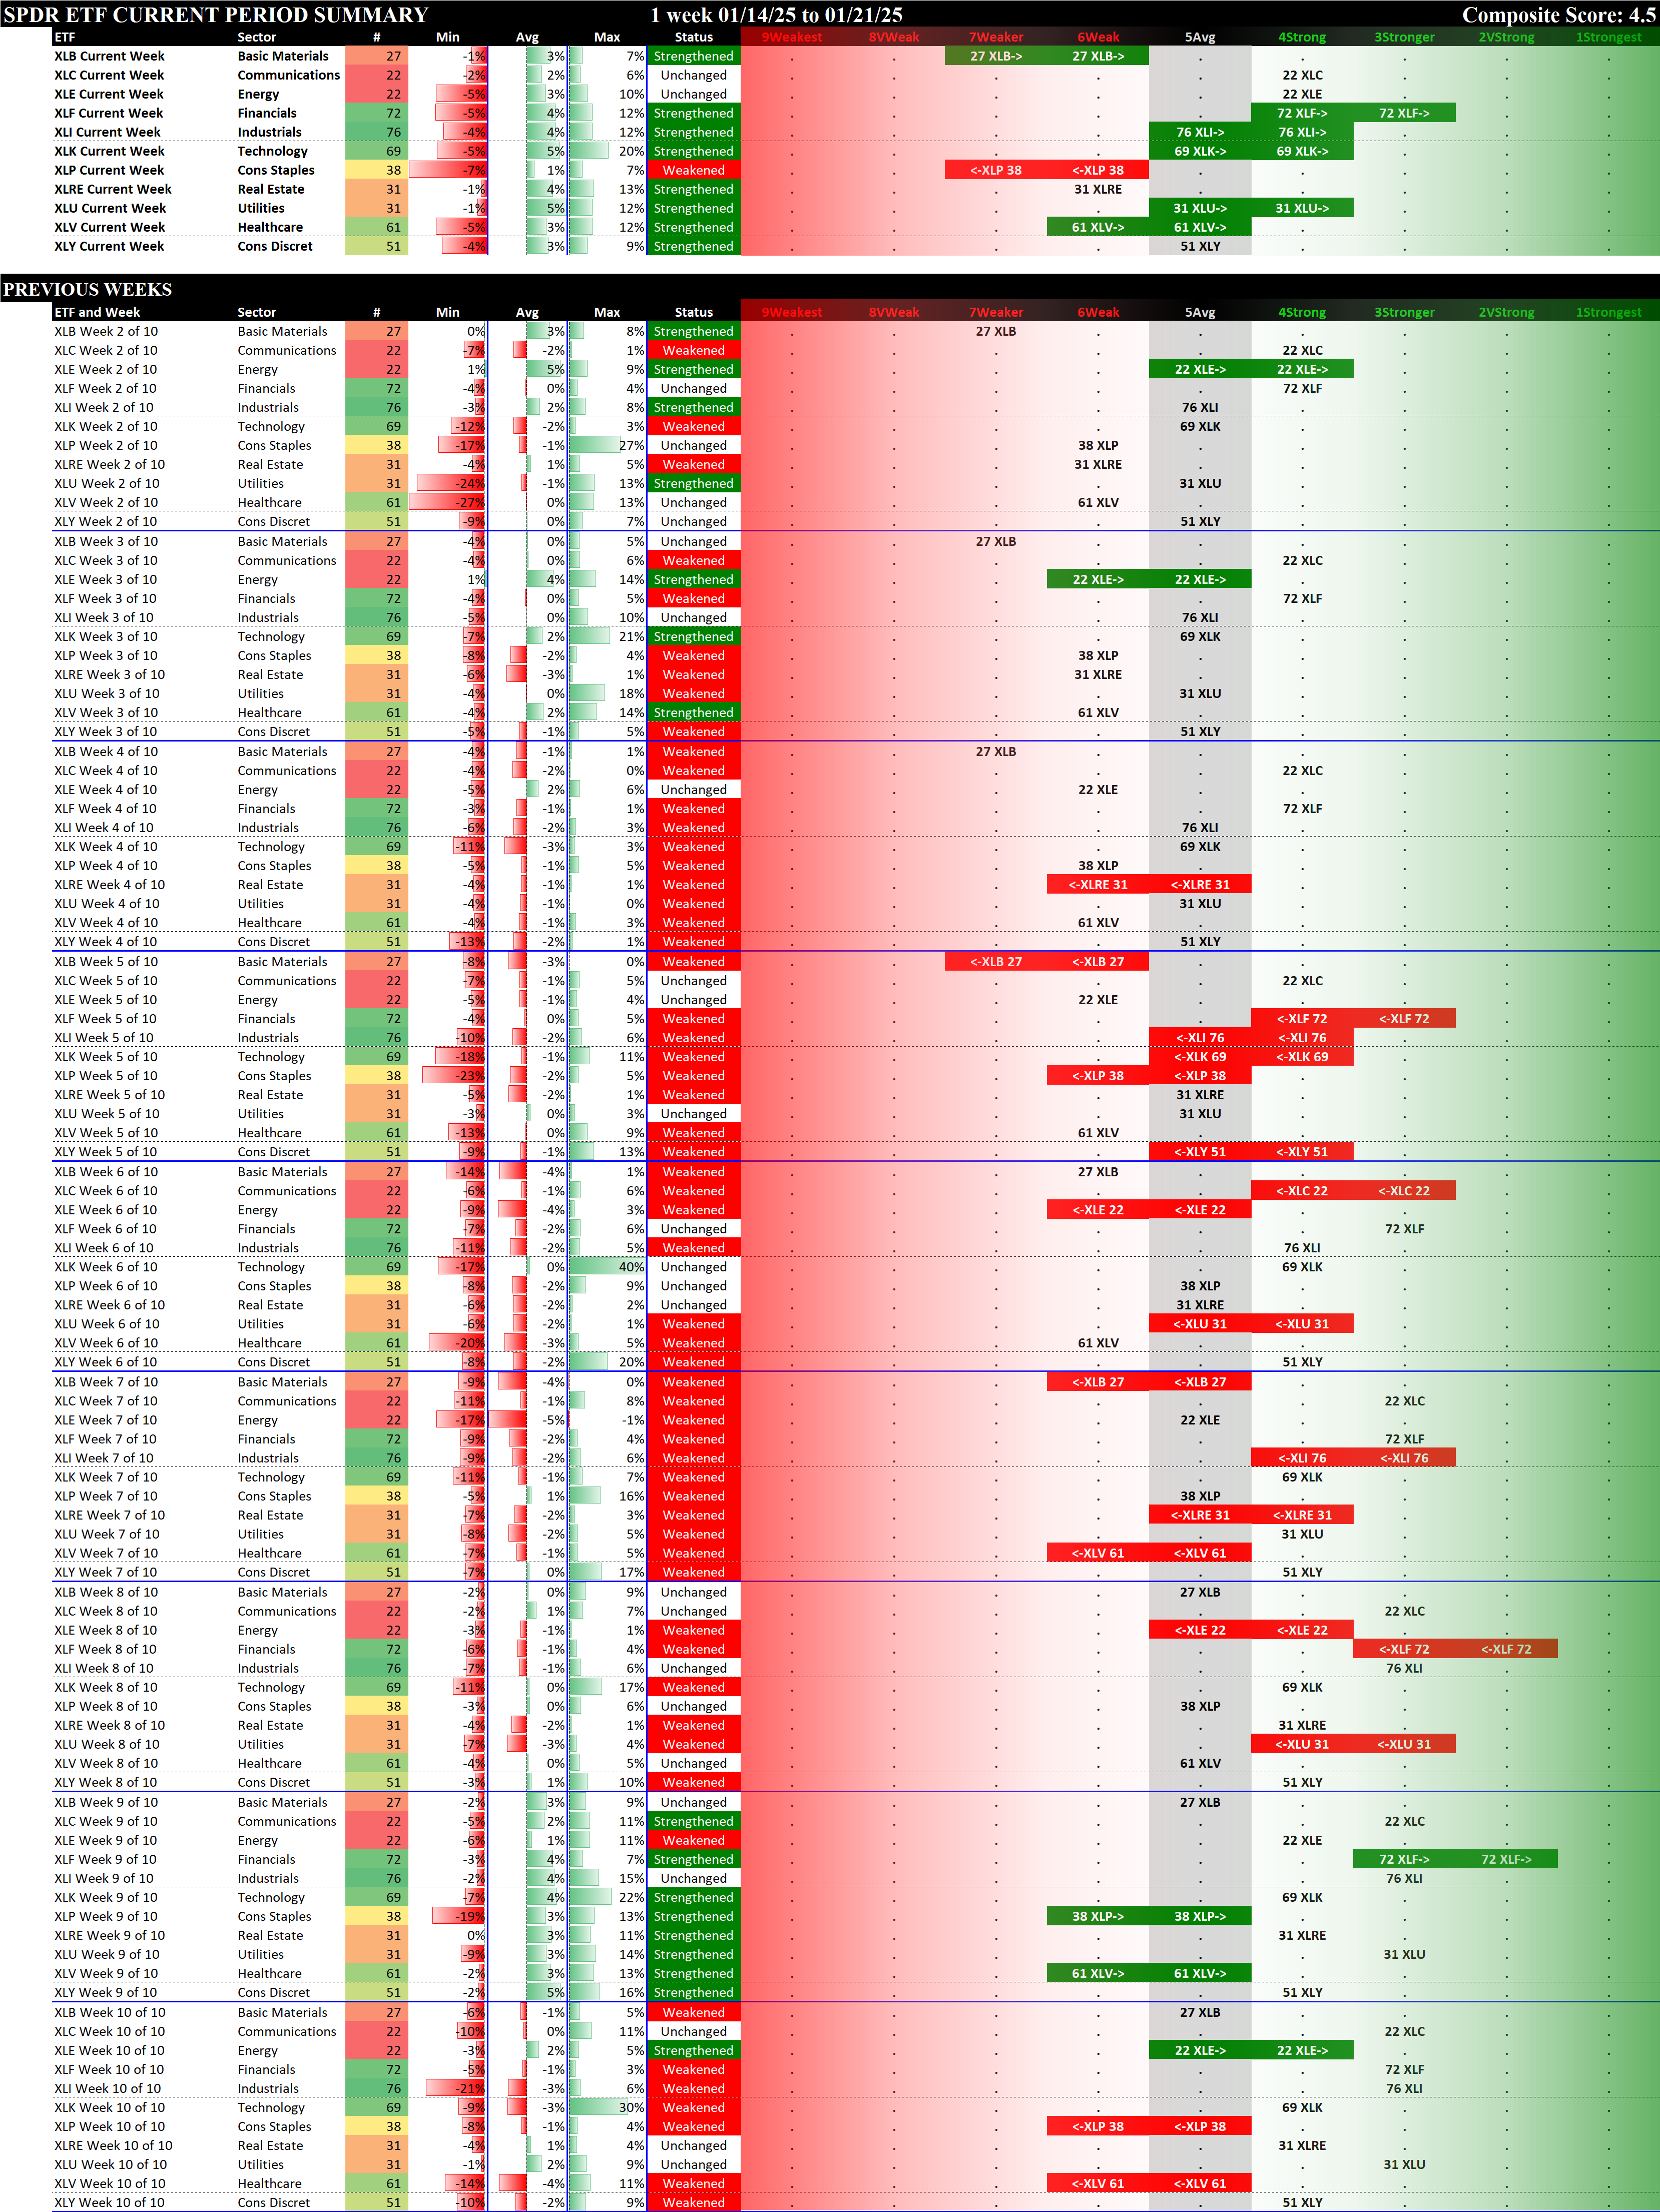
The following Strengthening Status spectrum graph shows the ETFs based on their current strengthening status, as compared to last week.
These are ordered based on important distinctions - did an ETF strengthen or weaken, enough (or not) to change rating, and where in the ratings scale (aka the spectrum of possibilities) does the ETF currently lie?
This graphic clearly provides this key information at a glance.
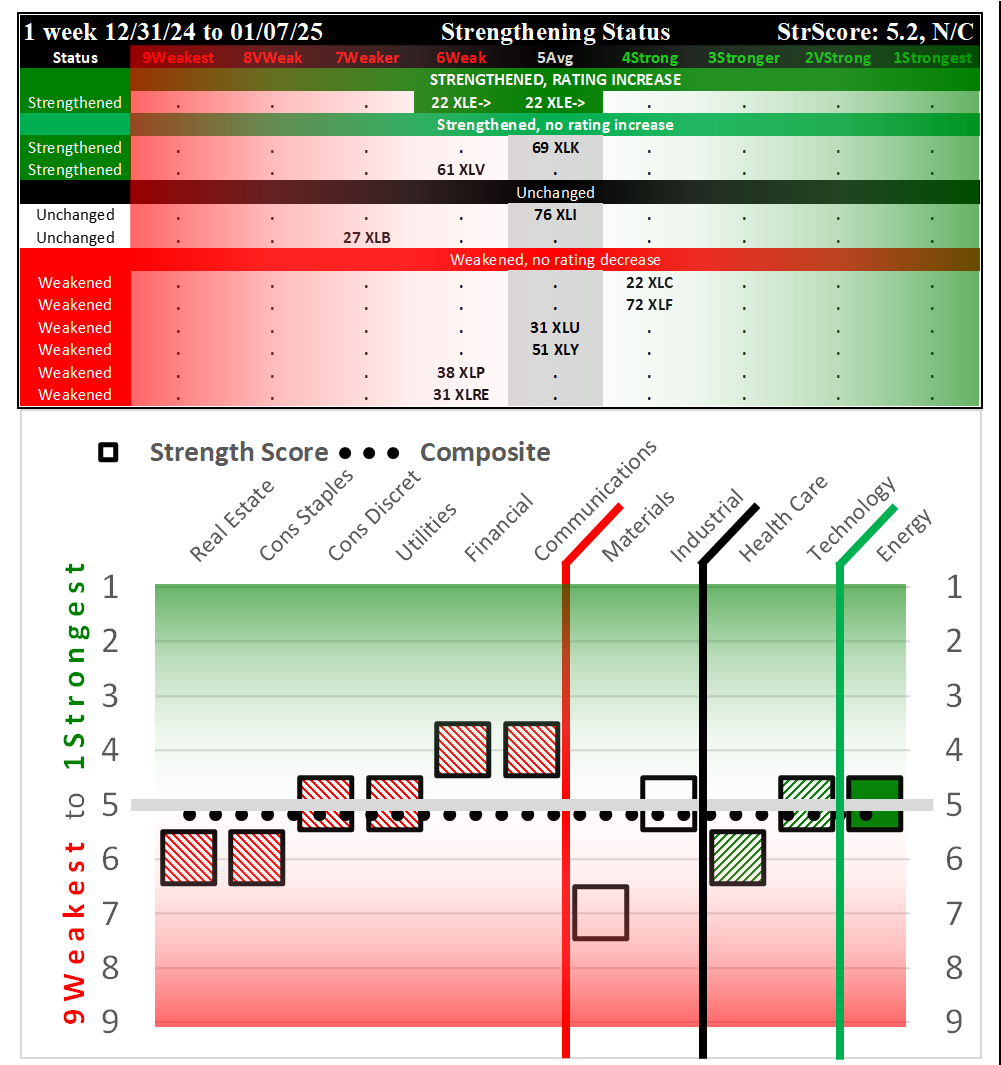
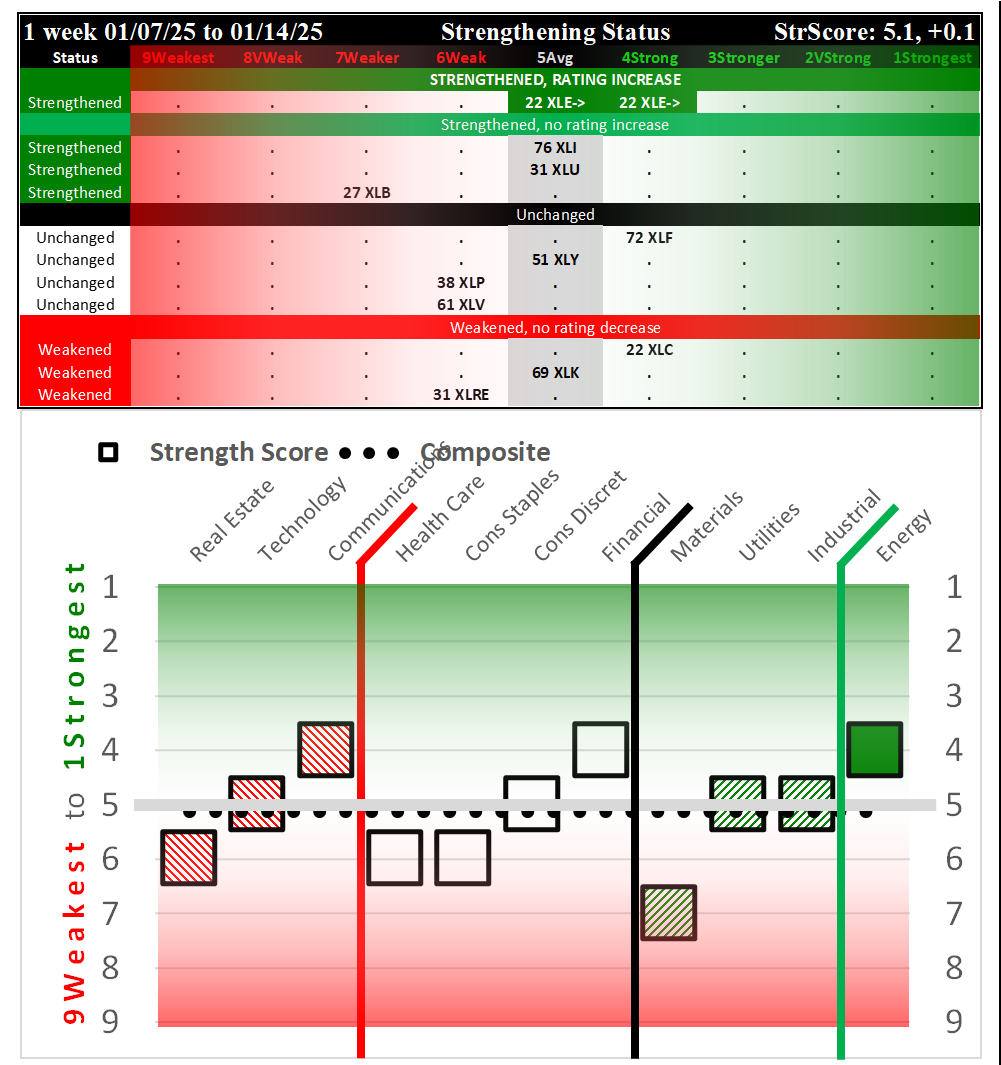
Comparison of this week vs. the past two weeks. The upper portions show strengthening from the top row down, while the lower portions show strengthening from right to left. These graphics are set up to clearly convey which ETFs/sectors strengthened or weakened, and from/to where this happened. Though it is impossible to determine how long these signals will last (what will be), the critical point is that these are the objective strength levels of these ETFs right now (what is).
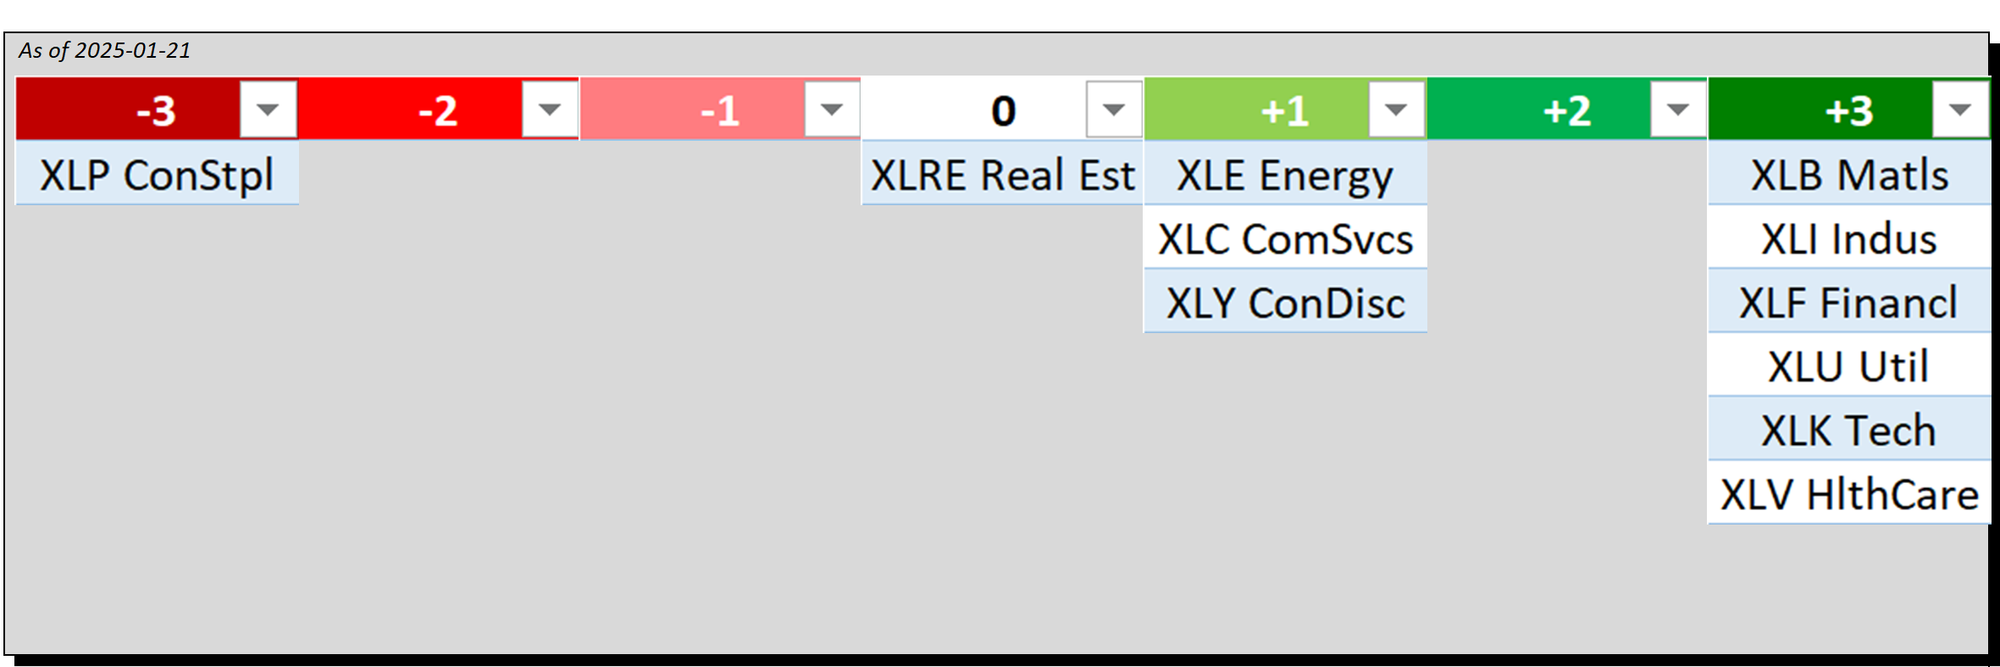
Bottom Line Translation
Each ETF/Sector is given a Bottom Line rating below on a scale of -3 (Worst) to +3 (Best) based on A) the ending strength rating of each ETF and B) the strengthening/weakening action of the ETFs during the week, with the five possibilities being 1) strengthened enough to increase rating, 2) strengthened but not enough to increase rating, 3) unchanged, 4) weakened but not enough to decrease rating, and 5) weakened enough to decrease rating.
II. Weekly Returns
Average Returns
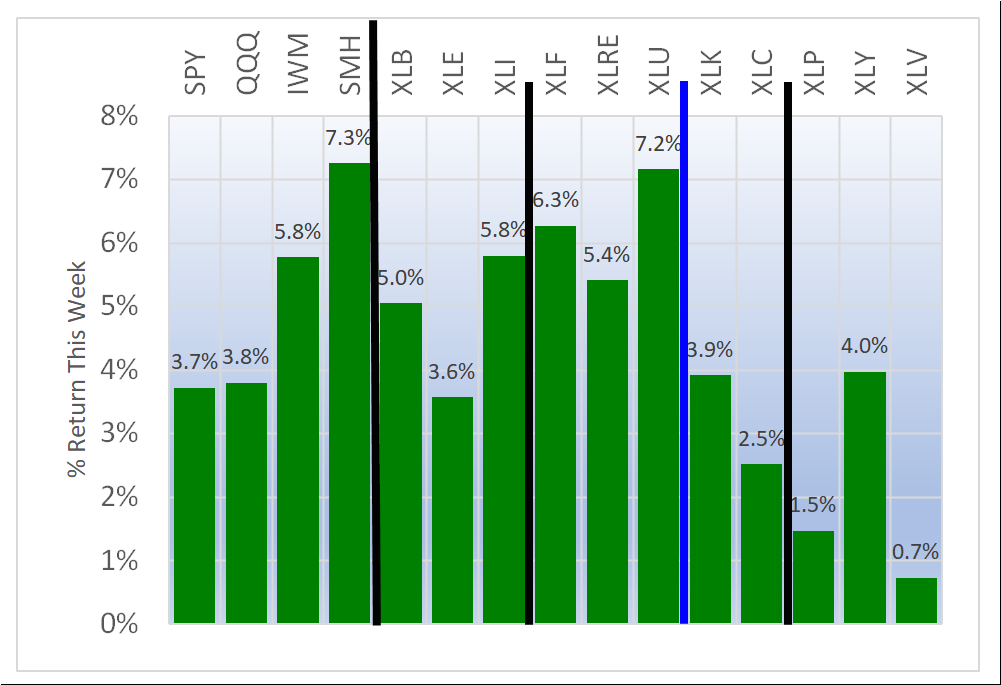
The average returns for the underlying stocks in each ETF are shown below - note this is NOT the return for the ETF for this week, which is shown below in Section IV. Today's Market Context.
The best and worst are highlighted below:
Best:
- XLU/Utilities, 5.4% average for 31 stocks
- XLK/Technology, 4.5% average for 69 stocks
- XLI/Industrial, 4.0% average for 76 stocks
Worst:
- XLP/Consumer Staples, 1.1% average for 38 stocks
- XLC/Communications, 2.0% average for 22 stocks
- XLE/Energy, 2.6% average for 22 stocks
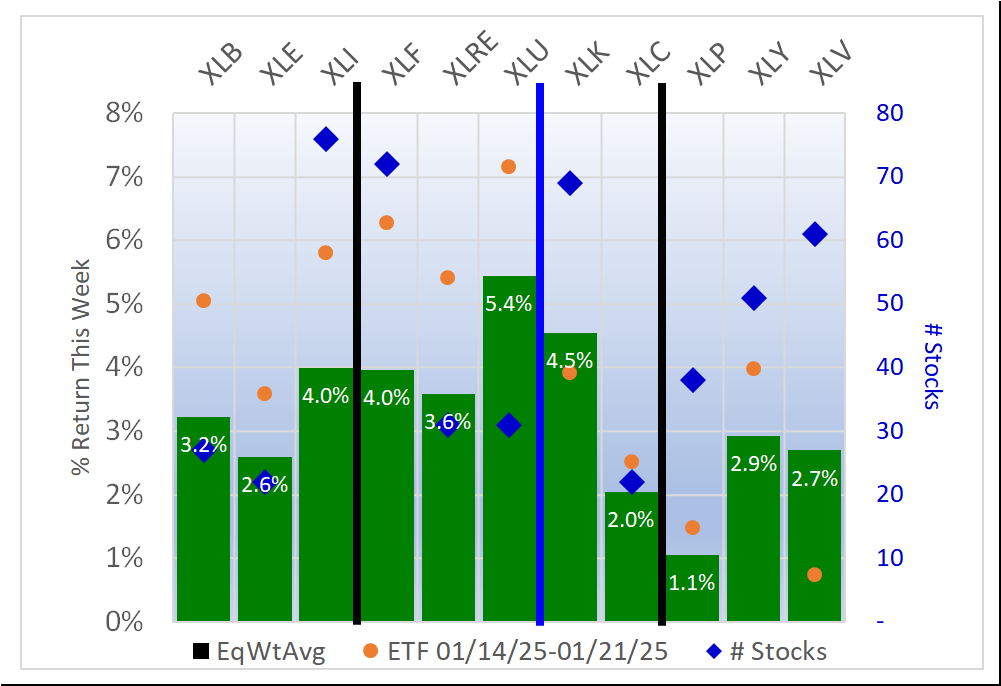
Strong week all the way around. The bar chart shows the AVERAGE returns for the underlying component stocks, meaning the Equal Weight Average returns. The orange markers show the actual ETF return for this period.
High and Low Returns
The following graphic overlays the lowest and highest returns in each sector.
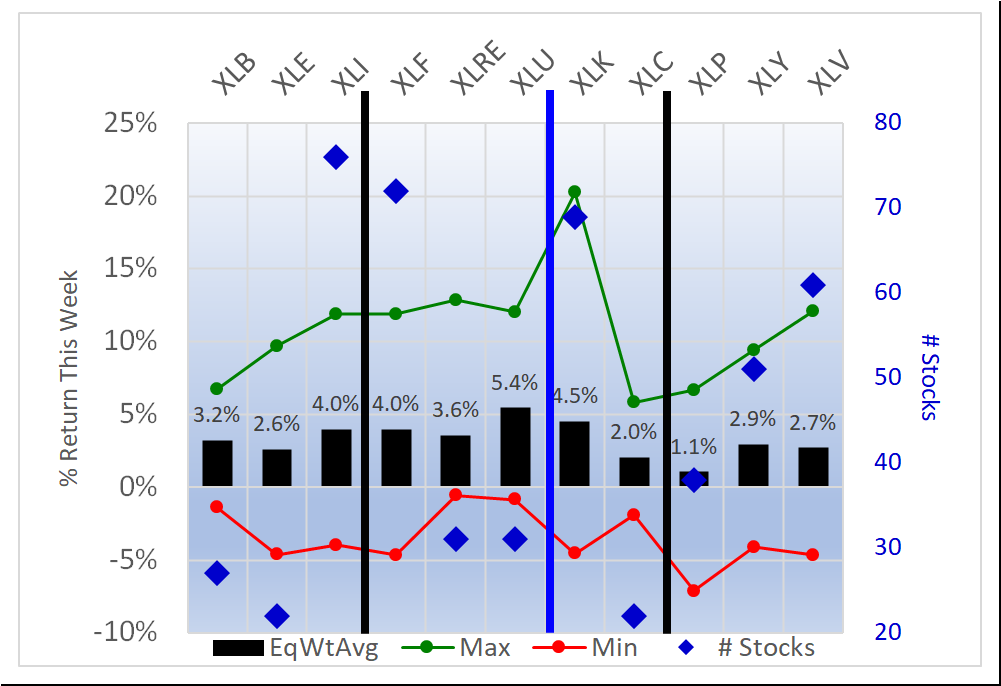
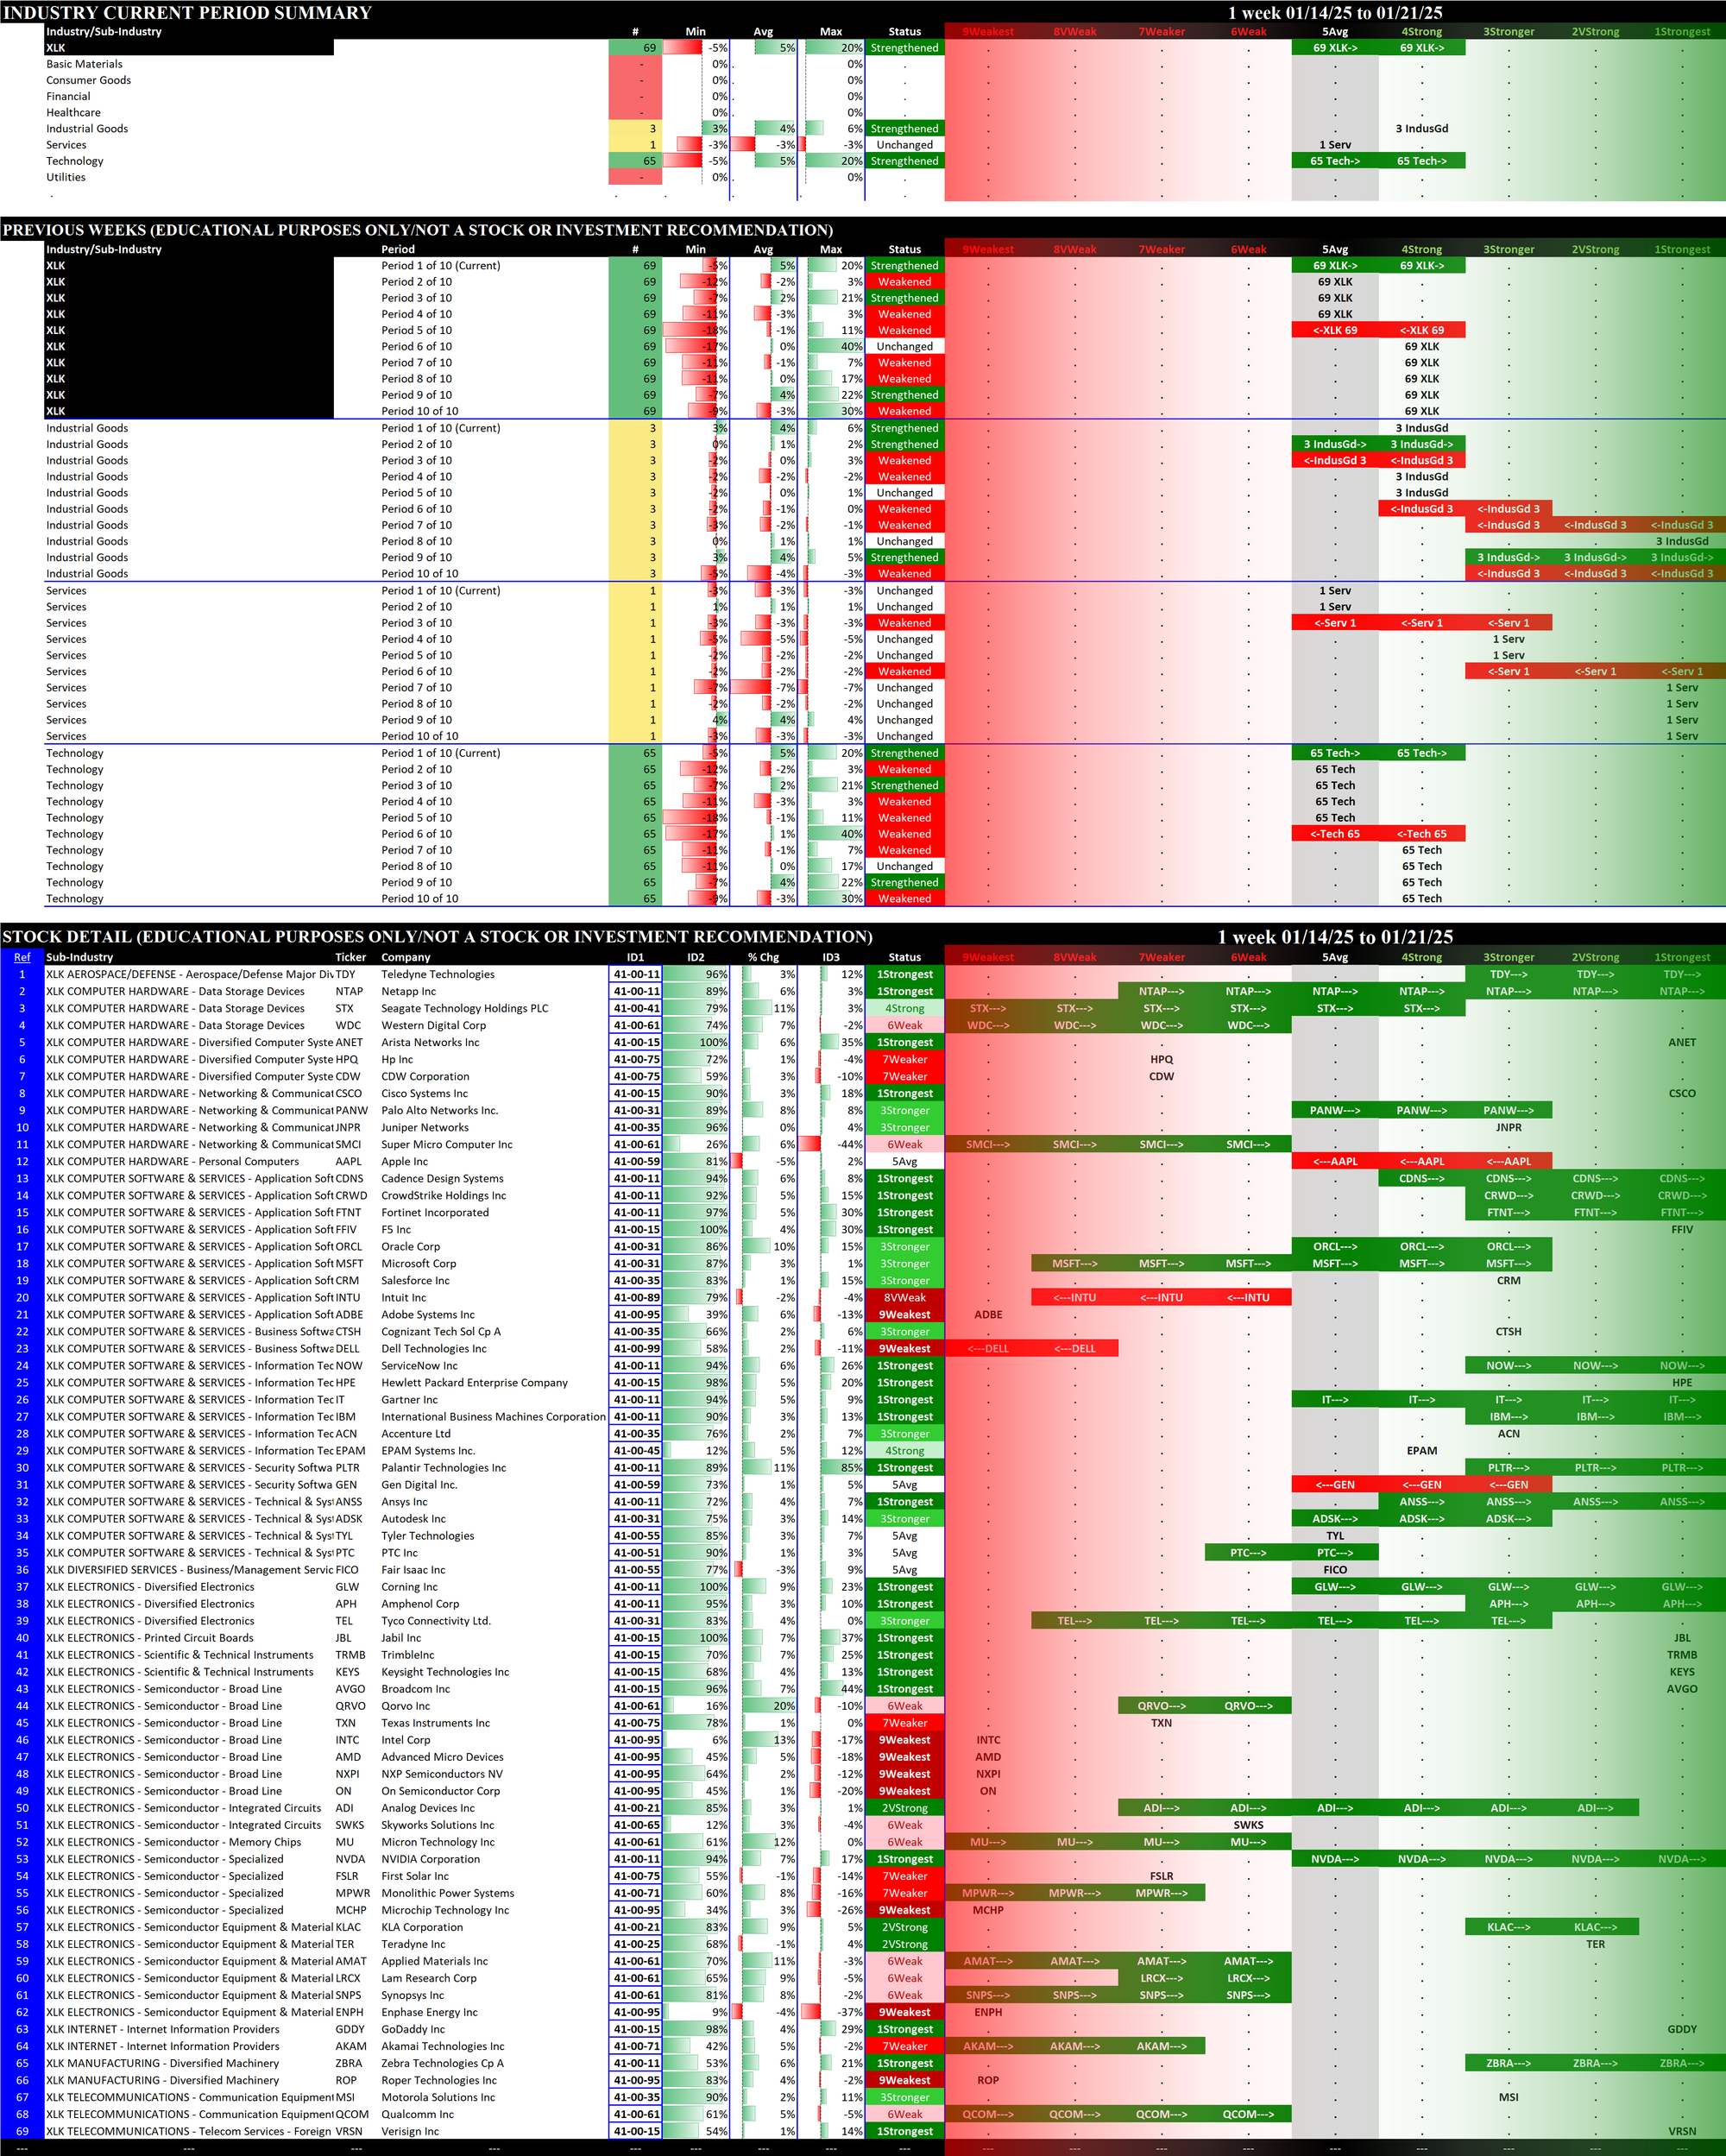
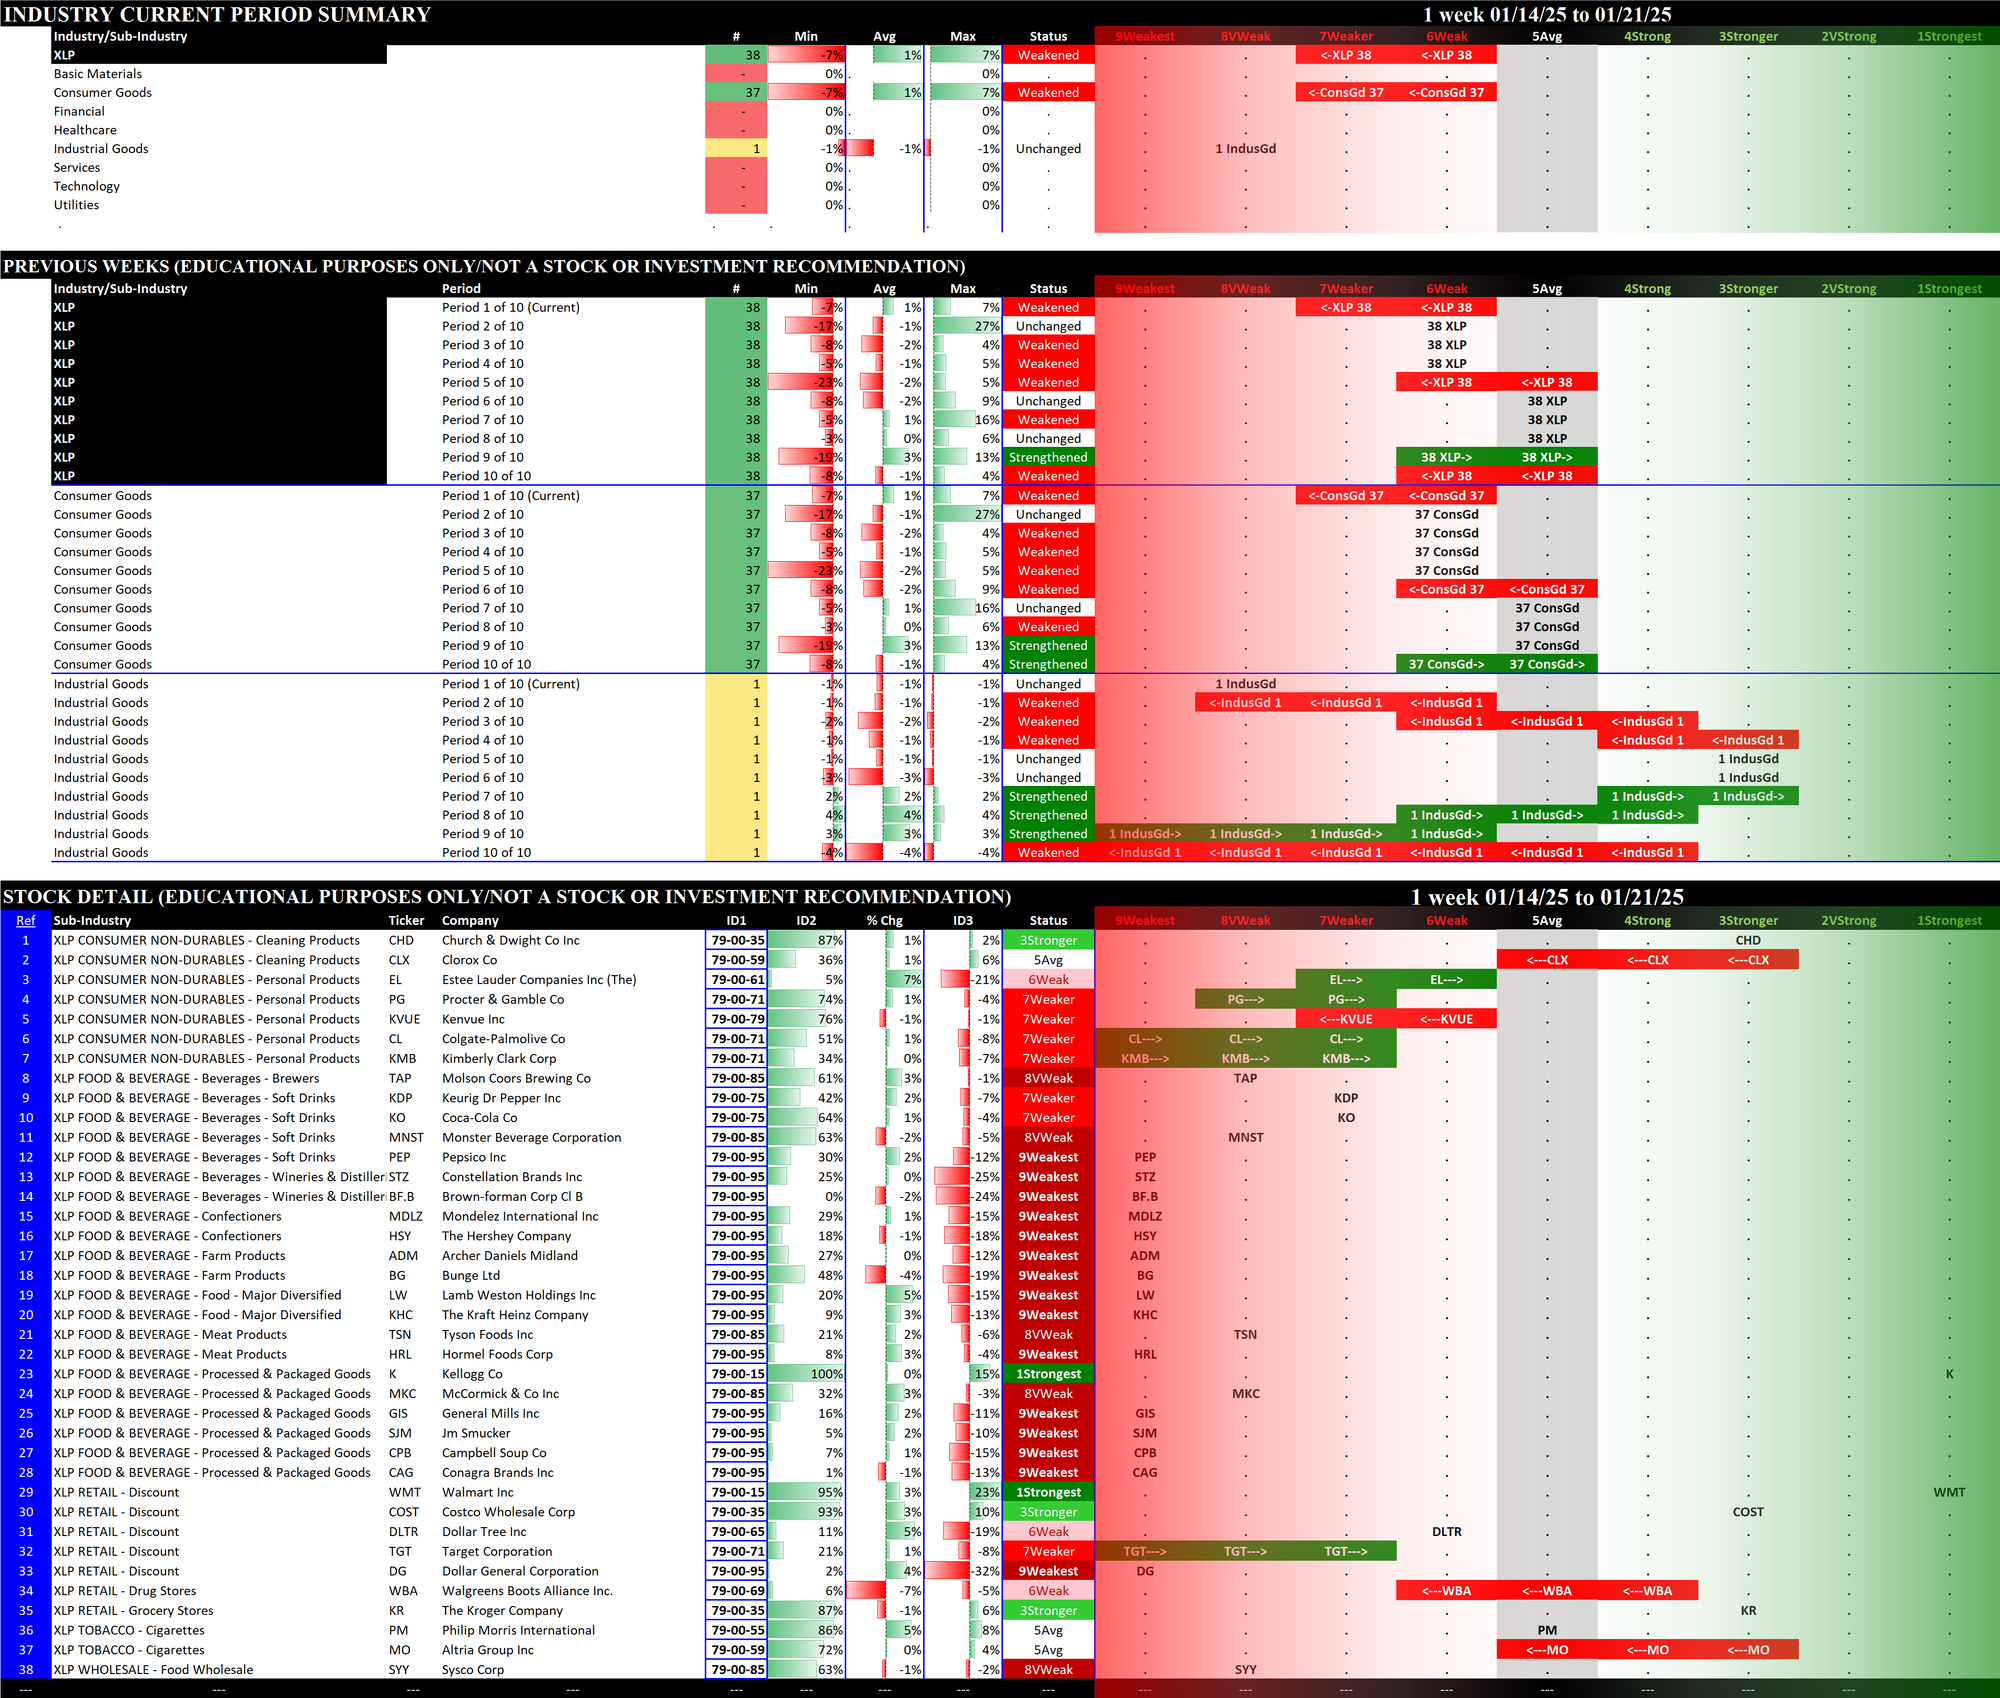
The XLK/Technology outlier to the upside was QRVO/Qorvo Inc +20% which strengthened from 7Weaker to 6Weak during the week. The XLP/Consumer Staples outlier to the downside was WBA/Walgreens Boots Alliance Inc. -7 % which weakened from 4Strong to 6Weak.
III. Spectrum Graph Analysis
This methodology uses spectrum graphs to obtain key insights unavailable elsewhere.
There are currently four types of spectrum graphs in this ETF analysis:
- By Strengthening - this is the most important graph, and it clearly shows in order the ETFs/sectors based on their strengthening/weakening performance during the week:
- Strengthened rating (rating change is most important signal)
- Strengthened but not enough to change rating
- Unchanged
- Weakened but not enough to change rating, and
- Weakened rating (rating change is most important signal). - By Type - logically groups the ETFs (for example, interest rate-sensitive, technology-related, consumer-related) for direct comparison with similar ETFs.
- By Strongest to Weakest
- Alphabetically
The remainder of this section uses types 2, 3, and 4 above to show current performance.
Context: Comparison to Recent Weeks
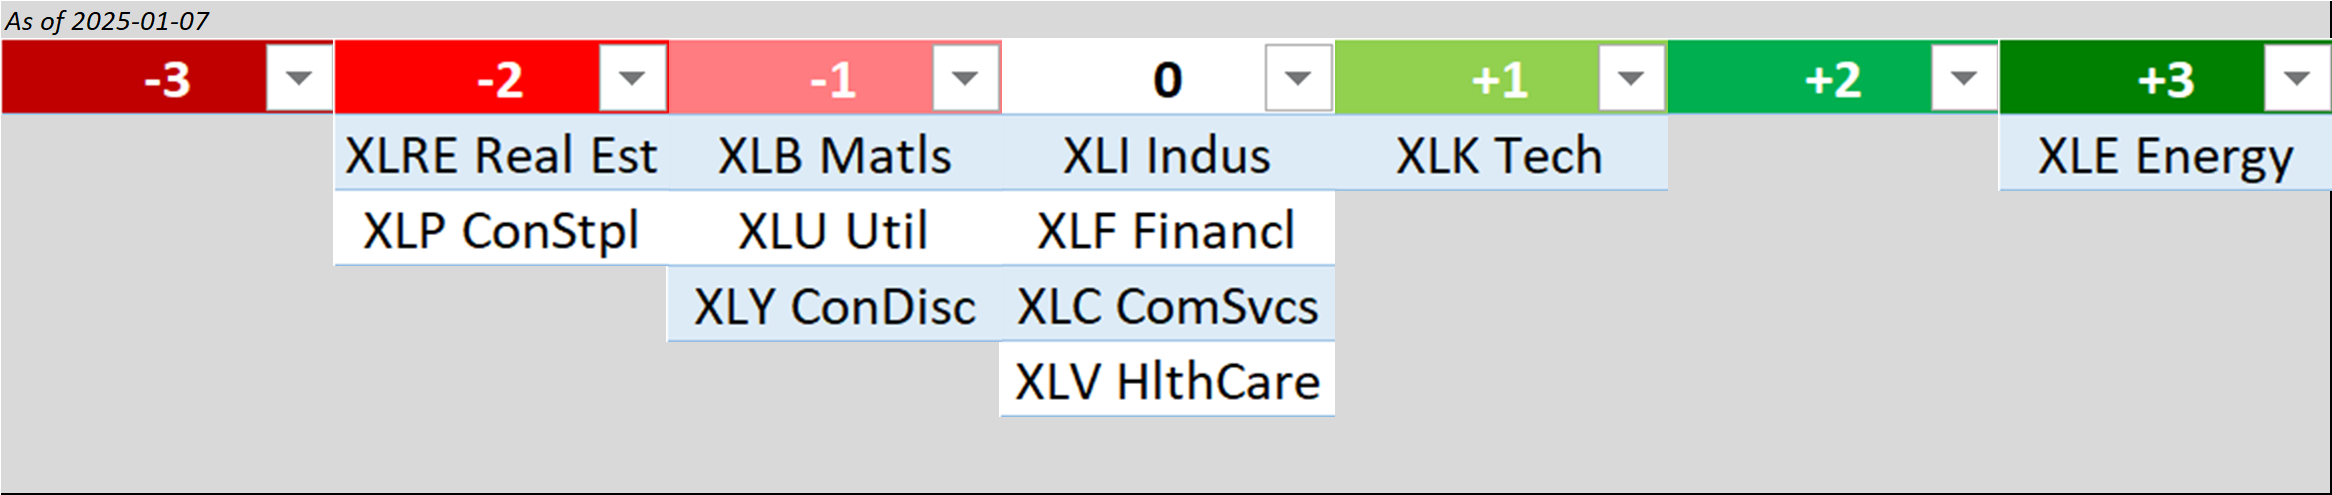
The following spectrum graphs by ETF Type show recent Friday week-to-week changes compared to the current week:
- 01/07/25: Unchanged
- 01/14/25: Strengthened
- 01/21/25: Strengthened
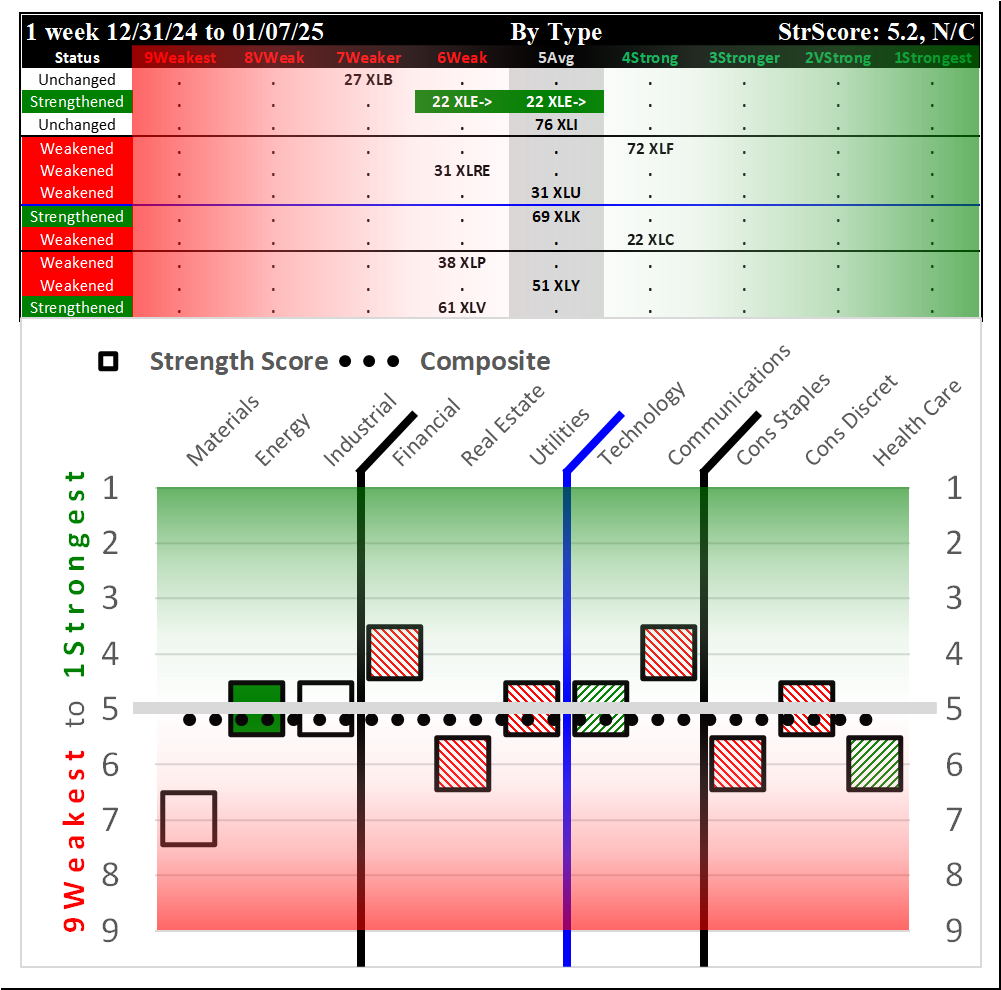
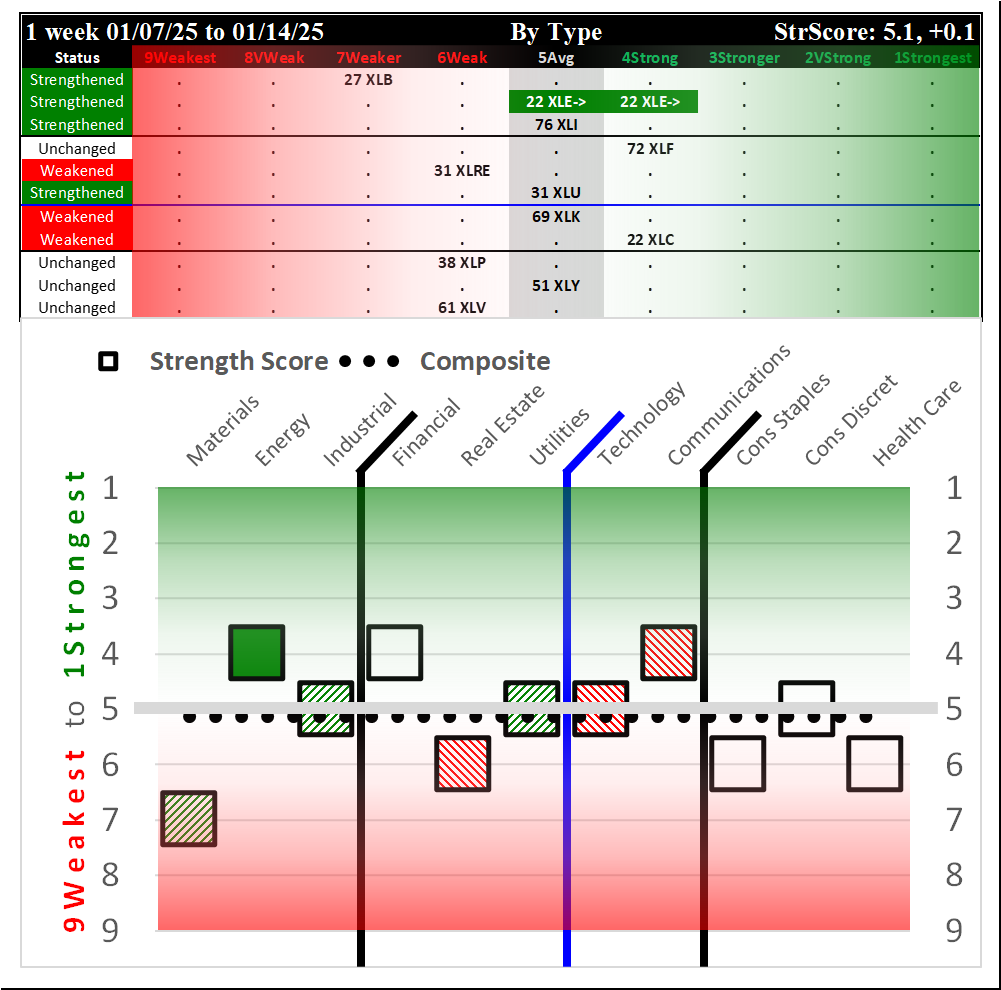
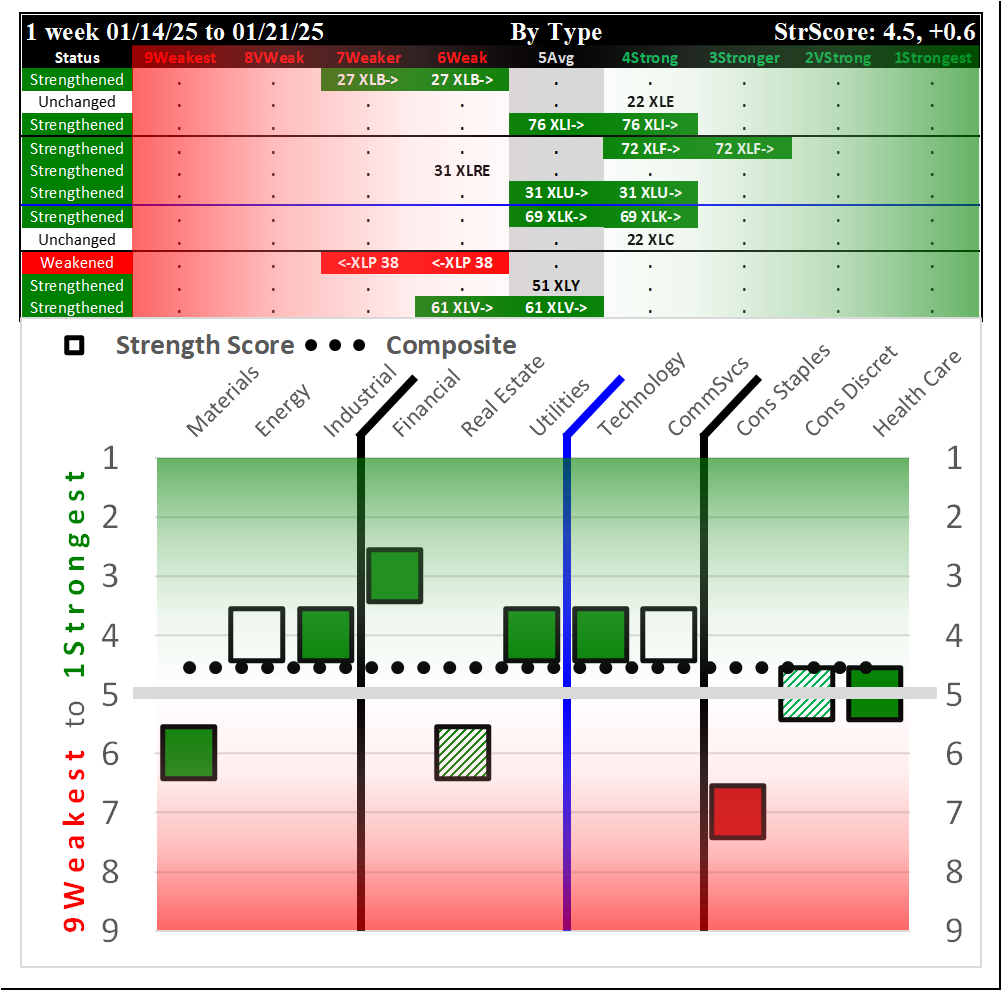
Ever more strengthening this week than last.
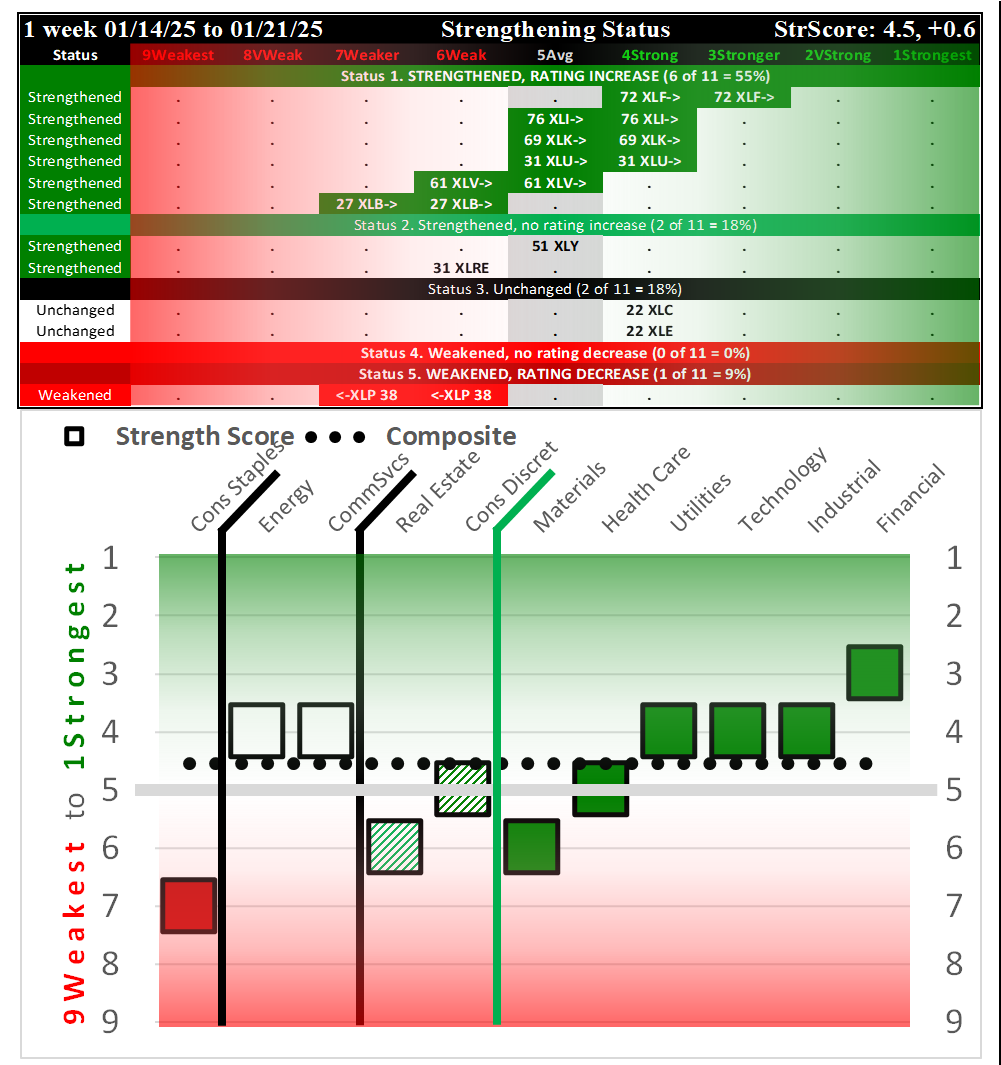
Current Status: 4.5 Composite Score, +0.6 this week
The following spectrum graph "Strongest to Weakest" shows the composition of the ETF ratings that comprise the current composite score, in order of Strength Rating. This is followed by an Alphabetical spectrum graph.
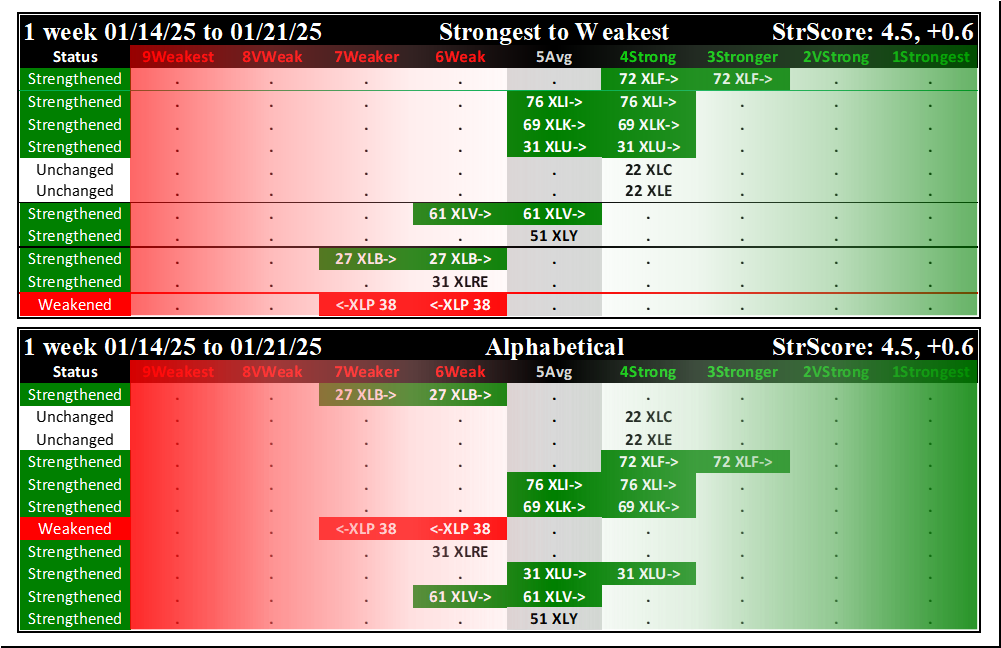
The ETFs are listed below based on their strength rating.
1Strongest
None
2VeryStrong
None
3Stronger
- XLF/Financial (STRENGTHENED RATING)
4Strong
- XLI/Industrial (STRENGTHENED RATING)
- XLK/Technology (STRENGTHENED RATING)
- XLU/Utilities (STRENGTHENED RATING)
- XLC/Communication (Unchanged)
- XLE/Energy (Unchanged)
4.5 - Composite Score
5Average
- XLV/Health Care (STRENGTHENED RATING)
- XLY/Consumer Discretionary (Strengthened)
6Weak
- XLB/Materials (STRENGTHENED RATING)
- XLRE/Real Estate (Strengthened)
7Weaker
- XLP/Consumer Staples (WEAKENED RATING)
8VeryWeak
None
9Weakest
None
IV. Today's Market Context
Indexes and ETFs Weekly Performance
Key Headlines
"Oracle, Nvidia and other Big Tech stocks jump as Trump rolls out Stargate AI initiative"
"Dow ends up over 500 points as U.S. stocks climb on first trading day of Trump’s second term"
"The U.S. dollar slumps as Trump 2.0 kicks off with no immediate tariffs"
"Netflix’s subscriber beat sends stock surging — and here’s what‘s to come"
"Trump rolls back Biden’s effort to lower Medicare and Medicaid drug costs"
(Marketwatch)
"Trump says he’s considering 10% tariff on China beginning as soon as Feb. 1"
"Dow surges 500 points as investors bet that Trump’s approach on tariffs won’t be as harsh as feared"
"U.S. crude oil falls more than 2% as Trump weighs tariffs"
"Bank of Japan is expected to hike rates this week, CNBC survey shows"
"Netflix shares soar as company reports surging revenue, tops 300 million subscribers"
(CNBC)
"Trump announces $500B AI venture headed by Oracle, OpenAI"
"Dow jumps, stocks near records as new Trump era begins"
"Tesla stock falls as Trump ends EV mandate"
"Capital One reports 60% profit jump on interest income boost"
"United Airlines stock pops on upbeat profit forecast"
(Yahoo!)
Key Current Readings
SP500: 6,049.24
Nasdaq: 19,756.78
Nasdaq 100: 21,566.51
Russell 2000: 2,317.97
10Y Treasury: 4.585%
2YT: 4.283%
Oil (WTI Crude): $75.89
Bitcoin: $105,815.54
Dollar Index: 108.06
Gold: $2,757.1
VIX: 15.06
(CNBC)
V. Detailed Sector ETF Analysis
The following Stock Market Organizer strengthening/weakening analysis looks at the 11 SPDR ETFs and their underlying component stocks for the week just ended, as follows:
- ETFs Summaries
1.1 Current: Component Stocks Strength Ratings (1Strongest vs. 9Weakest vs. Ignore Status)
1.2 Current: Component Stocks Positive vs. Negative Weekly Returns
1.3 Historical: 10 Week Ratings by ETF
1.4 Historical: 10 Week Ratings by Week - ETFs Detail
2.1 XLB Materials
2.2 XLC Communications
2.3 XLE Energy
2.4 XLF Financial
2.5 XLI Industrial
2.6 XLK Technology
2.7 XLP Consumer Staples
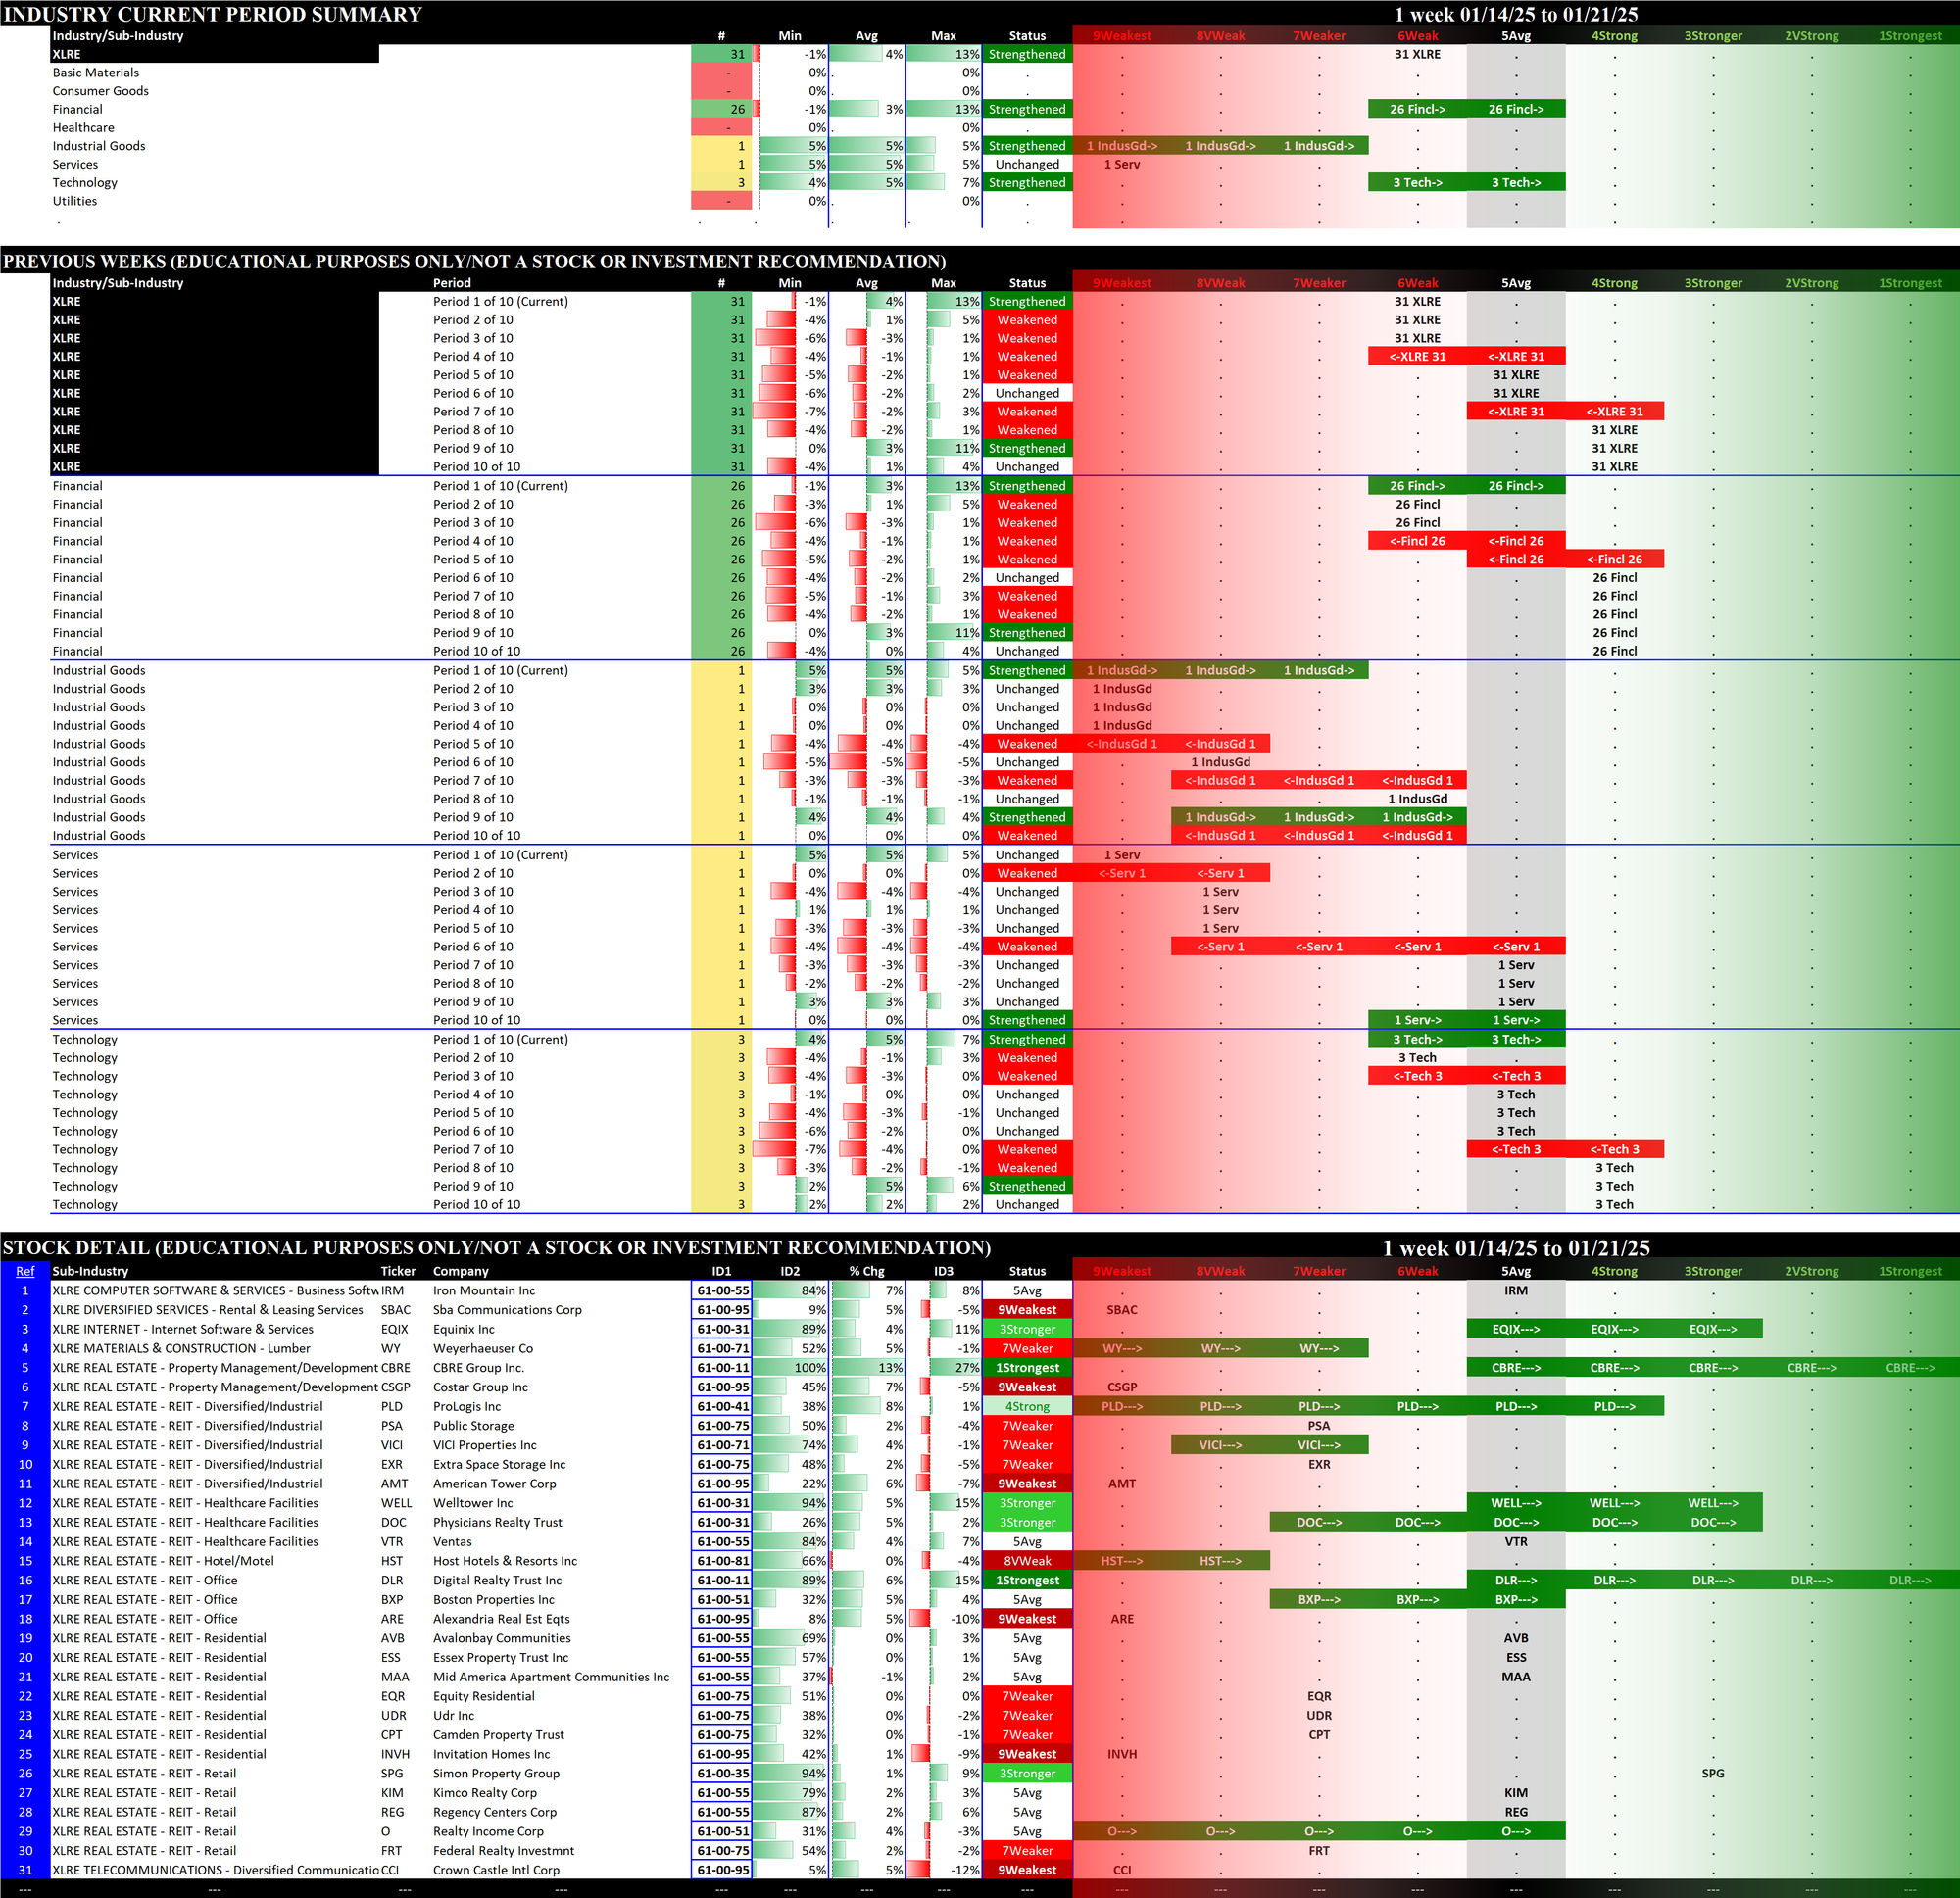
2.8 XLRE Real Estate
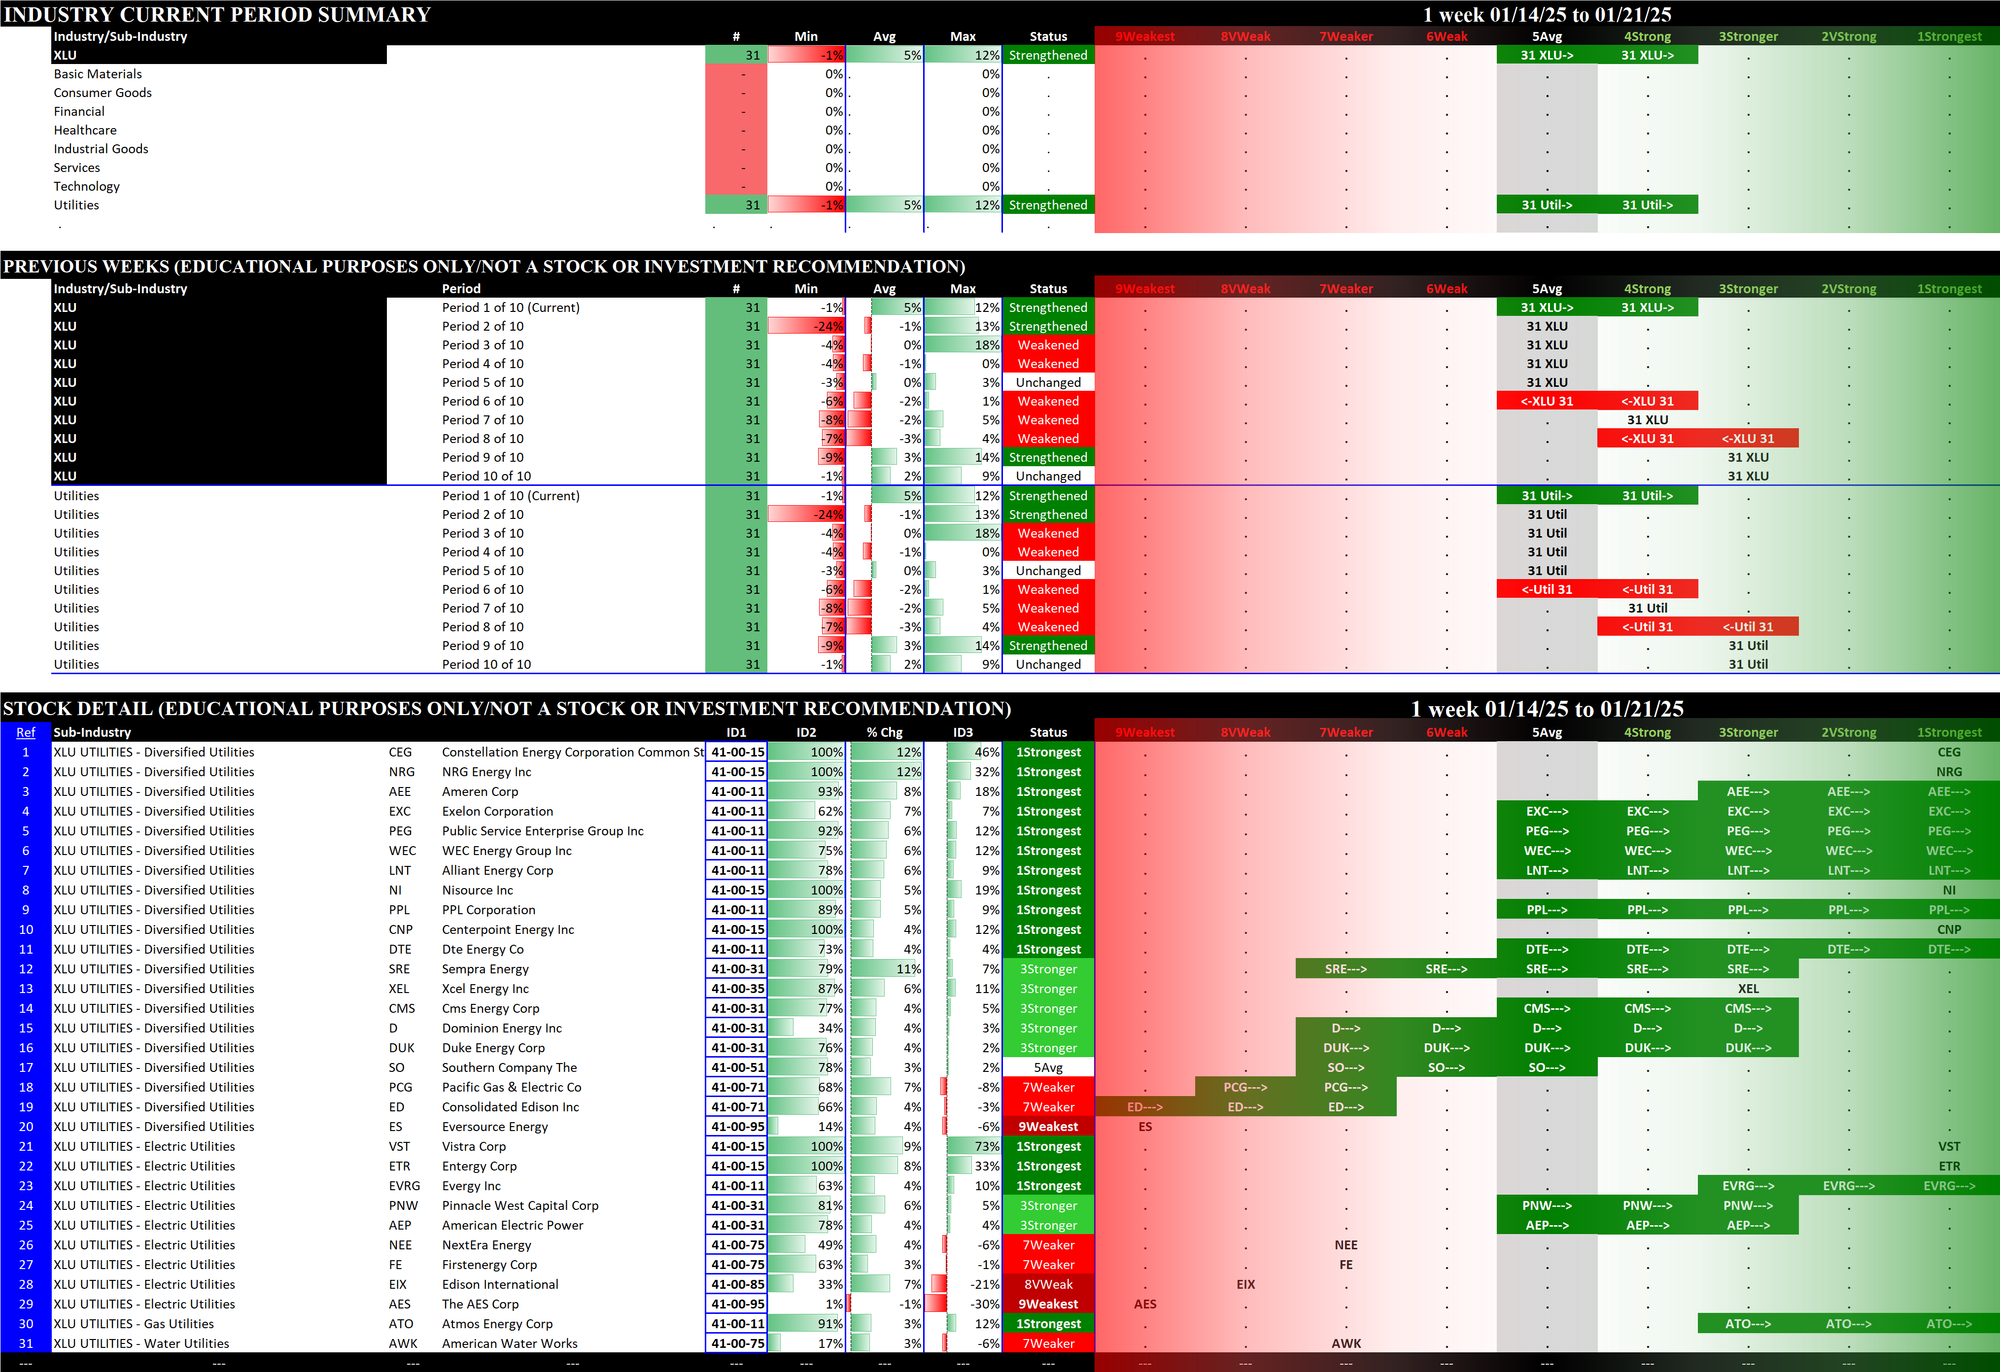
2.9 XLU Utilities
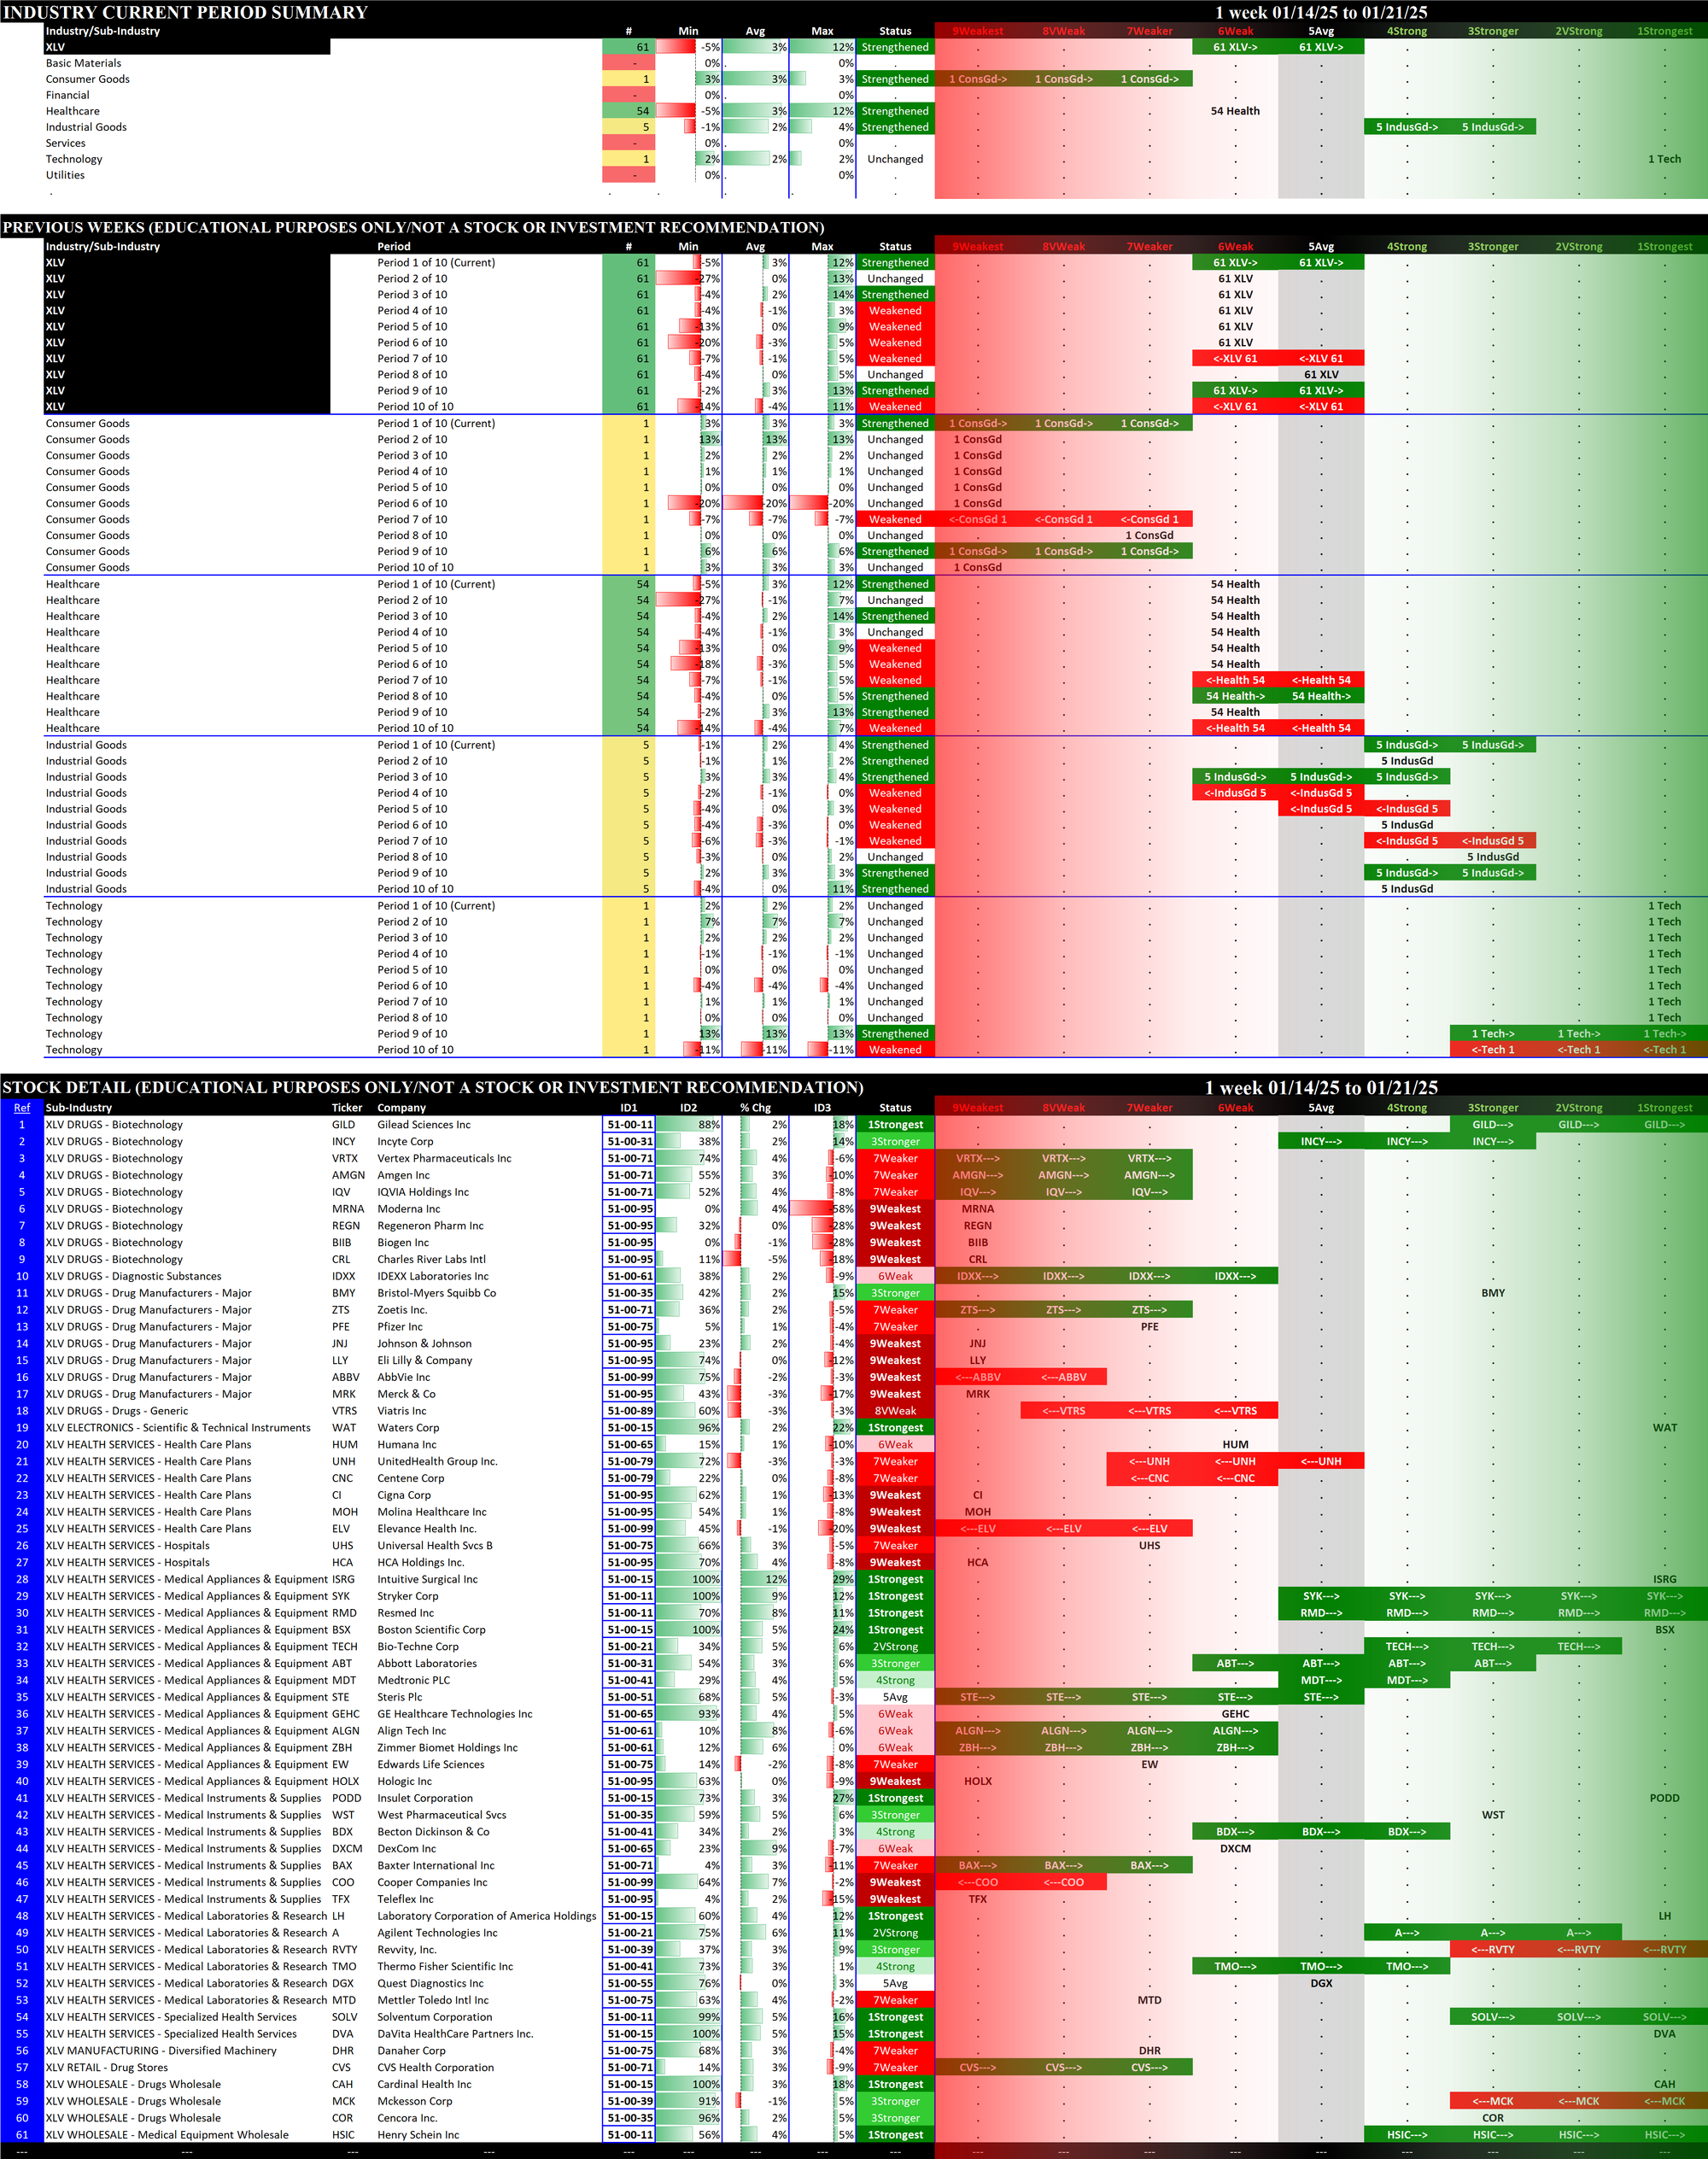
2.10 XLV Health Care
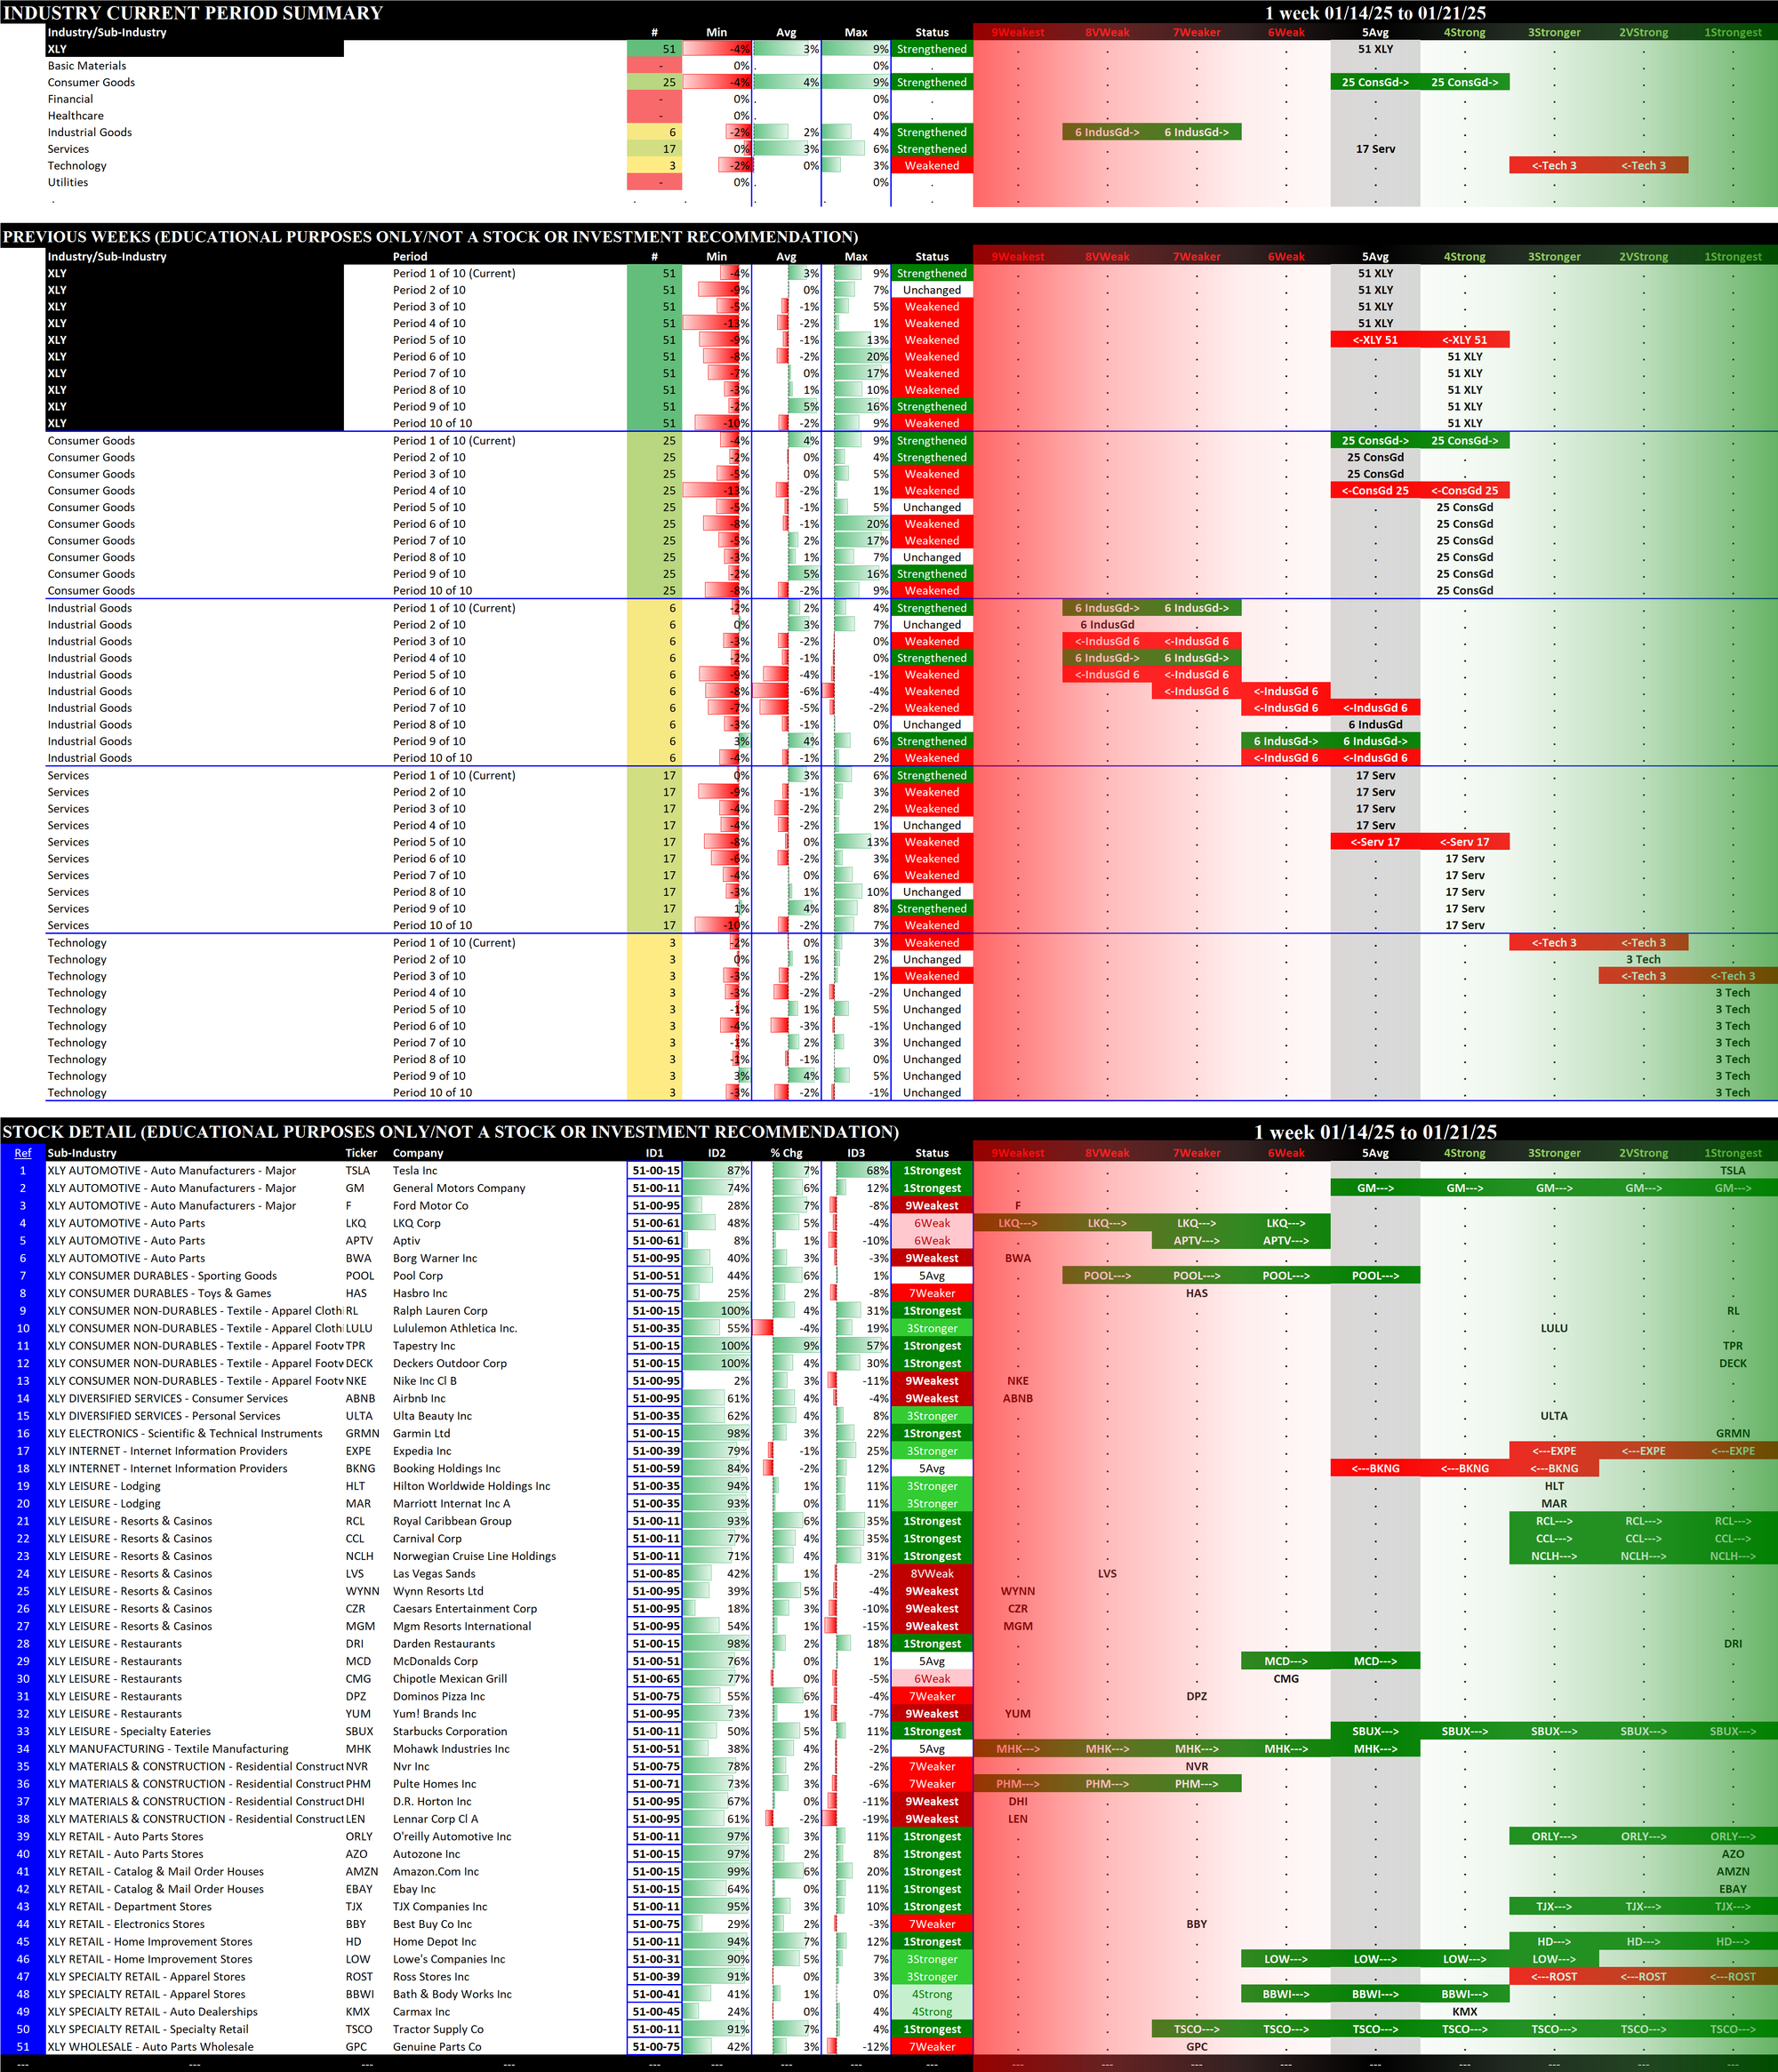
2.11 XLY Consumer Discretionary - Stock Detail (downloads)
1. ETFs Summaries
1.1 Current: Component Stocks Strength Ratings (1Strongest vs. 9Weakest vs. Ignore Status)
The following graphs reflect the composition of each of the ETFs based on their underlying component stock strength ratings which range from 1Strongest to 9Weakest. I only care about the strongest and weakest in each sector and thus categorize as "Ignore" stocks rated from 2VeryStrong through 8VeryWeak.
- Top row: XLB/Basic Materials, XLE/Energy, and XLI/Industrial
- Second row: interest rate-sensitive ETFs XLF/Financial, XLRE/Real Estate, and XLU/Utilities
- Third row: XLK/Technology and XLC/Communications
- Bottom row: XLP/Consumer Staples, XLY/Consumer Discretionary, and XLV/Health Care
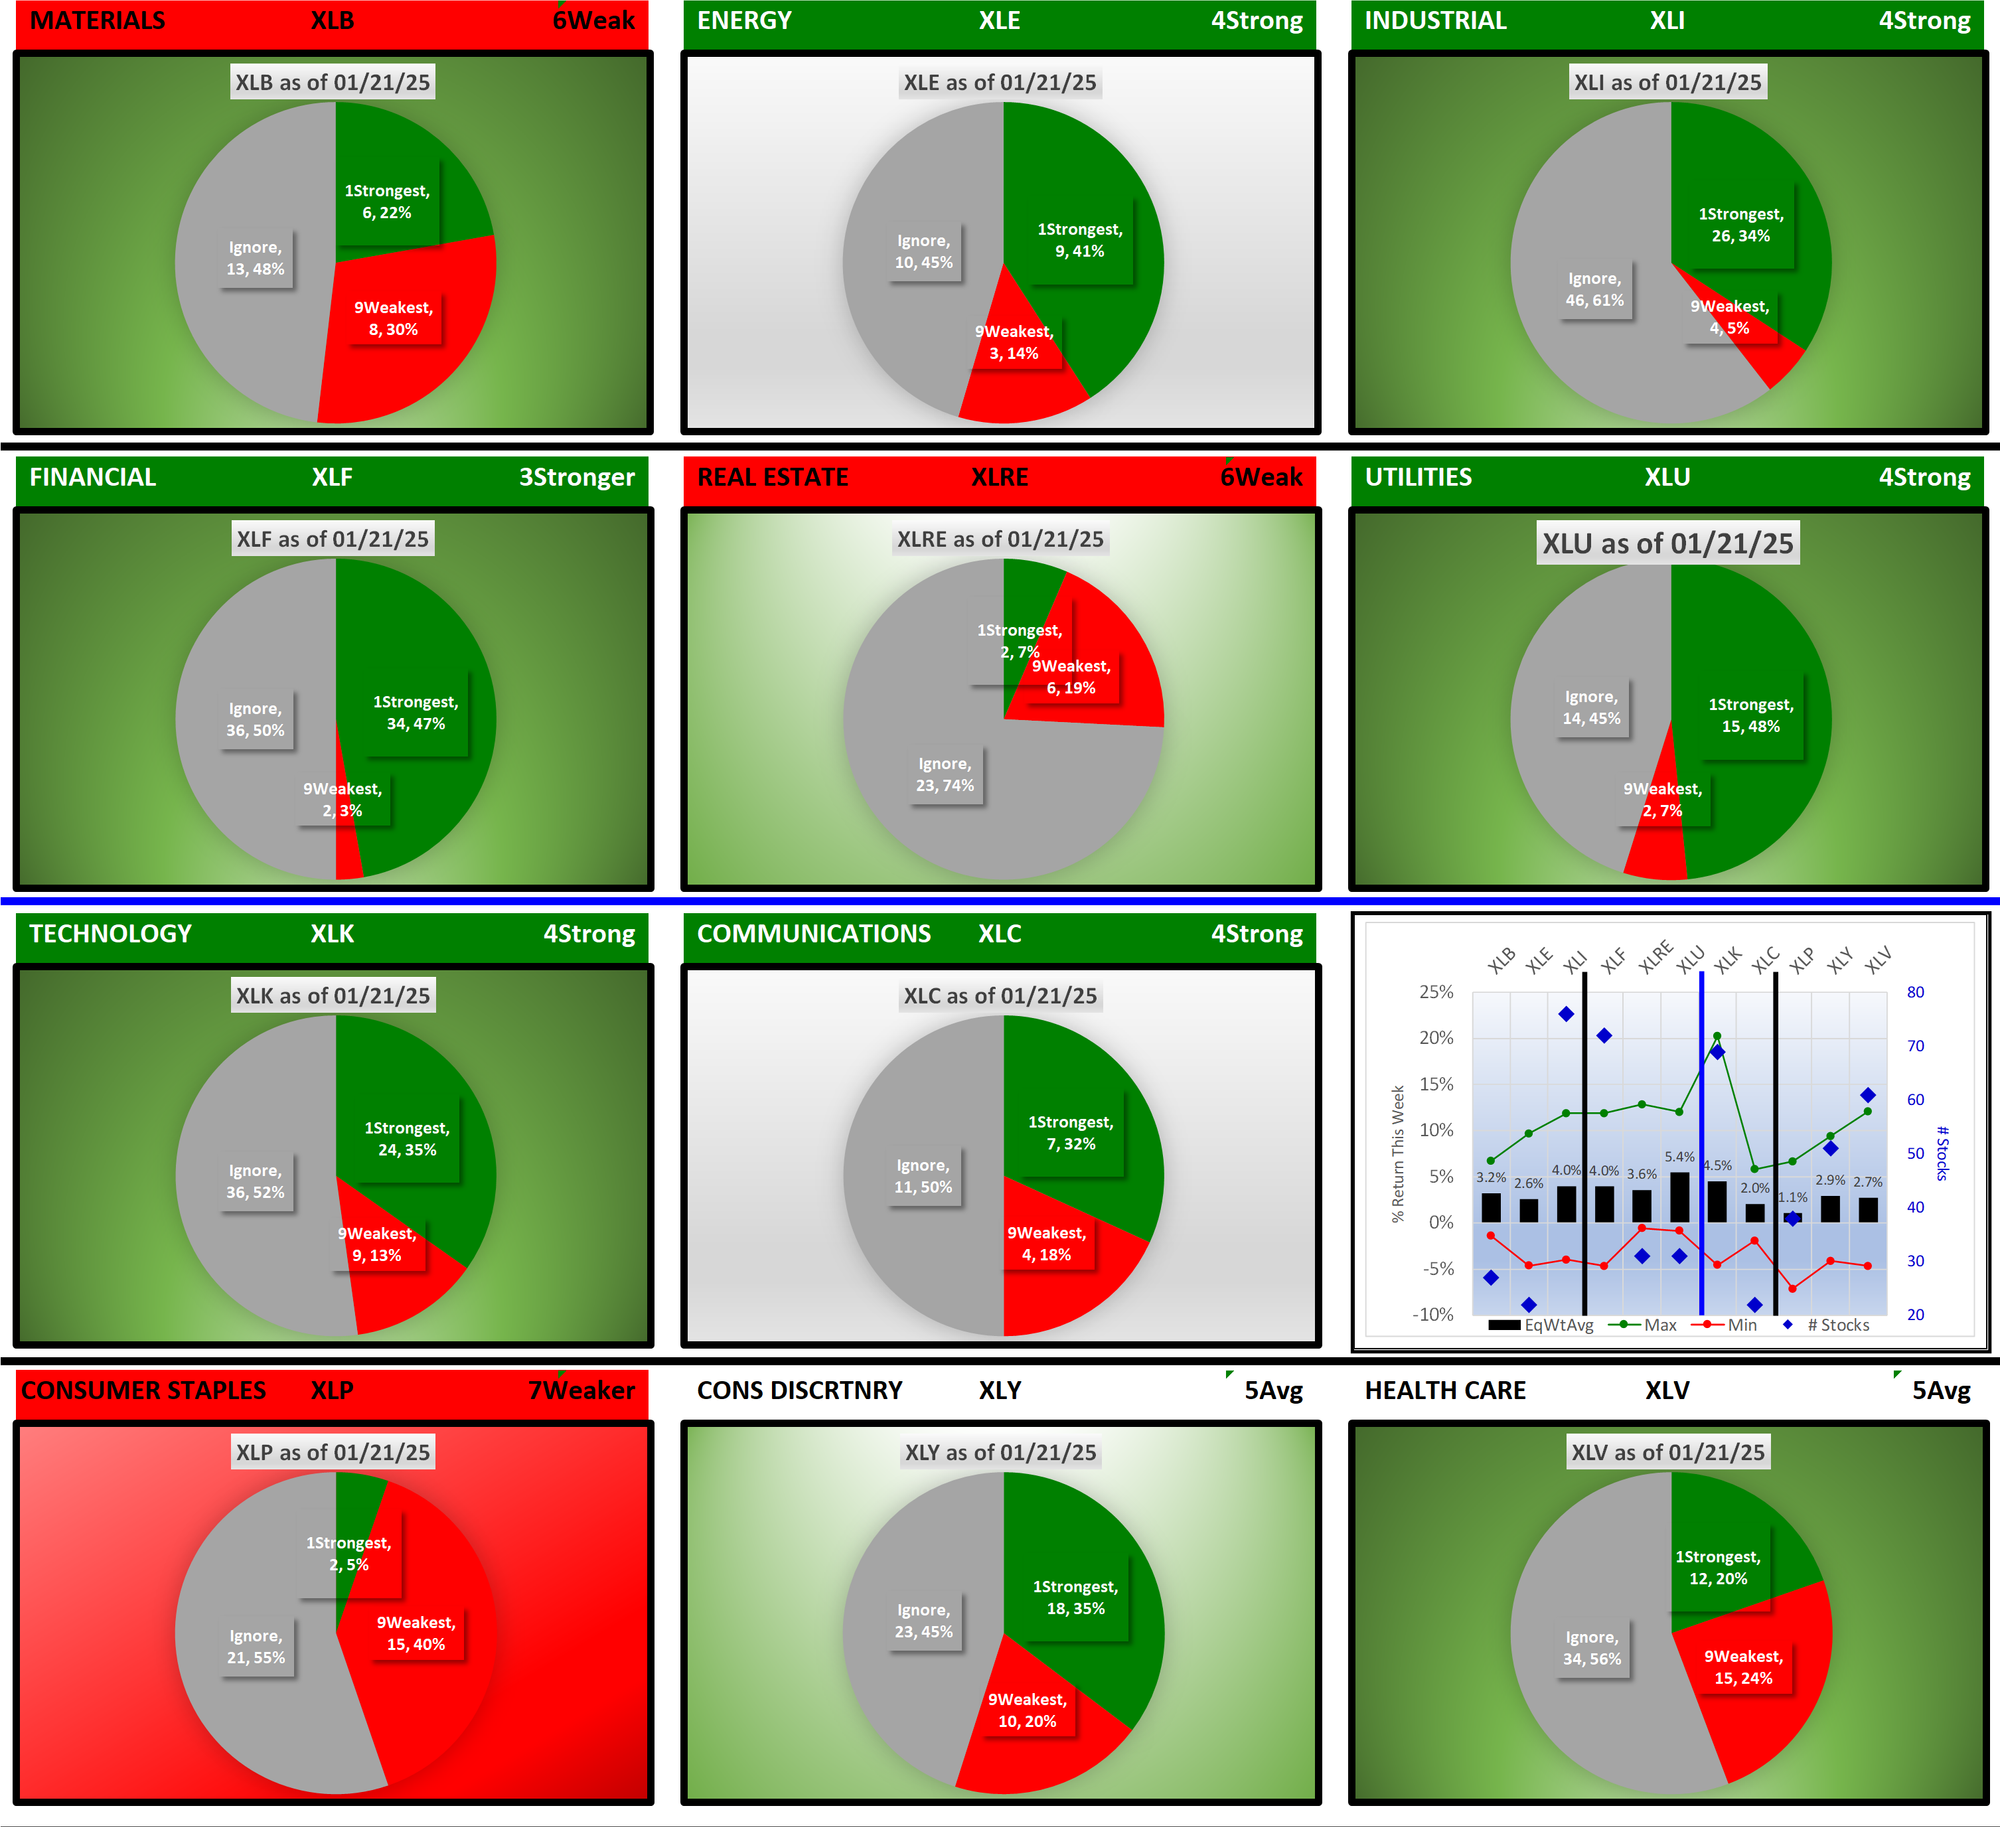
The headers for each graphic are color-coded. ETFs rated 4Strong or better have green headings - currently, six of 11 ETFs qualify. ETFs that changed rating this week have deep green or red backgrounds. ETFs that strengthened or weakened but did not change rating have pale green or red backgrounds.
1.2 Current: Component Stocks Positive vs. Negative Weekly Returns
The following pie charts show the breadth of positive and negative returns for the week for the component stocks of each ETF.
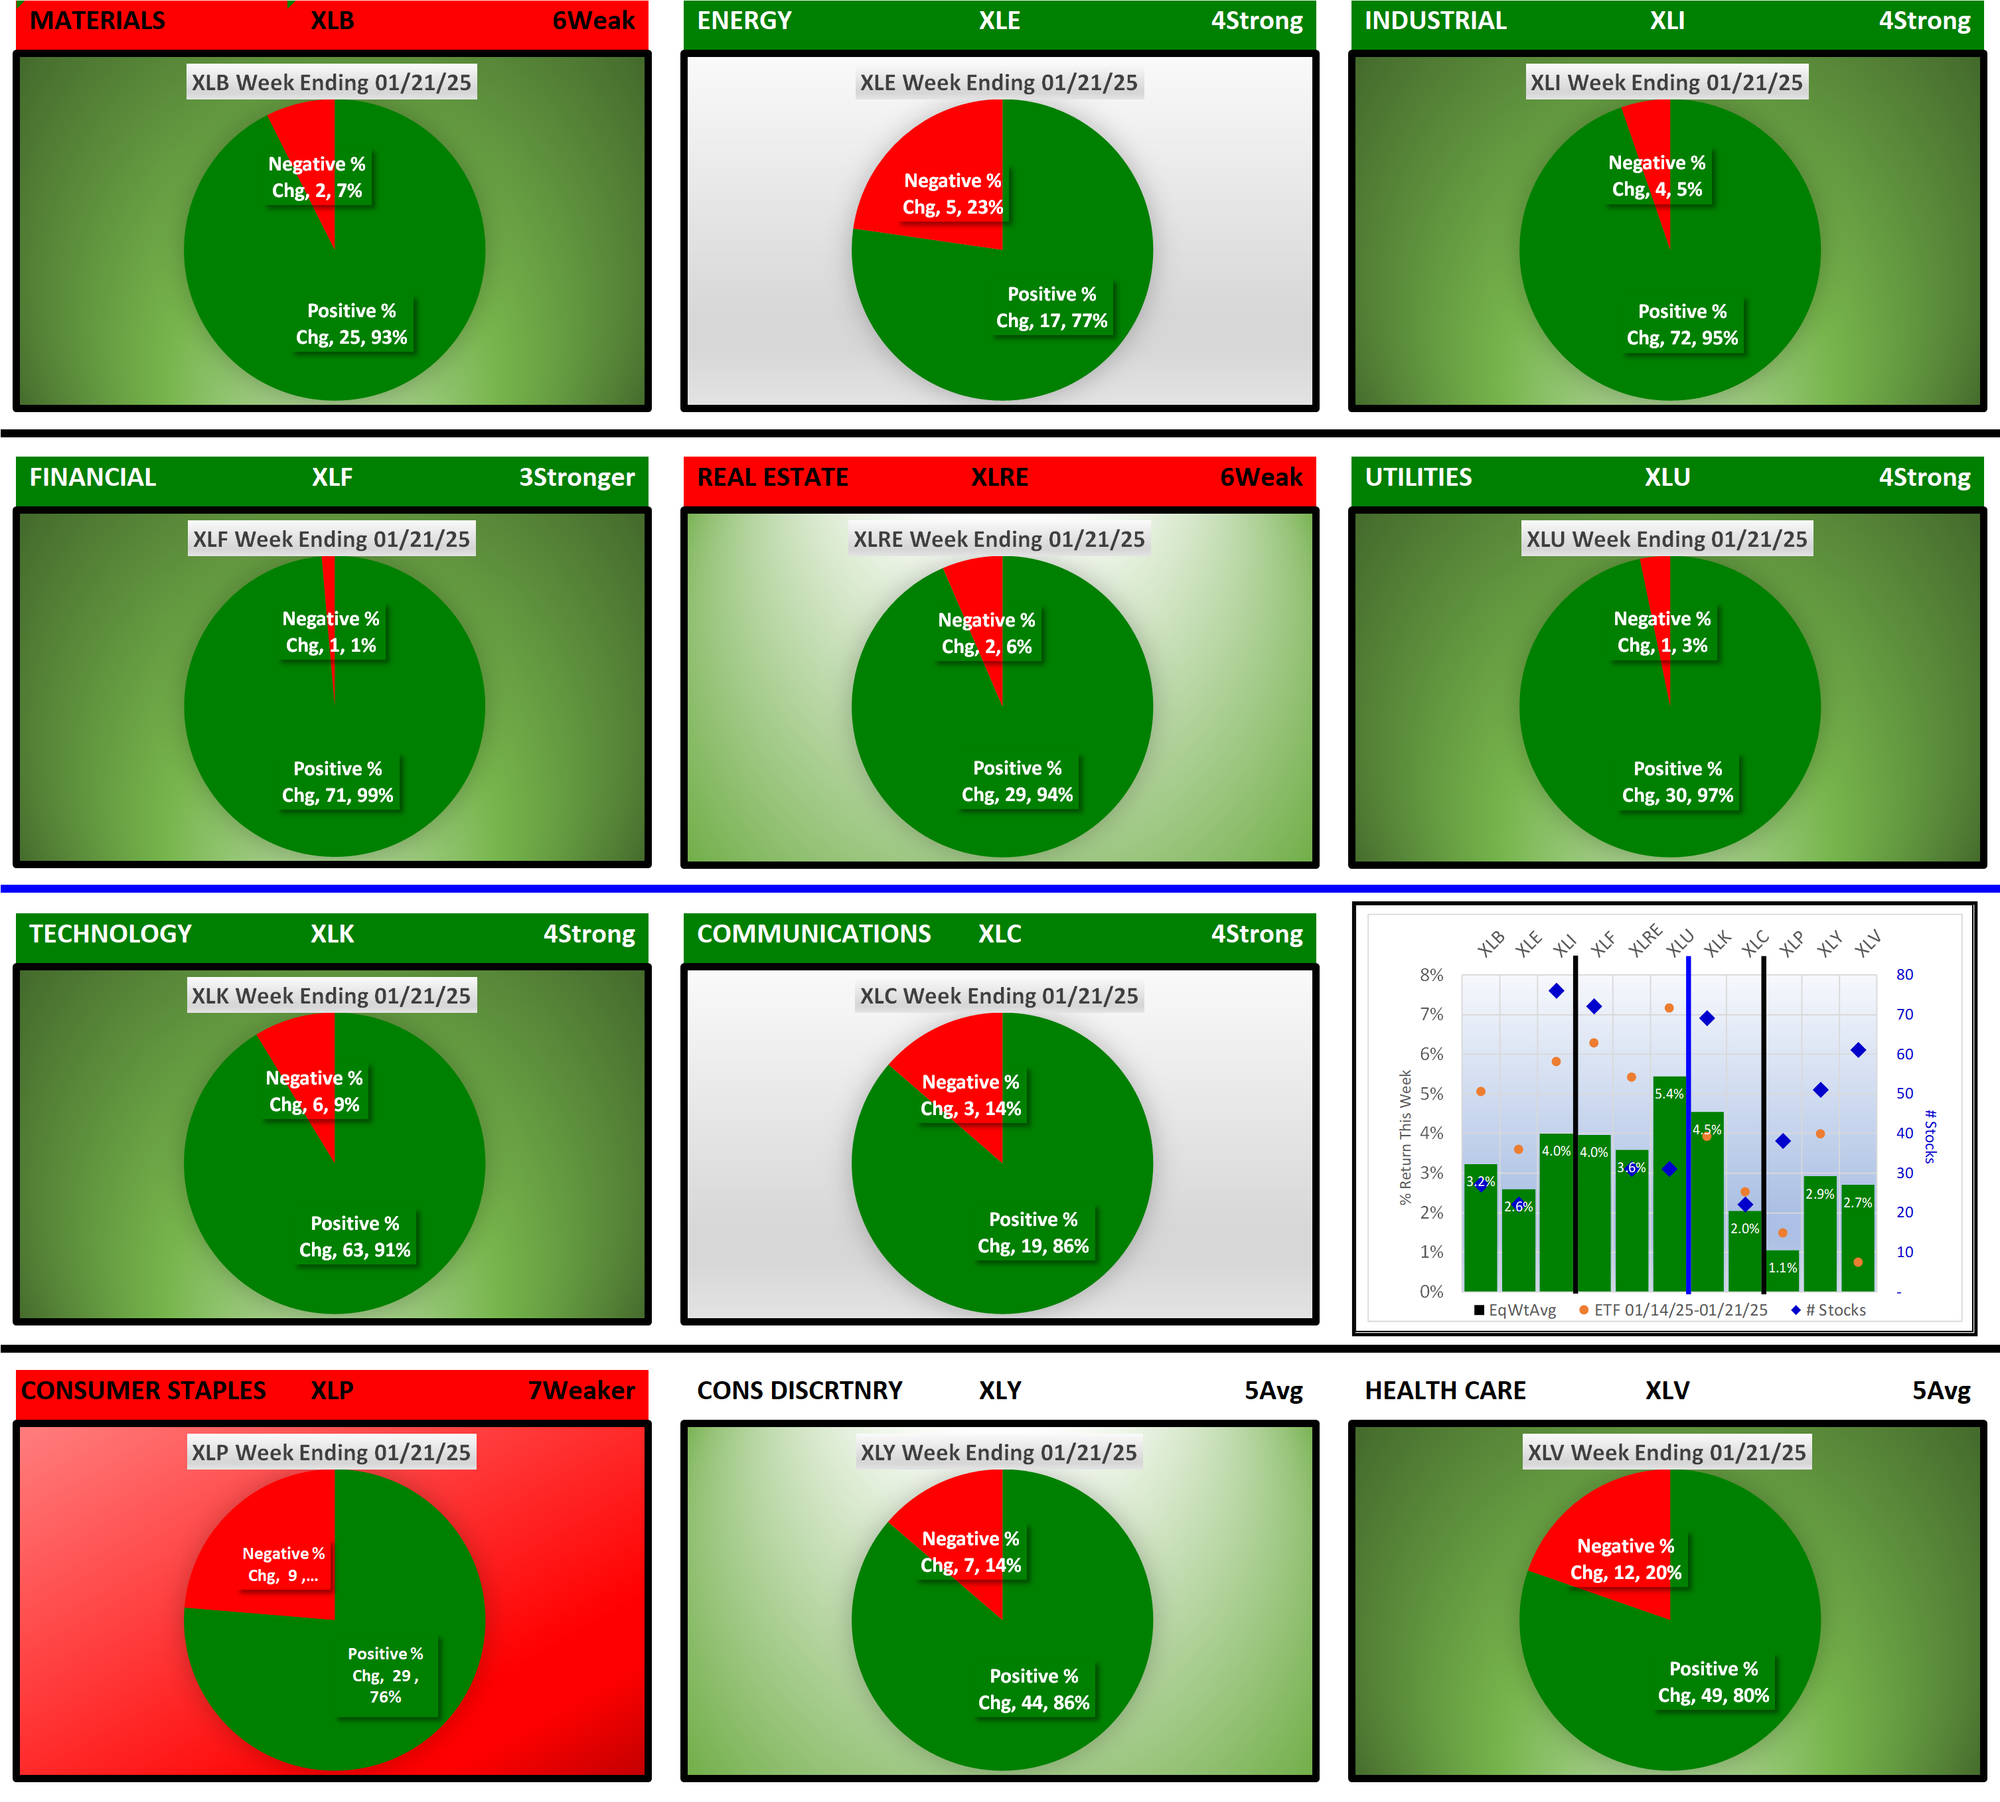
All 11 ETFs had positive average returns for the week. XLU/Utilities had the highest positive average return at +5.4%.
1.3 Historical: 10 Week Ratings by ETF
Below are 10-week historical strength rating summaries of the ETFs, sorted by ETF - each grouping shows the 10-week ratings change for individual ETFs. This shows the path each ETF has taken over the past 10 weeks to arrive at the current strength rating.
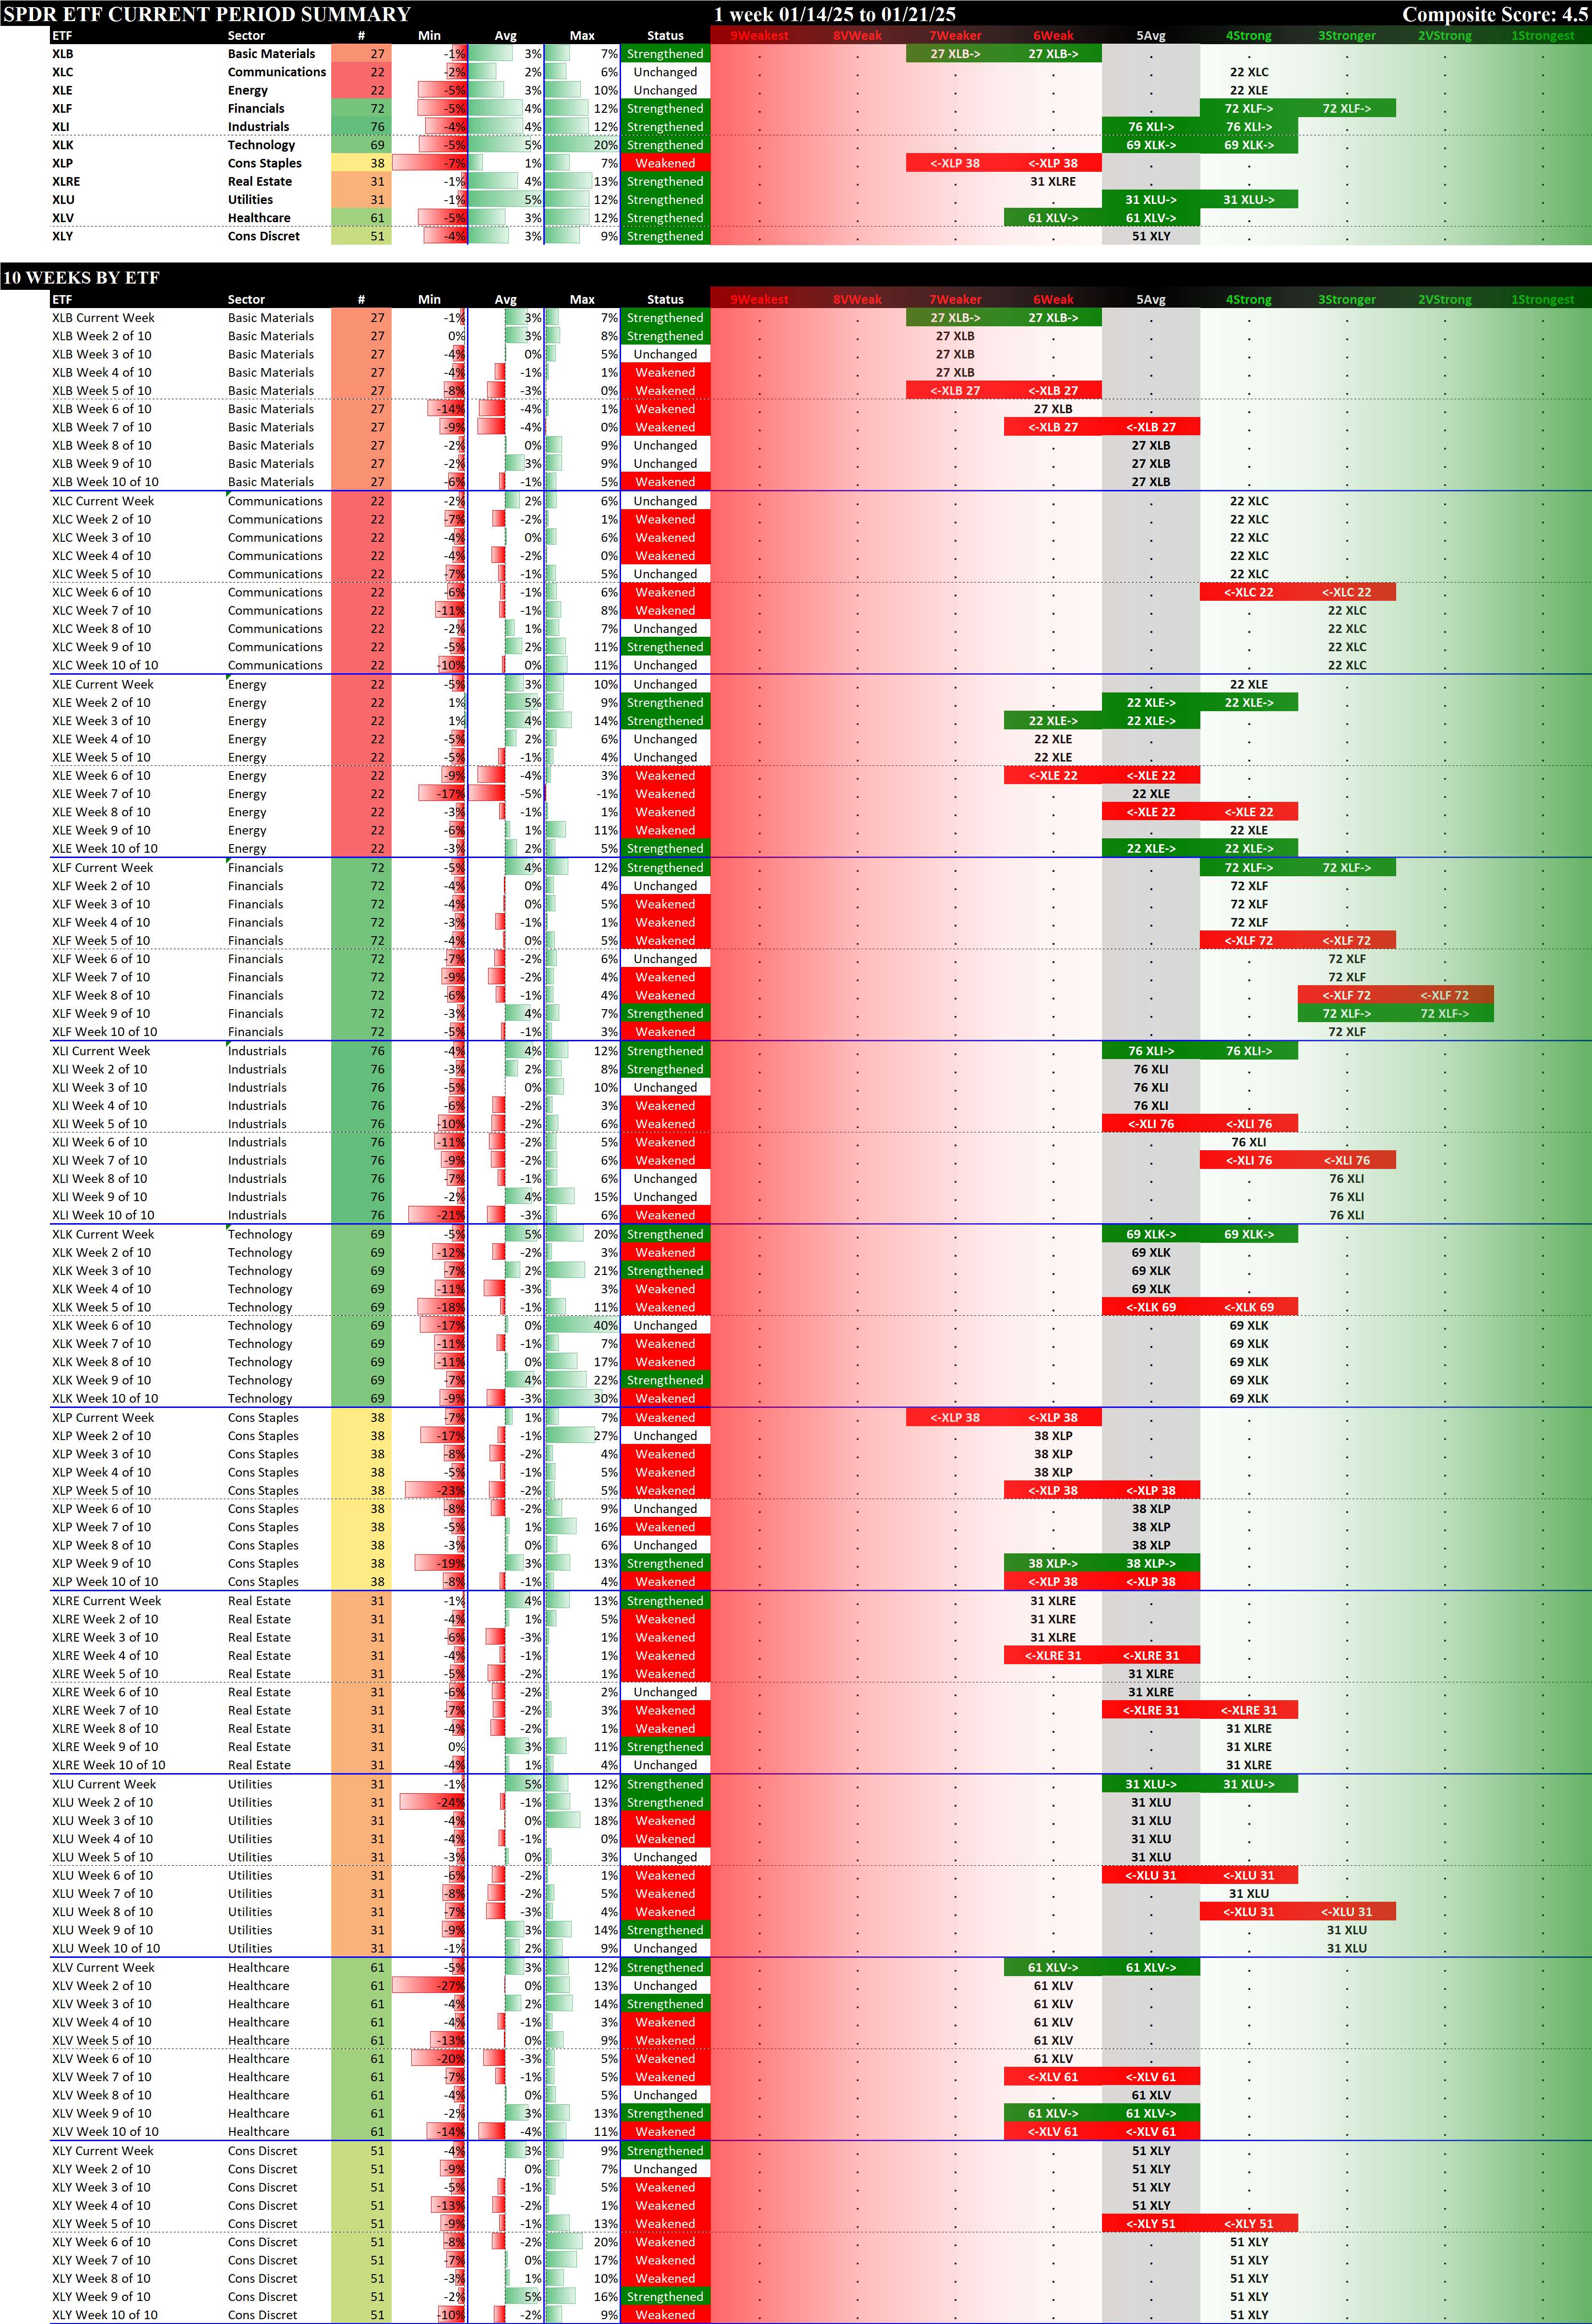
1.4 Historical: 10-Week Ratings by Week
Below are 10-week historical strength rating summaries of the ETFs, sorted by week - each grouping shows one week for all 11 ETFs in newest-to-oldest format. This reveals the weekly strengthening/weakening path of all the ETFs.
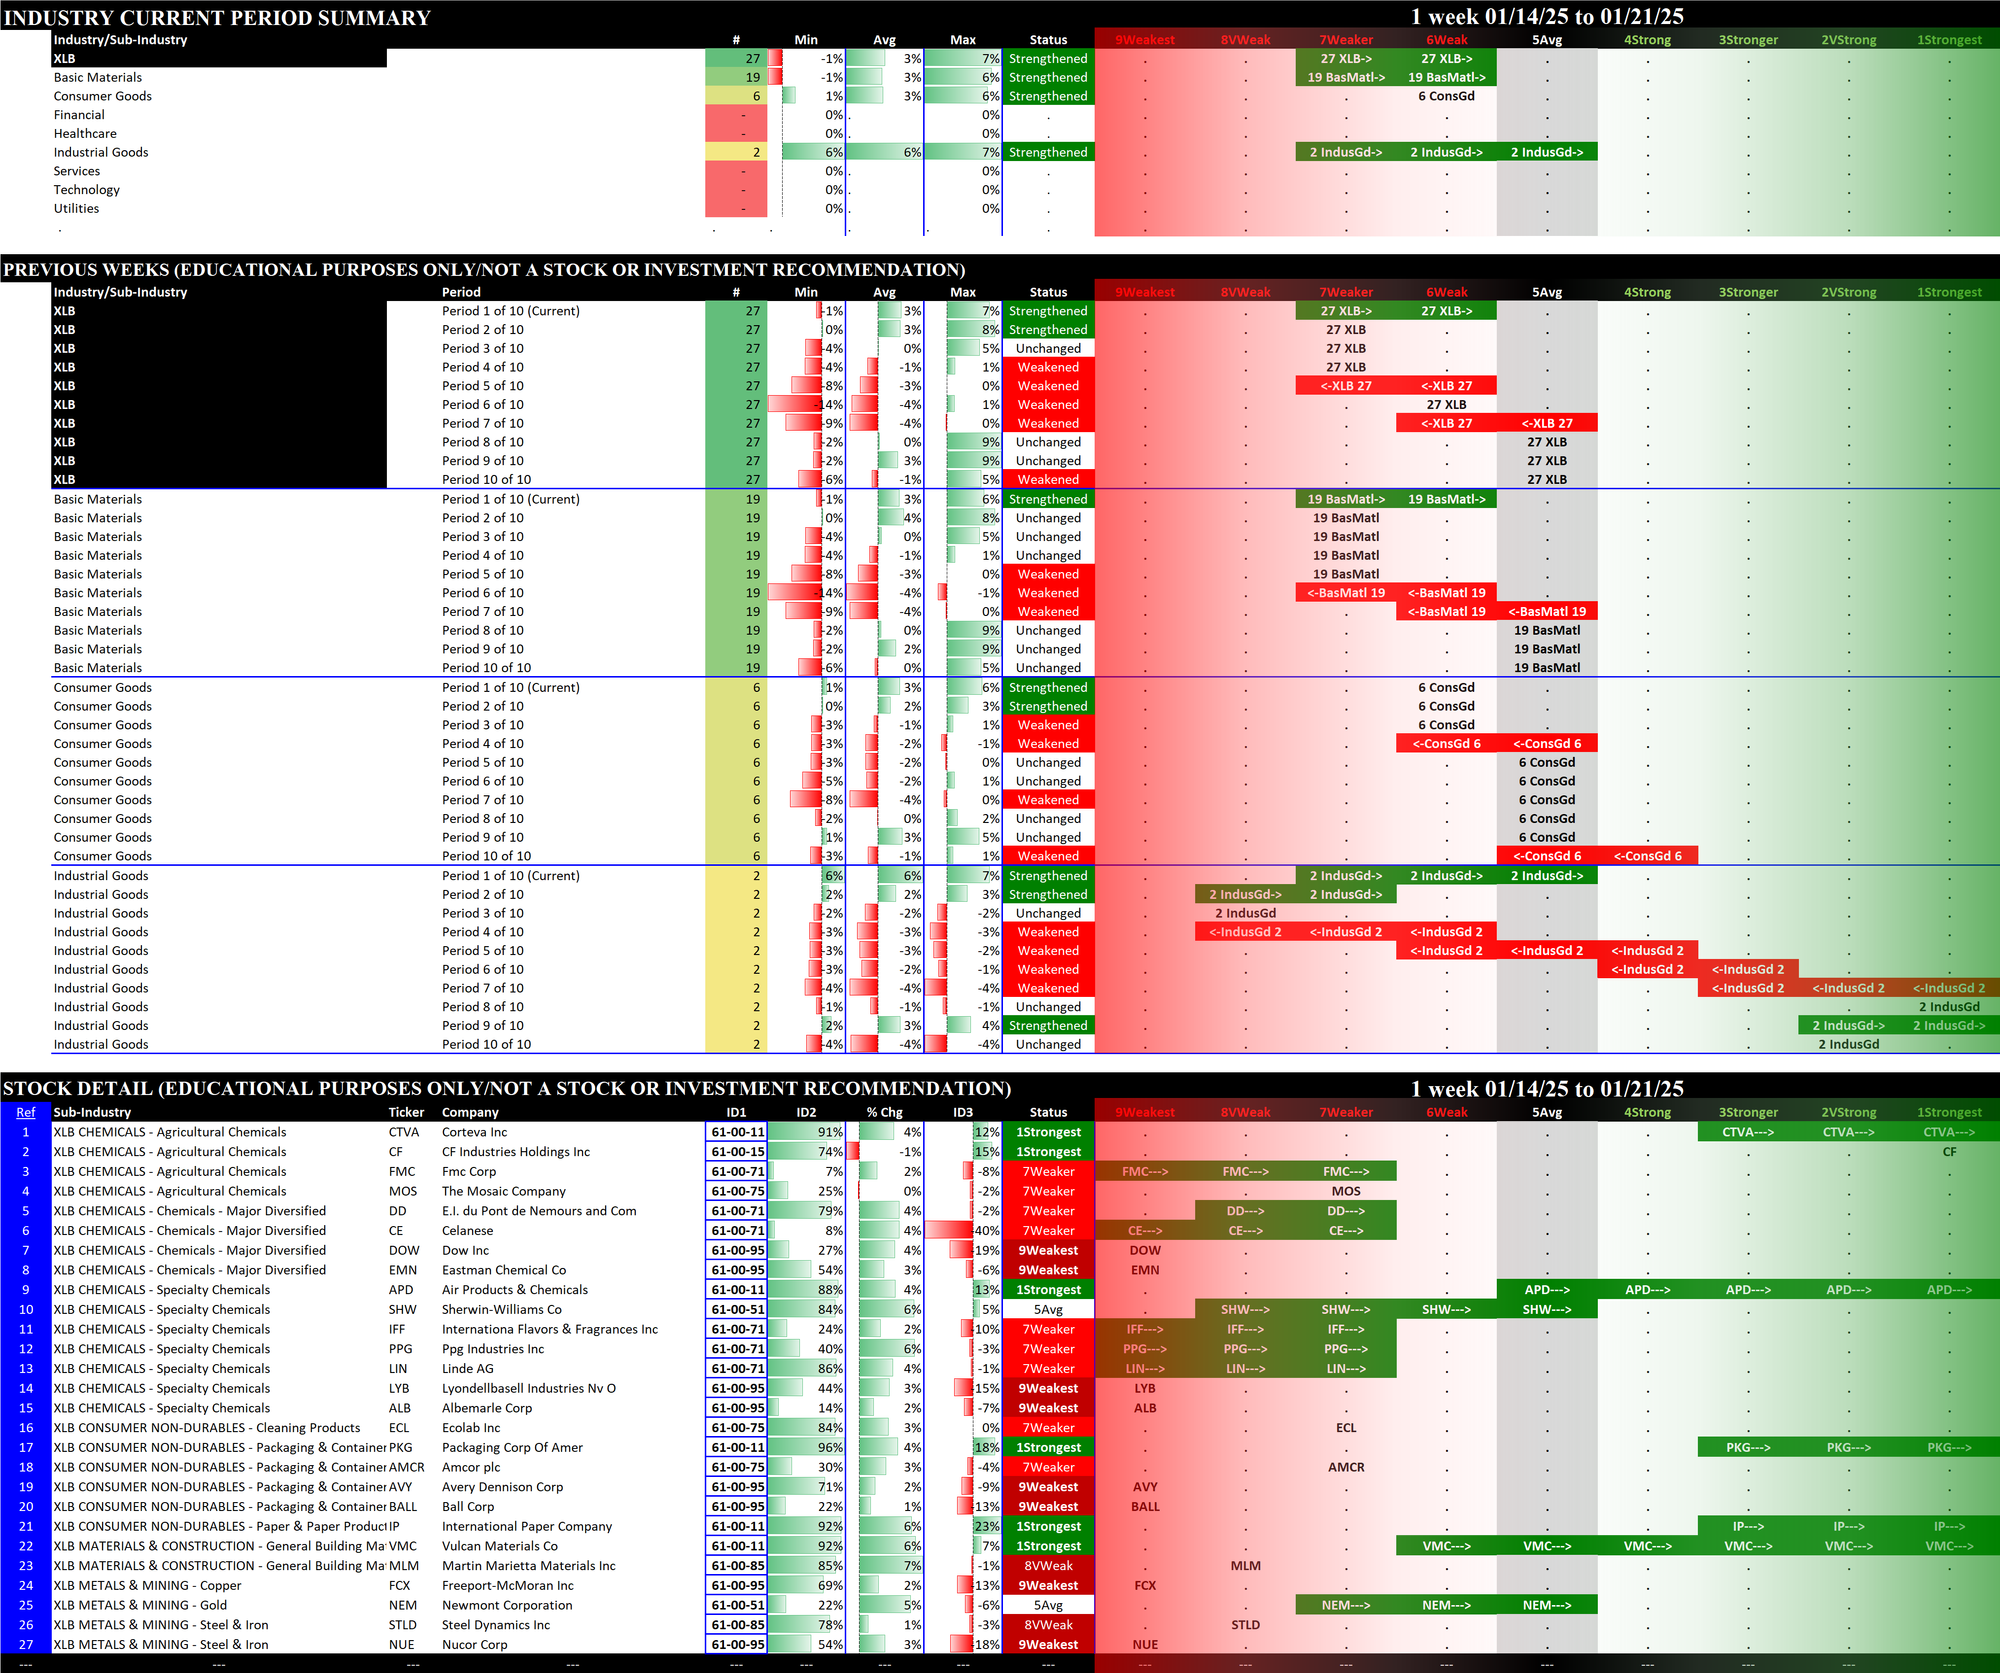
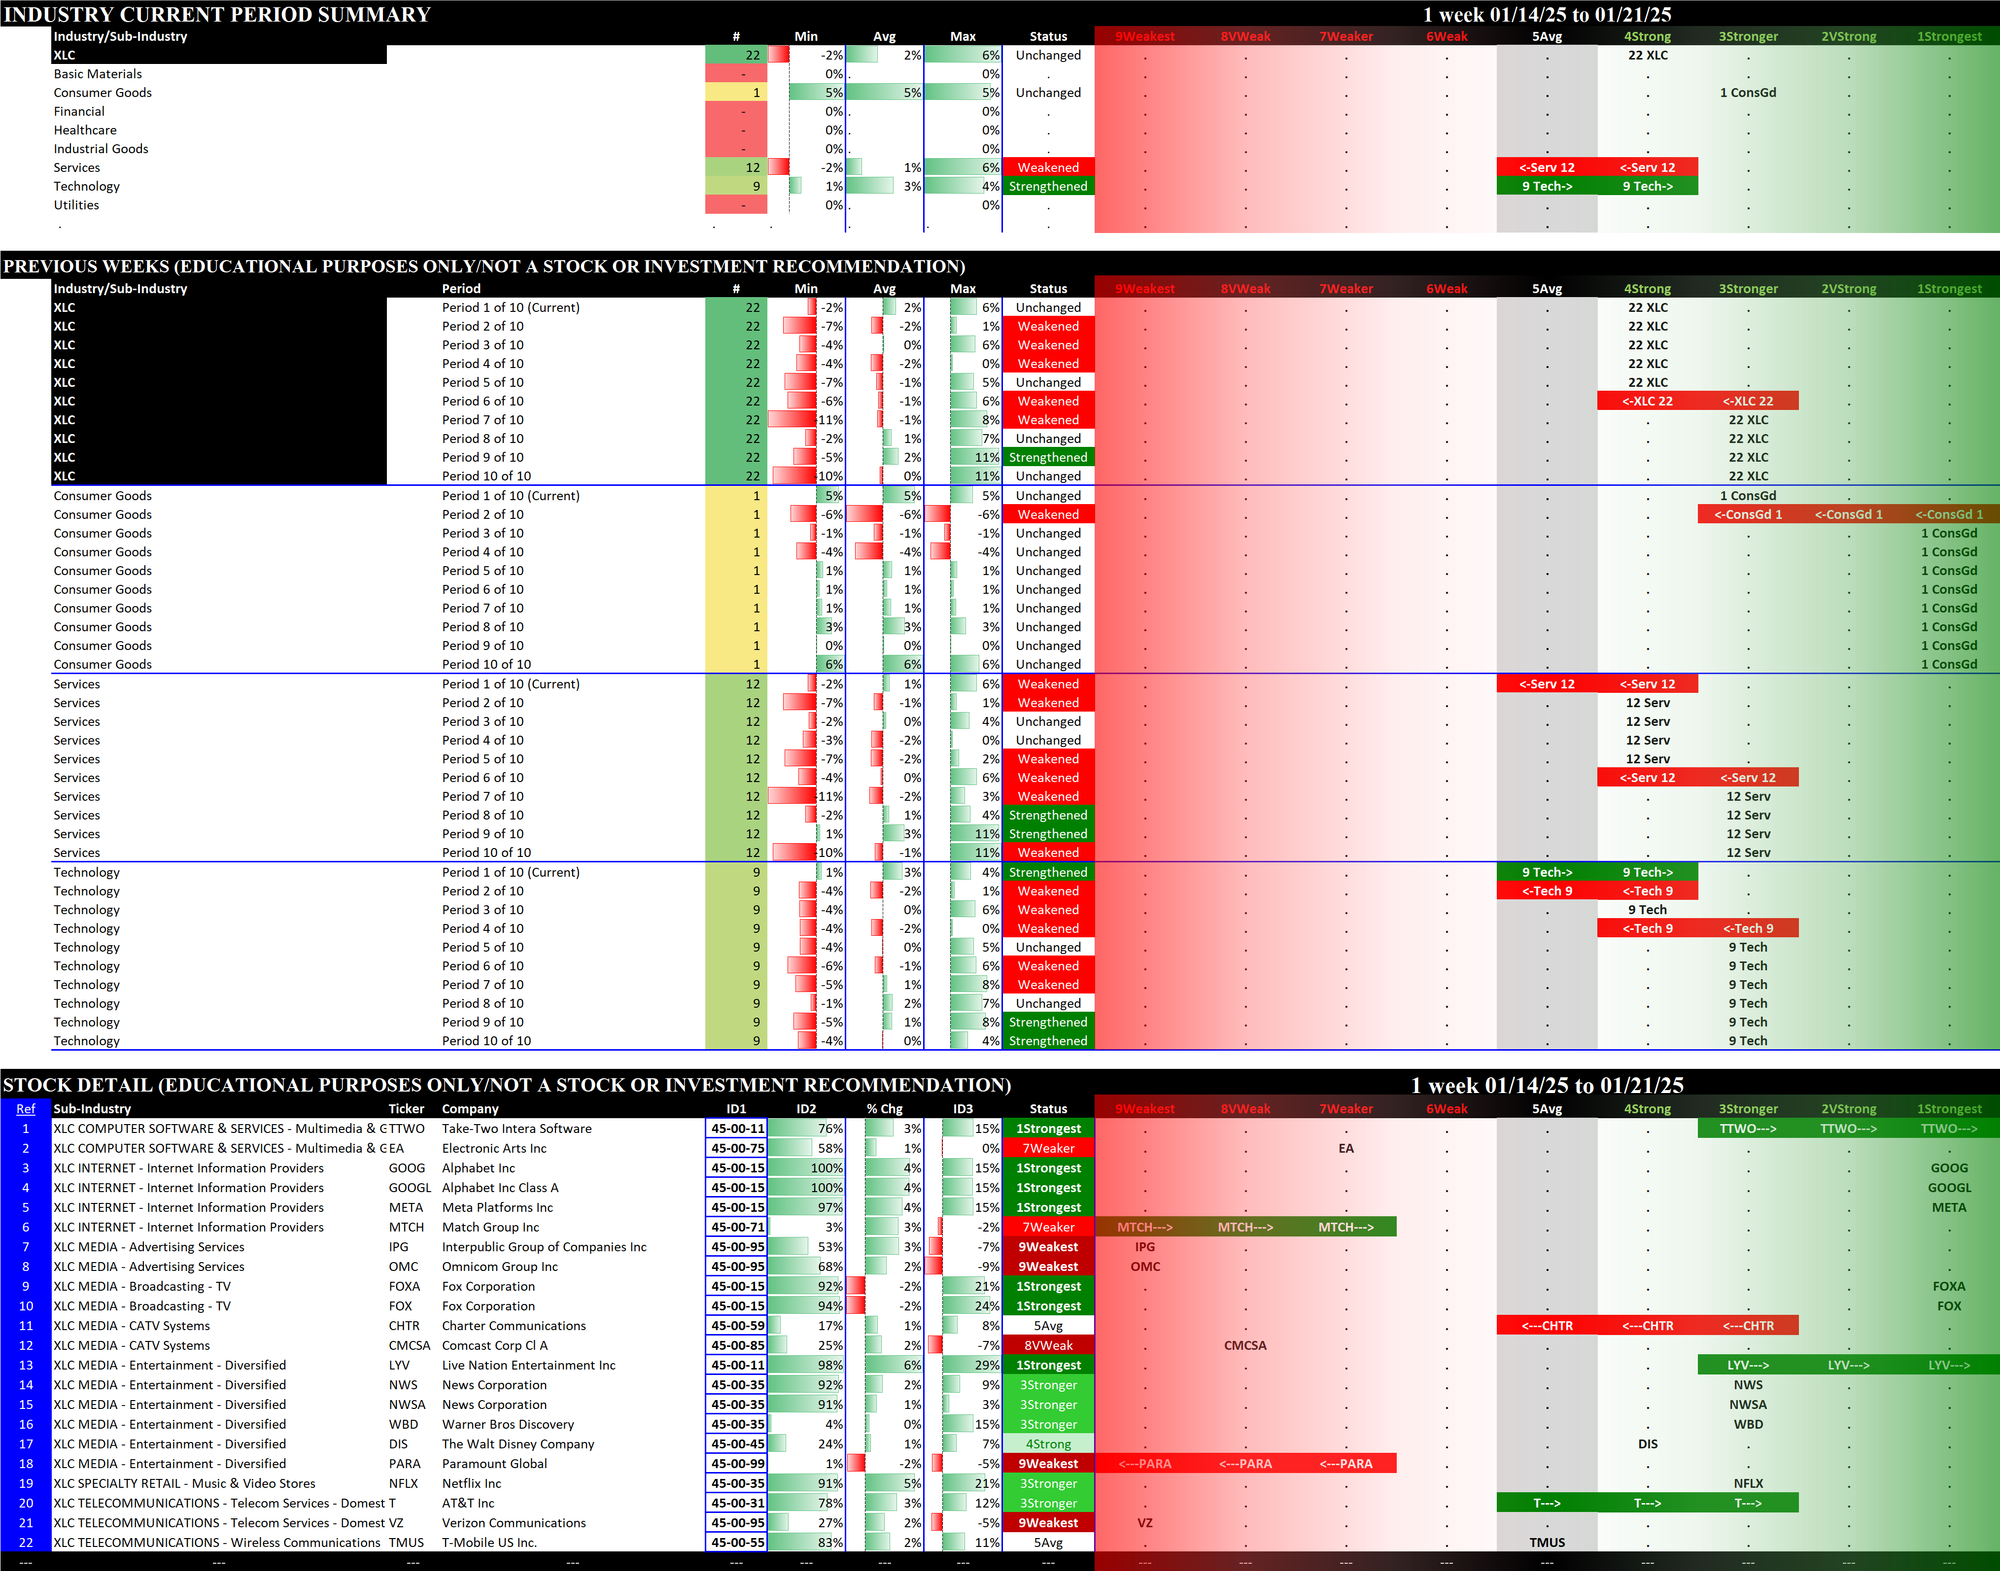
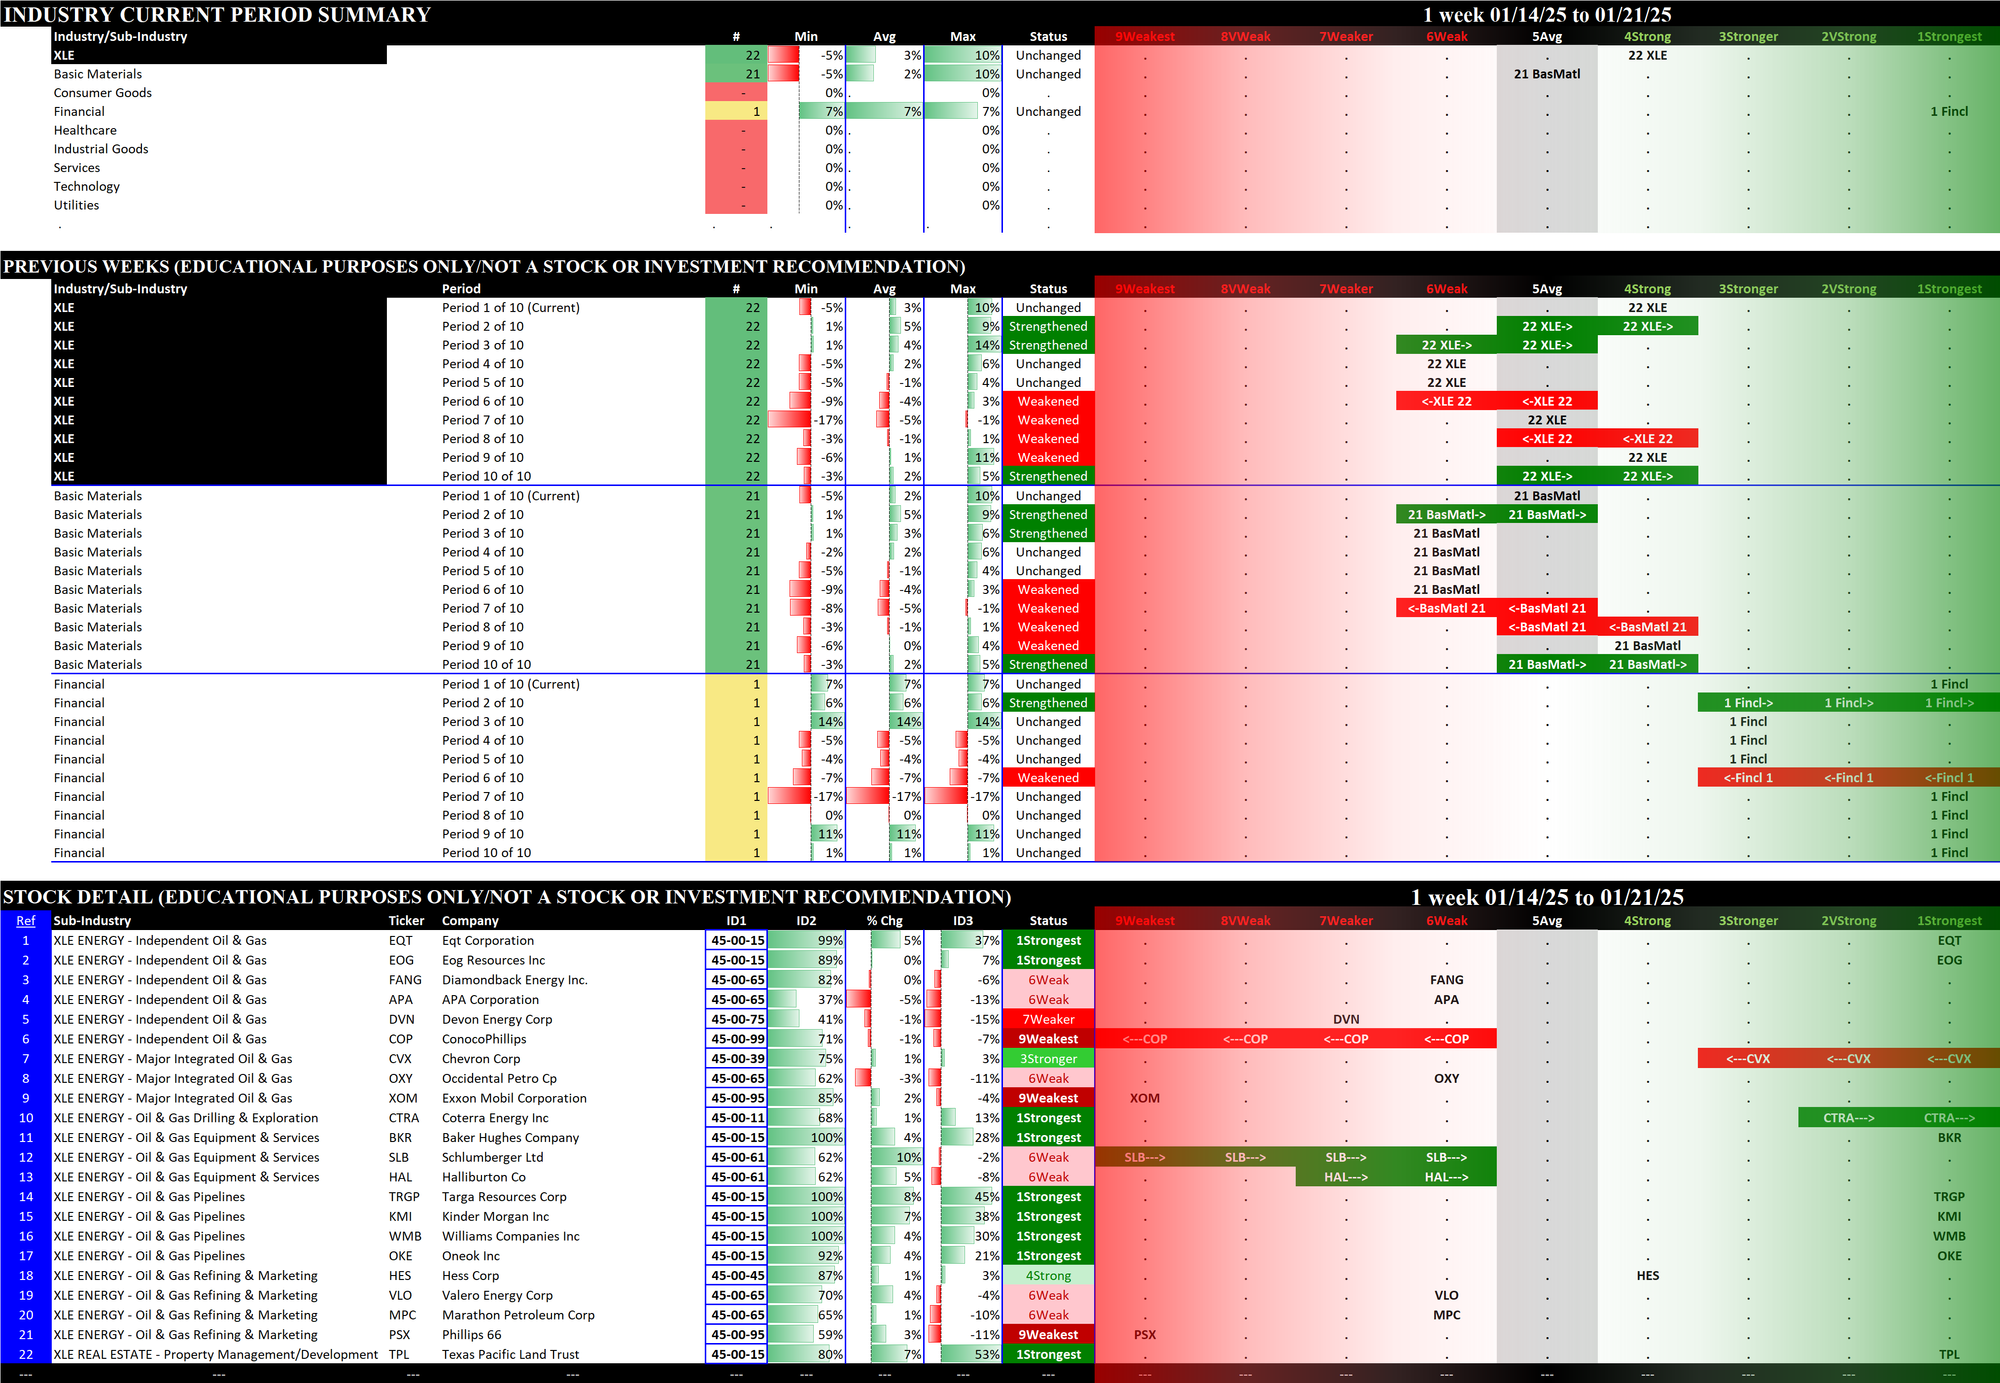
2. ETFs Detail
Details for each of the 11 ETFs are provided below. Comments:
- The top section shows the strength rating of the sectors comprising each ETF, based on the eight original Stock Market Organizer classifications and NOT the 11 ETF classifications. For example, the XLB Basic Materials ETF consists of 19 Basic Materials stocks, 6 Consumer Goods stocks, and 2 Industrial Goods stocks.
- The middle section shows the previous 10 weeks' strengthening and weakening of the relevant sectors. For example, since the XLB has Basic Materials, Consumer Goods, and Industrial Goods stocks, these three sectors are shown in the middle section of the XLB detail. The XLF (Financial) has Financial, Services, and Tech stocks.
- The bottom section shows strengthening/weakening for the underlying ETF component stocks, and includes the listing of their Stock Market Organizer industries and sub-industries. These stocks are listed in order based on Sub-industry then strongest to weakest comparative stock strength rating. The Basic Materials XLB ETF includes both Newmont Corporation/NEM in the Gold sub-industry within the Metals & Mining industry and Dow Inc./DOW in the Specialty Chemicals sub-industry within the Chemicals industry.
In these bottom sections, one can visually see the strength/strengthening and weakness/weakening of the component stocks in each ETF.
2.1 XLB Materials (27 stocks, small), STRENGTHENED RATING
TO 6Weak
2.2 XLC Communication Services (22 stocks, small), Unchanged at 4Strong
2.3 XLE Energy (22 stocks, small), Unchanged at 4Strong
2.4 XLF Financial (72 stocks, large), STRENGTHENED RATING TO 3Stronger = BEST
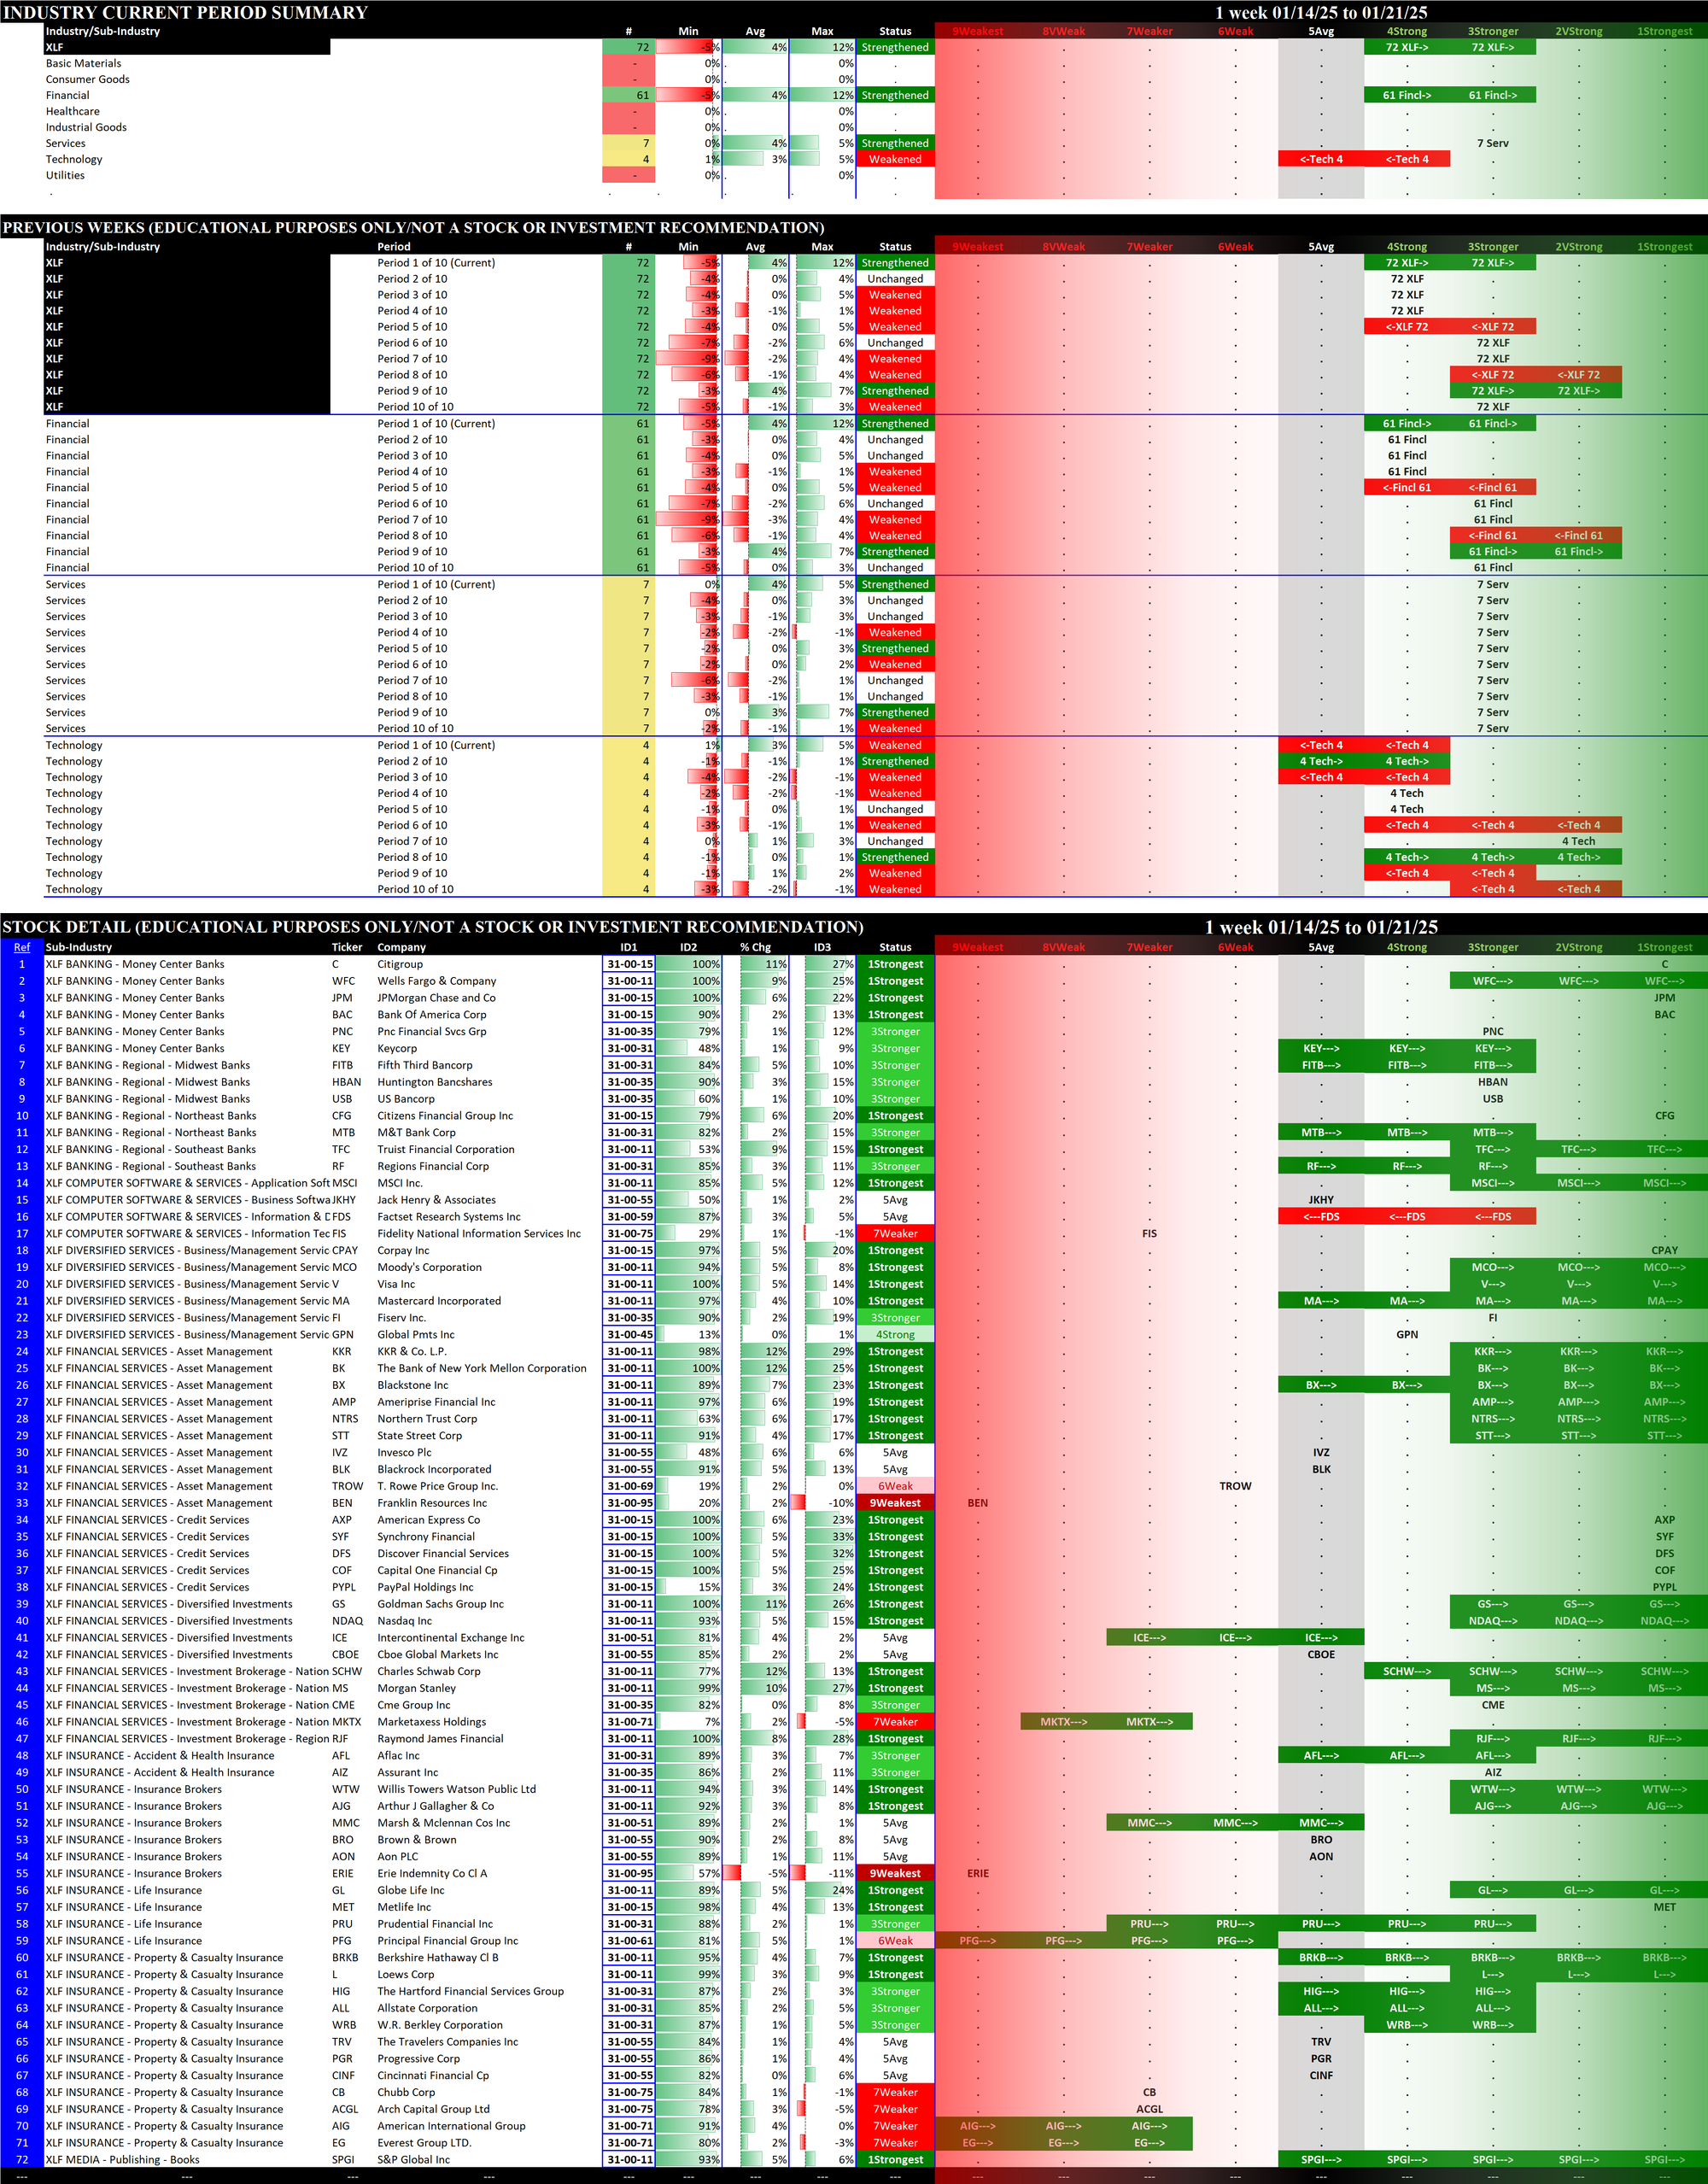
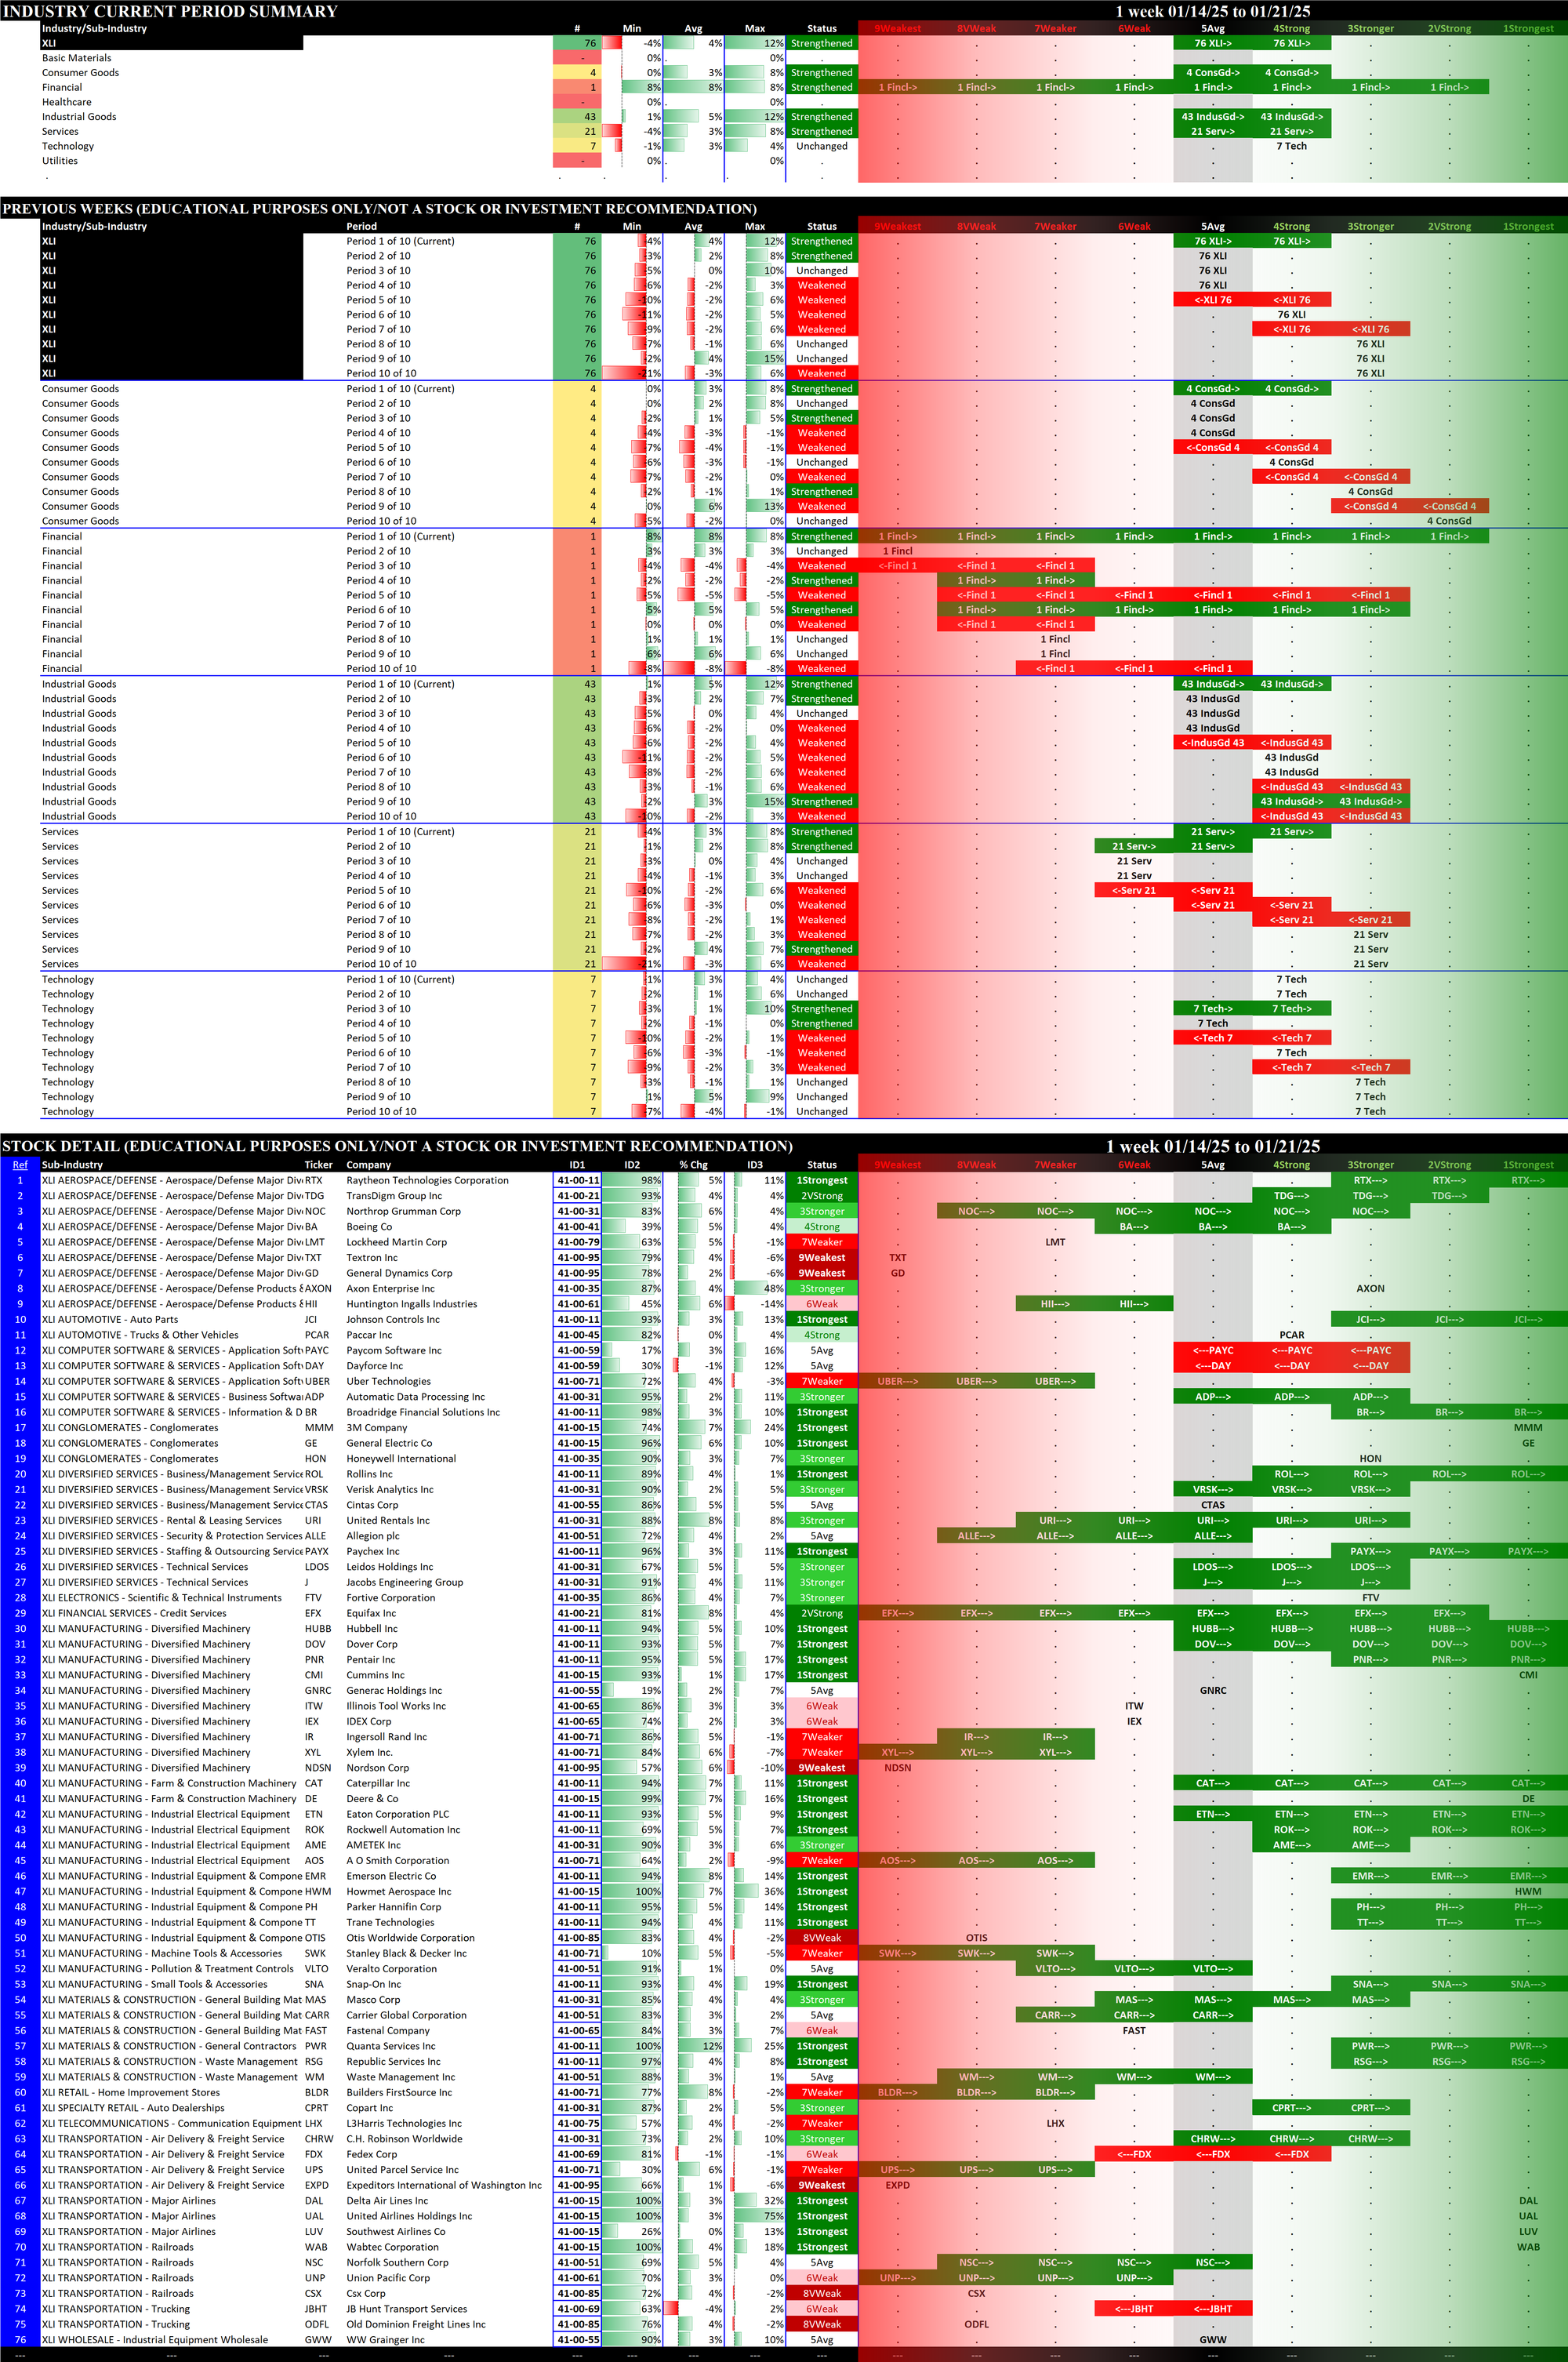
2.5 XLI Industrial (76 stocks, large), STRENGTHENED RATING TO 4Strong
2.6 XLK Technology (69 stocks, large), STRENGTHENED RATING TO 4Strong
2.7 XLP Consumer Staples (38 stocks, mid-sized), WEAKENED RATING TO 7Weaker = WORST
2.8 XLRE Real Estate (31 stocks, small/mid-sized), Strengthened at 6Weak
2.9 XLU Utilities (31 stocks, small/mid-sized), STRENGTHENED RATING TO 4Strong
2.10 XLV Health Care (61 stocks, large), STRENGTHENED RATING TO 5Avg
2.11 XLY Consumer Discretionary (51 stocks, mid-sized/large), Strengthened at 5Avg
3. Stock Detail
The downloadable PDF below lists all component stocks in order of first Strongest to Weakest ETF and second Strongest to Weakest Stock. The difference between this report and the 11 ETF stock listings above is this report consolidates all component stocks whereas the above listings are segregated by ETF.
Download the following Excel file if you are interested in sorting results yourself.