SPDR Sector ETFs Friday 2025-03-14: 5.4 Strength Score (Weakened -0.5)
This post consists of the following five sections:
I. Introduction
II. Weekly Returns
III. Spectrum Graph Analysis
IV. Today's Market Context
V. Detailed Sector ETF Analysis
Last Friday's ETF strength report is available here.
I. Introduction
Background
This analysis consists of the Stock Market Organizer stock-by-stock strength analysis applied to the 500 stocks that comprise the 11 SPDR Select ETFs.
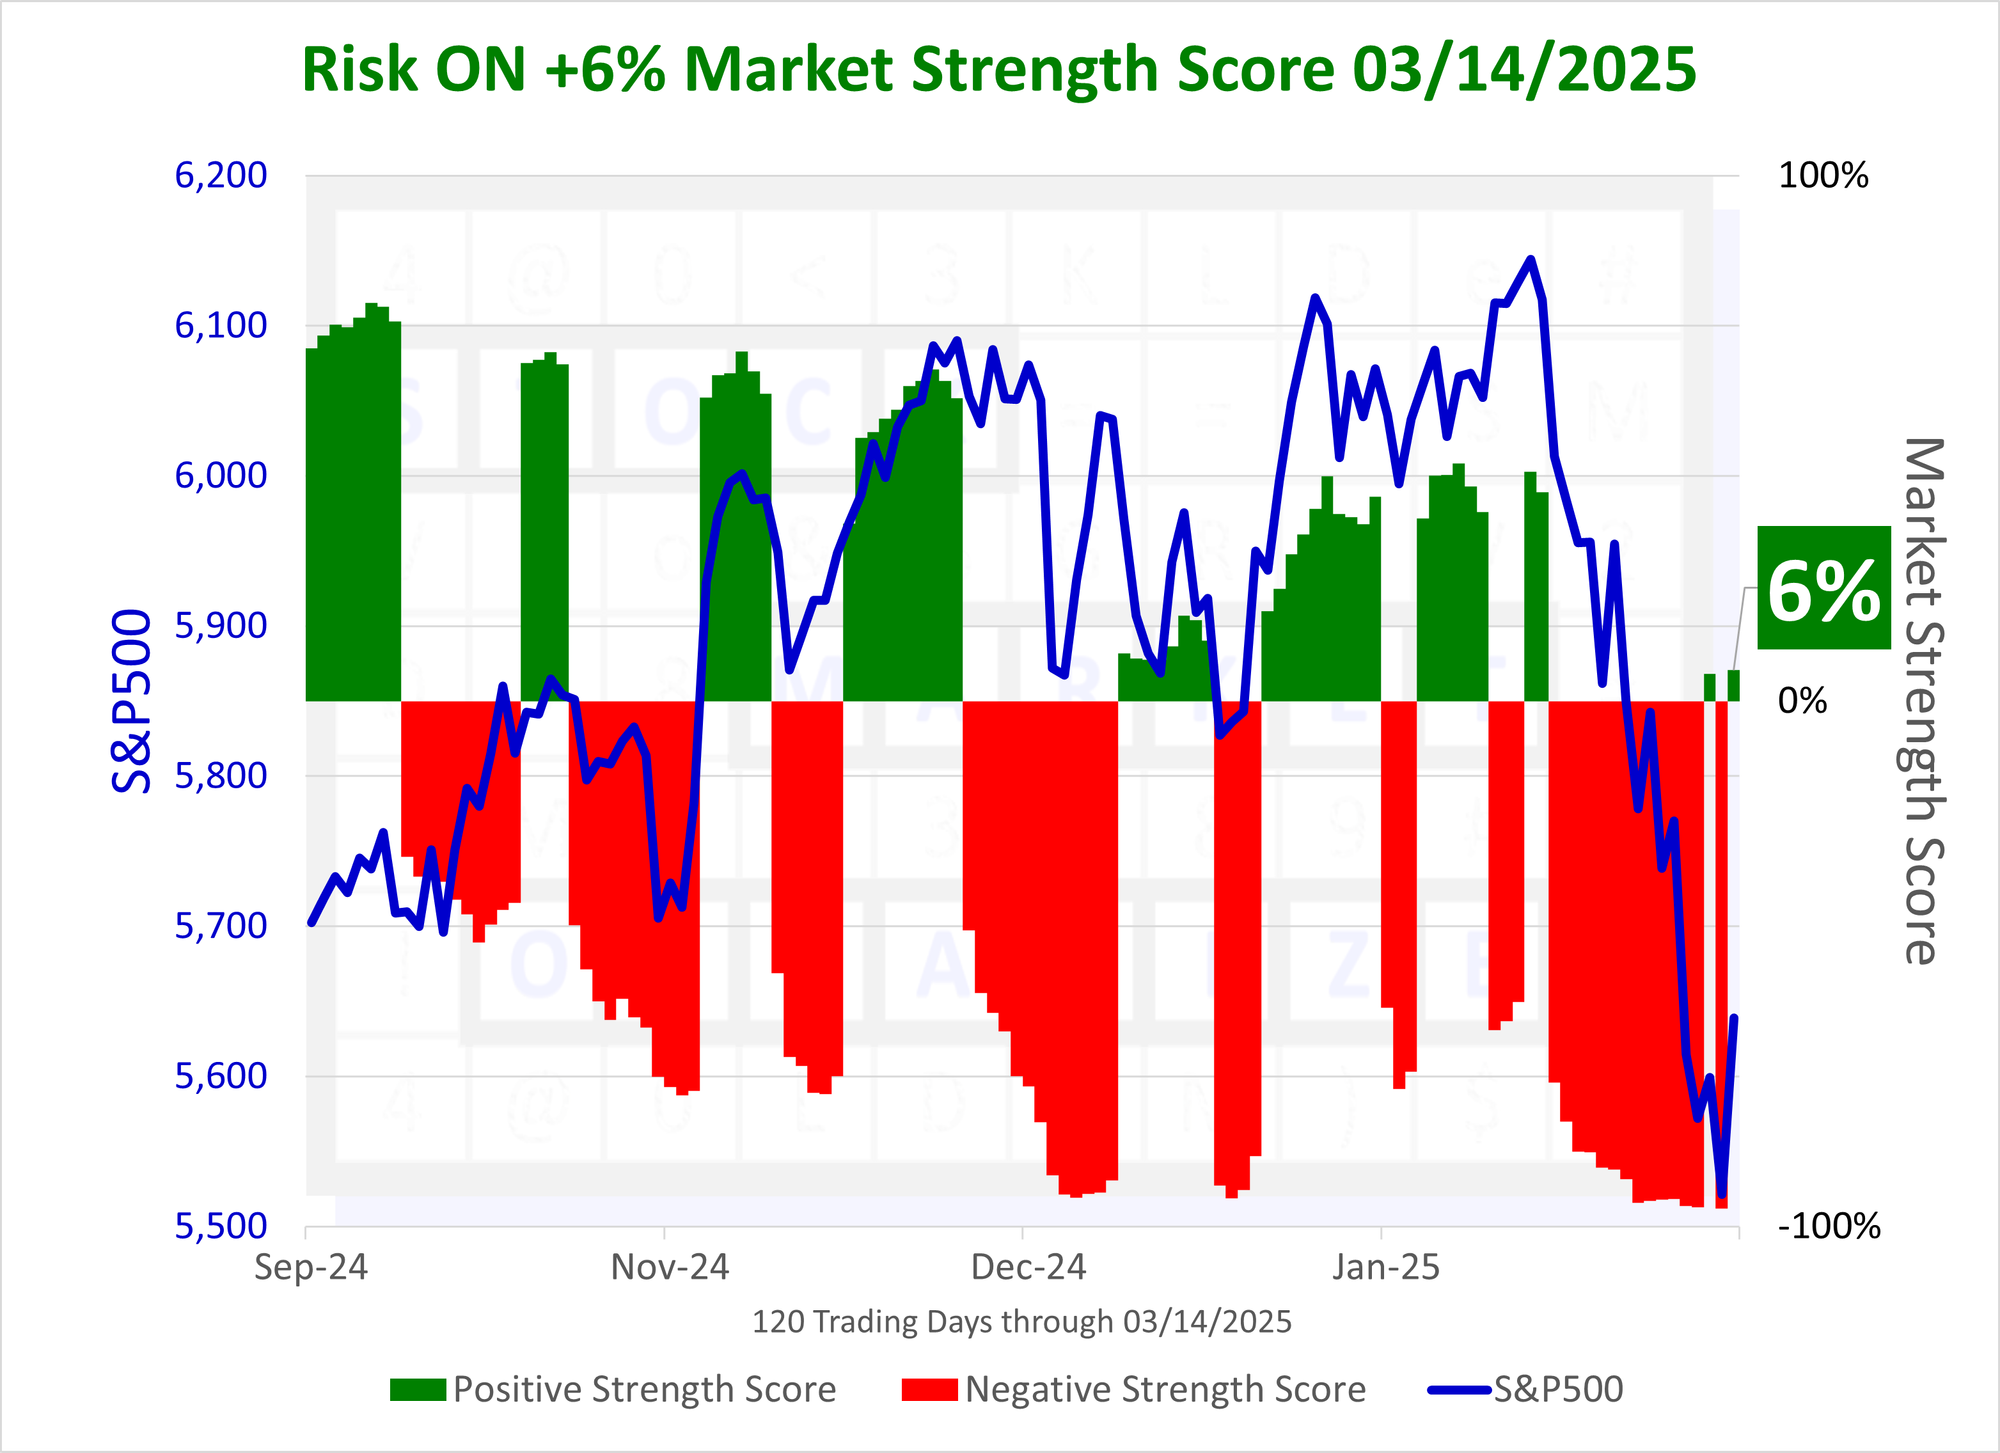
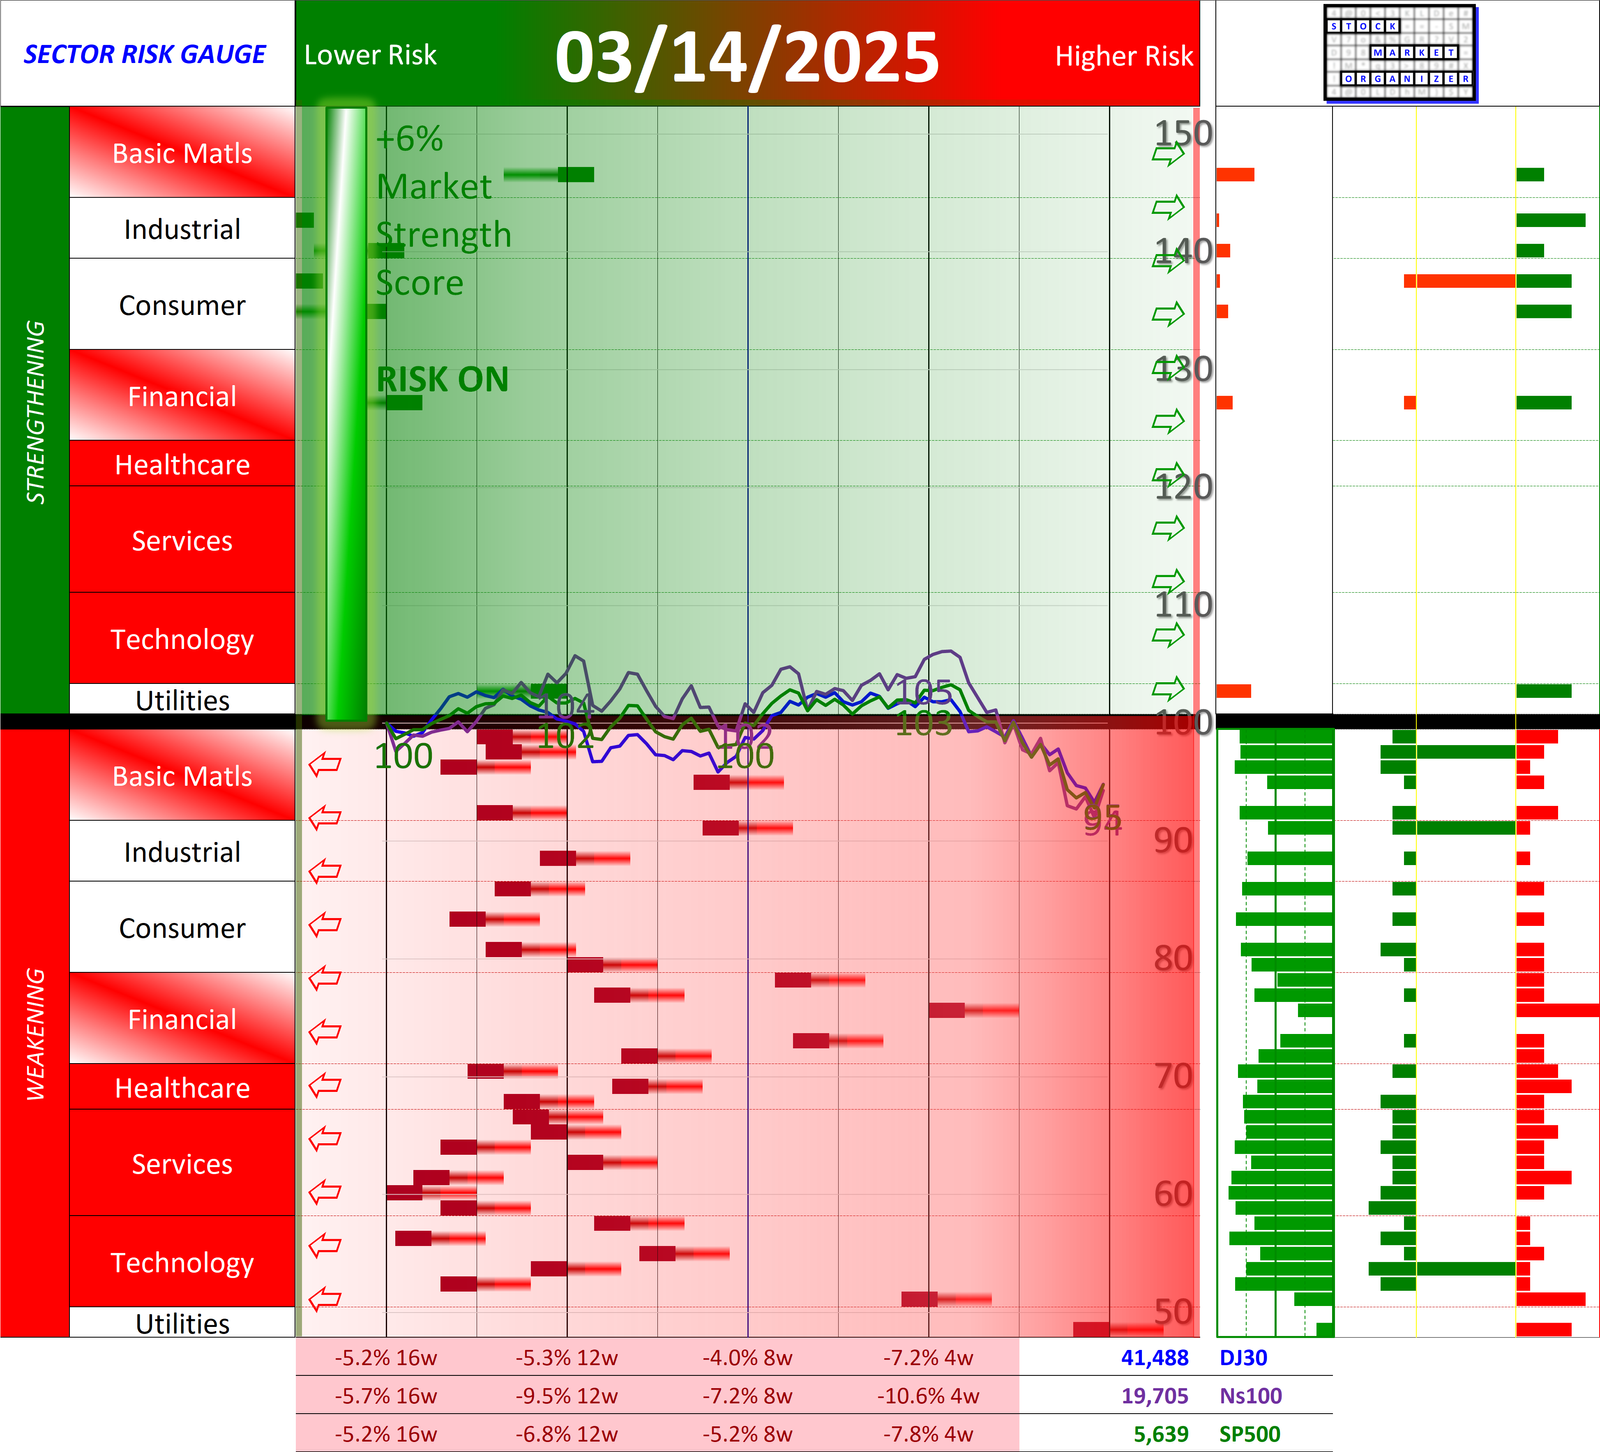
These results are combined with overall market environment readings - the Market Strength Score and the Sector Risk Gauge, which reflect "Risk On" as of Friday, March 14, 2025 - to discern appropriate portfolio exposure and risk/position management given prevailing market and sector conditions. Today the Market Strength Score is +6%, an early reading. This is not a prediction that it will go to the extreme of +100%, it is simply highlighting where the market is relative to a potential extreme.
Why do you care?
This dynamic market analysis provides a continuously updated, apples-to-apples comparison of the strengthening and weakening trends in the US market. By tracking the 500 large-cap stocks across 11 key sectors (via SPDR ETFs), this analysis offers valuable insights for investors seeking to harness momentum in their portfolios.
Each week, the analysis clearly identifies which sectors and stocks have gained, remained flat, or lost ground. With this data, investors can objectively assess sector and stock strength, refining their timing and positioning for new investments. Ultimately, this approach aims to enhance long-term portfolio performance by leveraging momentum – a proven market factor – to inform data-driven investment decisions.
Most Important Ranking: Strengthening Status
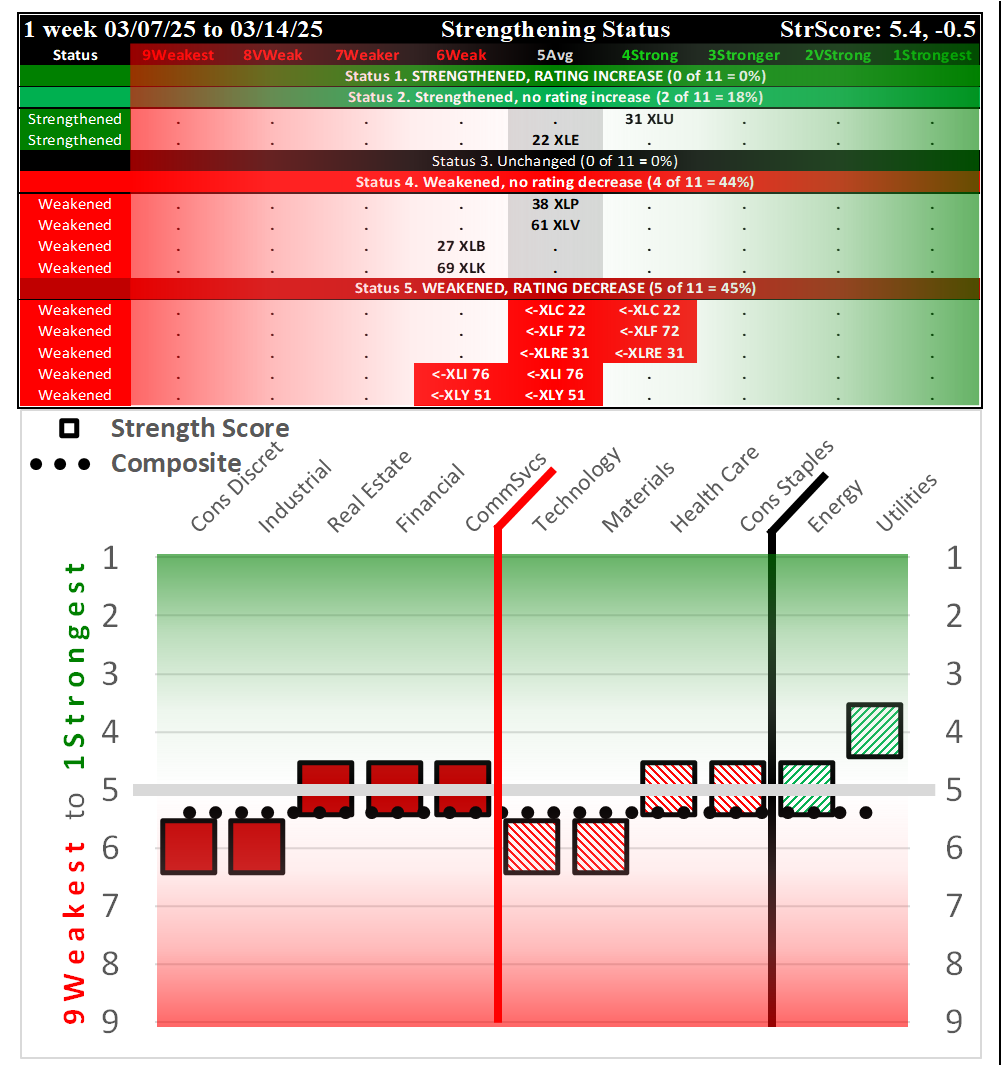
The following Strengthening Status spectrum graph shows the ETFs based on their current strengthening status, as compared to last week.
These are ordered based on important distinctions - did an ETF strengthen or weaken, enough (or not) to change rating, and where in the ratings scale (aka the spectrum of possibilities) does the ETF currently lie?
This graphic clearly provides this key information at a glance.
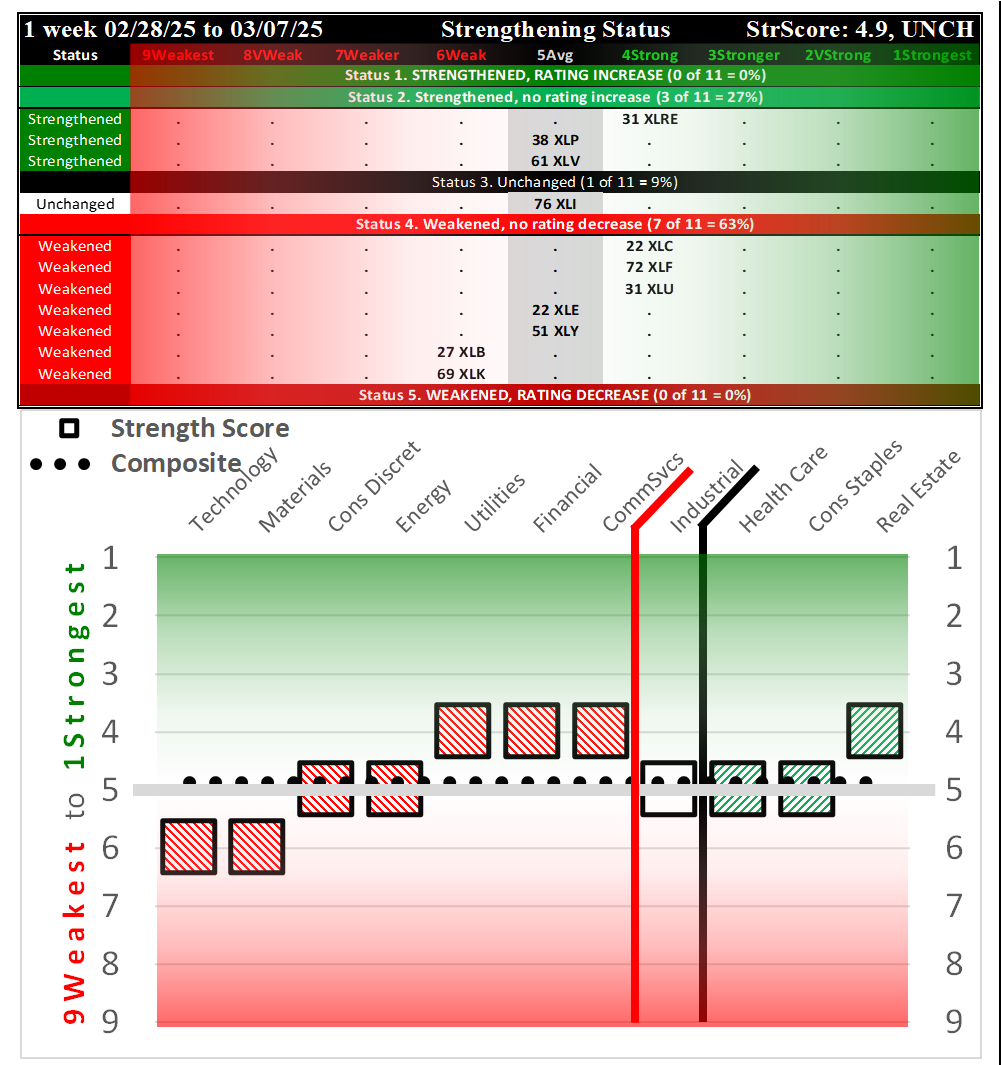

The past three weeks Strengthening Status show weakening to unchanged to weakening this week. The upper portions show strengthening from the top row down, while the lower portions show strengthening from right to left. These graphics are set up to clearly convey which ETFs/sectors strengthened or weakened, and from/to where this happened. Though it is impossible to determine how long these signals will last (what will be), the critical point is that these are the objective strength levels of these ETFs right now (what is).
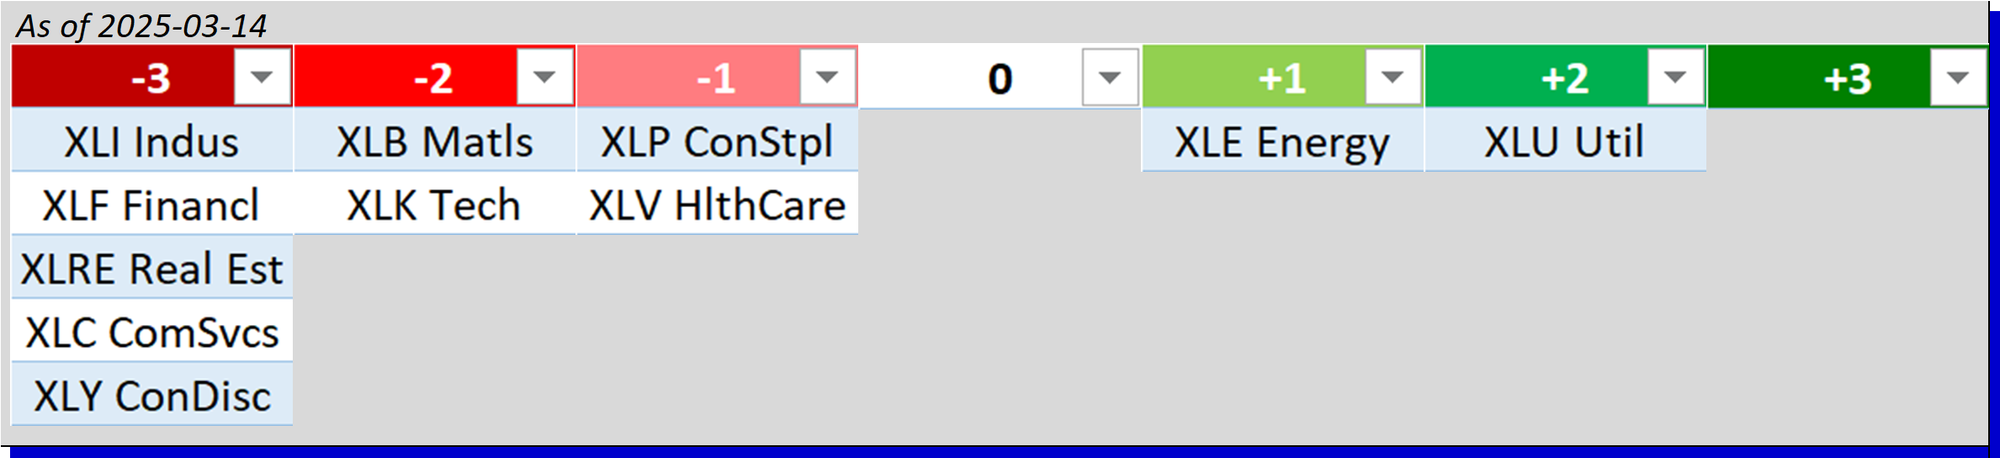
Bottom Line Translation
Each ETF/Sector is given a Bottom Line rating below on a scale of -3 (Worst) to +3 (Best) based on A) the ending strength rating of each ETF and B) the strengthening/weakening action of the ETFs during the week, with the five possibilities being 1) strengthened enough to increase rating, 2) strengthened but not enough to increase rating, 3) unchanged, 4) weakened but not enough to decrease rating, and 5) weakened enough to decrease rating.
II. Weekly Returns
Average Returns
The average returns for the underlying stocks in each ETF are shown below - note this is NOT the return for the ETF for this week.
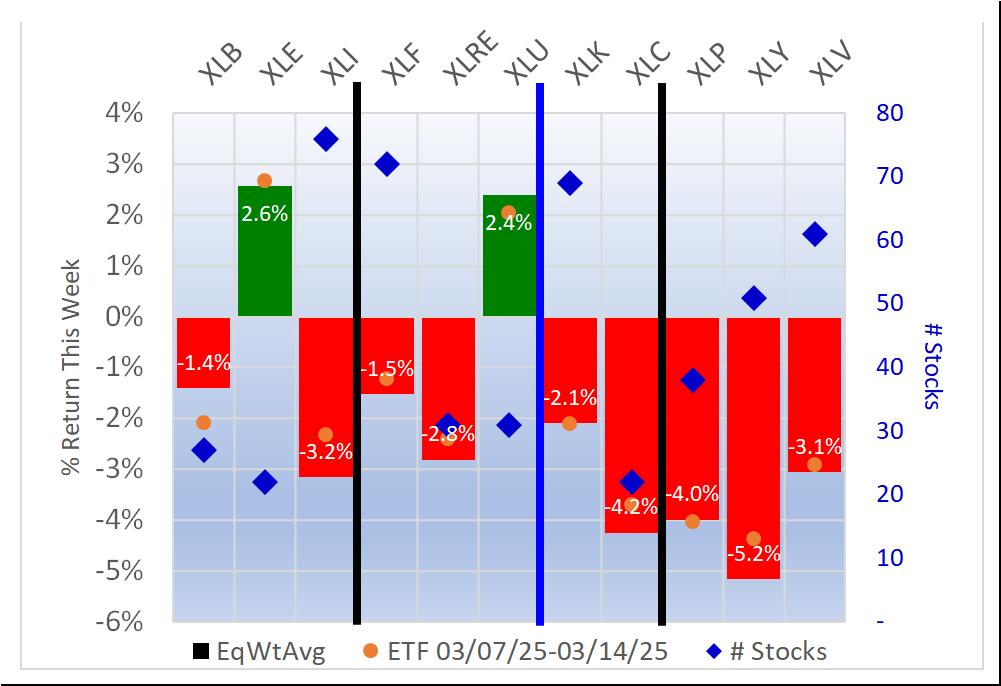
The best and worst are highlighted below:
Best:
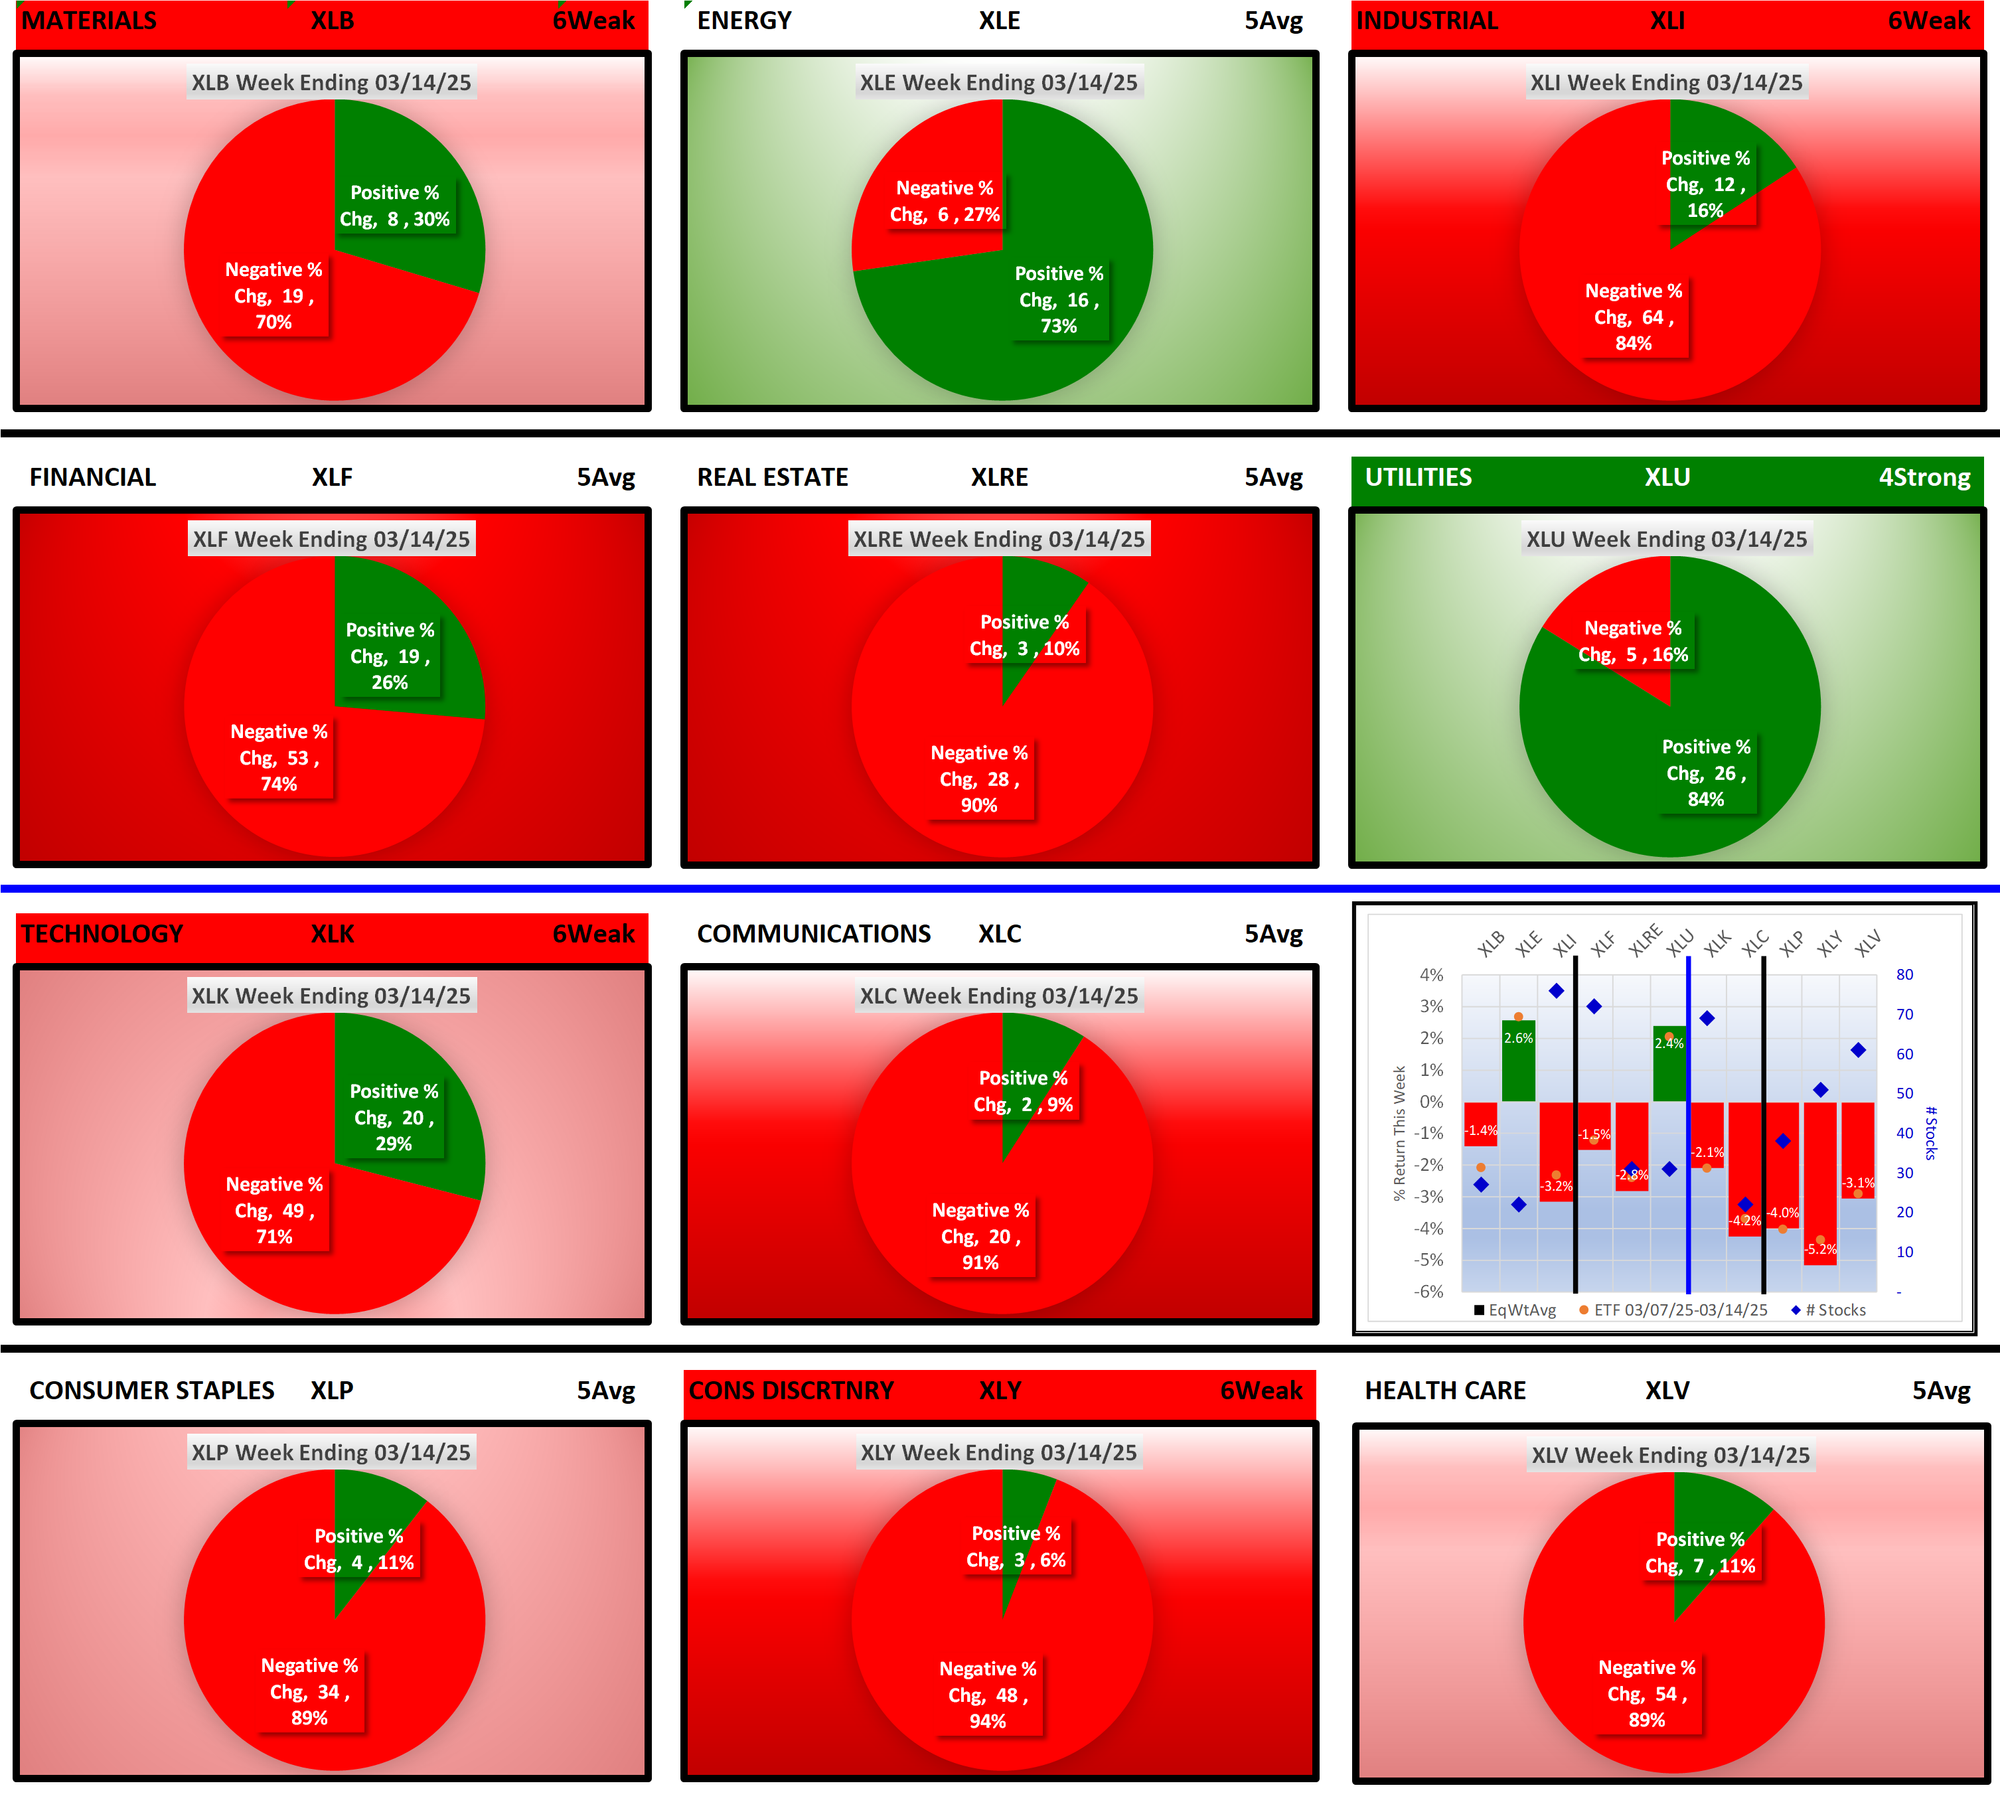
- XLE/Energy, 2.6% average for 22 stocks
- XLU/Utilities, 2.4% average for 31 stocks
- XLB/Materials, -1.4% average for 27 stocks
Worst:
- XLY/Consumer Discretionary, -5.2% average for 51 stocks
- XLC/Communications, -4.2% average for 22 stocks
- XLP/Consumer Staples, -4.0% average for 38 stocks
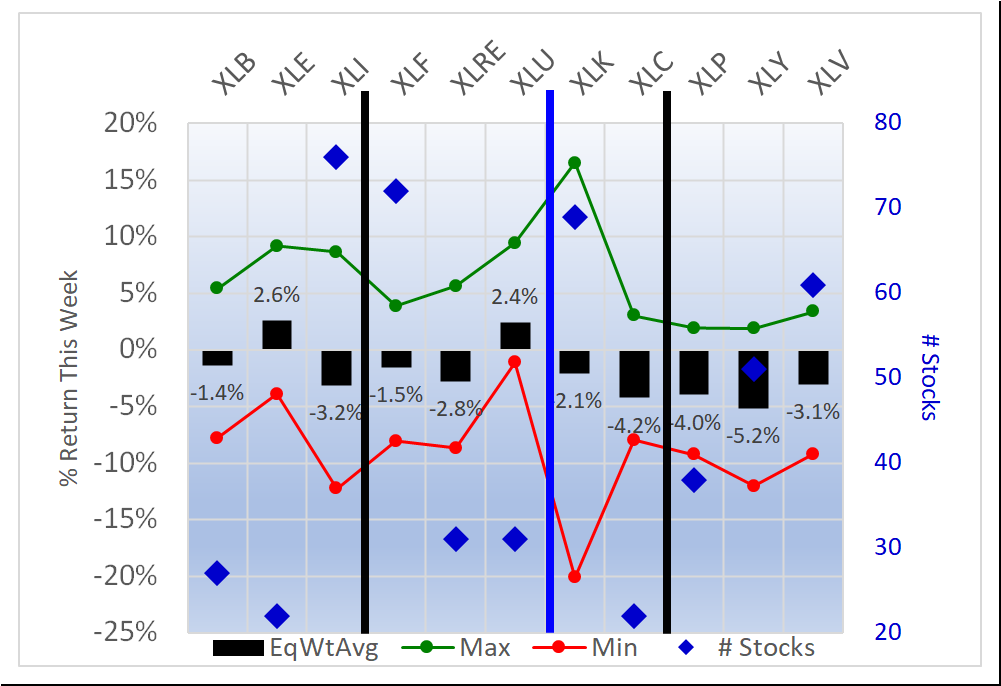
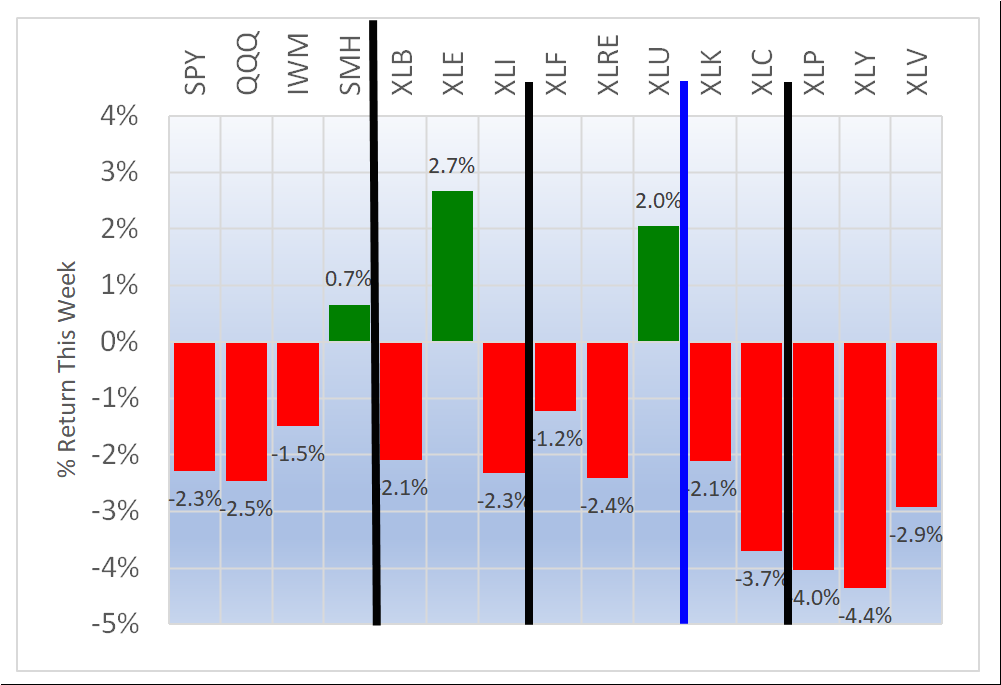
High and Low Returns
The following graphic overlays the lowest and highest returns in each sector.
III. Spectrum Graph Analysis
This methodology uses spectrum graphs to obtain key insights unavailable elsewhere.
There are currently four types of spectrum graphs in this ETF analysis:
- By Strengthening - this is the most important graph, and it clearly shows in order the ETFs/sectors based on their strengthening/weakening performance during the week:
- Strengthened rating (rating change is most important signal)
- Strengthened but not enough to change rating
- Unchanged
- Weakened but not enough to change rating, and
- Weakened rating (rating change is most important signal). - By Type - logically groups the ETFs (for example, interest rate-sensitive, technology-related, consumer-related) for direct comparison with similar ETFs.
- By Strongest to Weakest
- Alphabetically
The remainder of this section uses types 2, 3, and 4 above to show current performance.
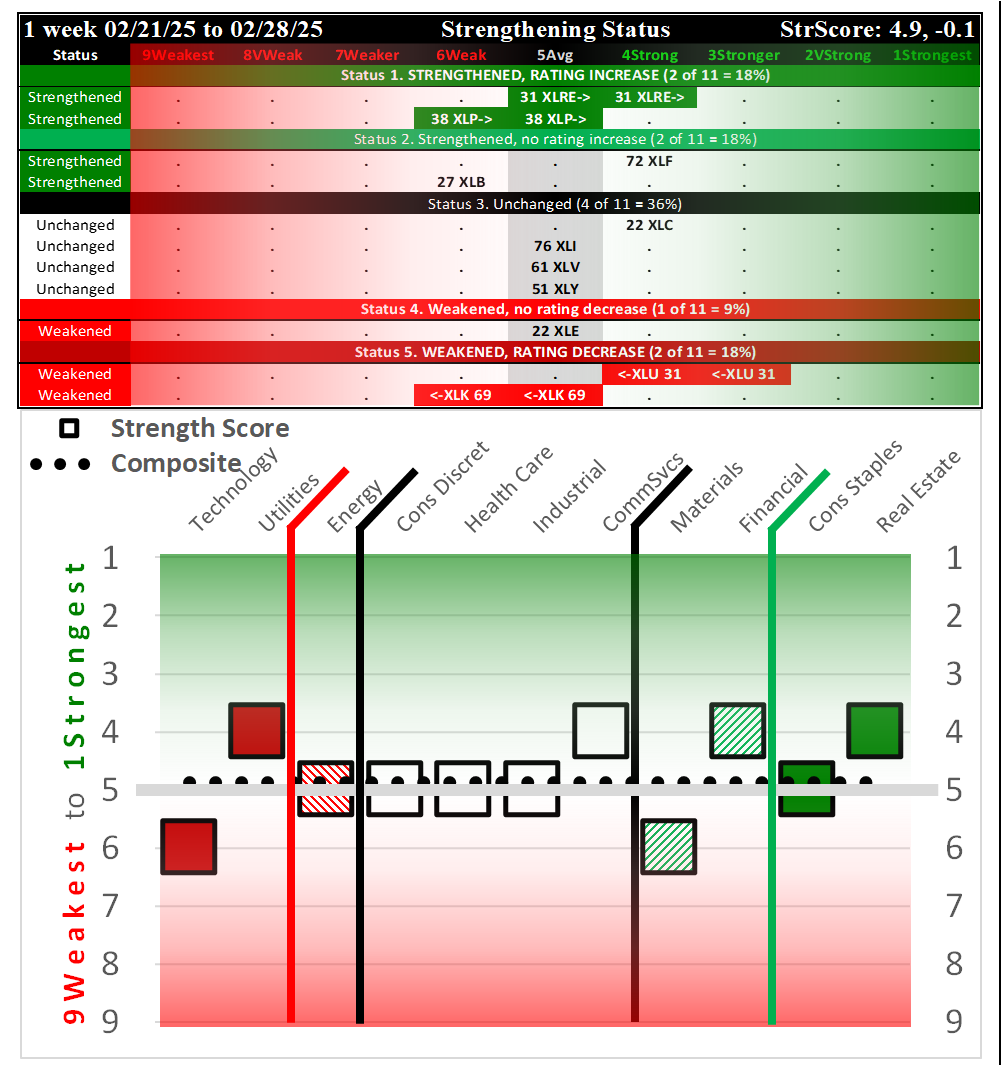
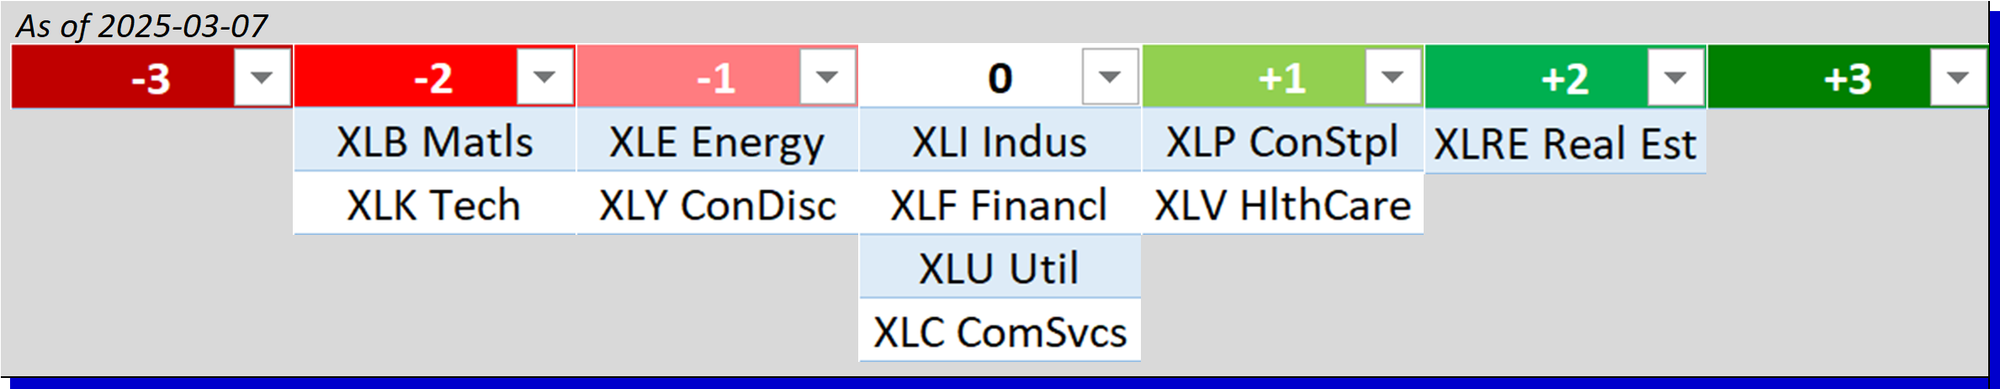
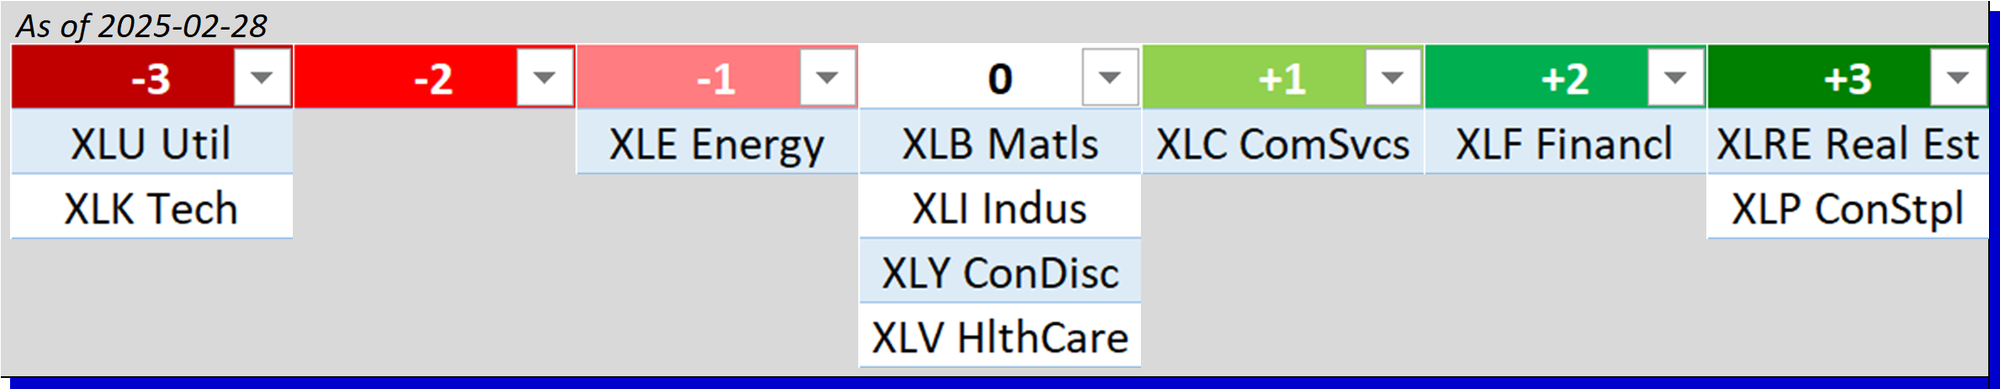
Context: Comparison to Recent Weeks
The following spectrum graphs by ETF Type show recent Friday week-to-week changes compared to the current week.
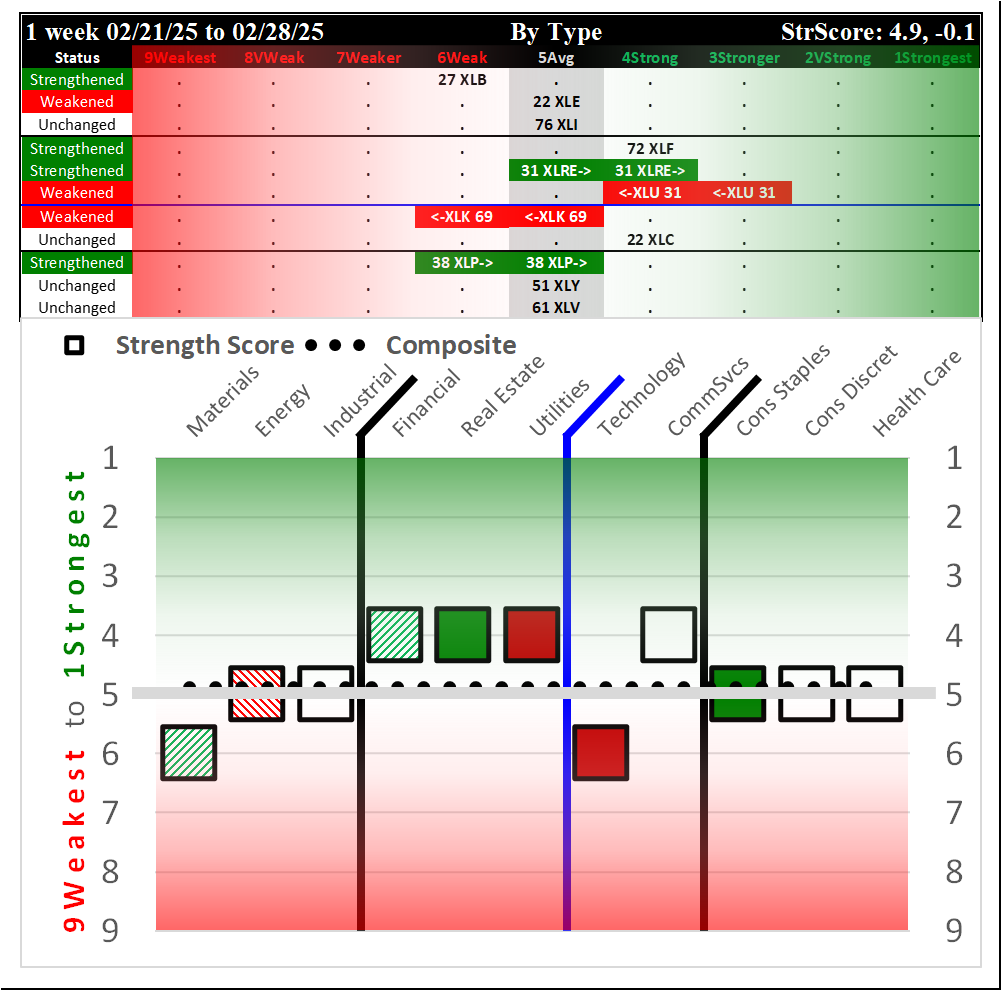
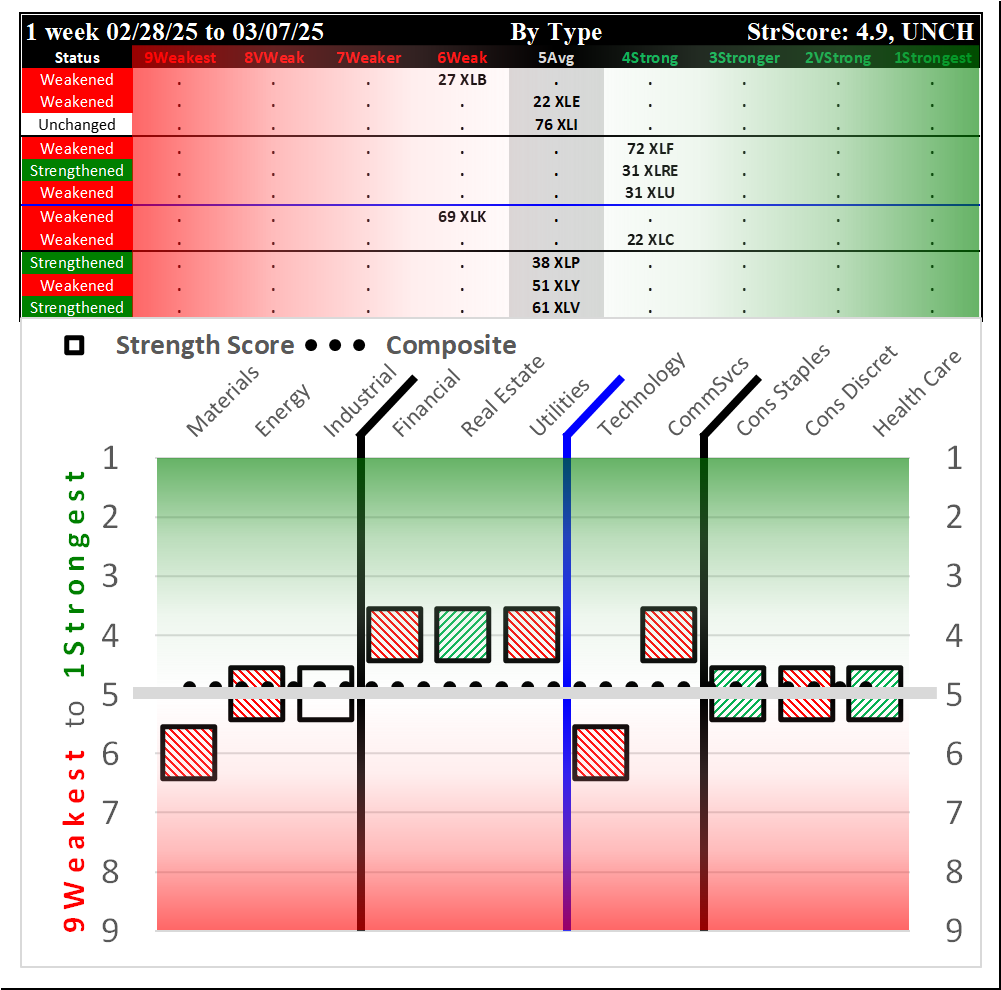
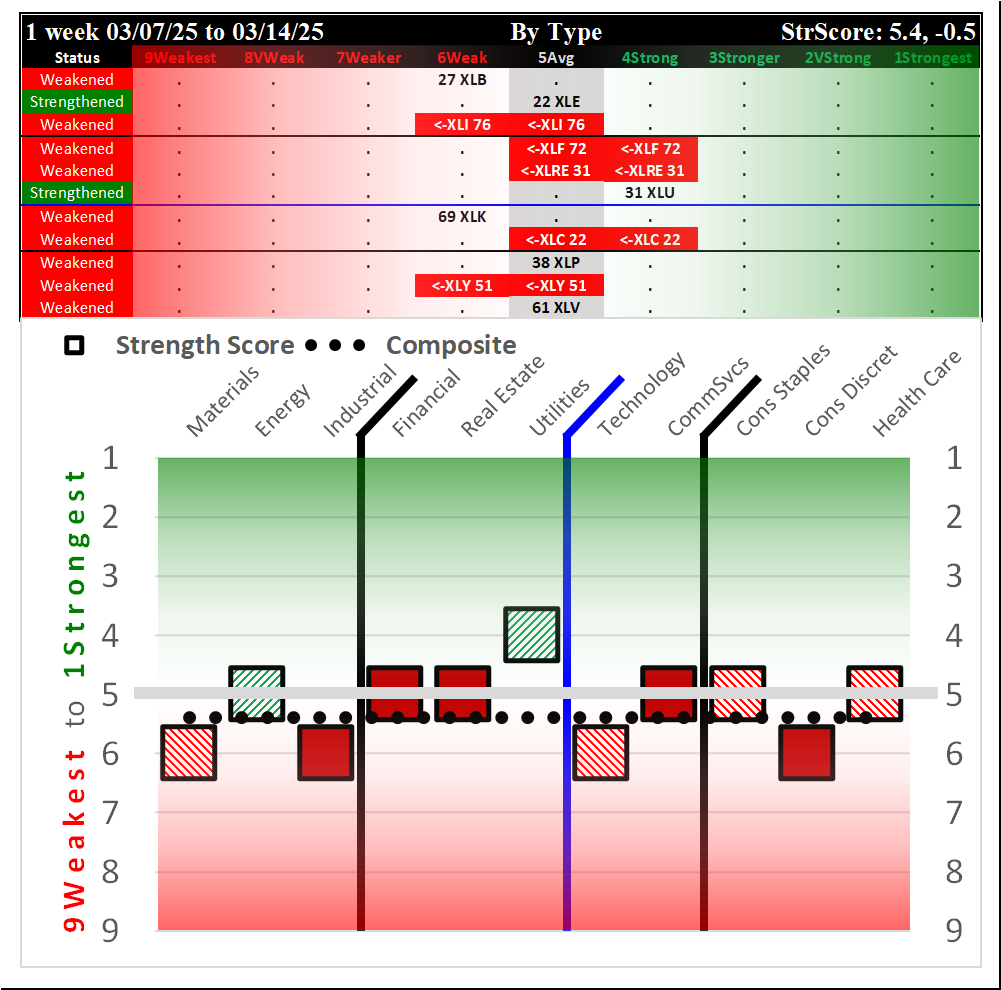
02/28/2025 = Weakened, 03/07/2025 = Unchanged, 03/14/2025 = Weakened.
Current Status: 5.4 Composite Score, Weakened -0.5 points this week
The following spectrum graph "Strongest to Weakest" shows the composition of the ETF ratings that comprise the current composite score, in order of Strength Rating. Below that is a "play" chart (somewhat like a football play diagram) which groups the sectors on a graphic for easy review of what sectors are at what strength ratings and what was their path to arriving at these ratings. This is followed by an Alphabetical spectrum graph.
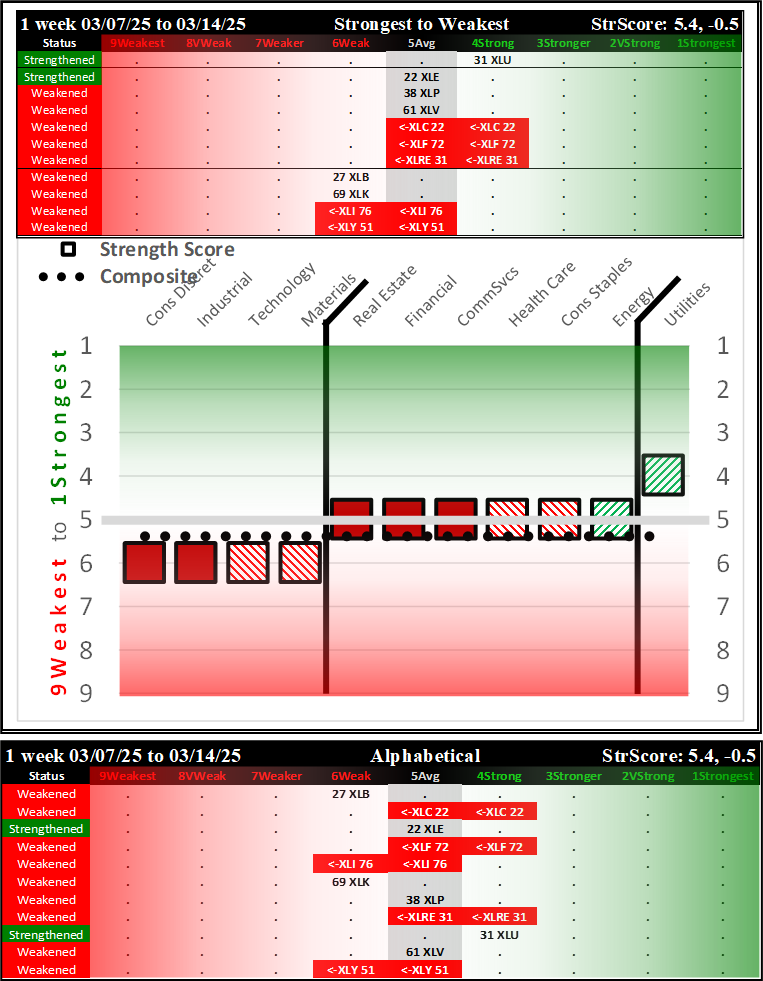
The ETFs are listed below based on their strength rating.
1Strongest
None
2VeryStrong
None
3Stronger
None
4Strong
- XLU/Utilities (Strengthened)
5Average
- XLE/Energy (Strengthened)
- XLP/Consumer Staples (Weakened)
- XLV/Health Care (Weakened)
- XLC/Communication (WEAKENED RATING)
- XLF/Financial (WEAKENED RATING)
- XLRE/Real Estate (WEAKENED RATING)
5.4 - Composite Score
6Weak
- XLB/Materials (Weakened)
- XLK/Technology (Weakened)
- XLI/Industrial (WEAKENED RATING)
- XLY/Consumer Discretionary (WEAKENED RATING)
7Weaker
None
8VeryWeak
None
9Weakest
None
IV. Today's Market Context
Indexes and ETFs Weekly Performance
Key Headlines
"Friday's bounce only pared big weekly market losses from tariffs. China, gold and insurance are leading."
"Strong Day But Bad Week For Stocks; Uber, Alibaba, GE Aerospace In Focus"
"Wall Street begins to cut S&P 500 targets as tariff worries rock the stock market. Should investors be concerned?"
"Gold has already topped $3,000. Here’s what it needs to keep climbing."
"In avoiding a shutdown, Congress just gave Trump more tariff power"
(Marketwatch)
"Dow pops more than 650 points in relief bounce Friday, but still posts worst week since 2023"
"After such a relentless market correction, the relief rally faces a high burden of proof"
"Goodbye to ‘bags fly free’ on Southwest, the last freebie in America"
"After Elon Musk’s Delaware exit, state lawmakers weigh bill to overhaul corporate law"
"Trump administration weighs travel ban on dozens of countries"
(CNBC)
"The backbone of the US economy flashes stagflation warnings as uncertainty spikes on tariffs and layoffs — ‘storm clouds are forming’"
"Consumer Sentiment Sours as Year-Ahead Inflation Outlook Hits Highest Since November 2022"
"Average US rate on a 30-year mortgage edges higher, ending a seven-week slide"
"The Week the Smart Money Got Whipsawed by the Market"
"Trump’s Trade Salvos Test Nerves of Central Bankers"
(Yahoo!)
Key Current Readings
SP500: 5,638.94
Nasdaq: 17,754.09
Nasdaq 100: 19,704.64
Russell 2000: 2,044.1
10Y Treasury: 4.32%
2YT: 4.023%
Oil (WTI Crude): $67.19
Bitcoin:$84,332
Dollar Index: 103.74
Gold: $2,993.6
VIX: 21.77
(CNBC)
V. Detailed Sector ETF Analysis
The following Stock Market Organizer strengthening/weakening analysis looks at the 11 SPDR ETFs and their underlying component stocks for the just-completed week, as follows:
- ETFs Summaries
1.1 Current: Component Stocks Strength Ratings (1Strongest vs. 9Weakest vs. Ignore Status)
1.2 Current: Component Stocks Positive vs. Negative Weekly Returns
1.3 Historical: 10 Week Ratings by ETF
1.4 Historical: 10 Week Ratings by Week - ETFs Detail
2.1 XLB Materials
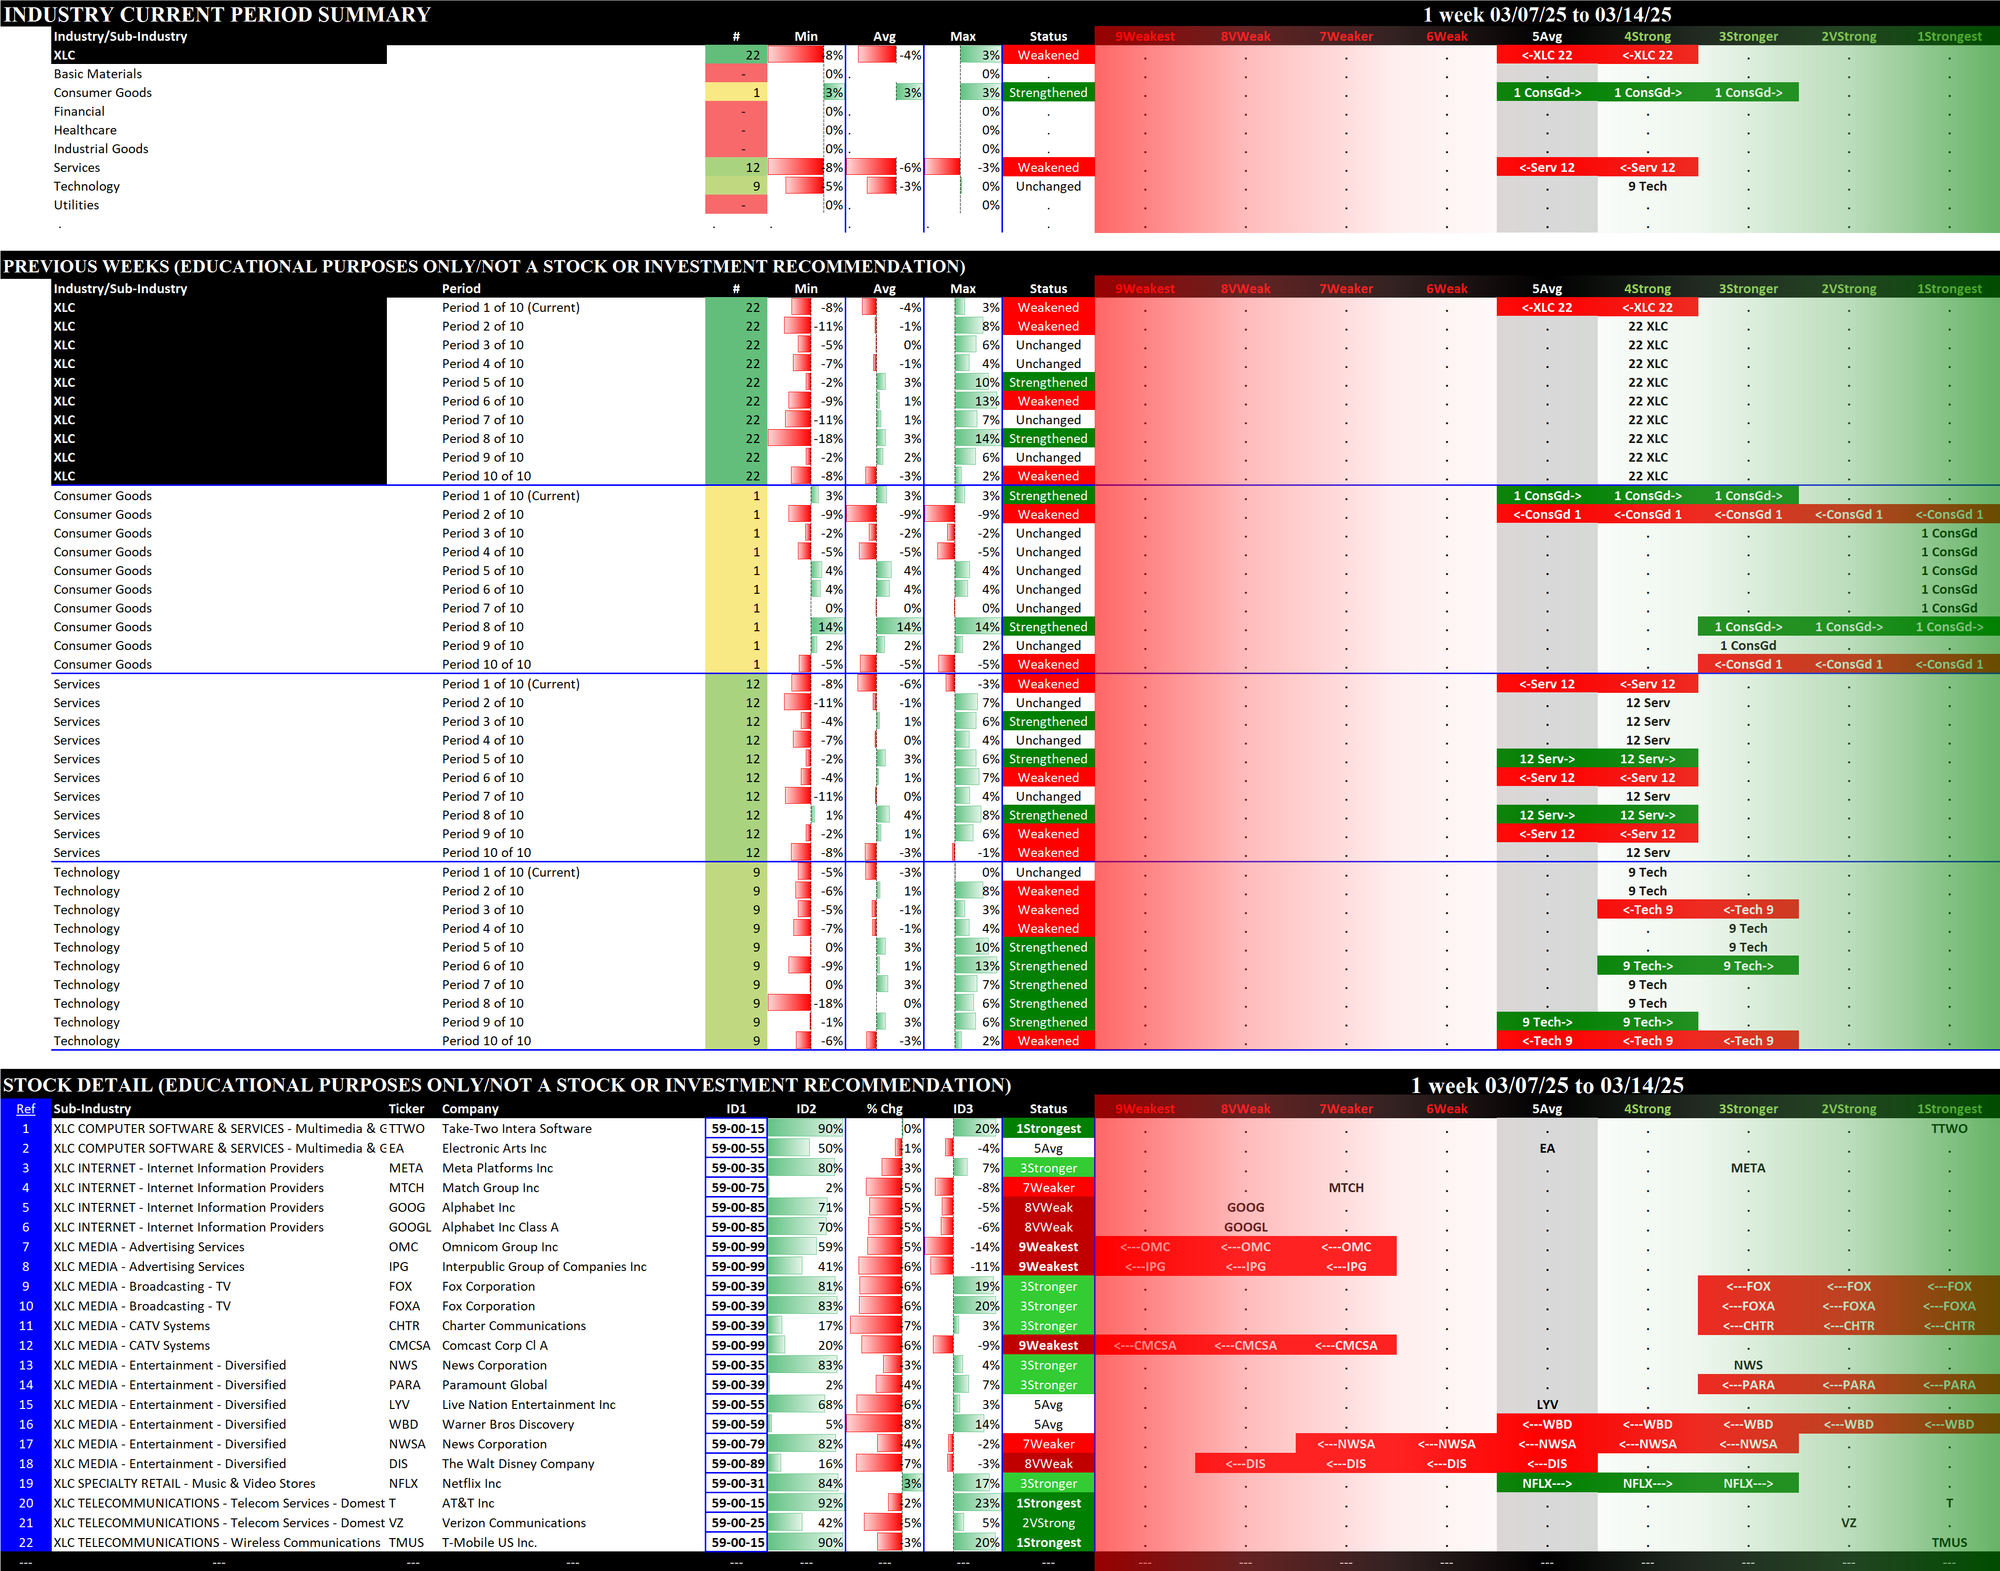
2.2 XLC Communications
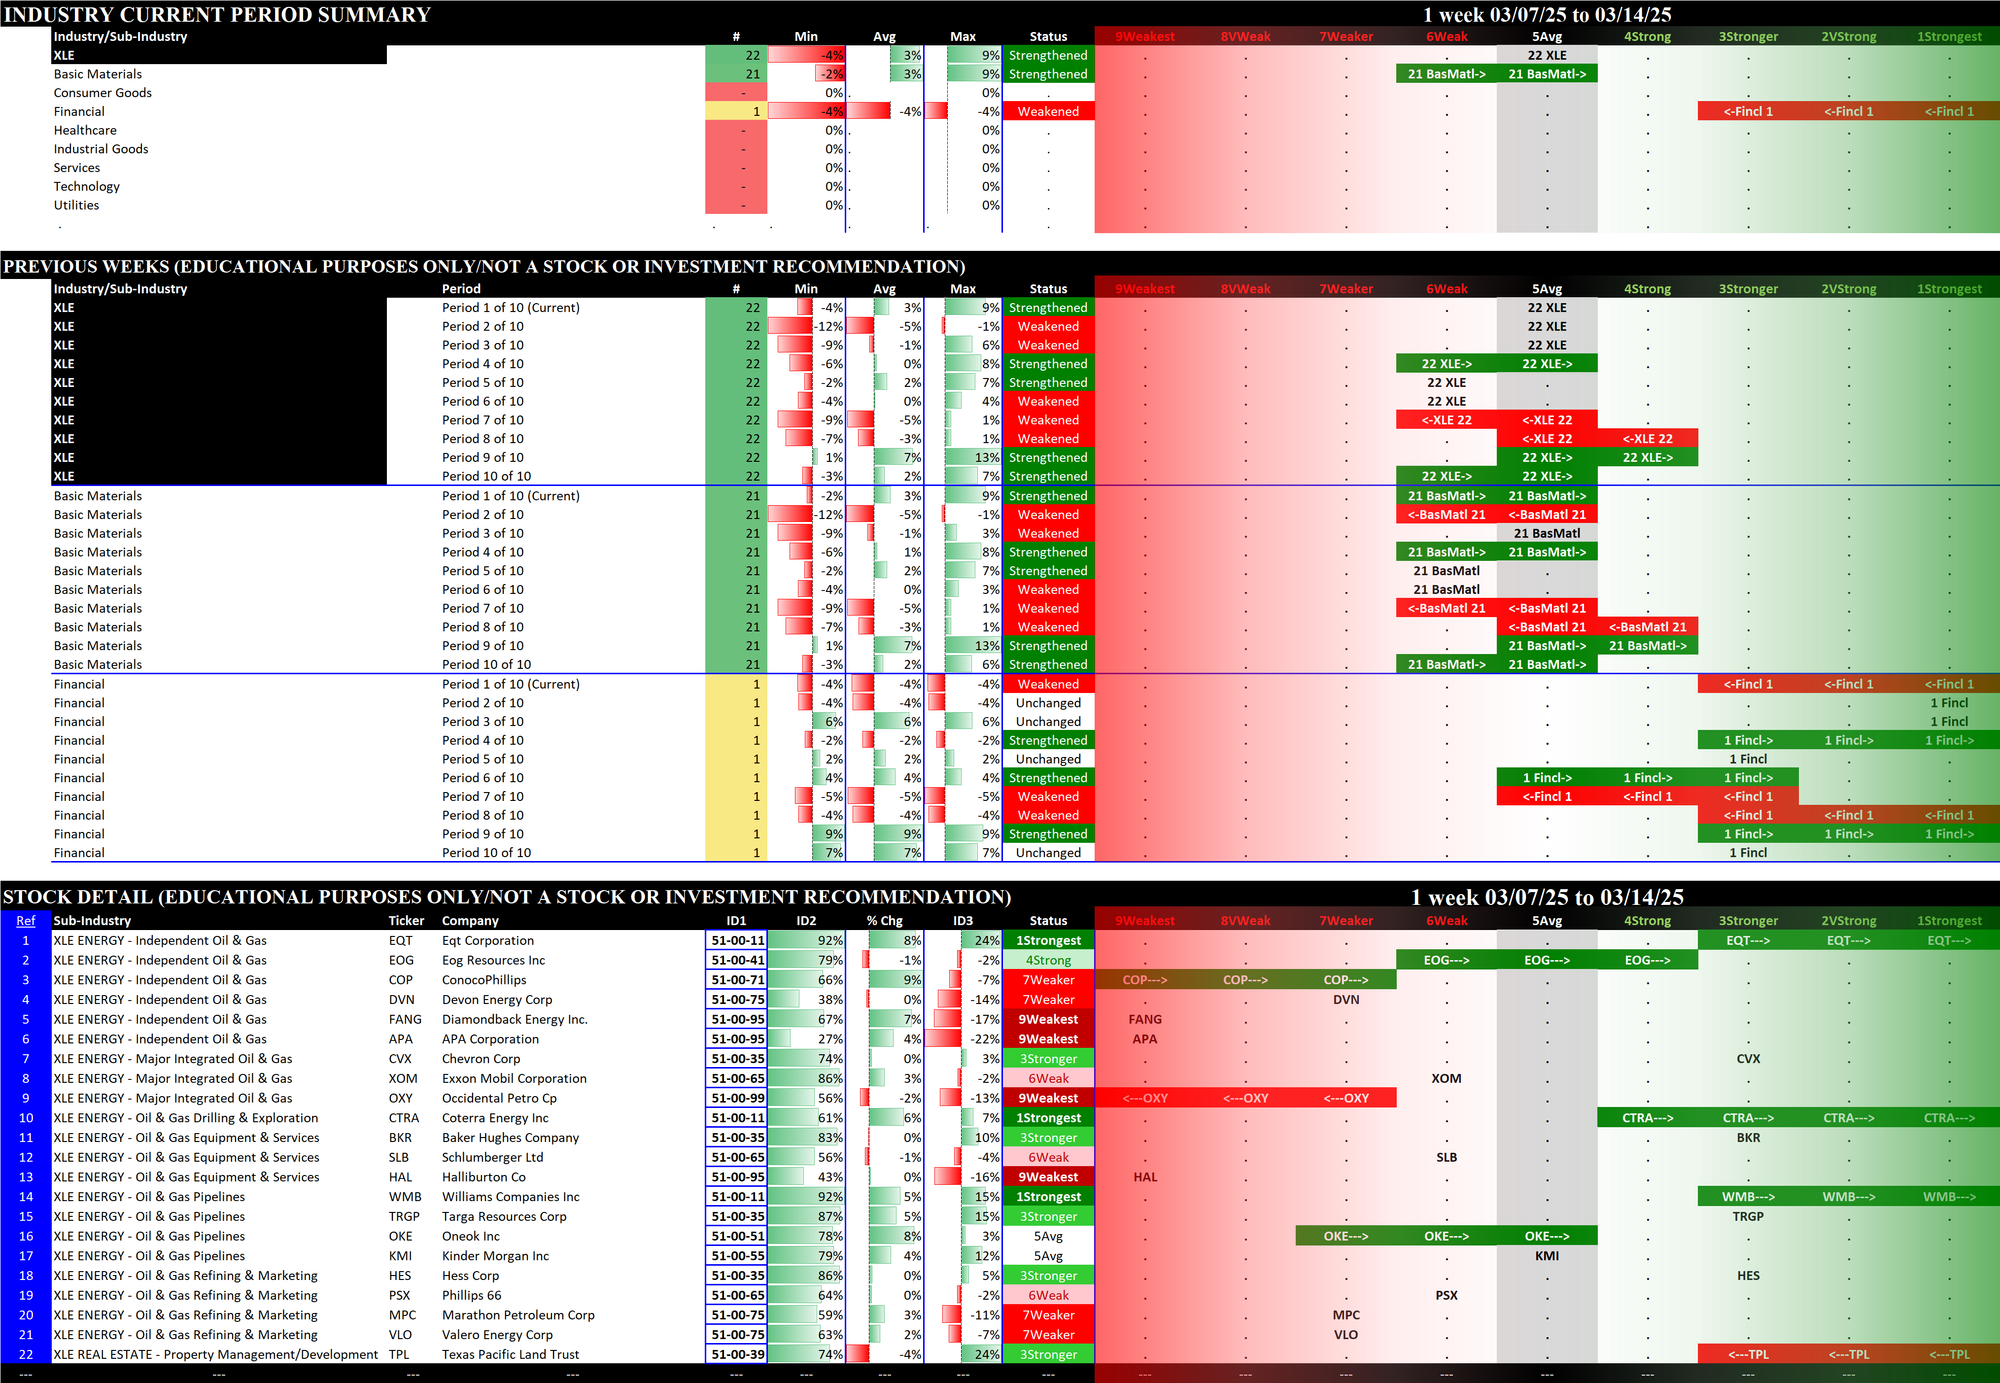
2.3 XLE Energy
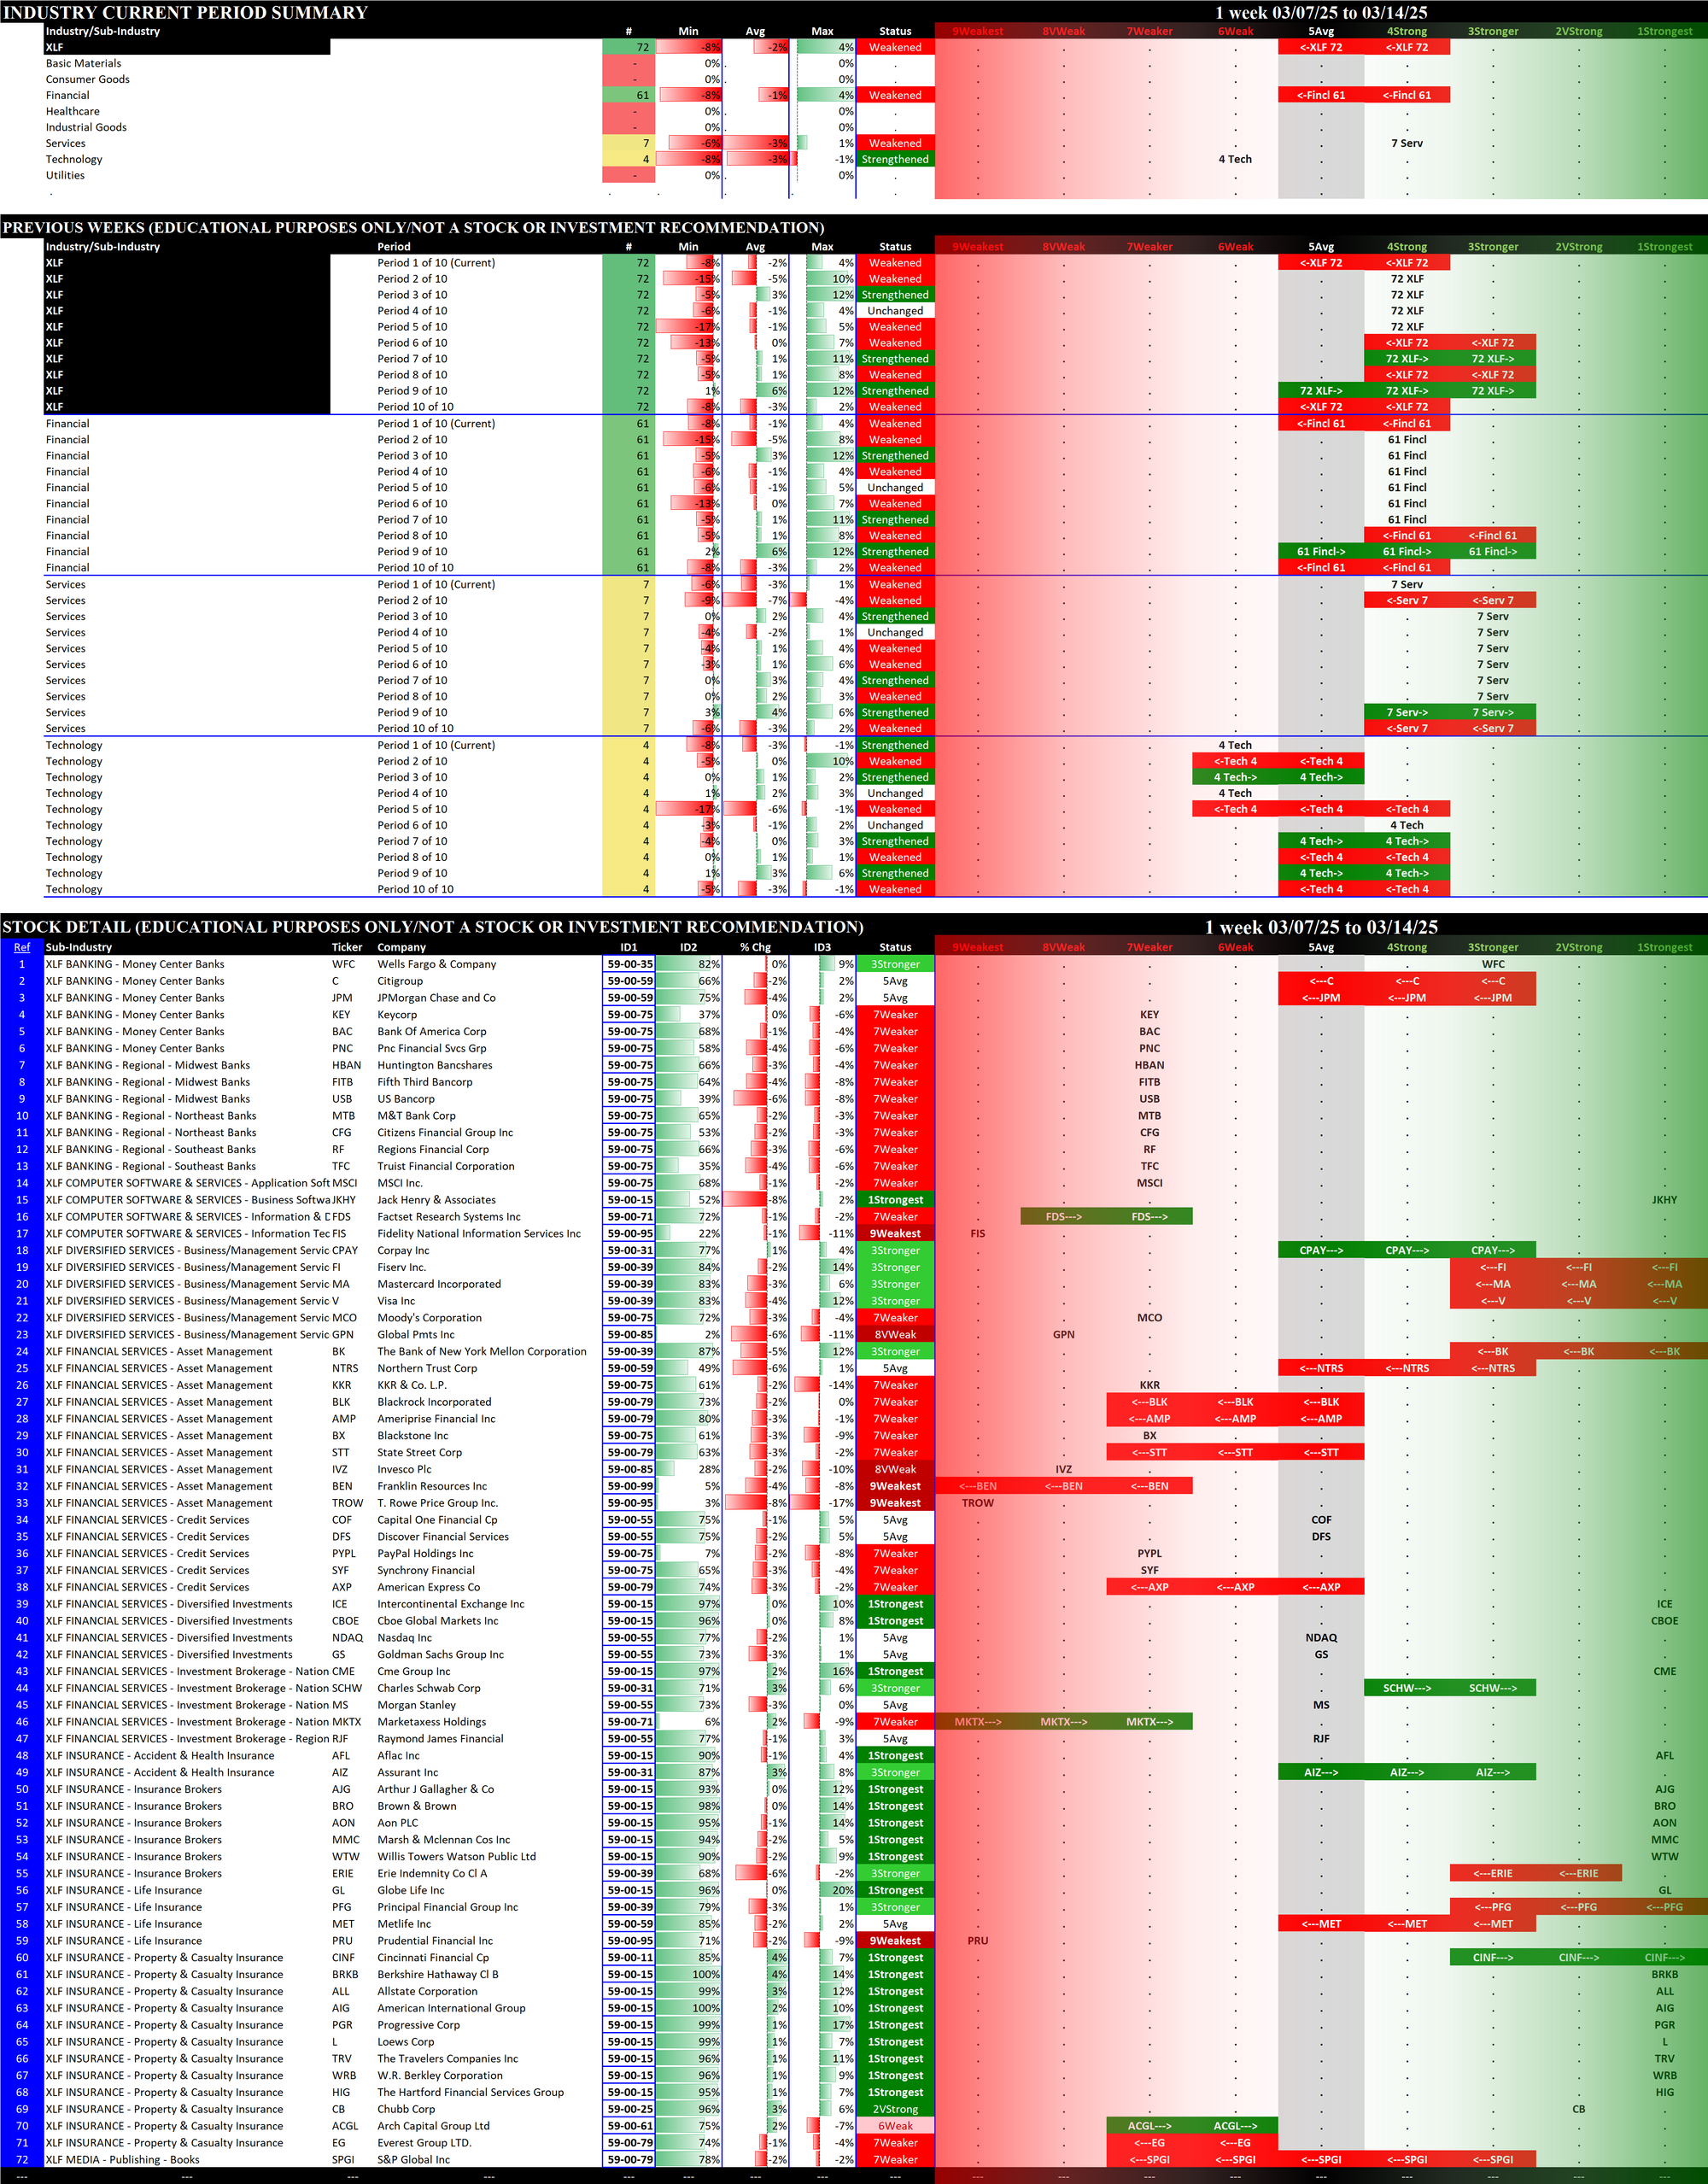
2.4 XLF Financial
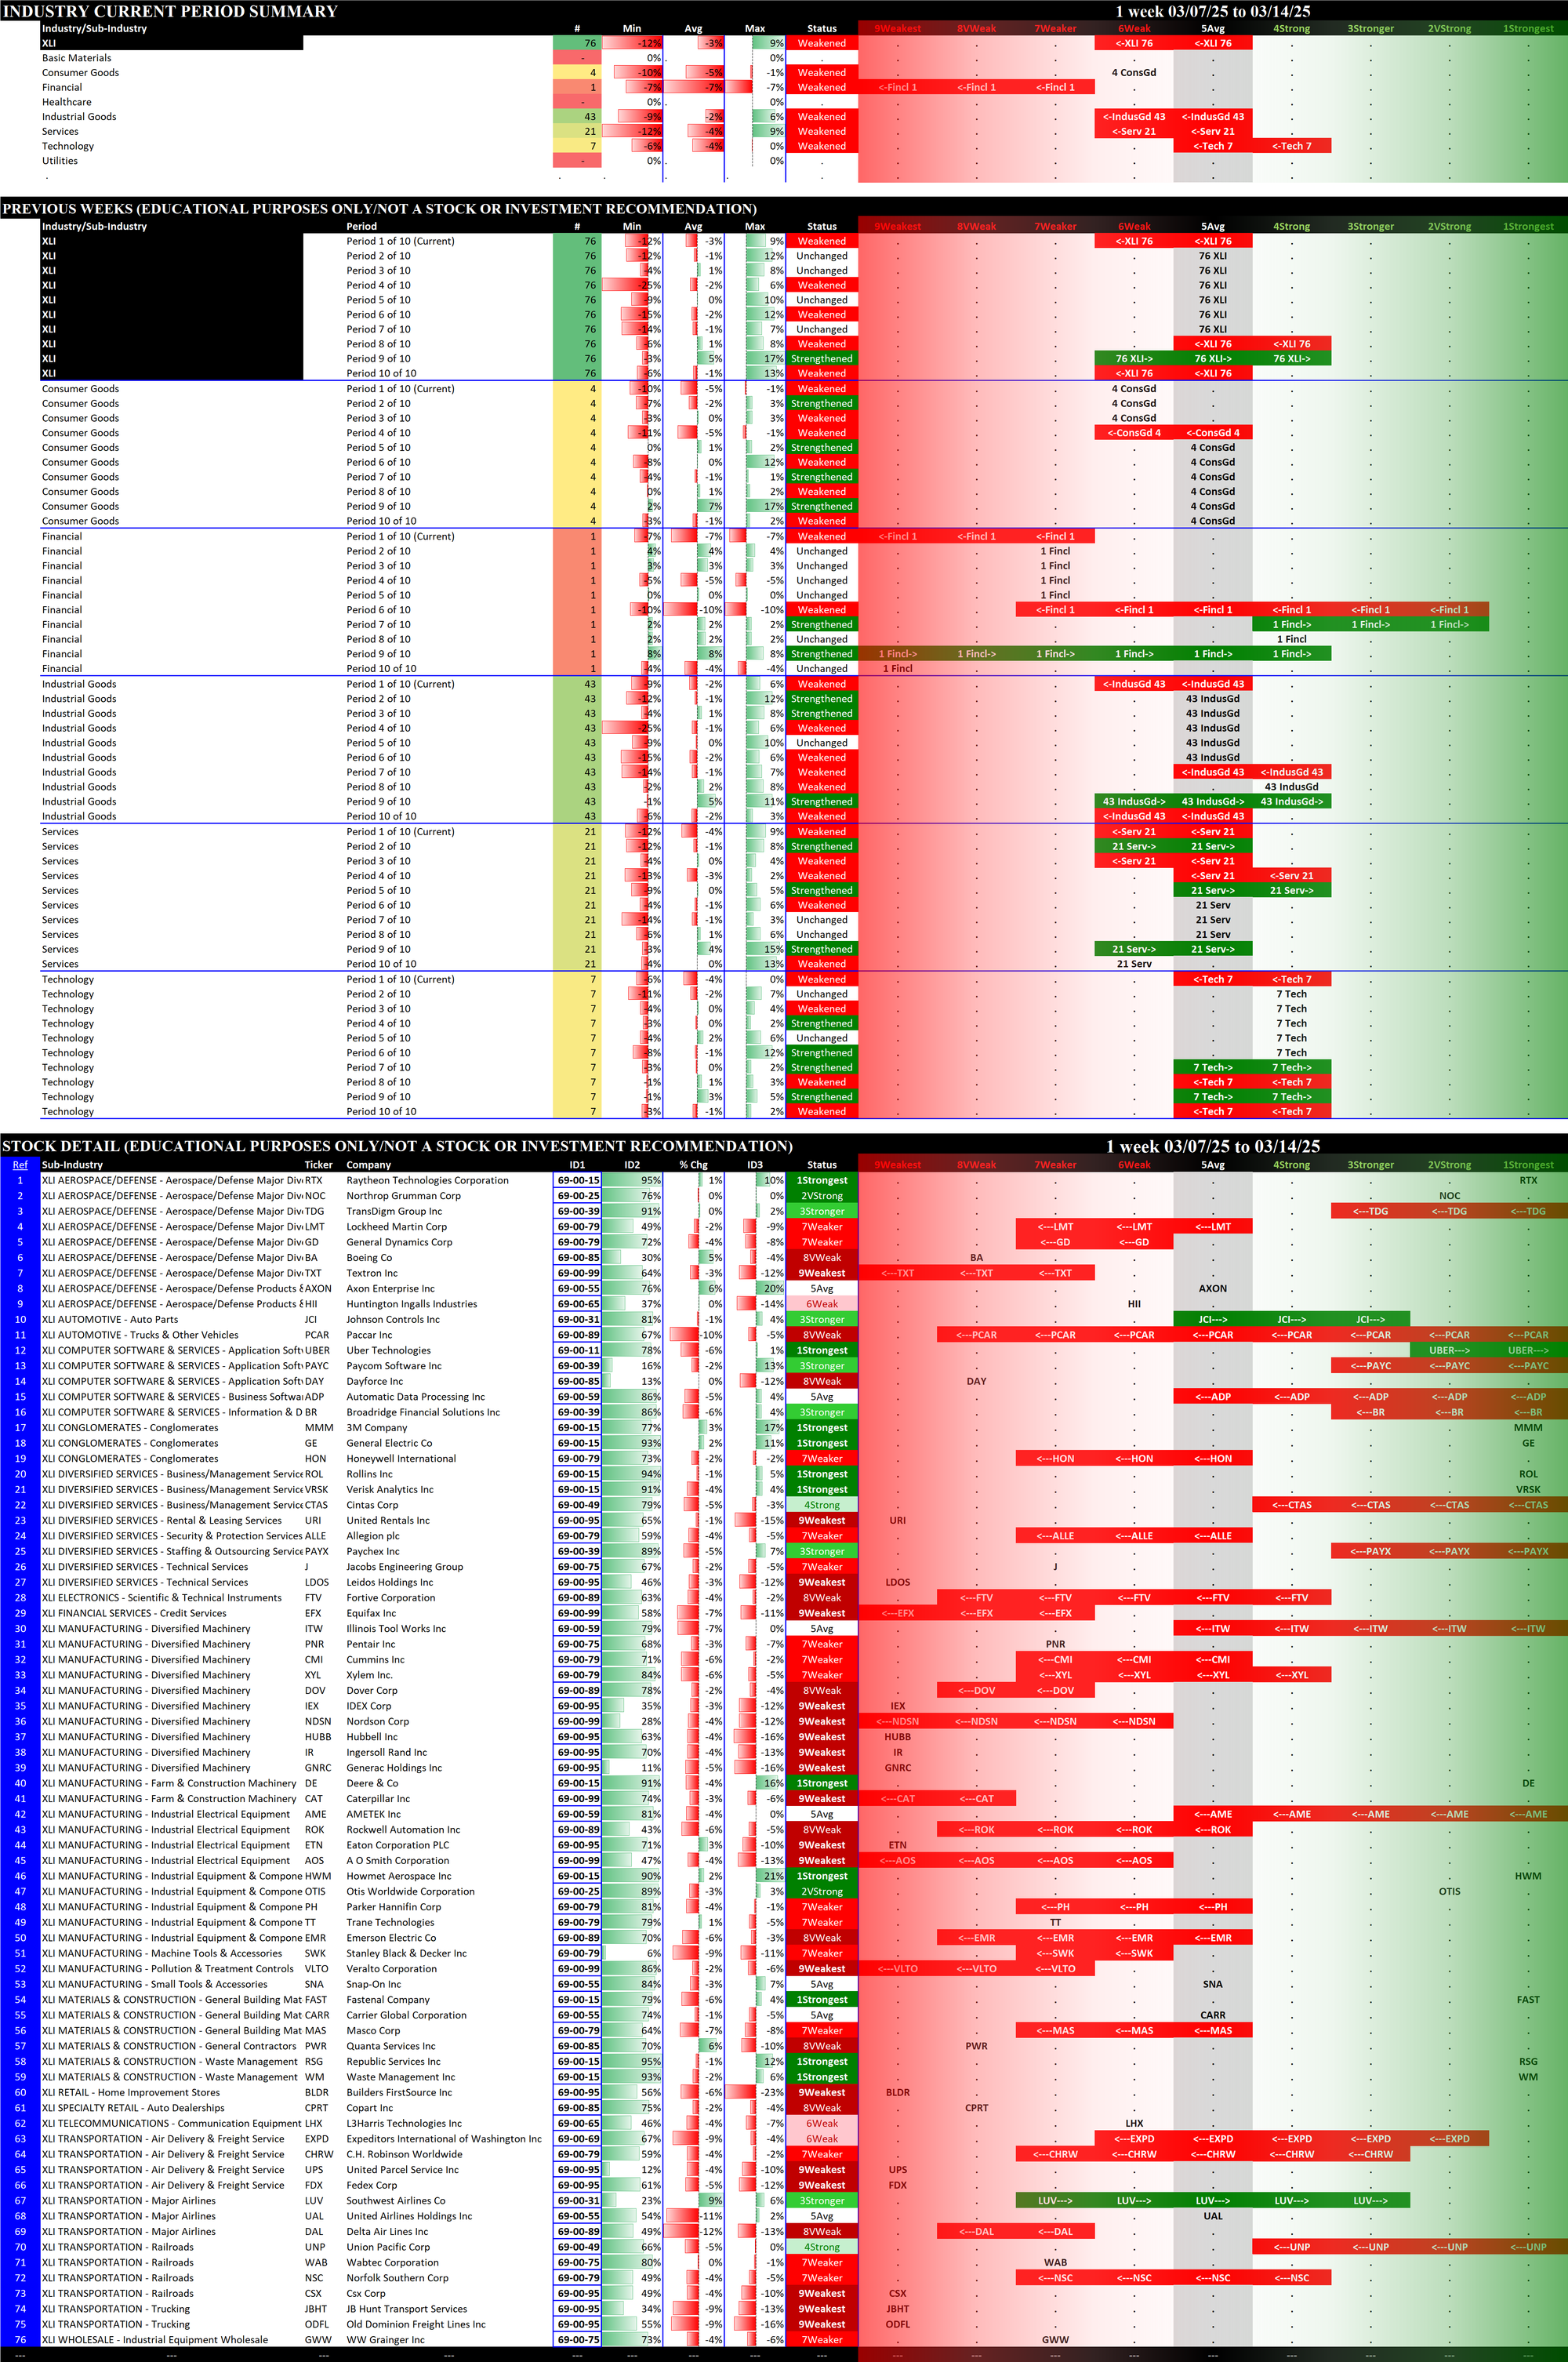
2.5 XLI Industrial
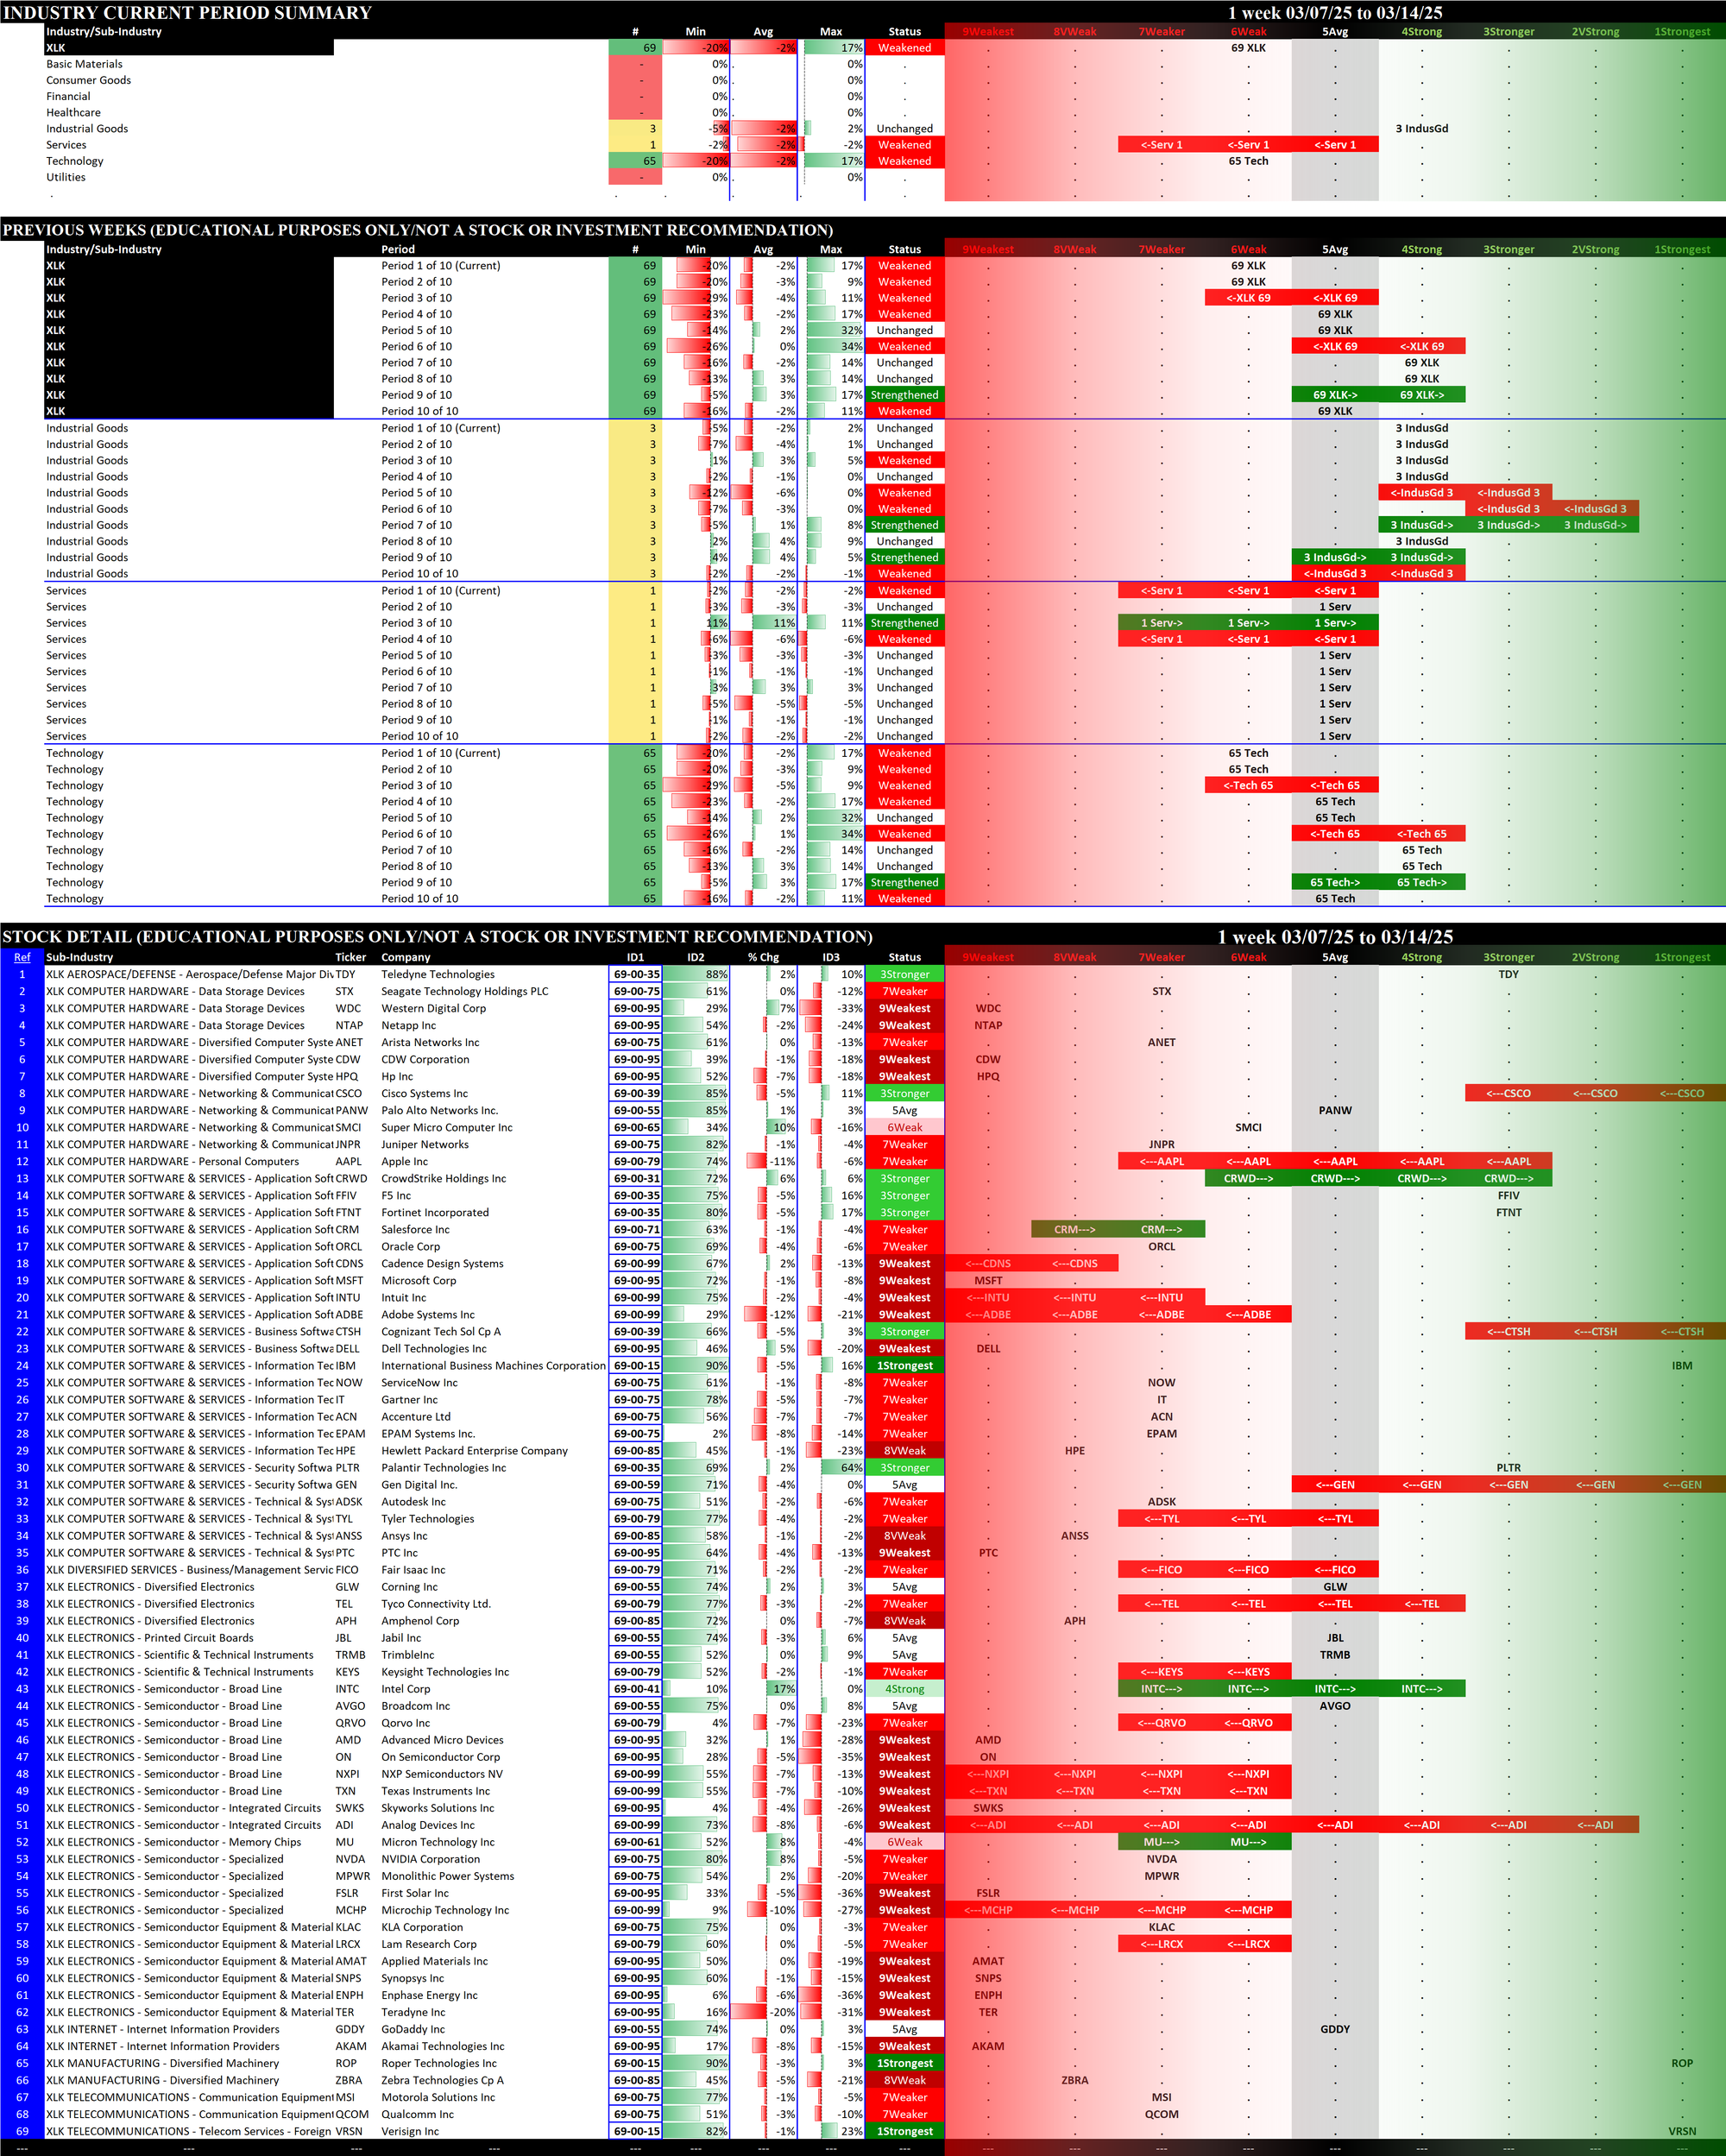
2.6 XLK Technology
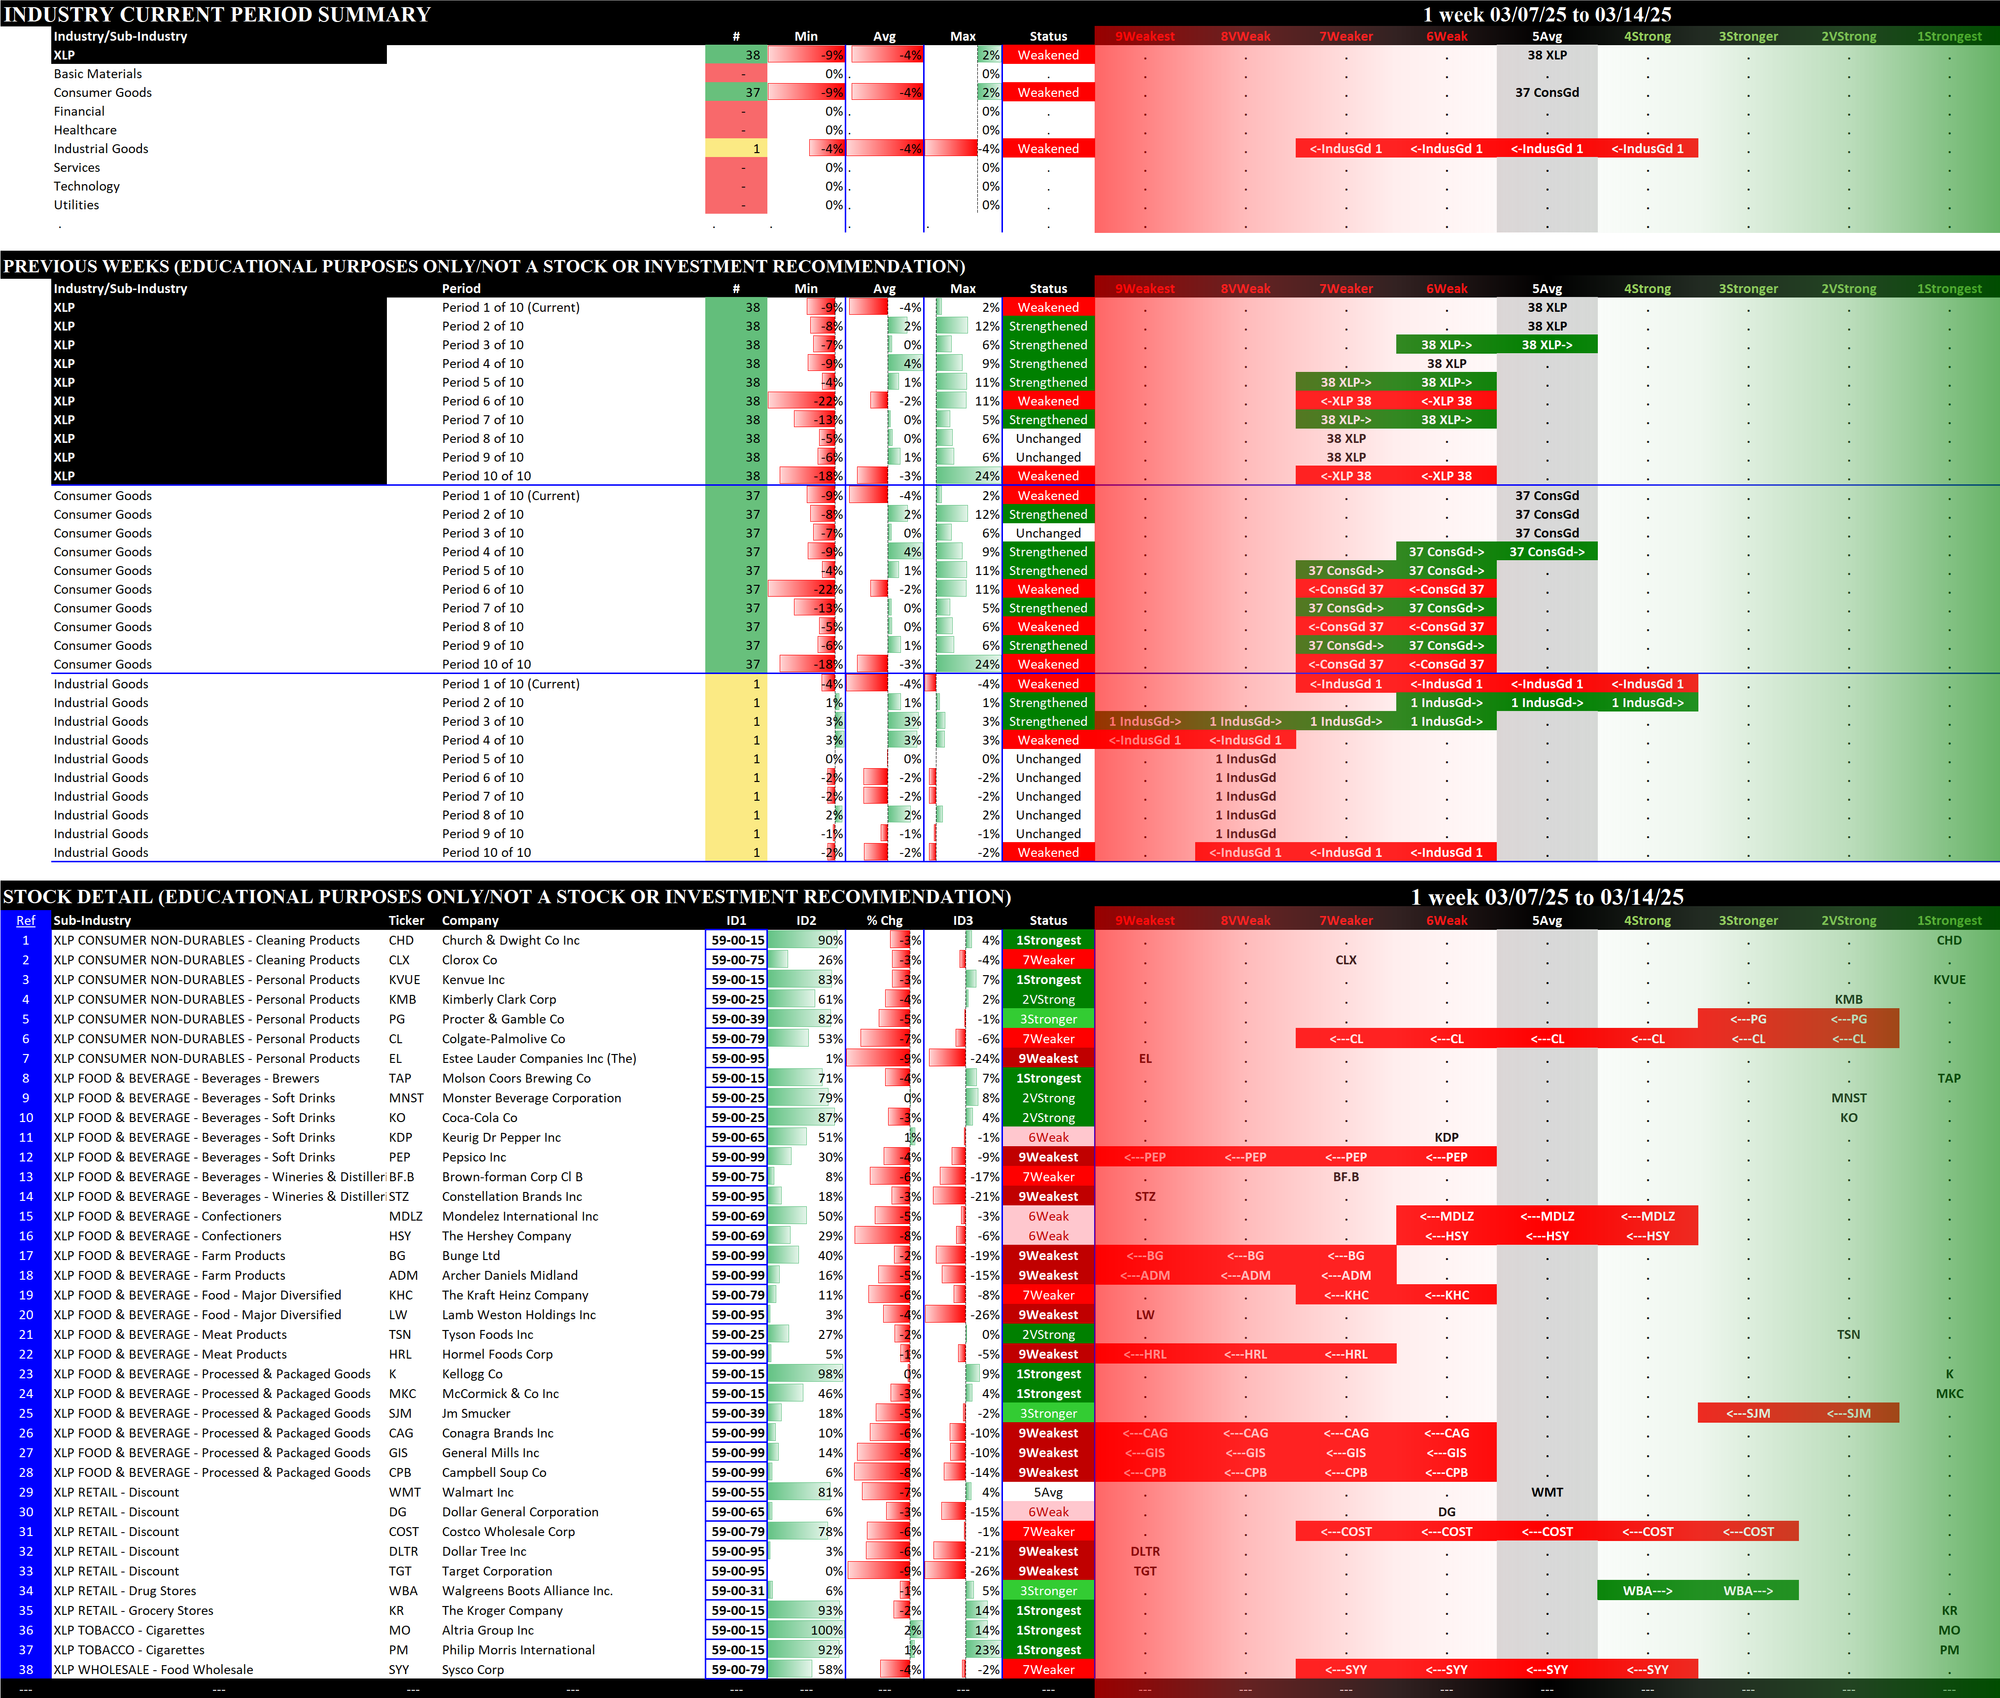
2.7 XLP Consumer Staples
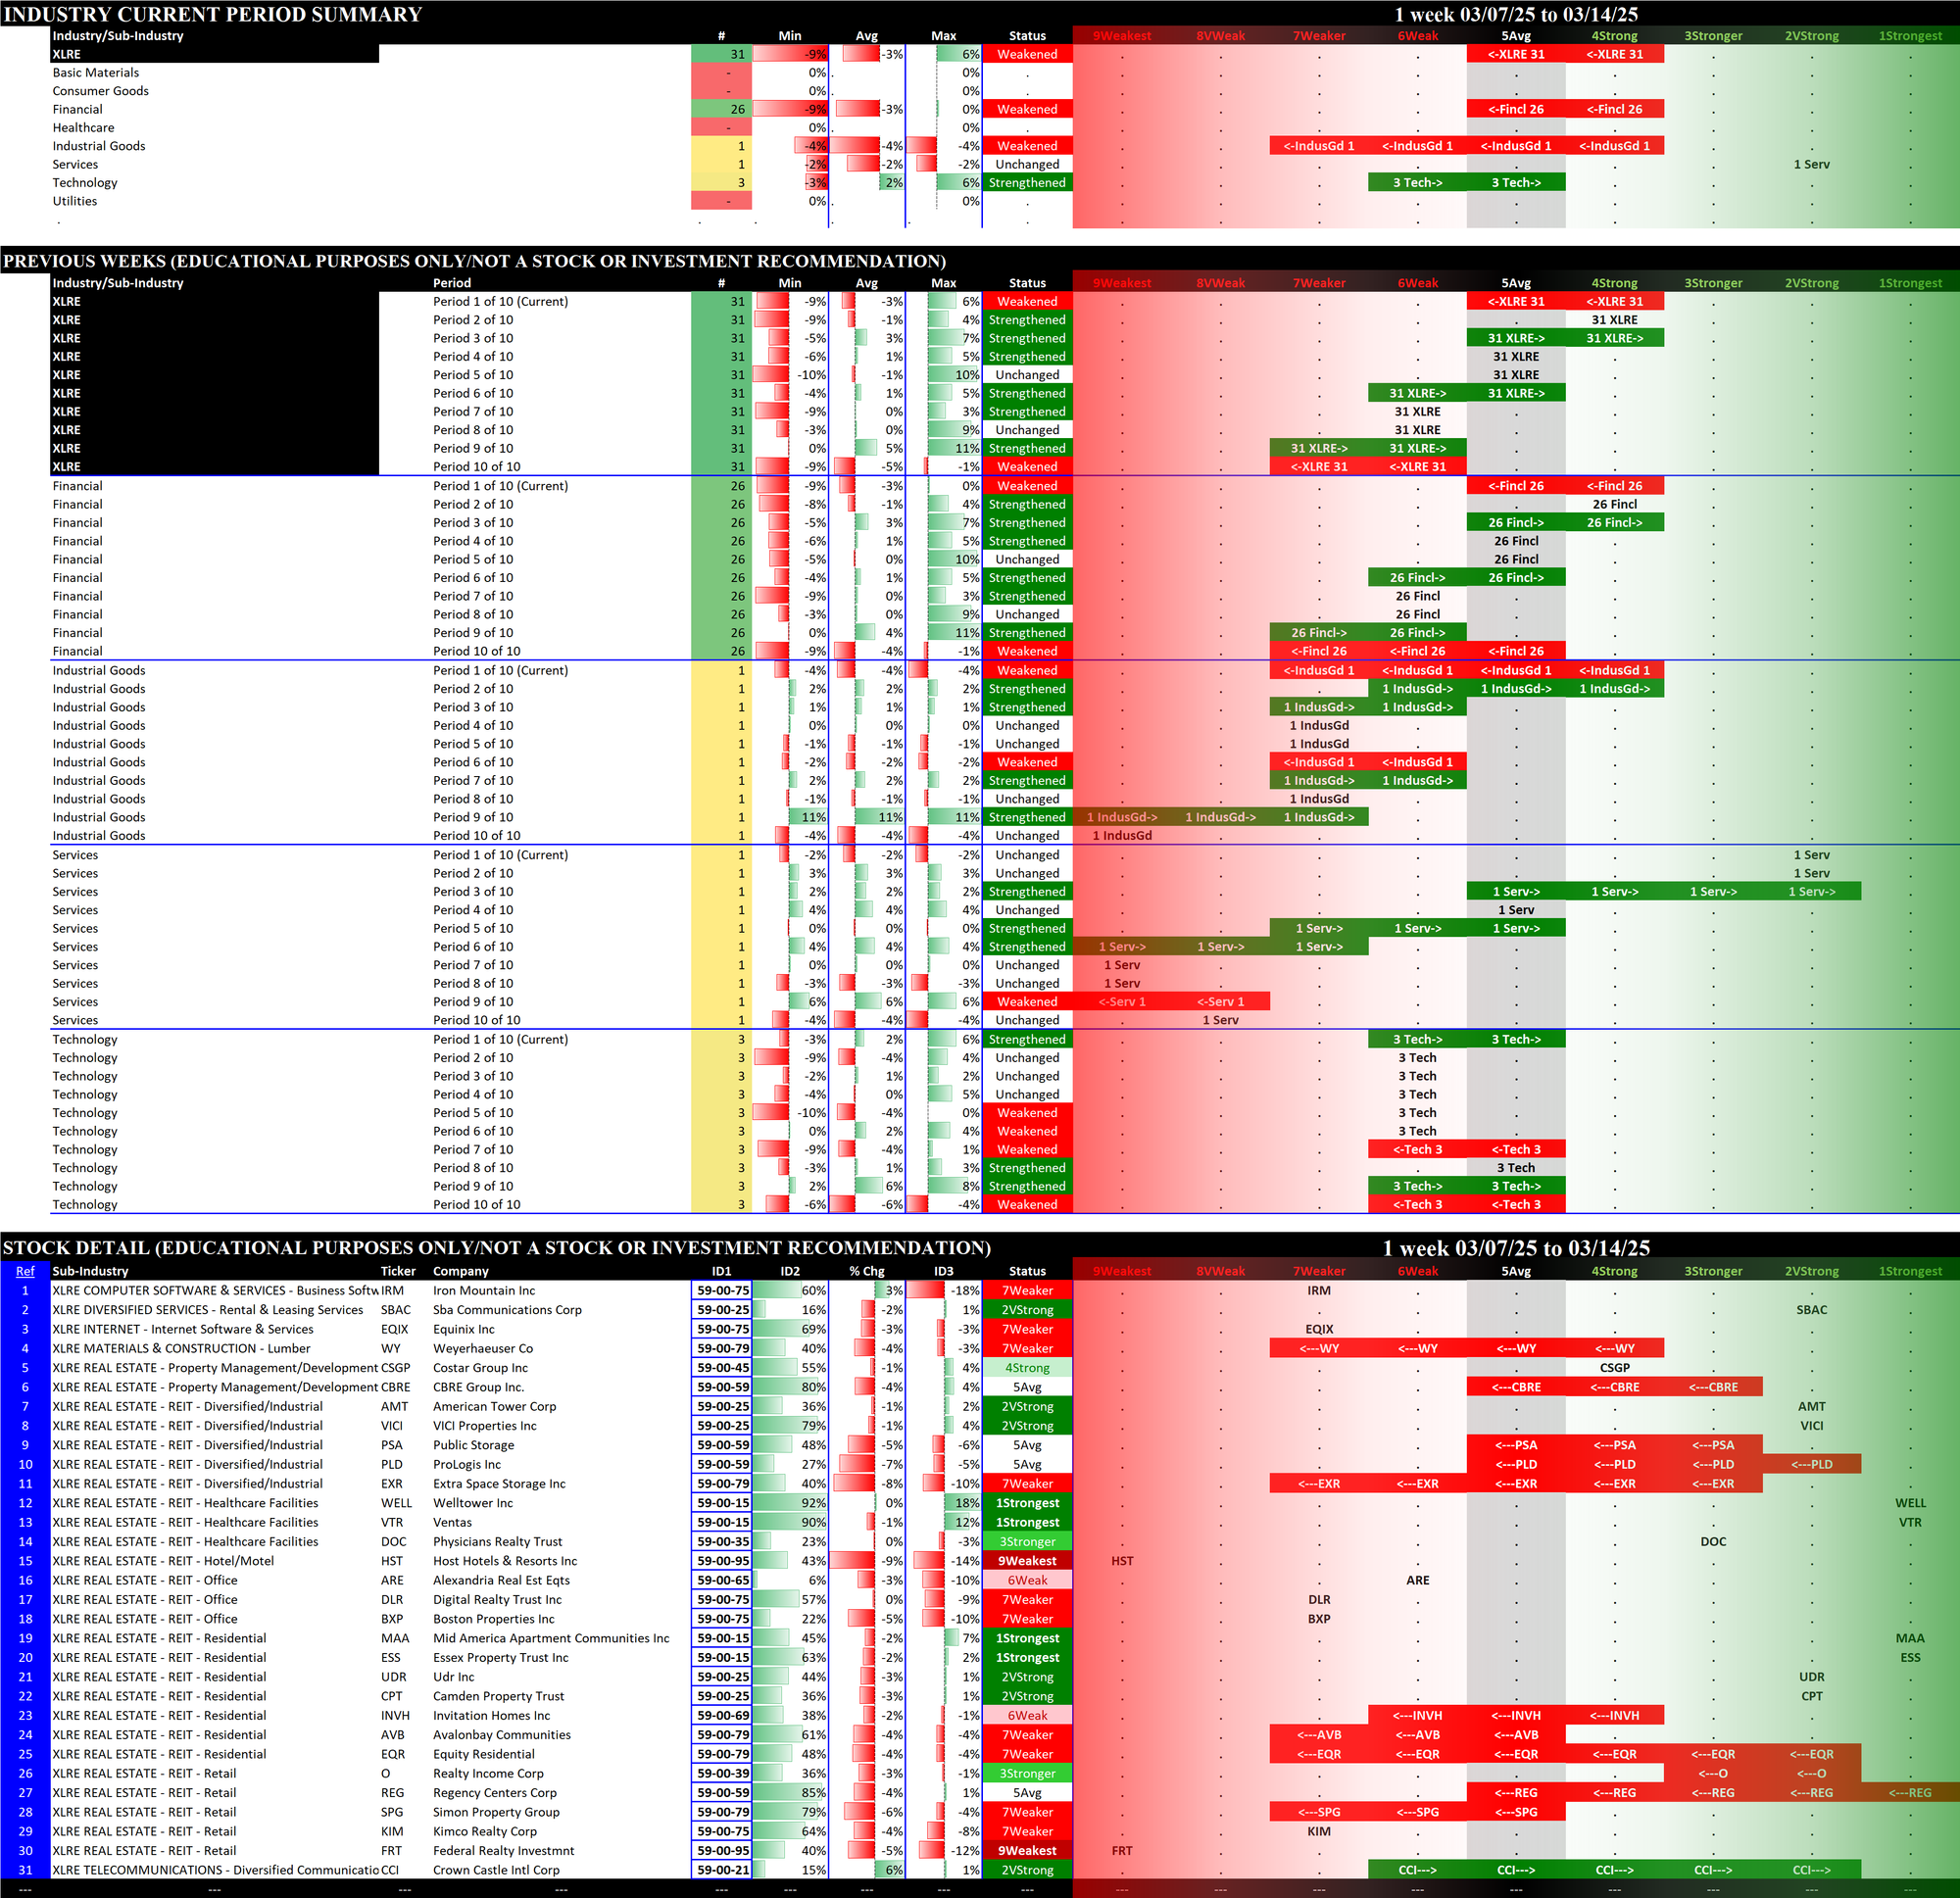
2.8 XLRE Real Estate
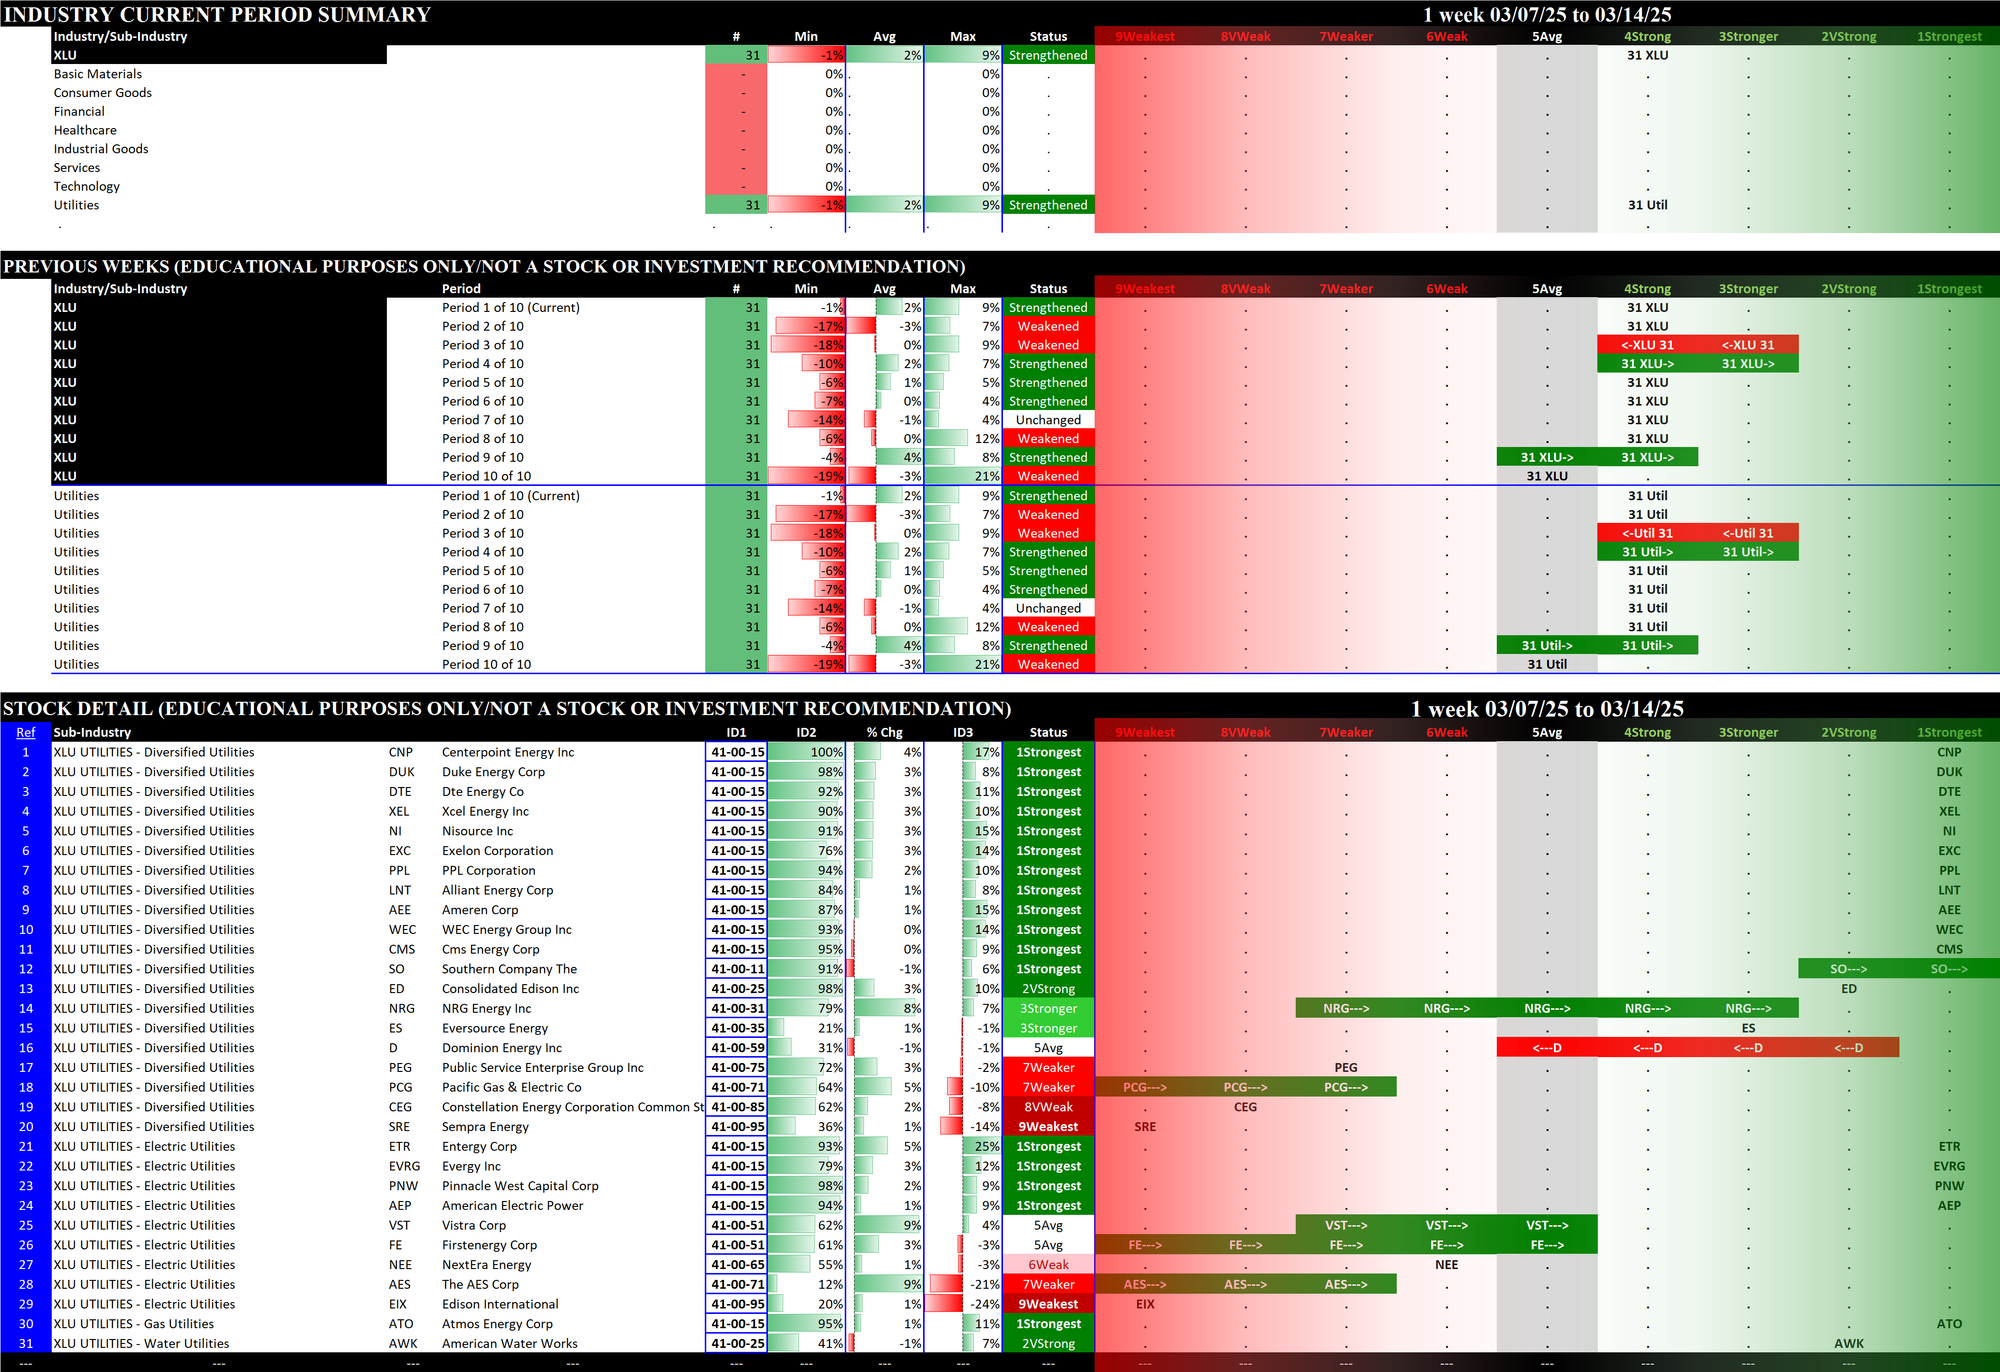
2.9 XLU Utilities
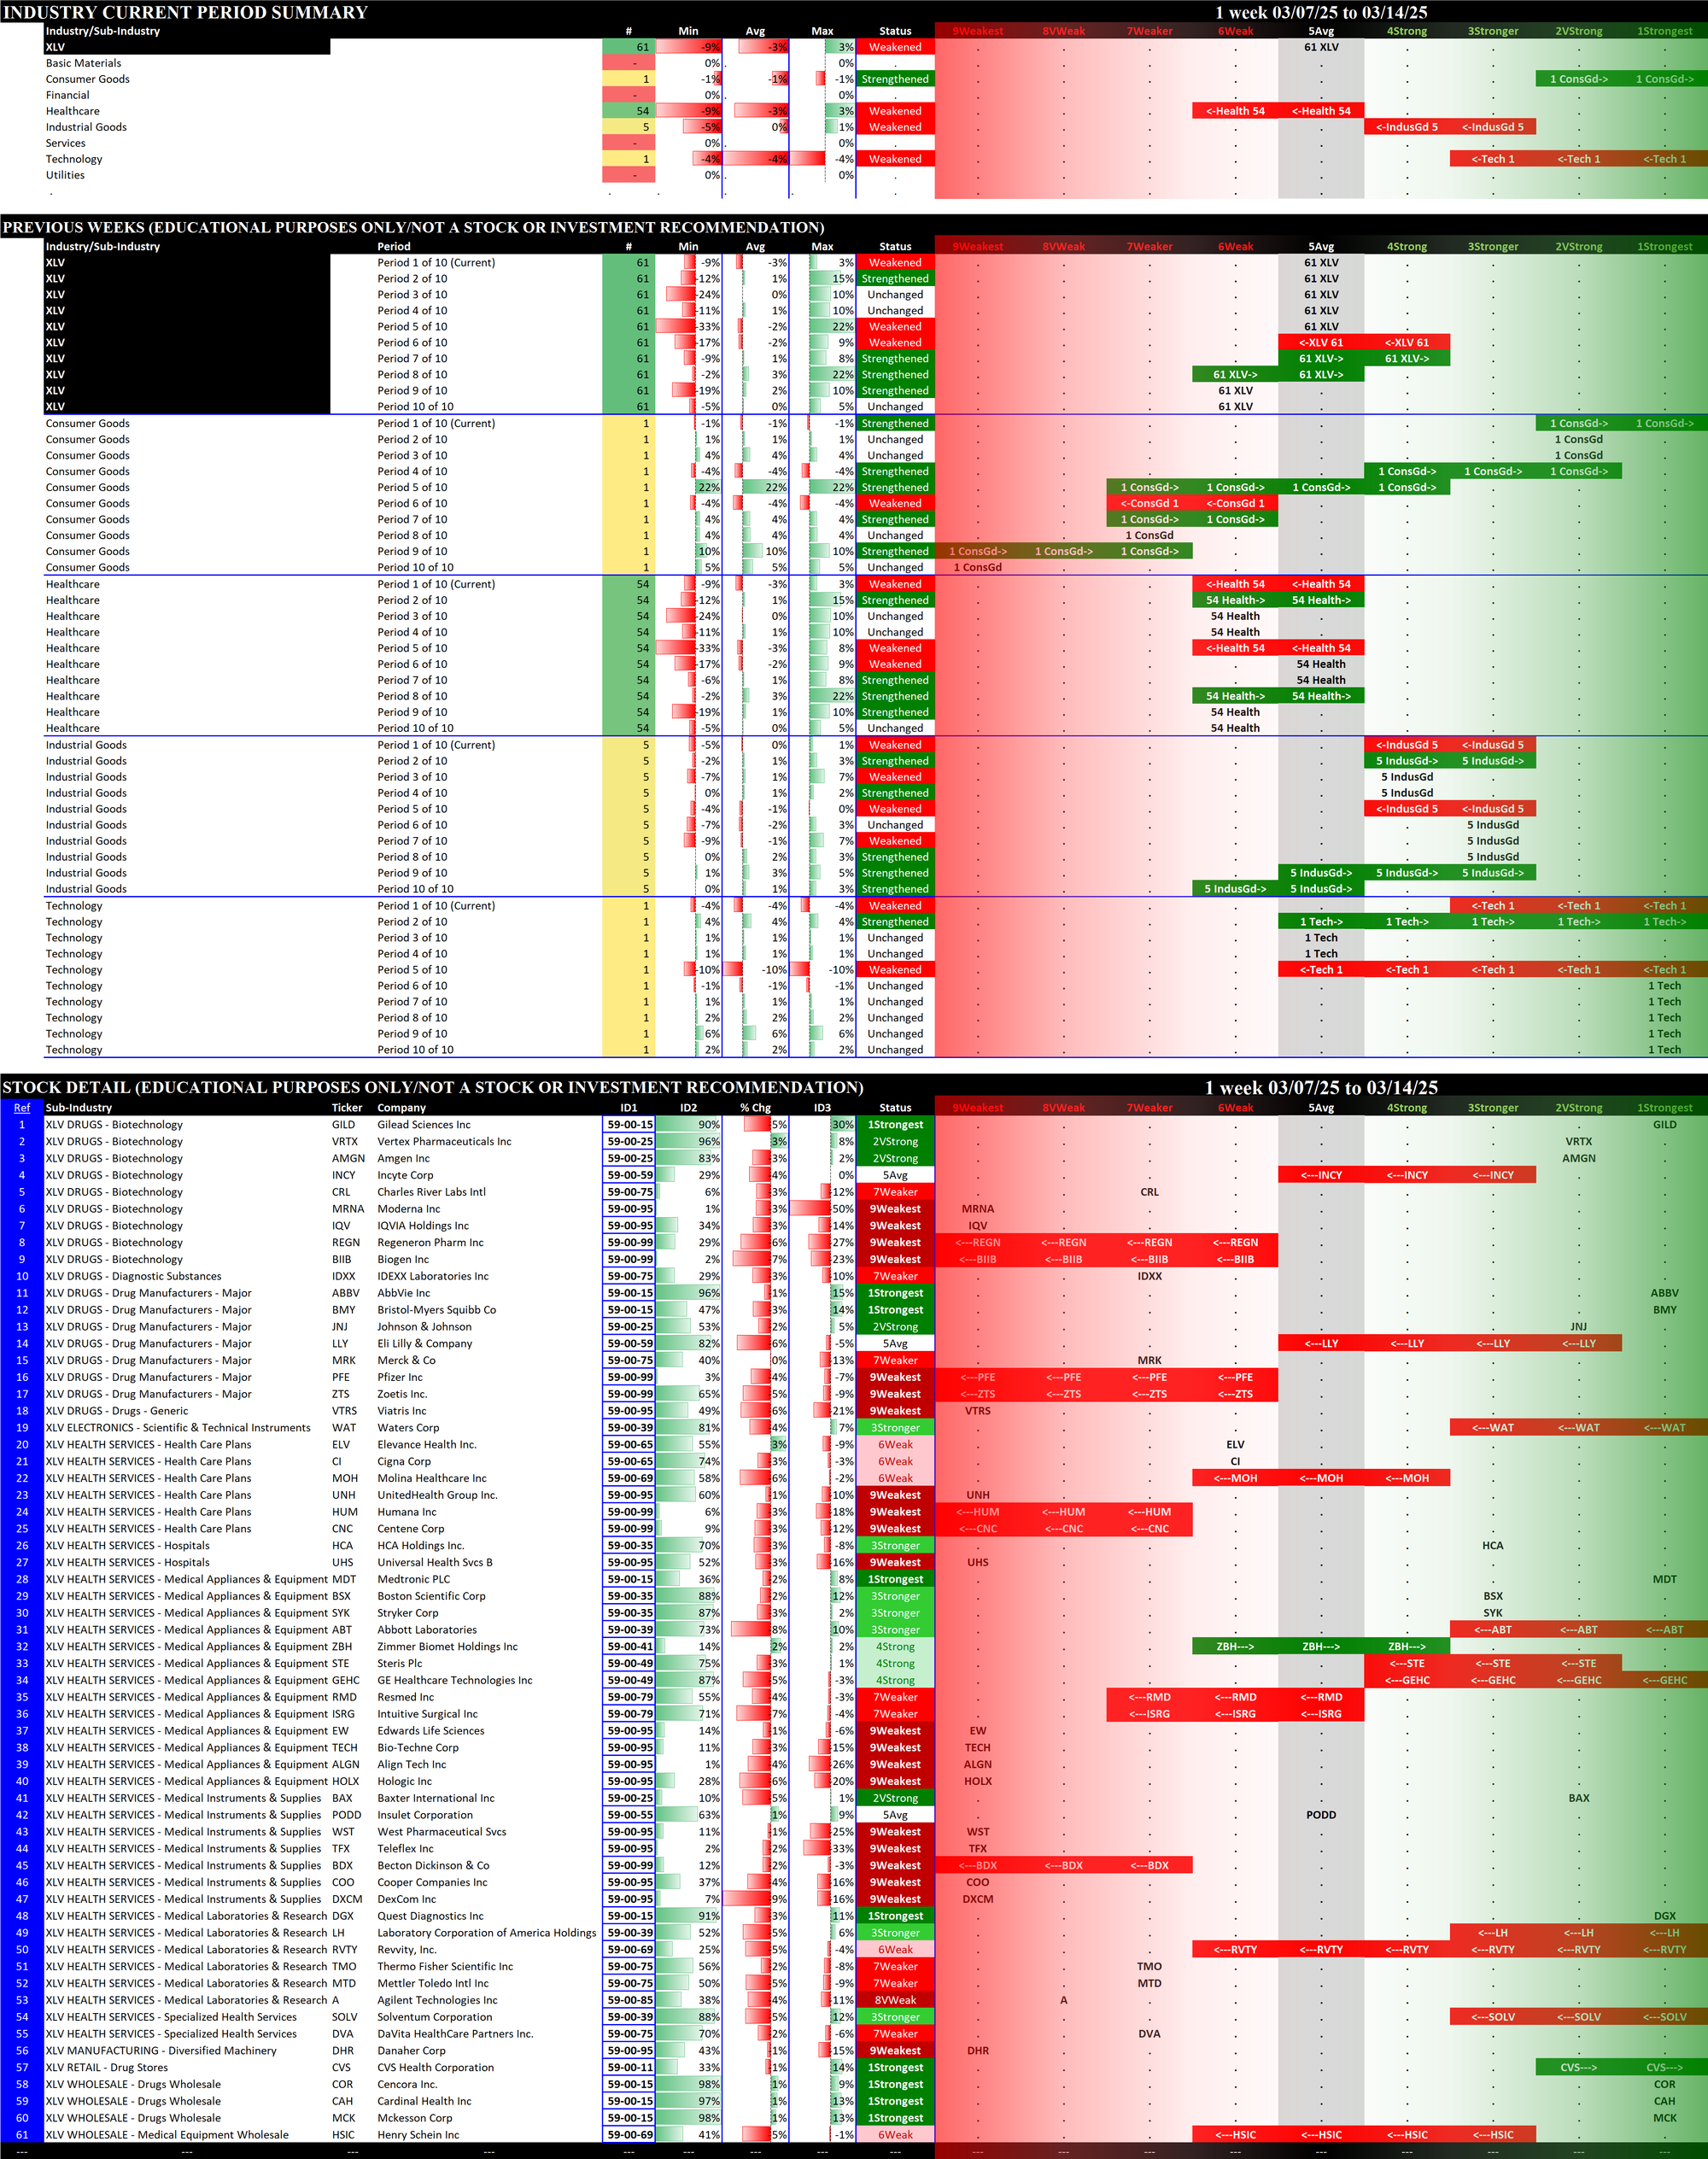
2.10 XLV Health Care
2.11 XLY Consumer Discretionary - Stock Detail (downloads)
1. ETFs Summaries
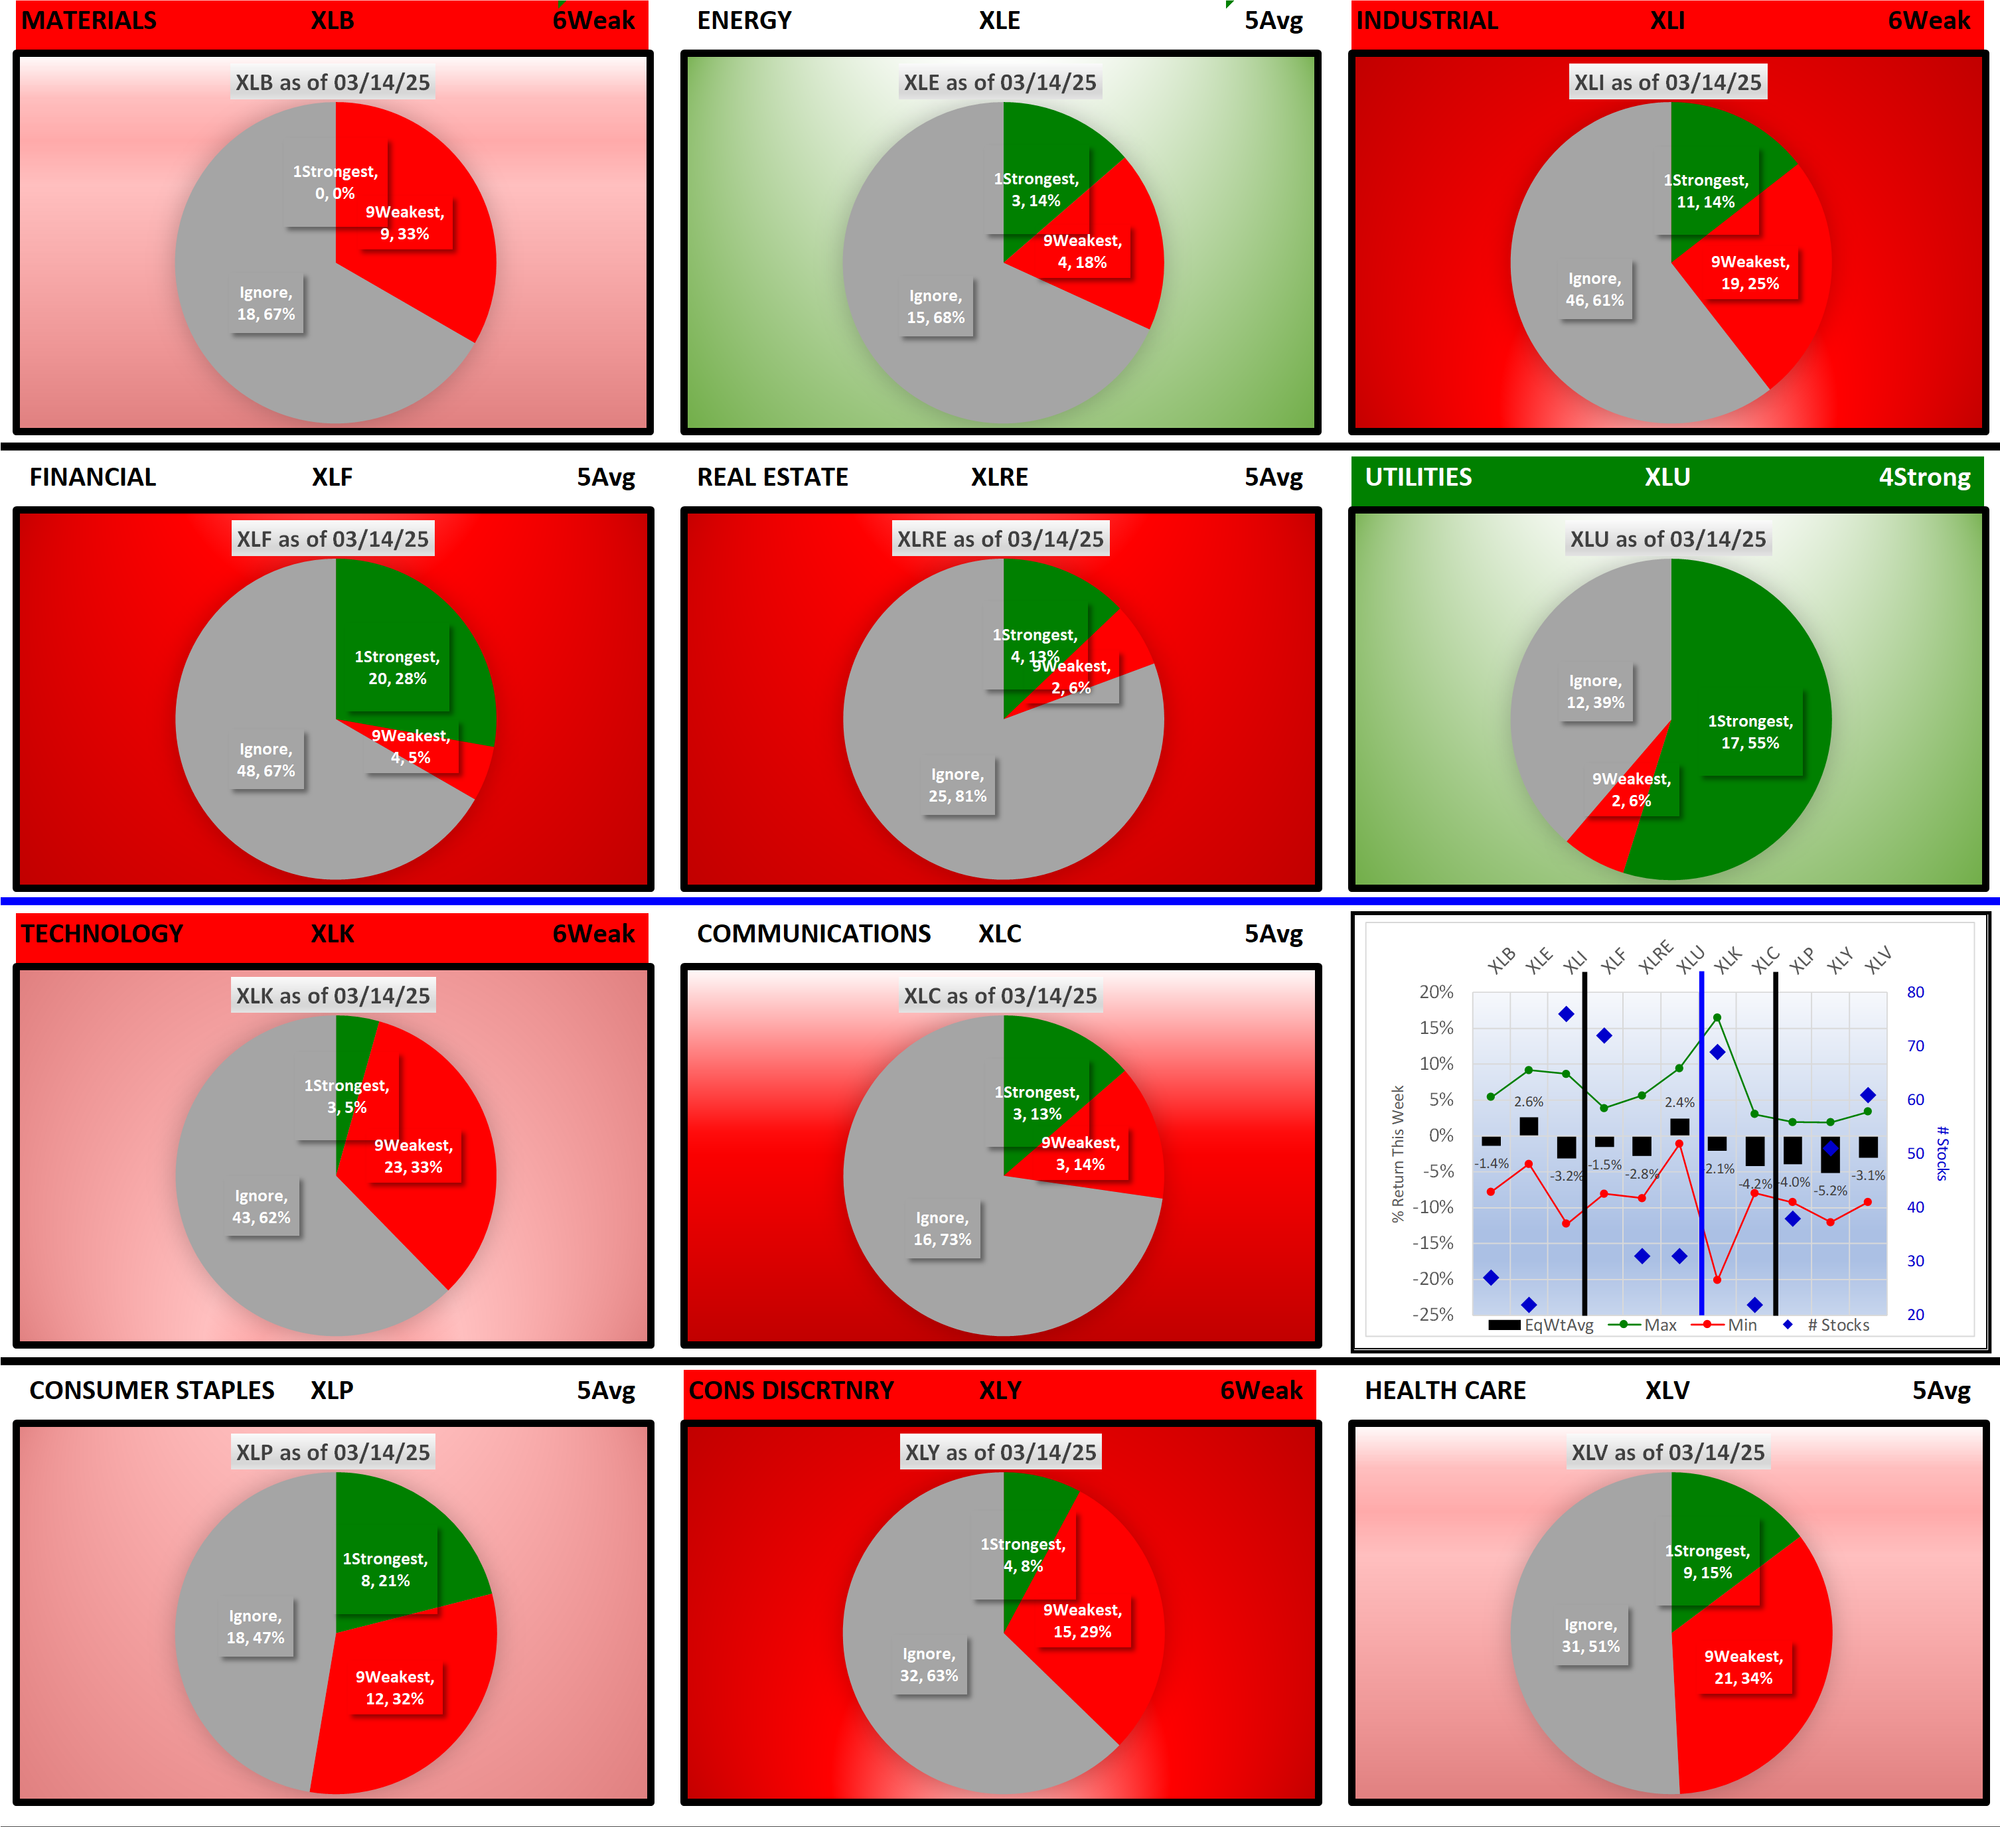
1.1 Current: Component Stocks Strength Ratings (1Strongest vs. 9Weakest vs. Ignore Status)
The following graphs reflect the composition of each of the ETFs based on their underlying component stock strength ratings which range from 1Strongest to 9Weakest. I only care about the strongest and weakest in each sector and thus categorize as "Ignore" stocks rated from 2VeryStrong through 8VeryWeak.
- Top row: XLB/Basic Materials, XLE/Energy, and XLI/Industrial
- Second row: interest rate-sensitive ETFs XLF/Financial, XLRE/Real Estate, and XLU/Utilities
- Third row: XLK/Technology and XLC/Communications
- Bottom row: XLP/Consumer Staples, XLY/Consumer Discretionary, and XLV/Health Care
1.2 Current: Component Stocks Positive vs. Negative Weekly Returns
The following pie charts show the breadth of positive and negative returns for the week for the component stocks of each ETF.
1.3 Historical: 10 Week Ratings by ETF
Below are 10-week historical strength rating summaries of the ETFs, sorted by ETF - each grouping shows the 10-week ratings change for individual ETFs. This shows the path each ETF has taken over the past 10 weeks to arrive at the current strength rating.
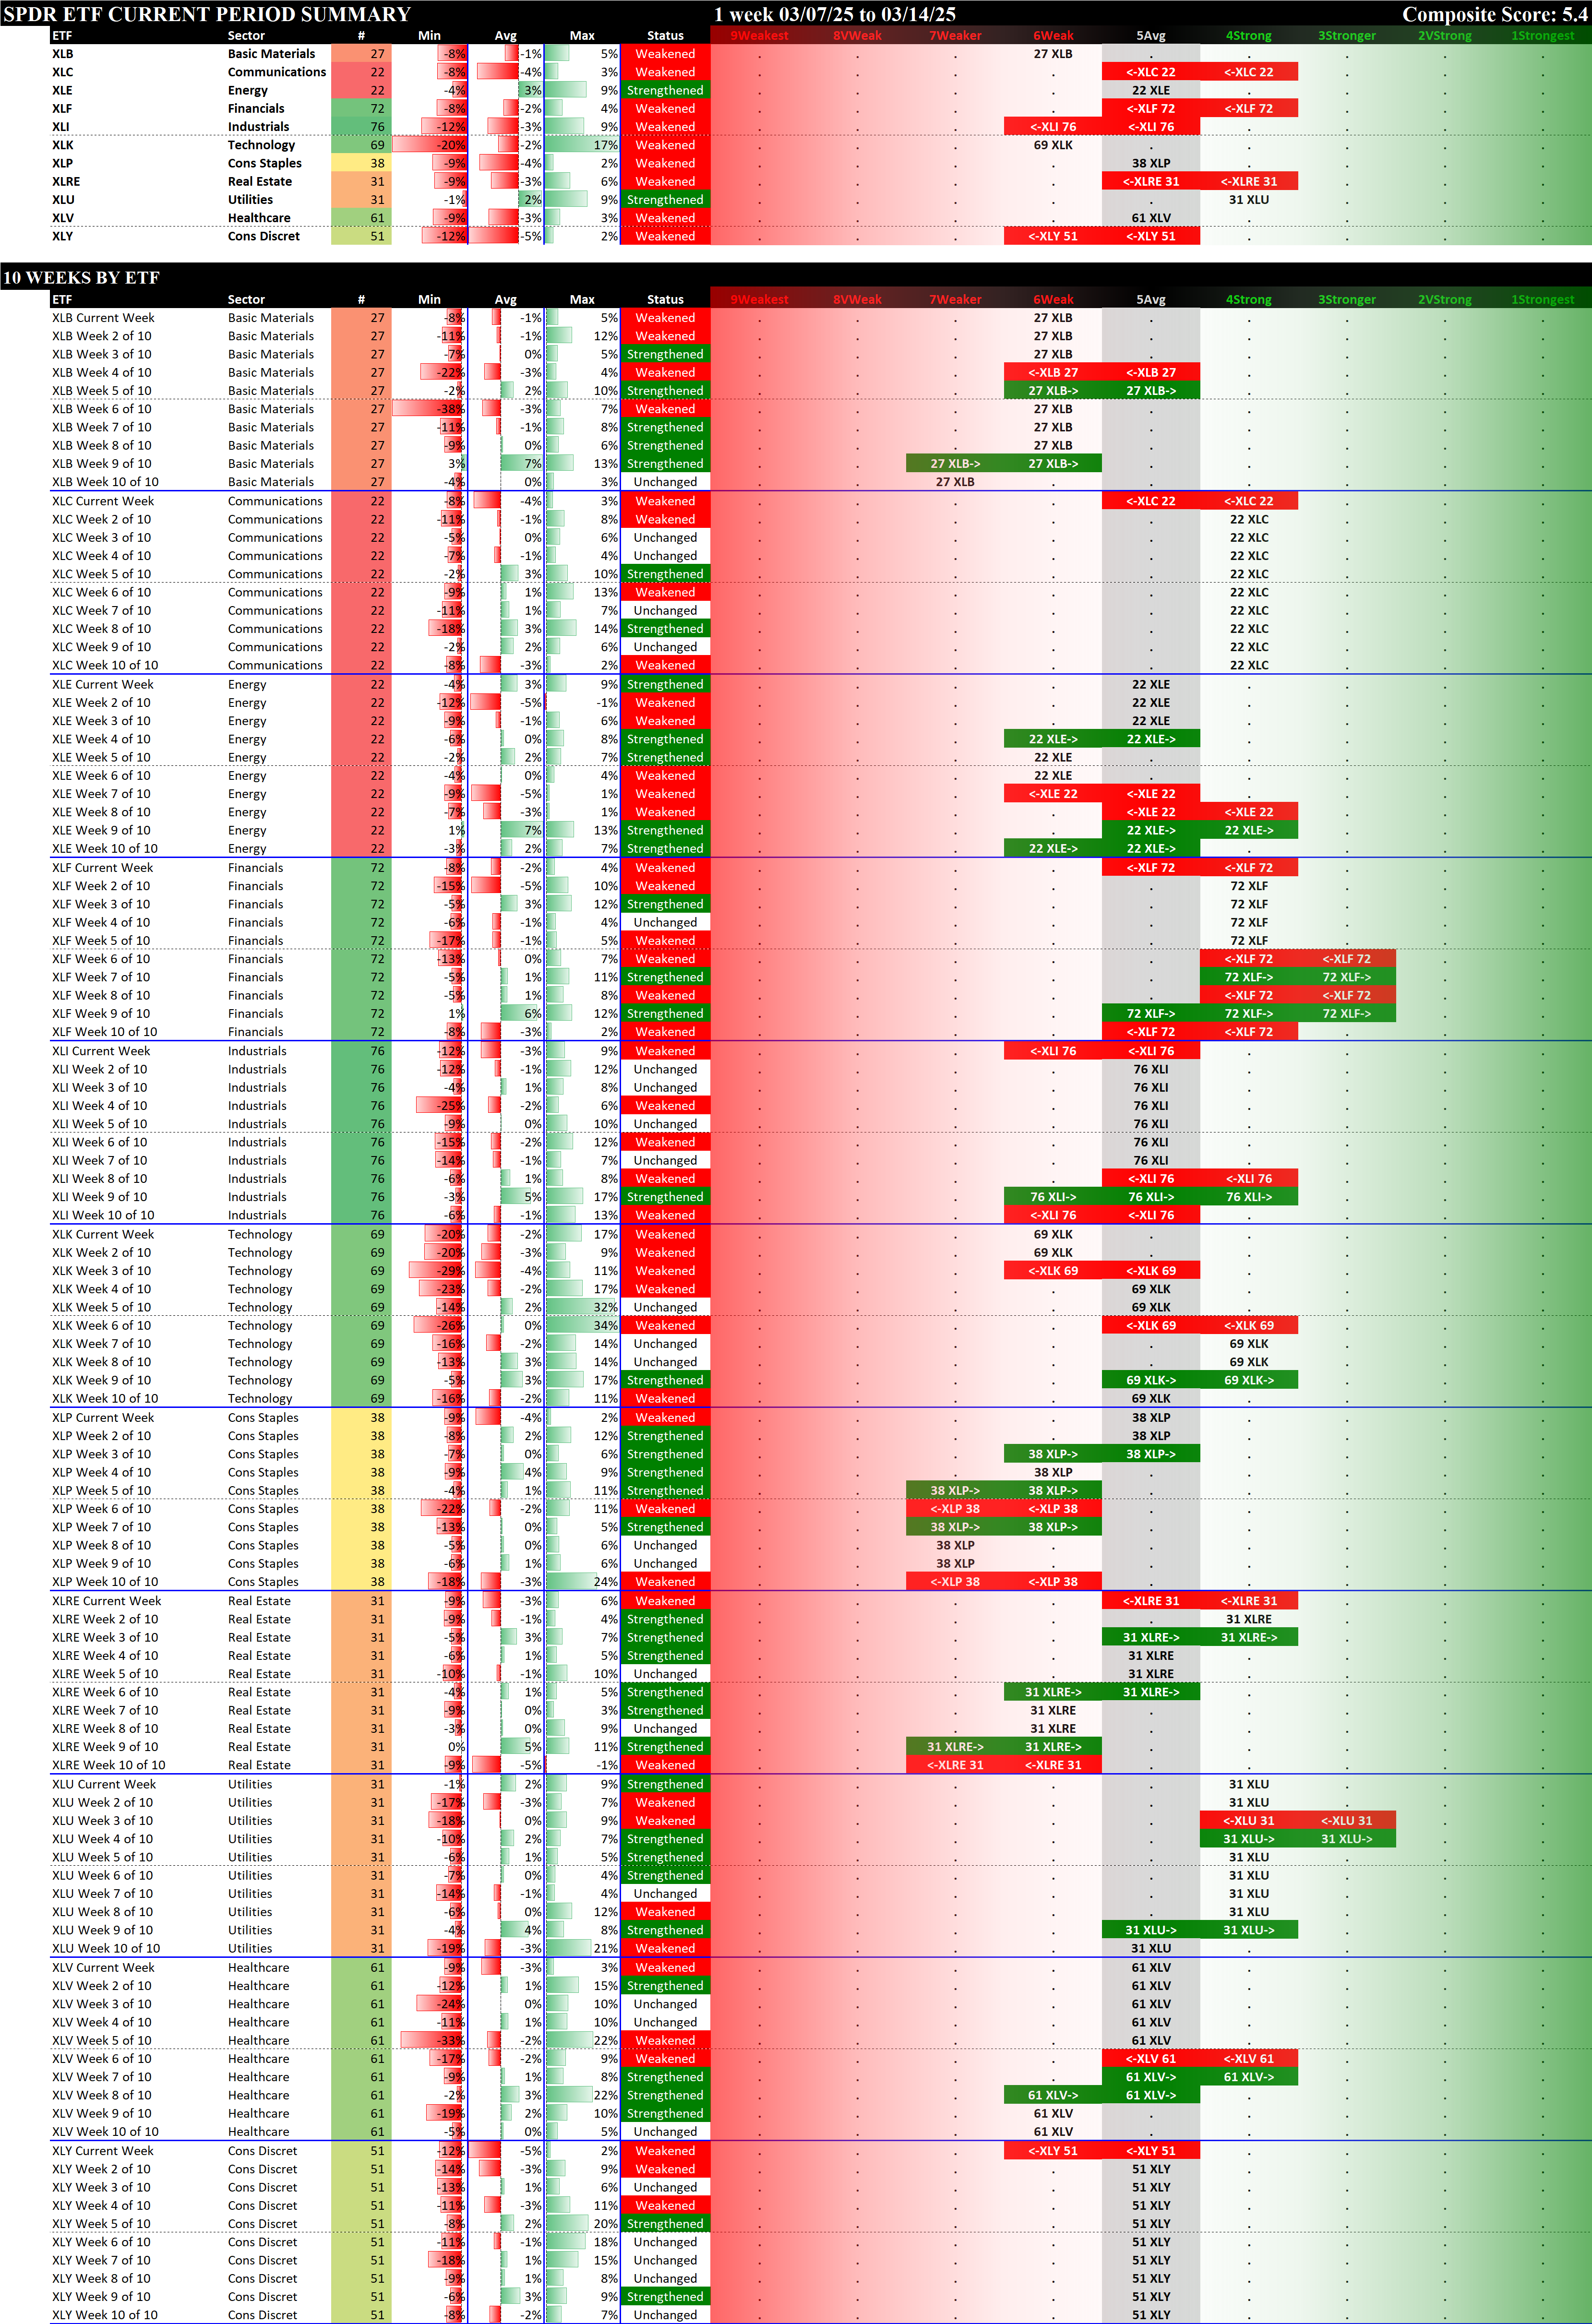
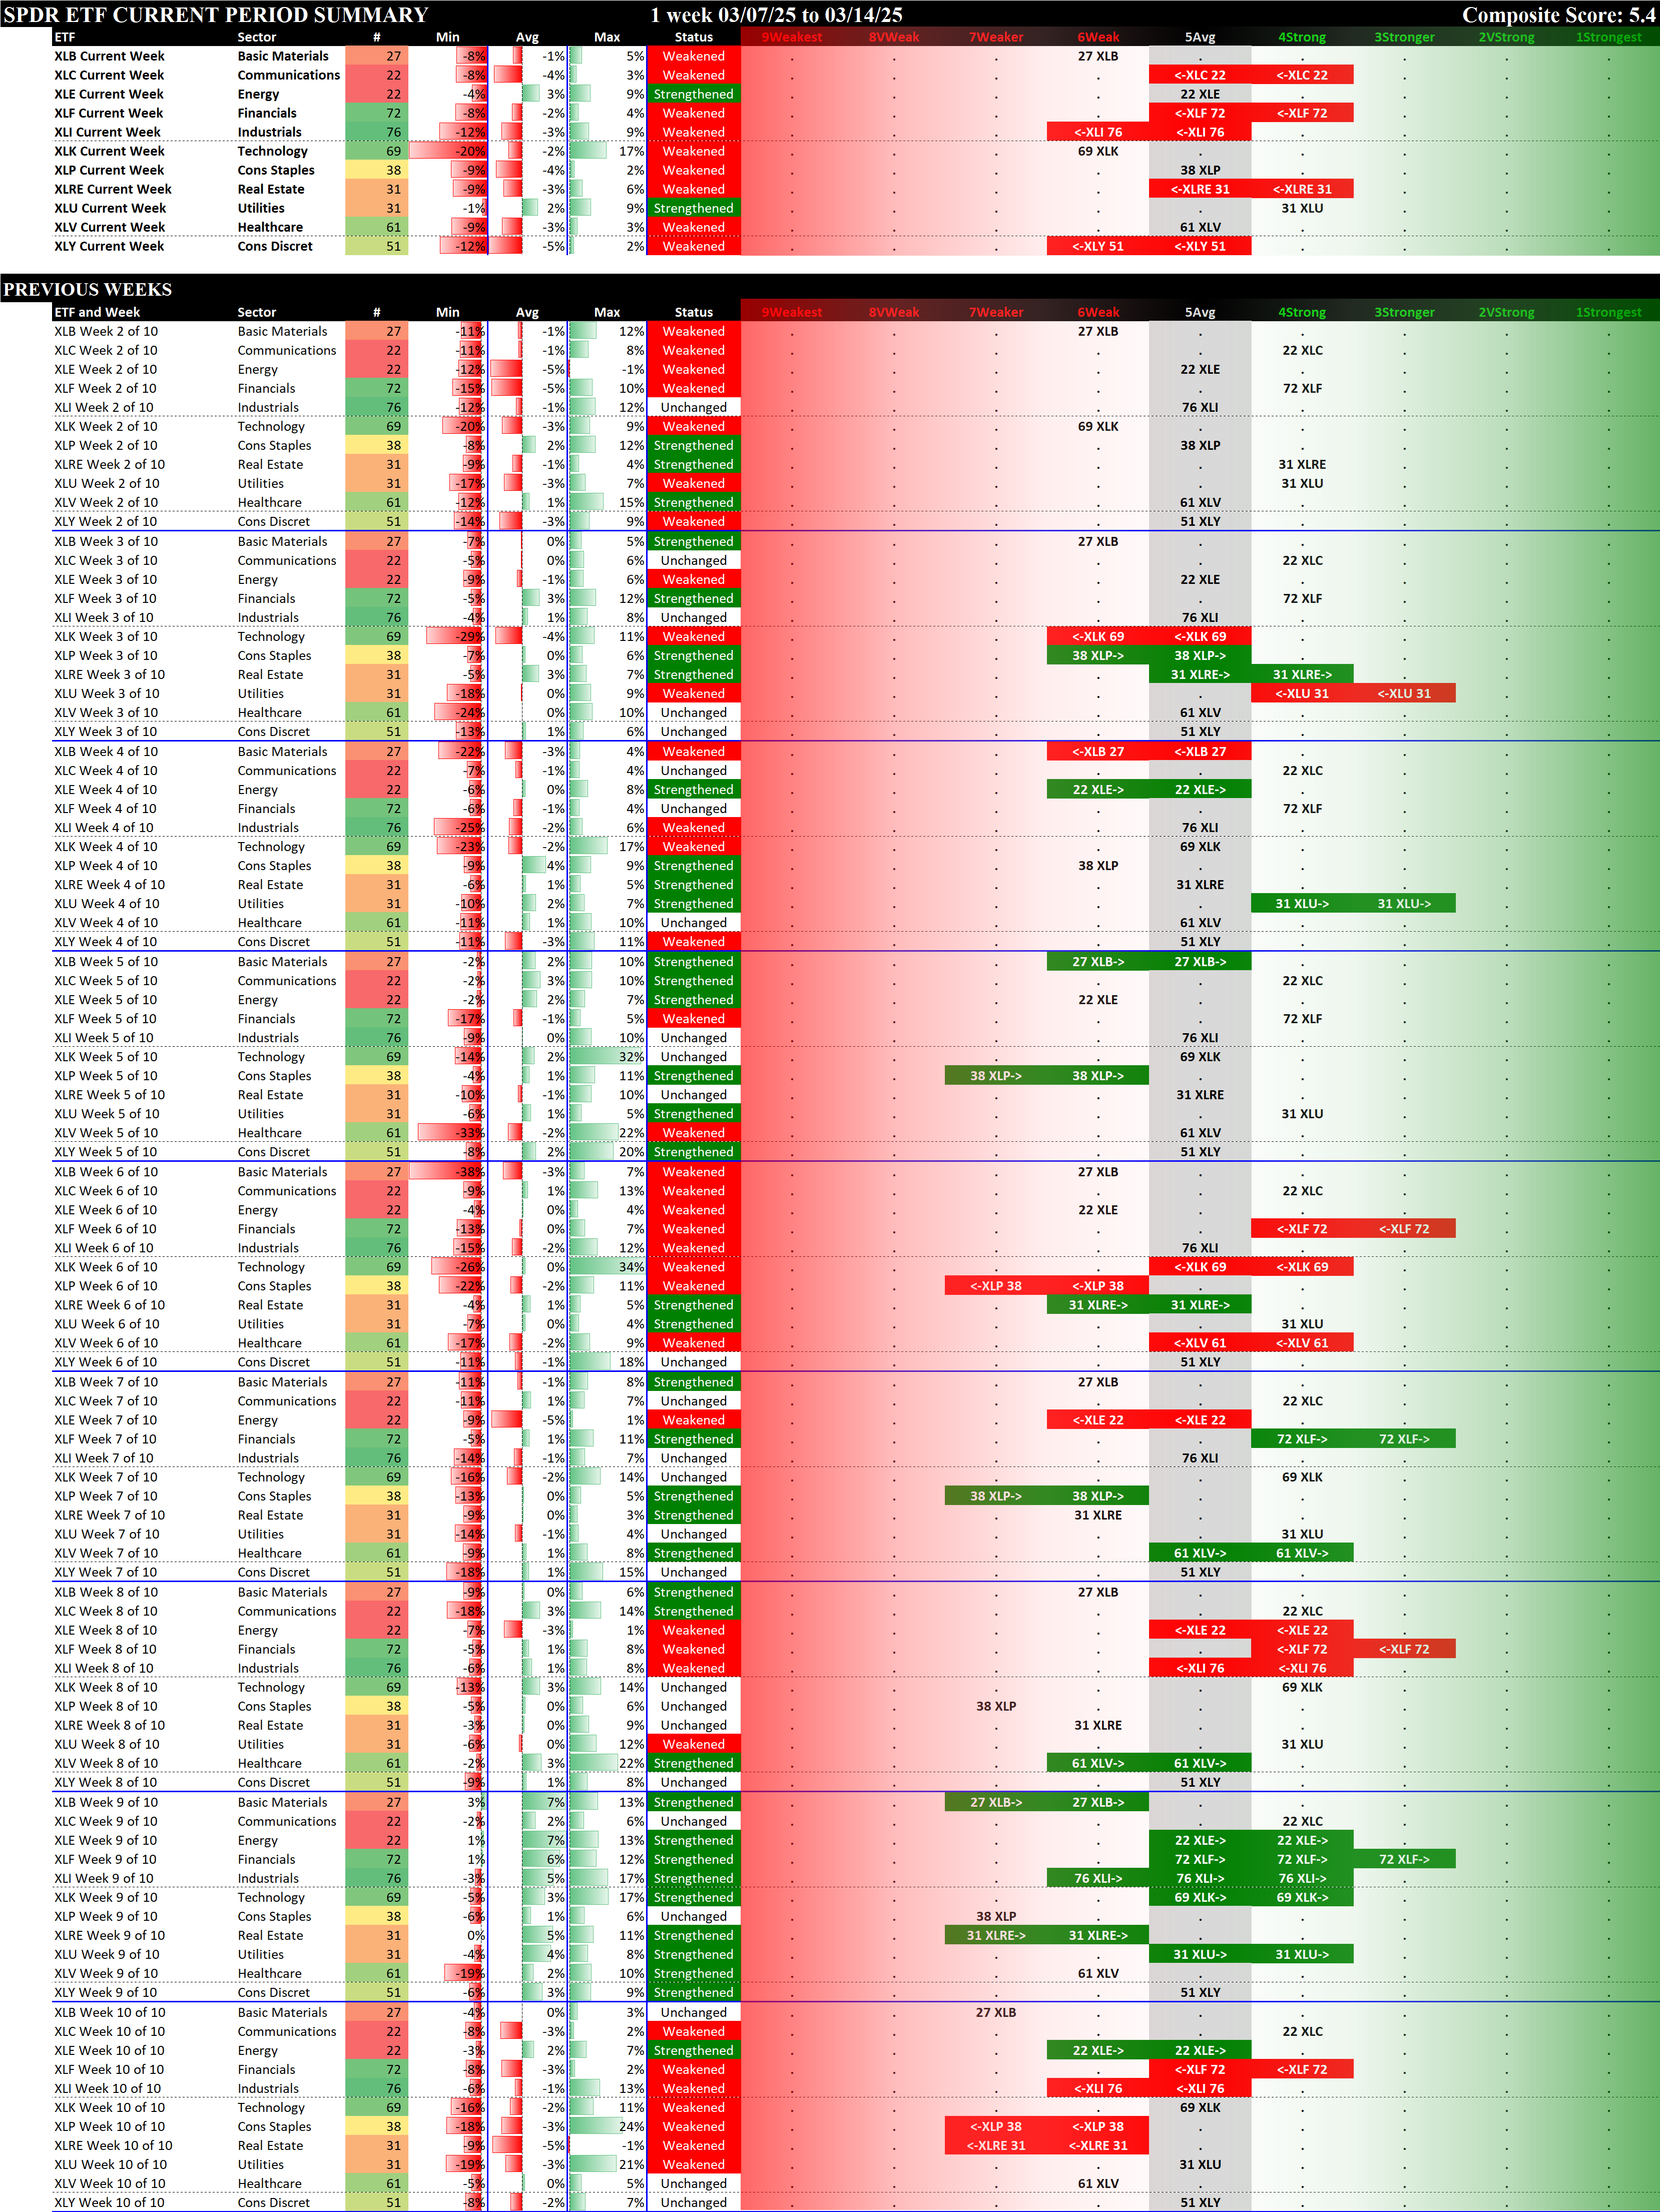
1.4 Historical: 10-Week Ratings by Week
Below are 10-week historical strength rating summaries of the ETFs, sorted by week - each grouping shows one week for all 11 ETFs in newest-to-oldest format. This reveals the weekly strengthening/weakening path of all the ETFs.
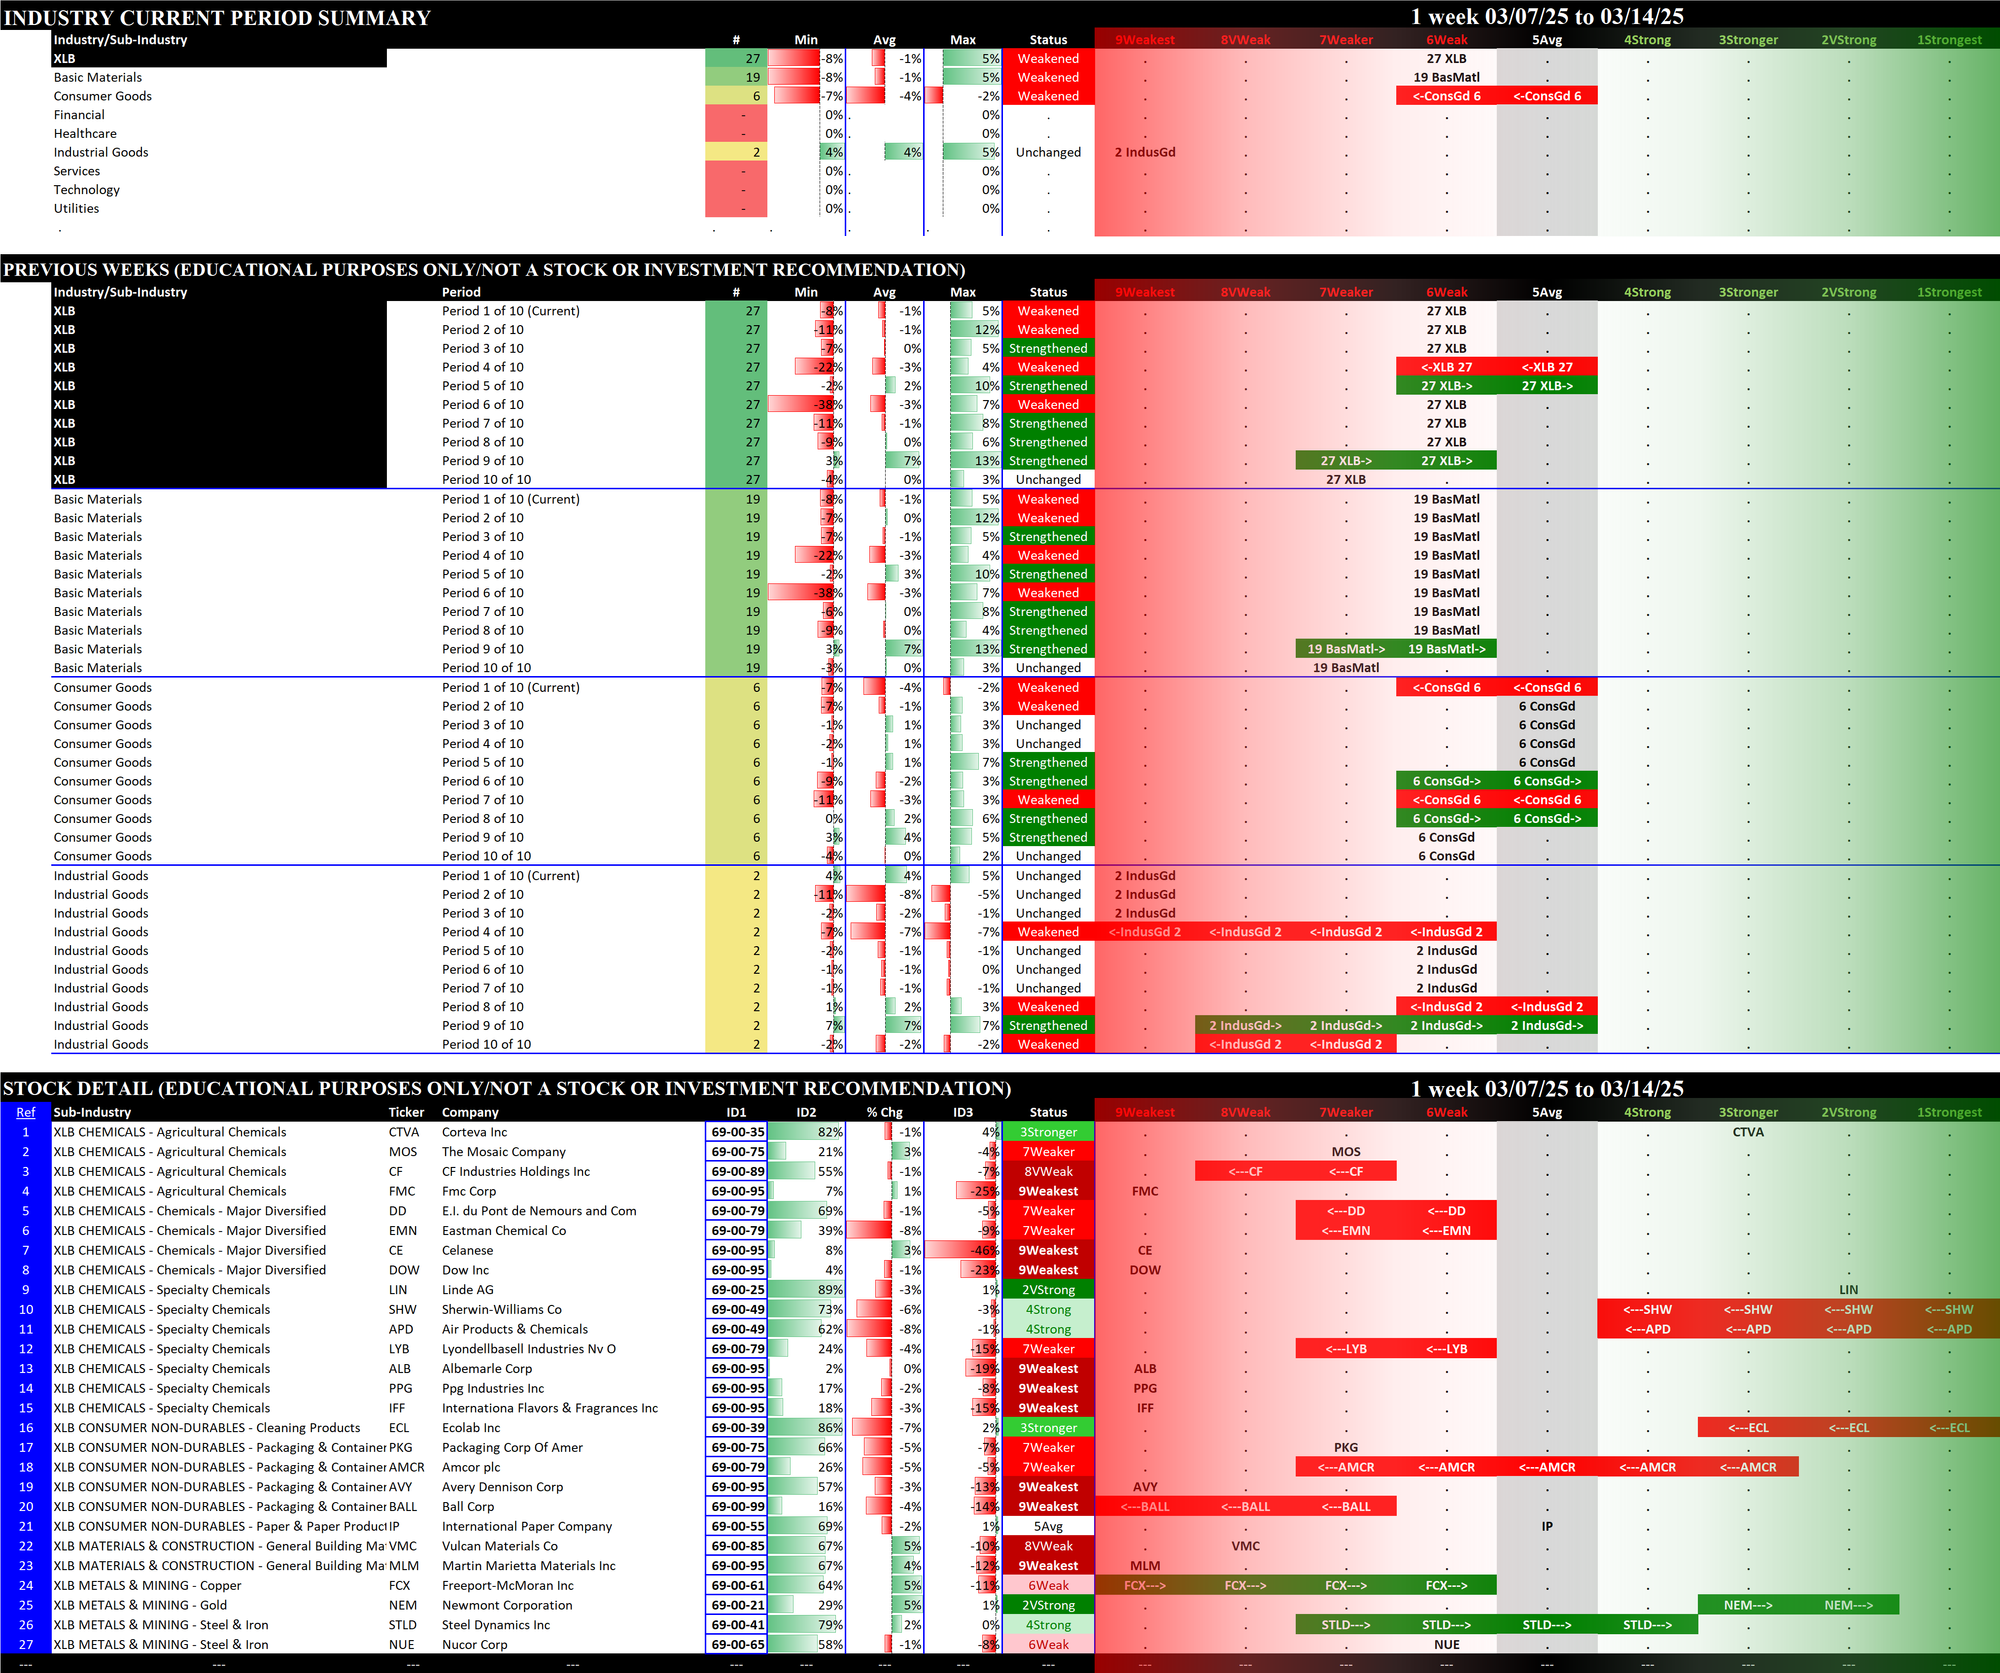
2. ETFs Detail
Details for each of the 11 ETFs are provided below. Comments:
- The top section shows the strength rating of the sectors comprising each ETF, based on the eight original Stock Market Organizer classifications and NOT the 11 ETF classifications. For example, the XLB Basic Materials ETF consists of 19 Basic Materials stocks, 6 Consumer Goods stocks, and 2 Industrial Goods stocks.
- The middle section shows the previous 10 weeks' strengthening and weakening of the relevant sectors. For example, since the XLB has Basic Materials, Consumer Goods, and Industrial Goods stocks, these three sectors are shown in the middle section of the XLB detail. The XLF (Financial) has Financial, Services, and Tech stocks.
- The bottom section shows strengthening/weakening for the underlying ETF component stocks, and includes the listing of their Stock Market Organizer industries and sub-industries. These stocks are listed in order based on Sub-industry then strongest to weakest comparative stock strength rating. The Basic Materials XLB ETF includes both Newmont Corporation/NEM in the Gold sub-industry within the Metals & Mining industry and Dow Inc./DOW in the Specialty Chemicals sub-industry within the Chemicals industry.
In these bottom sections, one can visually see the strength/strengthening and weakness/weakening of the component stocks in each ETF.
2.1 XLB Materials (27 stocks, small), Weakened at 6Weak = tied for WORST
2.2 XLC Communication Services (22 stocks, small), WEAKENED RATING TO 5Avg
2.3 XLE Energy (22 stocks, small), Strengthened at 5Avg
2.4 XLF Financial (72 stocks, large), WEAKENED RATING TO 5Avg
2.5 XLI Industrial (76 stocks, large), WEAKENED RATING TO 6Weak = tied for WORST
2.6 XLK Technology (69 stocks, large), Weakened at 6Weak = tied for WORST
2.7 XLP Consumer Staples (38 stocks, mid-sized), Weakened at 5Avg
2.8 XLRE Real Estate (31 stocks, small/mid-sized), WEAKENED RATING TO 5Avg
2.9 XLU Utilities (31 stocks, small/mid-sized), Strengthened at 4Strong = BEST
2.10 XLV Health Care (61 stocks, large), Weakened at 5Avg
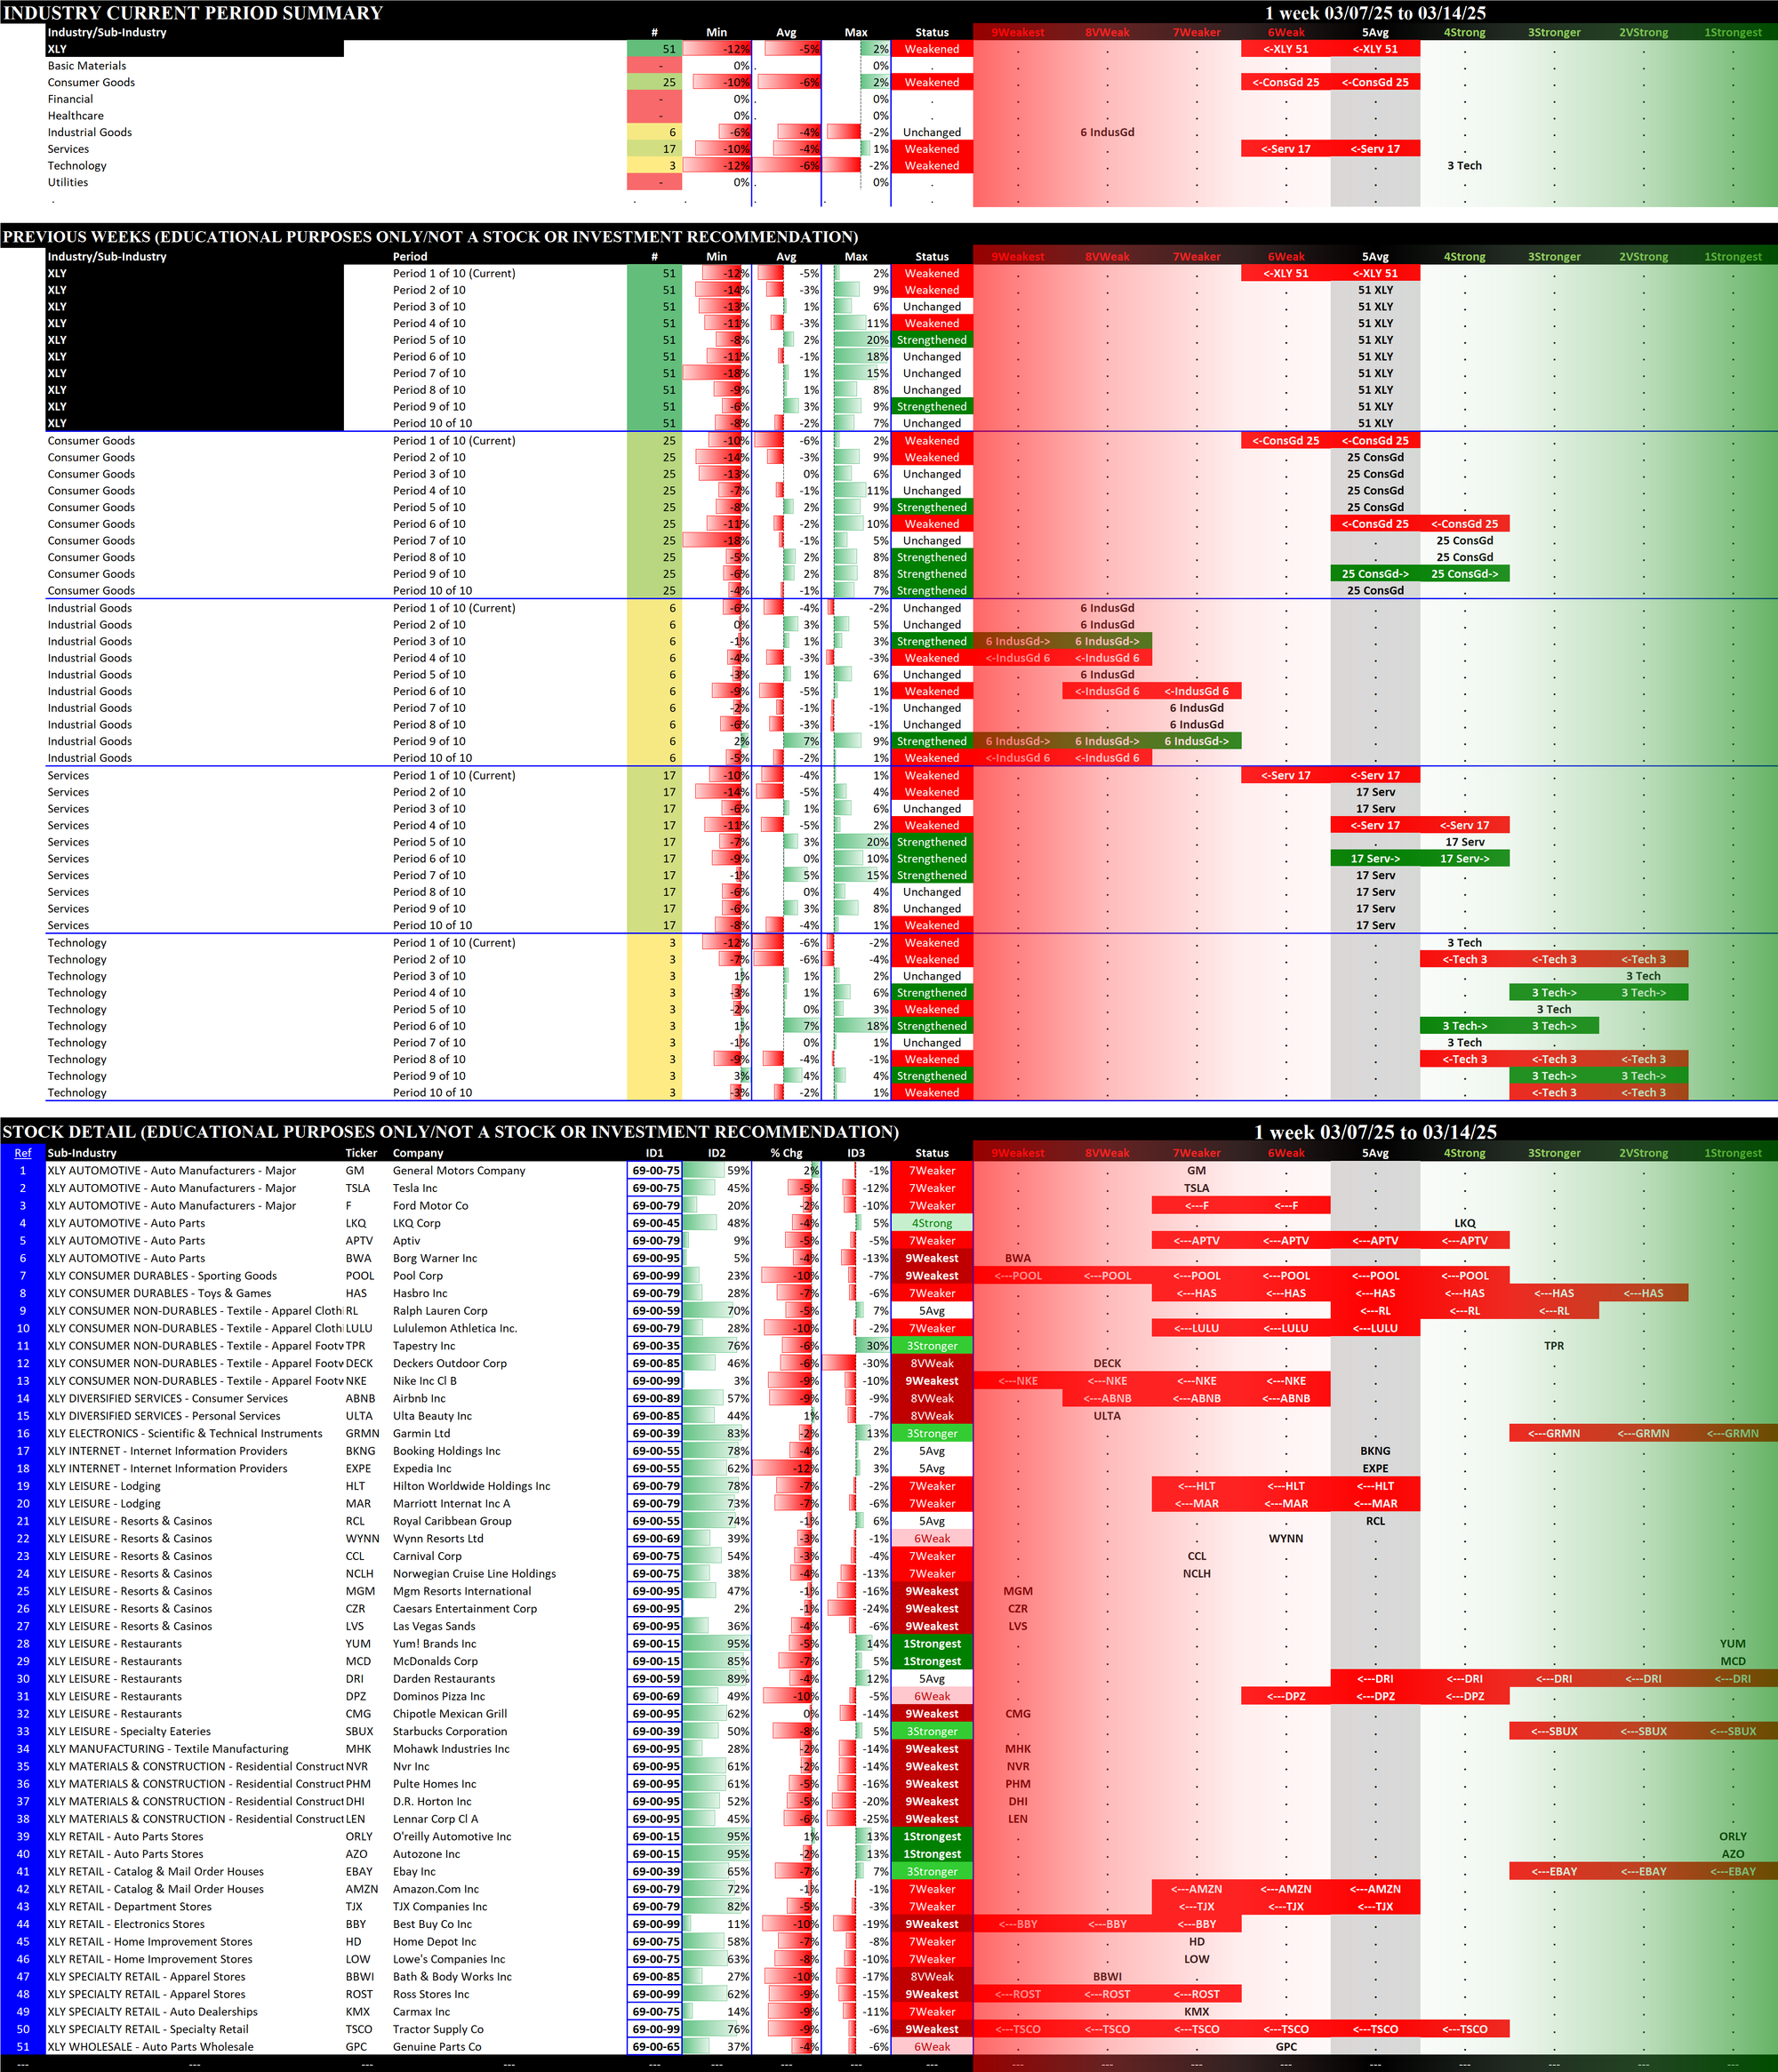
2.11 XLY Consumer Discretionary (51 stocks, mid-sized/large), WEAKENED RATING TO 6Weak = tied for WORST
3. Stock Detail
The downloadable PDF below lists all component stocks in order of first Strongest to Weakest ETF and second Strongest to Weakest Stock. The difference between this report and the 11 ETF stock listings above is this report consolidates all component stocks whereas the above listings are segregated by ETF.
Download the following Excel file if you would like to sort results yourself.