SMO Exclusive: SPDR Sector ETFs Strength Report Friday 2025-01-03 Unchanged at 5.2 Strength Score
This post consists of the following five sections:
I. Introduction
II. Weekly Returns
III. Spectrum Graph Analysis
IV. Today's Market Context
V. Detailed Sector ETF Analysis
I. Introduction
Background
This analysis consists of the Stock Market Organizer stock-by-stock strength analysis applied to the 500 stocks that comprise the 11 SPDR Select ETFs.
These results are combined with overall market environment readings (via the Market Strength Score and the Sector Risk Gauge which currently reflects "risk on") to discern appropriate portfolio exposure given prevailing market and sector conditions.
Why do you care?
This dynamic market analysis provides a continuously updated, apples-to-apples comparison of the strengthening and weakening trends in the US market. By tracking the 500 large-cap stocks across 11 key sectors (via SPDR ETFs), this analysis offers valuable insights for investors seeking to harness momentum in their portfolios.
Each week, the analysis clearly identifies which sectors and stocks have gained, remained flat, or lost ground. With this data, investors can objectively assess sector and stock strength, refining their timing and positioning for new investments. Ultimately, this approach aims to enhance long-term portfolio performance by leveraging momentum – a proven market factor – to inform data-driven investment decisions.
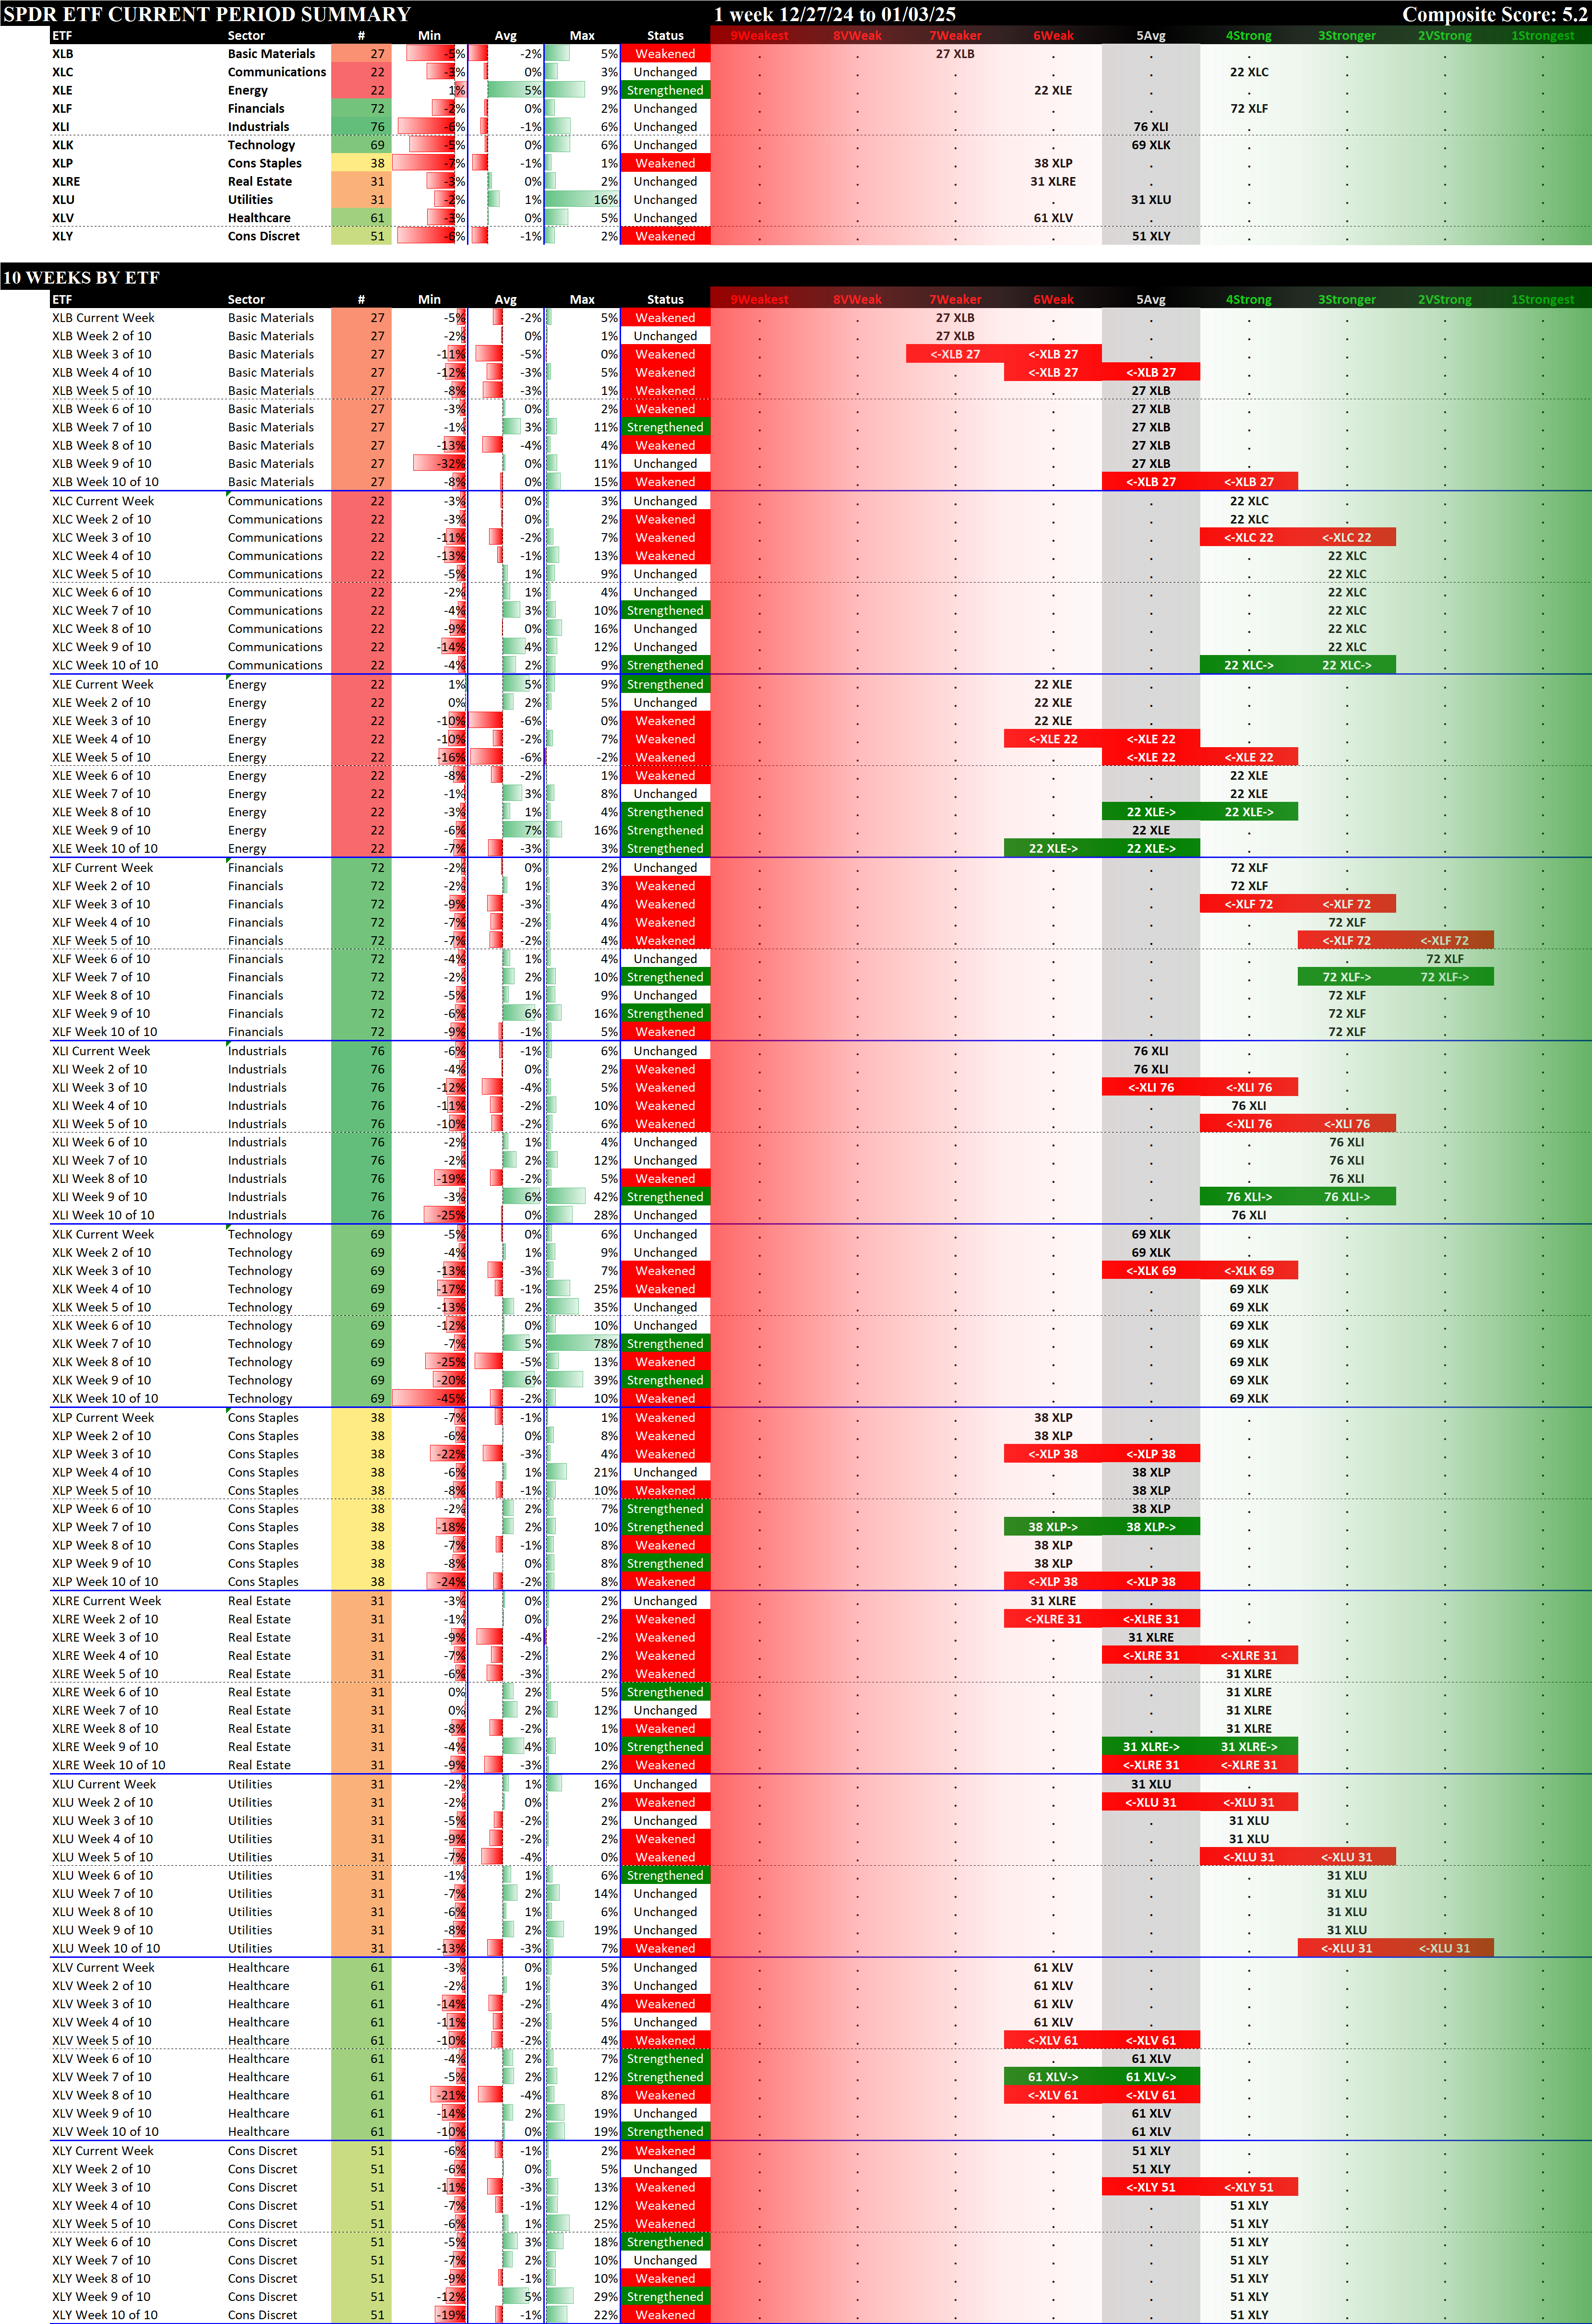
Most Important Ranking: Strengthening Status
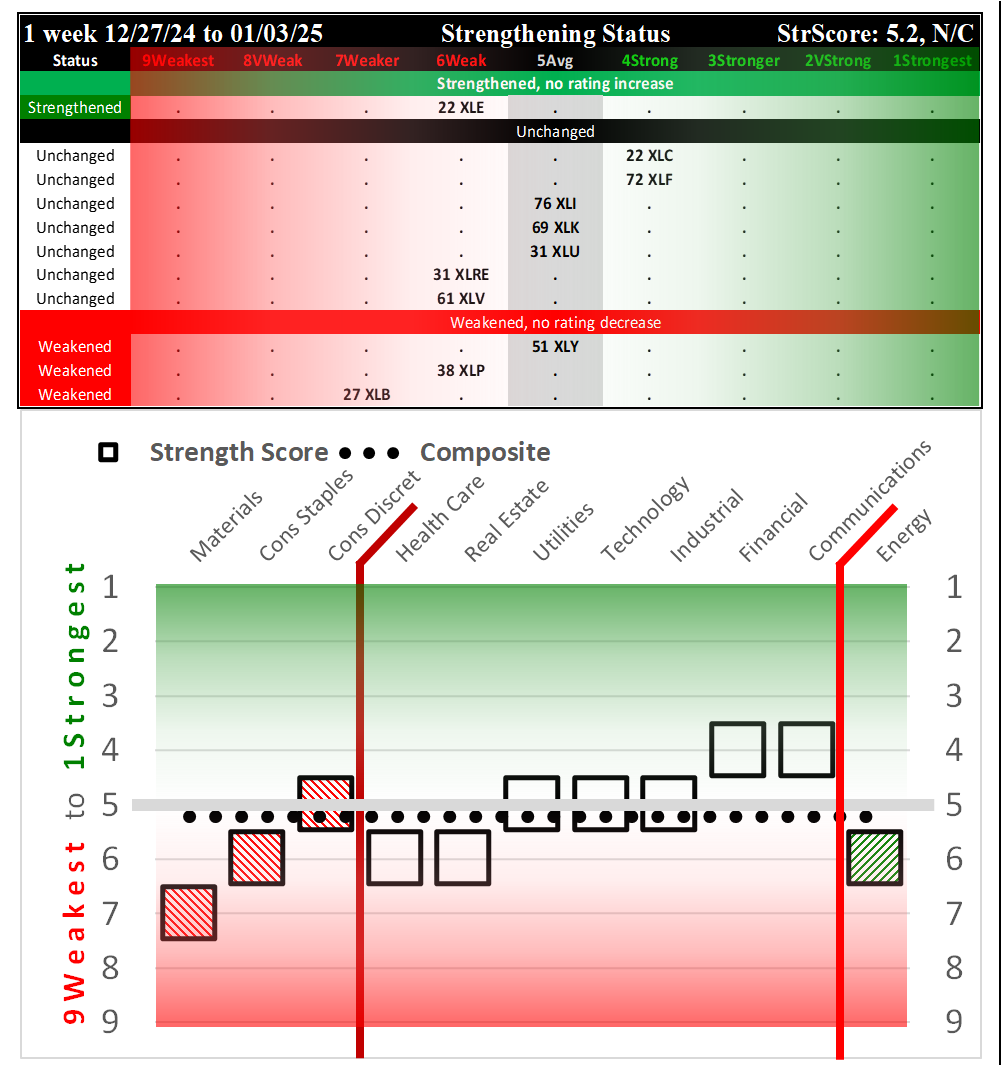
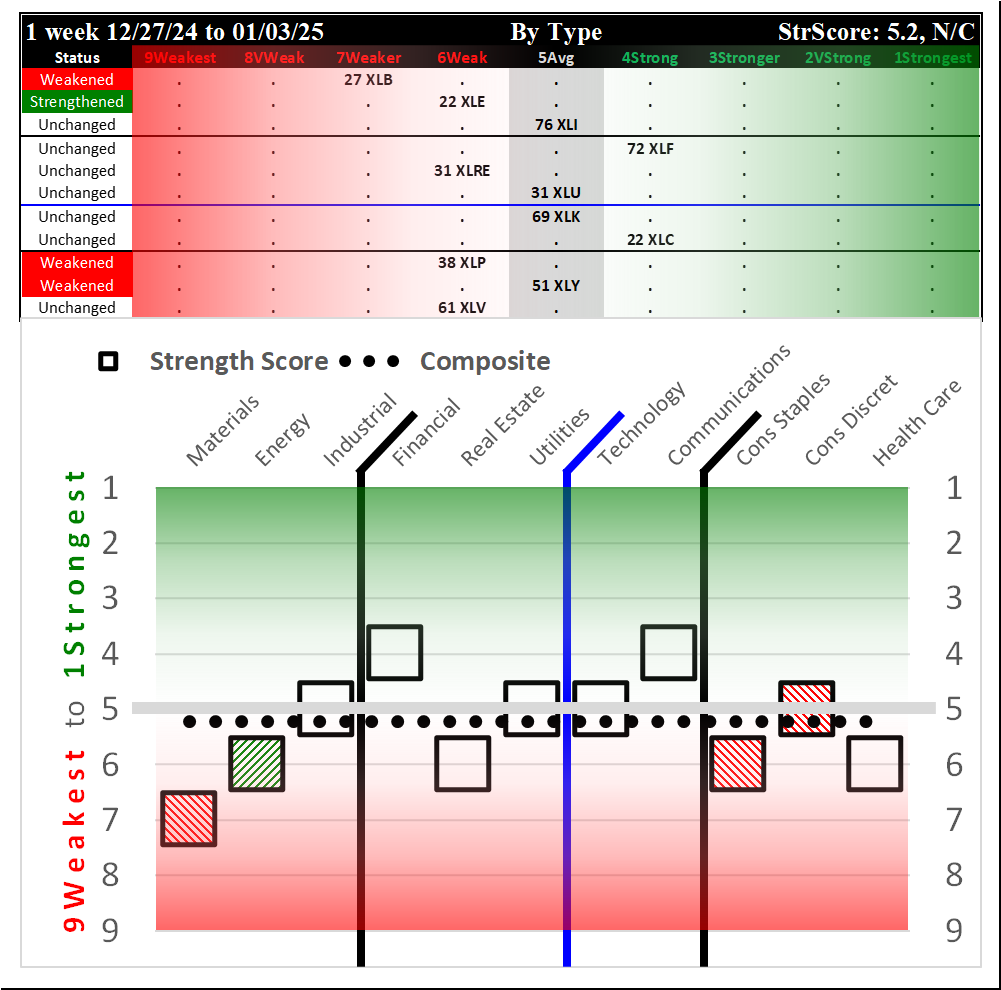
The following Strengthening Status spectrum graph shows the ETFs based on their current strengthening status, as compared to last week.
These are ordered based on important distinctions - did an ETF strengthen or weaken, enough (or not) to change rating, and where in the ratings scale (aka the spectrum of possibilities) does the ETF currently lie?
This graphic clearly provides this key information at a glance.

FIRST STRENGTHENING OVER THE PAST MONTH. Energy strengthened, though not enough to change its rating. The upper portions show strengthening from the top row down, while the lower portions show strengthening from right to left. These graphics are set up to clearly convey which ETFs/sectors strengthened or weakened, and from/to where this happened. Though it is impossible to determine how long these signals will last (what will be), the critical point is that these are the objective strength levels of these ETFs right now (what is).
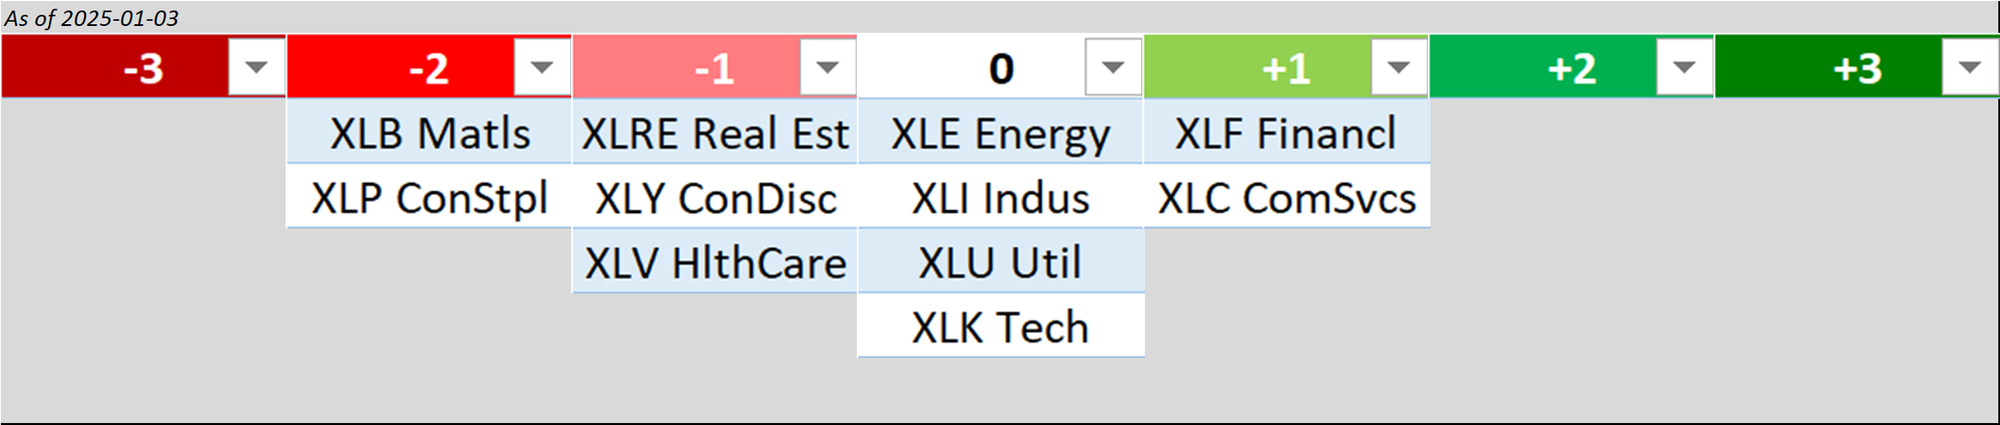
Bottom Line Translation
Each ETF/Sector is given a Bottom Line rating below on a scale of -3 (Worst) to +3 (Best) based on A) the ending strength rating of each ETF and B) the strengthening/weakening action of the ETFs during the week, with the five possibilities being 1) strengthened enough to increase rating, 2) strengthened but not enough to increase rating, 3) unchanged, 4) weakened but not enough to decrease rating, and 5) weakened enough to decrease rating.
II. Weekly Returns
Average Returns
The average returns for the underlying stocks in each ETF are shown below - note this is NOT the return for the ETF for this week.
The best and worst are highlighted below:
Best:
- XLE/Energy, 4.6% average for 22 stocks
- XLU/Utilities, 1.0% average for 31 stocks
- XLRE/Real Estate, 0.3% average for 31 stocks
Worst:
- XLB/Materials, -1.6% average for 27 stocks
- XLY/Consumer Discretionary, -1.3% average for 51 stocks
- XLP/Consumer Staples, -1.3% average for 38 stocks
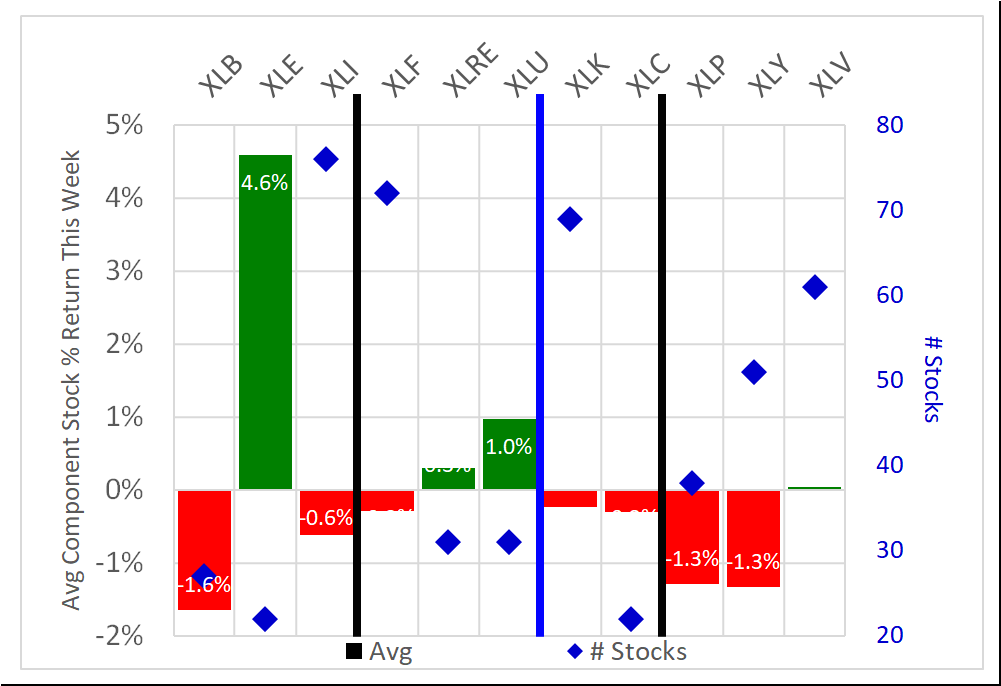
Only four of 11 ETFs had positive average returns for the week and XLE/Energy was by far the standout performer.
High and Low Returns
The following graphic overlays the lowest and highest returns in each sector.
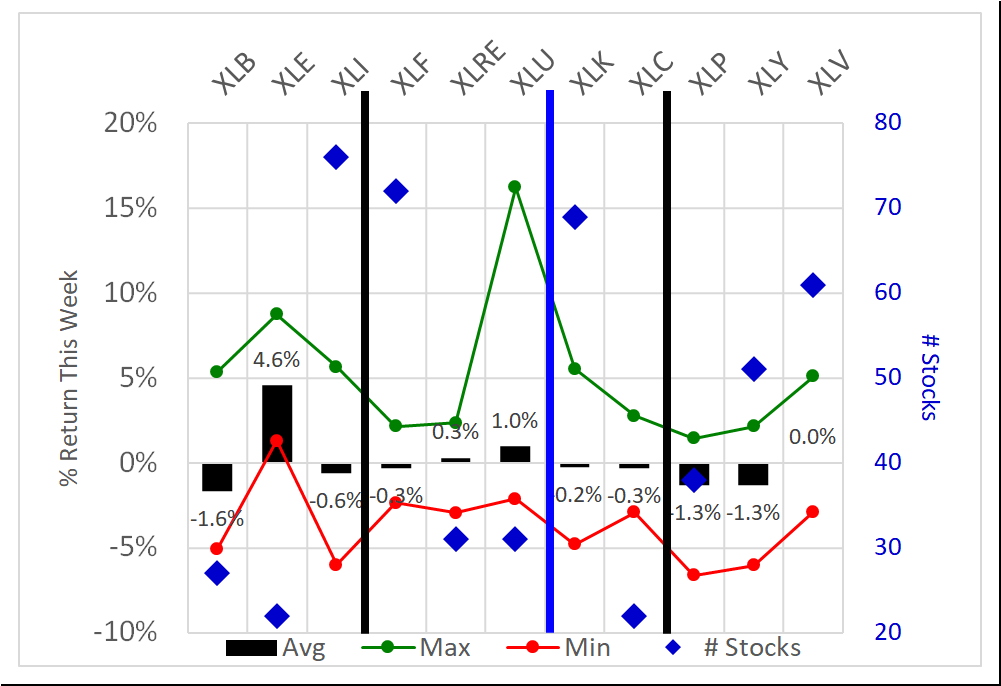
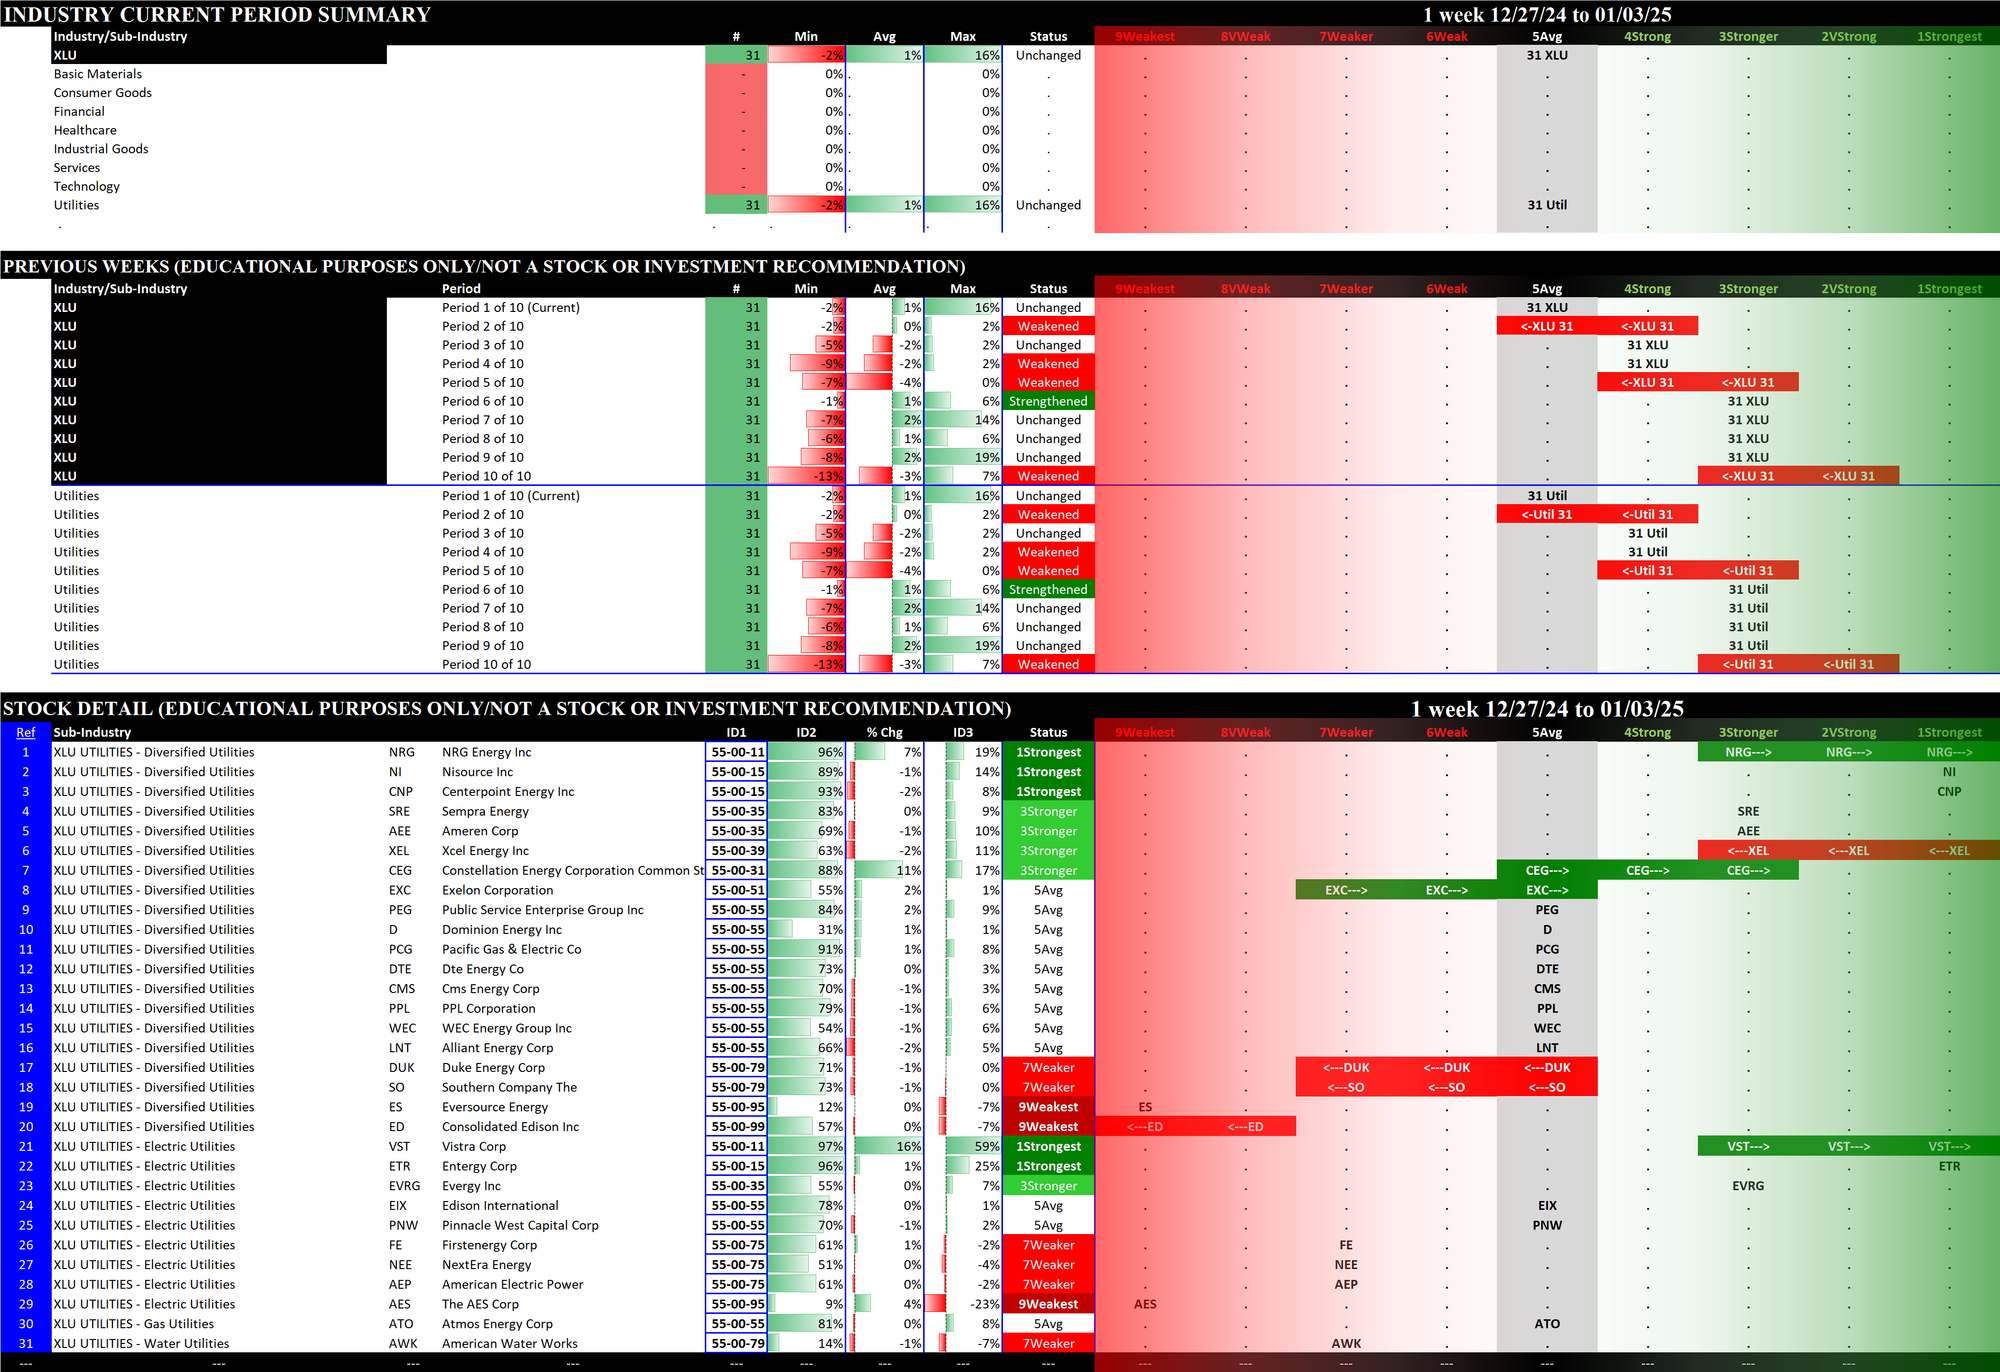
The XLU/Utilities outlier to the upside was VST/Vistra Corp +16% which strengthened during the week from 3Stronger to 1 Strongest. The XLP/Consumer Staples outlier to the downside was BFB/Brown Forman Corp -7% which started and ended the week as a 9Weakest stock.
III. Spectrum Graph Analysis
This methodology uses spectrum graphs to obtain key insights unavailable elsewhere.
There are currently four types of spectrum graphs in this ETF analysis:
- By Strengthening - this is the most important graph, and it clearly shows in order the ETFs/sectors based on their strengthening/weakening performance during the week:
- Strengthened rating (rating change is most important signal)
- Strengthened but not enough to change rating
- Unchanged
- Weakened but not enough to change rating, and
- Weakened rating (rating change is most important signal). - By Type - logically groups the ETFs (for example, interest rate-sensitive, technology-related, consumer-related) for direct comparison with similar ETFs.
- By Strongest to Weakest
- Alphabetically
The remainder of this section uses types 2, 3, and 4 above to show current performance.
Context: Comparison to Recent Weeks
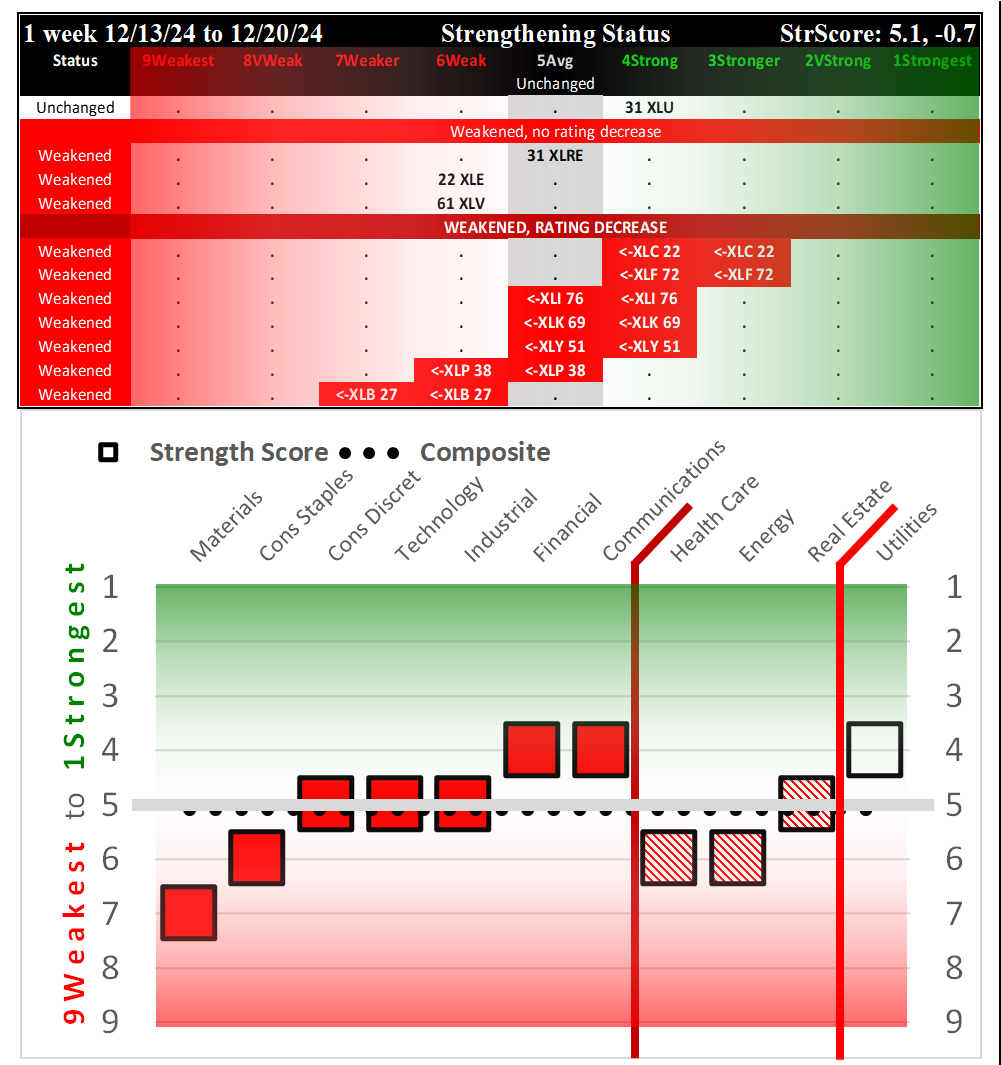
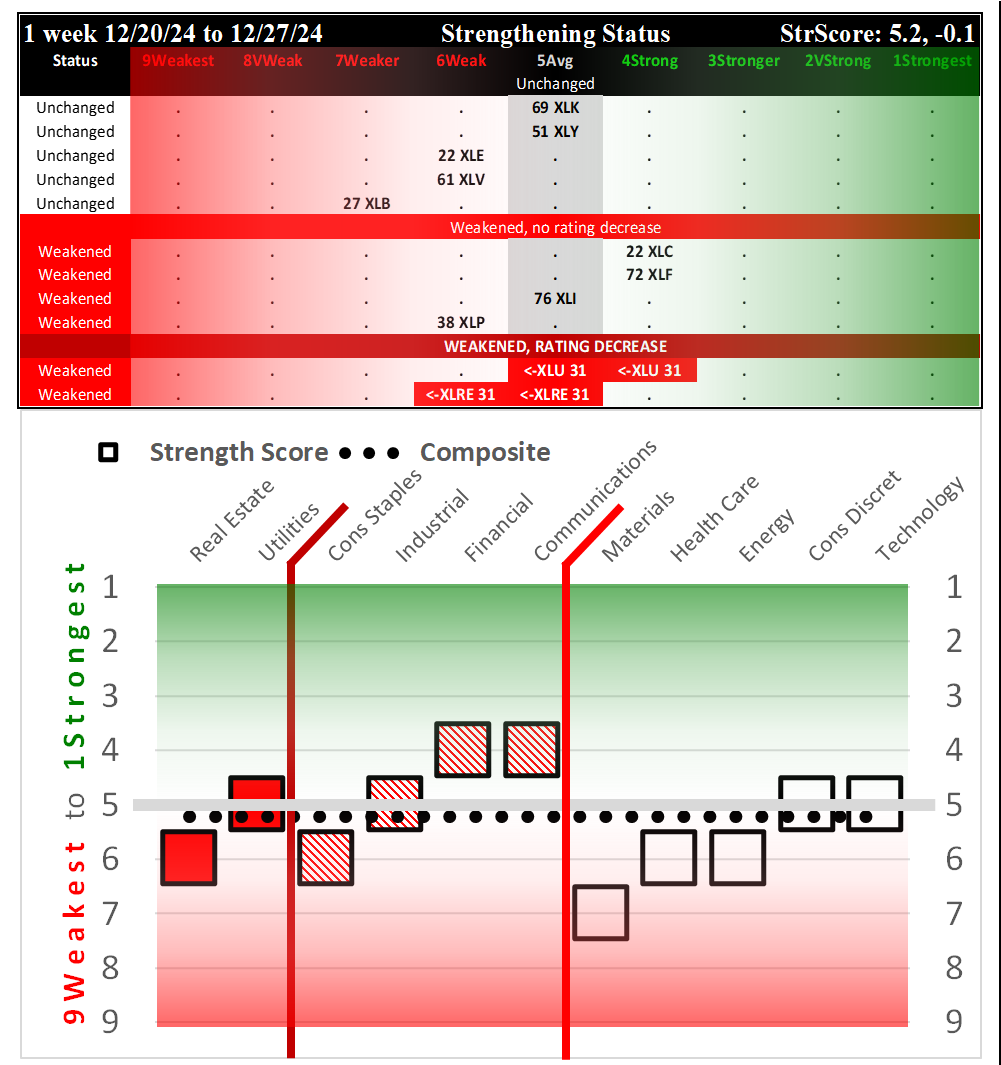
The following spectrum graphs by ETF Type show recent Friday week-to-week changes compared to the current week:
- 11/29/24: Flat/Strengthening (not shown)
- 12/06/24: Weakening (not shown)
- 12/13/24: Weakening (not shown)
- 12/20/24: Weakening
- 12/27/24: Weakening
- 01/03/2025: Flat
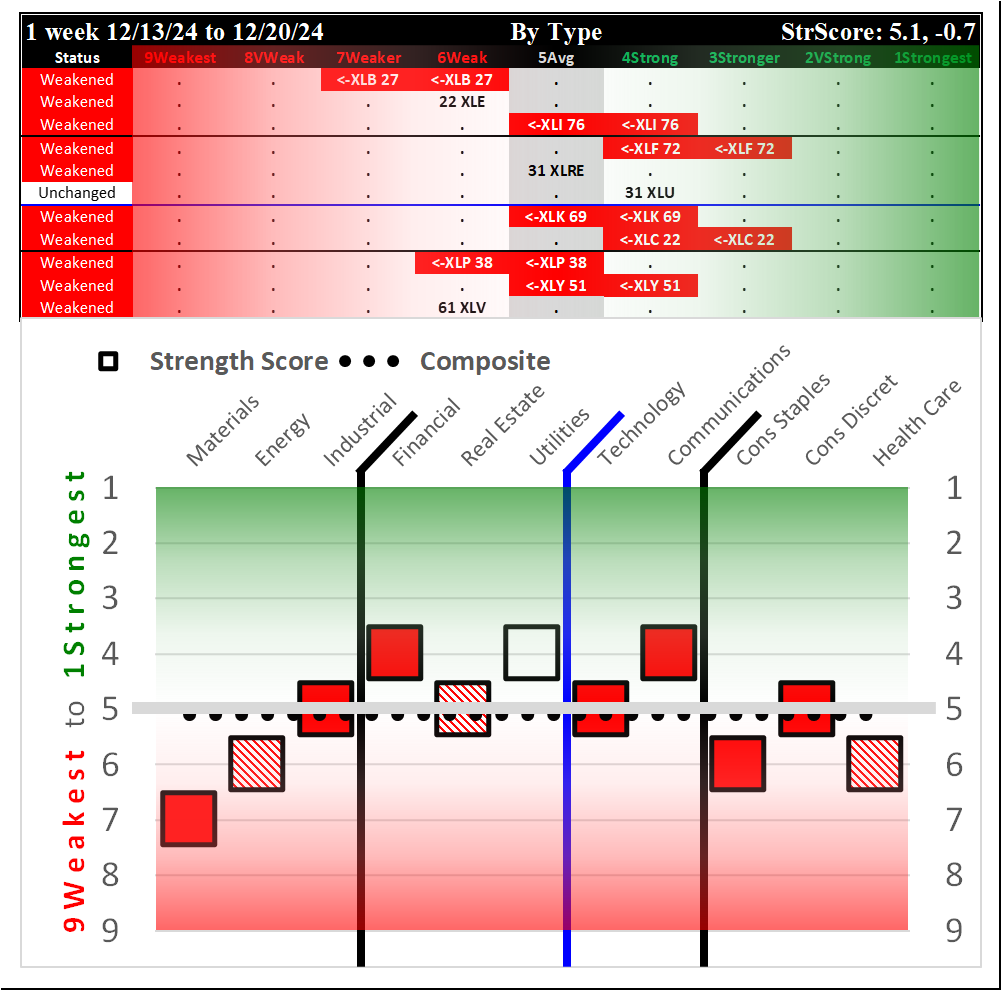
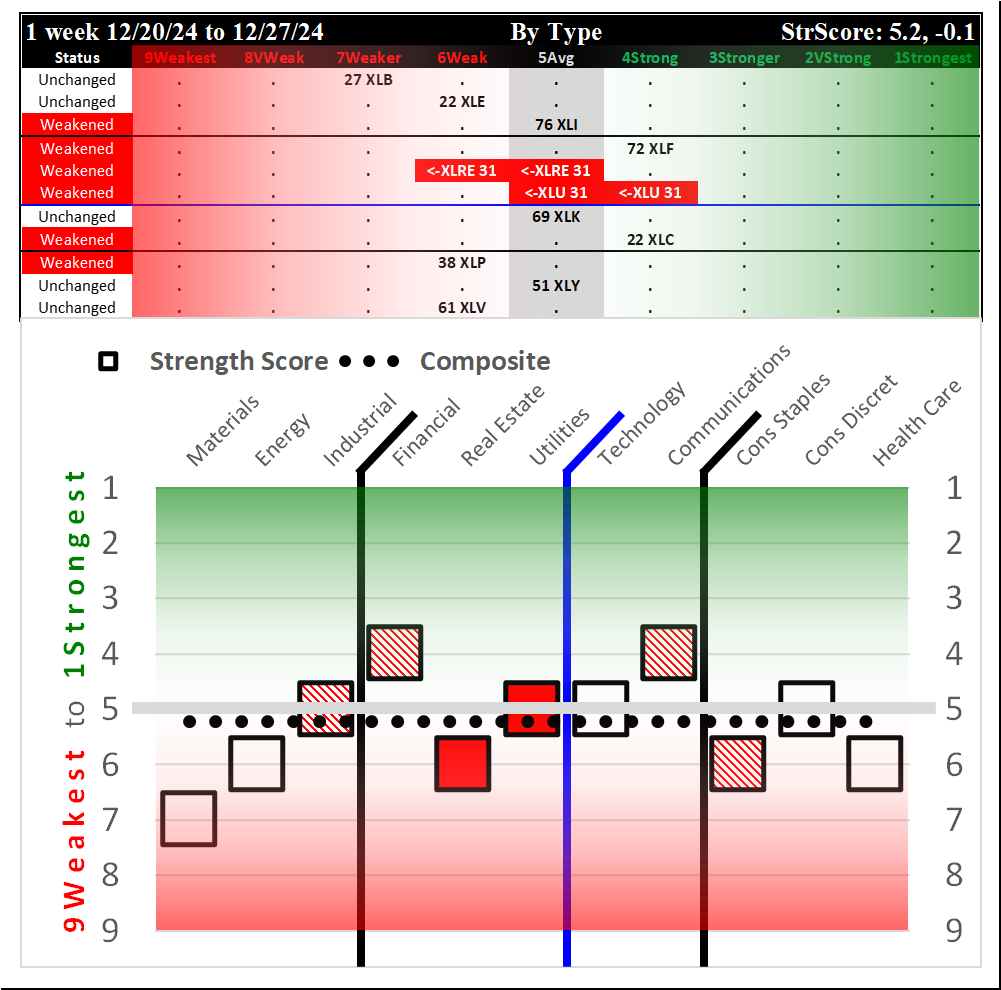
The market finally stemmed the weakening tide this week after multiple weakening weeks.
Current Status: 5.2 Composite Score, Unchanged this week
The following spectrum graph "Strongest to Weakest" shows the composition of the ETF ratings that comprise the current composite score, in order of Strength Rating. This is followed by an Alphabetical spectrum graph.
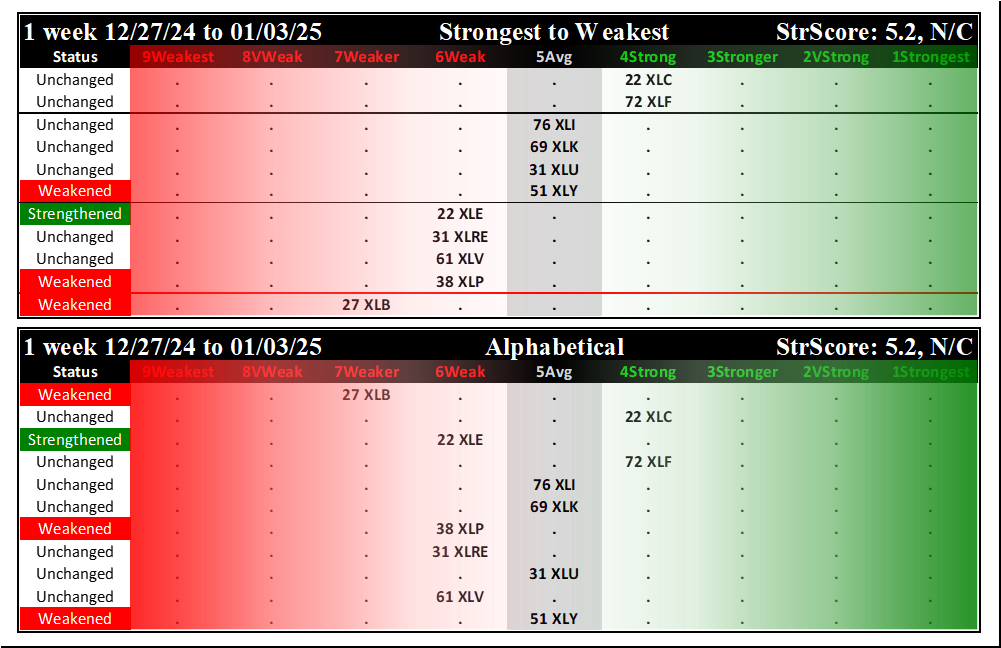
The upper spectrum graph shows the ETFs in decreasing order of Strength Rating and strengthening for the week while the lower spectrum graph is alphabetical. In the upper graphic, sectors with the same rating are listed as follows: first, sectors that strengthened rating during the week; second, sectors with ratings that did not change during the week but did strengthen; third, sectors with ratings that did not change during the week but did weaken; and fourth, sectors which weakened rating during the week. The color-coded lines delineate different ratings - 4Strong or stronger are separated by green lines, 6Weak or weaker are separated by red lines, and 5Average is separated by black lines.
The ETFs are listed below based on their strength rating.
1Strongest
None
2VeryStrong
None
3Stronger
None
4Strong
- XLC/Communication (Unchanged)
- XLF/Financial (Unchanged)
5Average
- XLI/Industrial (Unchanged)
- XLK/Technology (Unchanged)
- XLU/Utilities (Unchanged)
- XLY/Consumer Discretionary (Weakened)
5.2 - Composite Score
6Weak
- XLE/Energy (Strengthened)
- XLP/Consumer Staples (Weakened)
- XLV/Health Care (Unchanged)
- XLRE/Real Estate (Unchanged)
7Weaker
- XLB/Materials (Weakened)
8VeryWeak
None
9Weakest
None
IV. Today's Market Context
Key Headlines
"Mike Johnson elected House speaker, easing concerns over delays to market-friendly bills"
"U.S. stocks close higher Friday but S&P 500 still down for the week"
"Ford, Rivian stocks get boost from sales after rival Tesla’s numbers fall short"
"Here are the reasons not to worry too much about short-seller report on Carvana, according to these analysts"
"What stocks’ worst year-end stumble since 1952 may mean for 2025"
(Marketwatch)
"S&P 500, Nasdaq snap five-day losing streak, but still close lower on the week"
"Trump sentencing set for Jan. 10, judge leans toward no jail, no probation"
"GM, Ford report best annual U.S. sales since 2019"
"Man who died in Cybertruck explosion outside Las Vegas Trump hotel ID’d as Army special ops soldier"
(CNBC)
"Oil Extends Rally as Bullish Momentum Overpowers China Woes"
"Stocks jump as Nvidia, Tesla lead spark to end losing week"
"Fannie Mae, Freddie Mac shares surge on privatization plans"
"Beer, alcohol stocks face bigger challenges on reported cancer risk"
(Yahoo!)
Key Current Readings
SP500: 5,942.47
Nasdaq: 19,621.68
Nasdaq 100: 21,326.16
Russell 2000: 2,268.47
10Y Treasury: 4.598%
2YT: 4.281%
Oil (WTI Crude): $74.02
Bitcoin: $98,221
Dollar Index: 108.92
Gold: $2,651.2
VIX: 16.13
(CNBC)
V. Detailed Sector ETF Analysis
The following Stock Market Organizer strengthening/weakening analysis looks at the 11 SPDR ETFs and their underlying component stocks for the just-completed week, as follows:
- ETFs Summaries
1.1 Current: Component Stocks Strength Ratings (1Strongest vs. 9Weakest vs. Ignore Status)
1.2 Current: Component Stocks Positive vs. Negative Weekly Returns
1.3 Historical: 10 Week Ratings by ETF
1.4 Historical: 10 Week Ratings by Week - ETFs Detail
2.1 XLB Materials
2.2 XLC Communications
2.3 XLE Energy
2.4 XLF Financial
2.5 XLI Industrial
2.6 XLK Technology
2.7 XLP Consumer Staples
2.8 XLRE Real Estate
2.9 XLU Utilities
2.10 XLV Health Care
2.11 XLY Consumer Discretionary - Stock Detail (downloads)
1. ETFs Summaries
1.1 Current: Component Stocks Strength Ratings (1Strongest vs. 9Weakest vs. Ignore Status)
The following graphs reflect the composition of each of the ETFs based on their underlying component stock strength ratings which range from 1Strongest to 9Weakest. I only care about the strongest and weakest in each sector and thus categorize as "Ignore" stocks rated from 2VeryStrong through 8VeryWeak.
- Top row: XLB/Basic Materials, XLE/Energy, and XLI/Industrial
- Second row: interest rate-sensitive ETFs XLF/Financial, XLRE/Real Estate, and XLU/Utilities
- Third row: XLK/Technology and XLC/Communications
- Bottom row: XLP/Consumer Staples, XLY/Consumer Discretionary, and XLV/Health Care
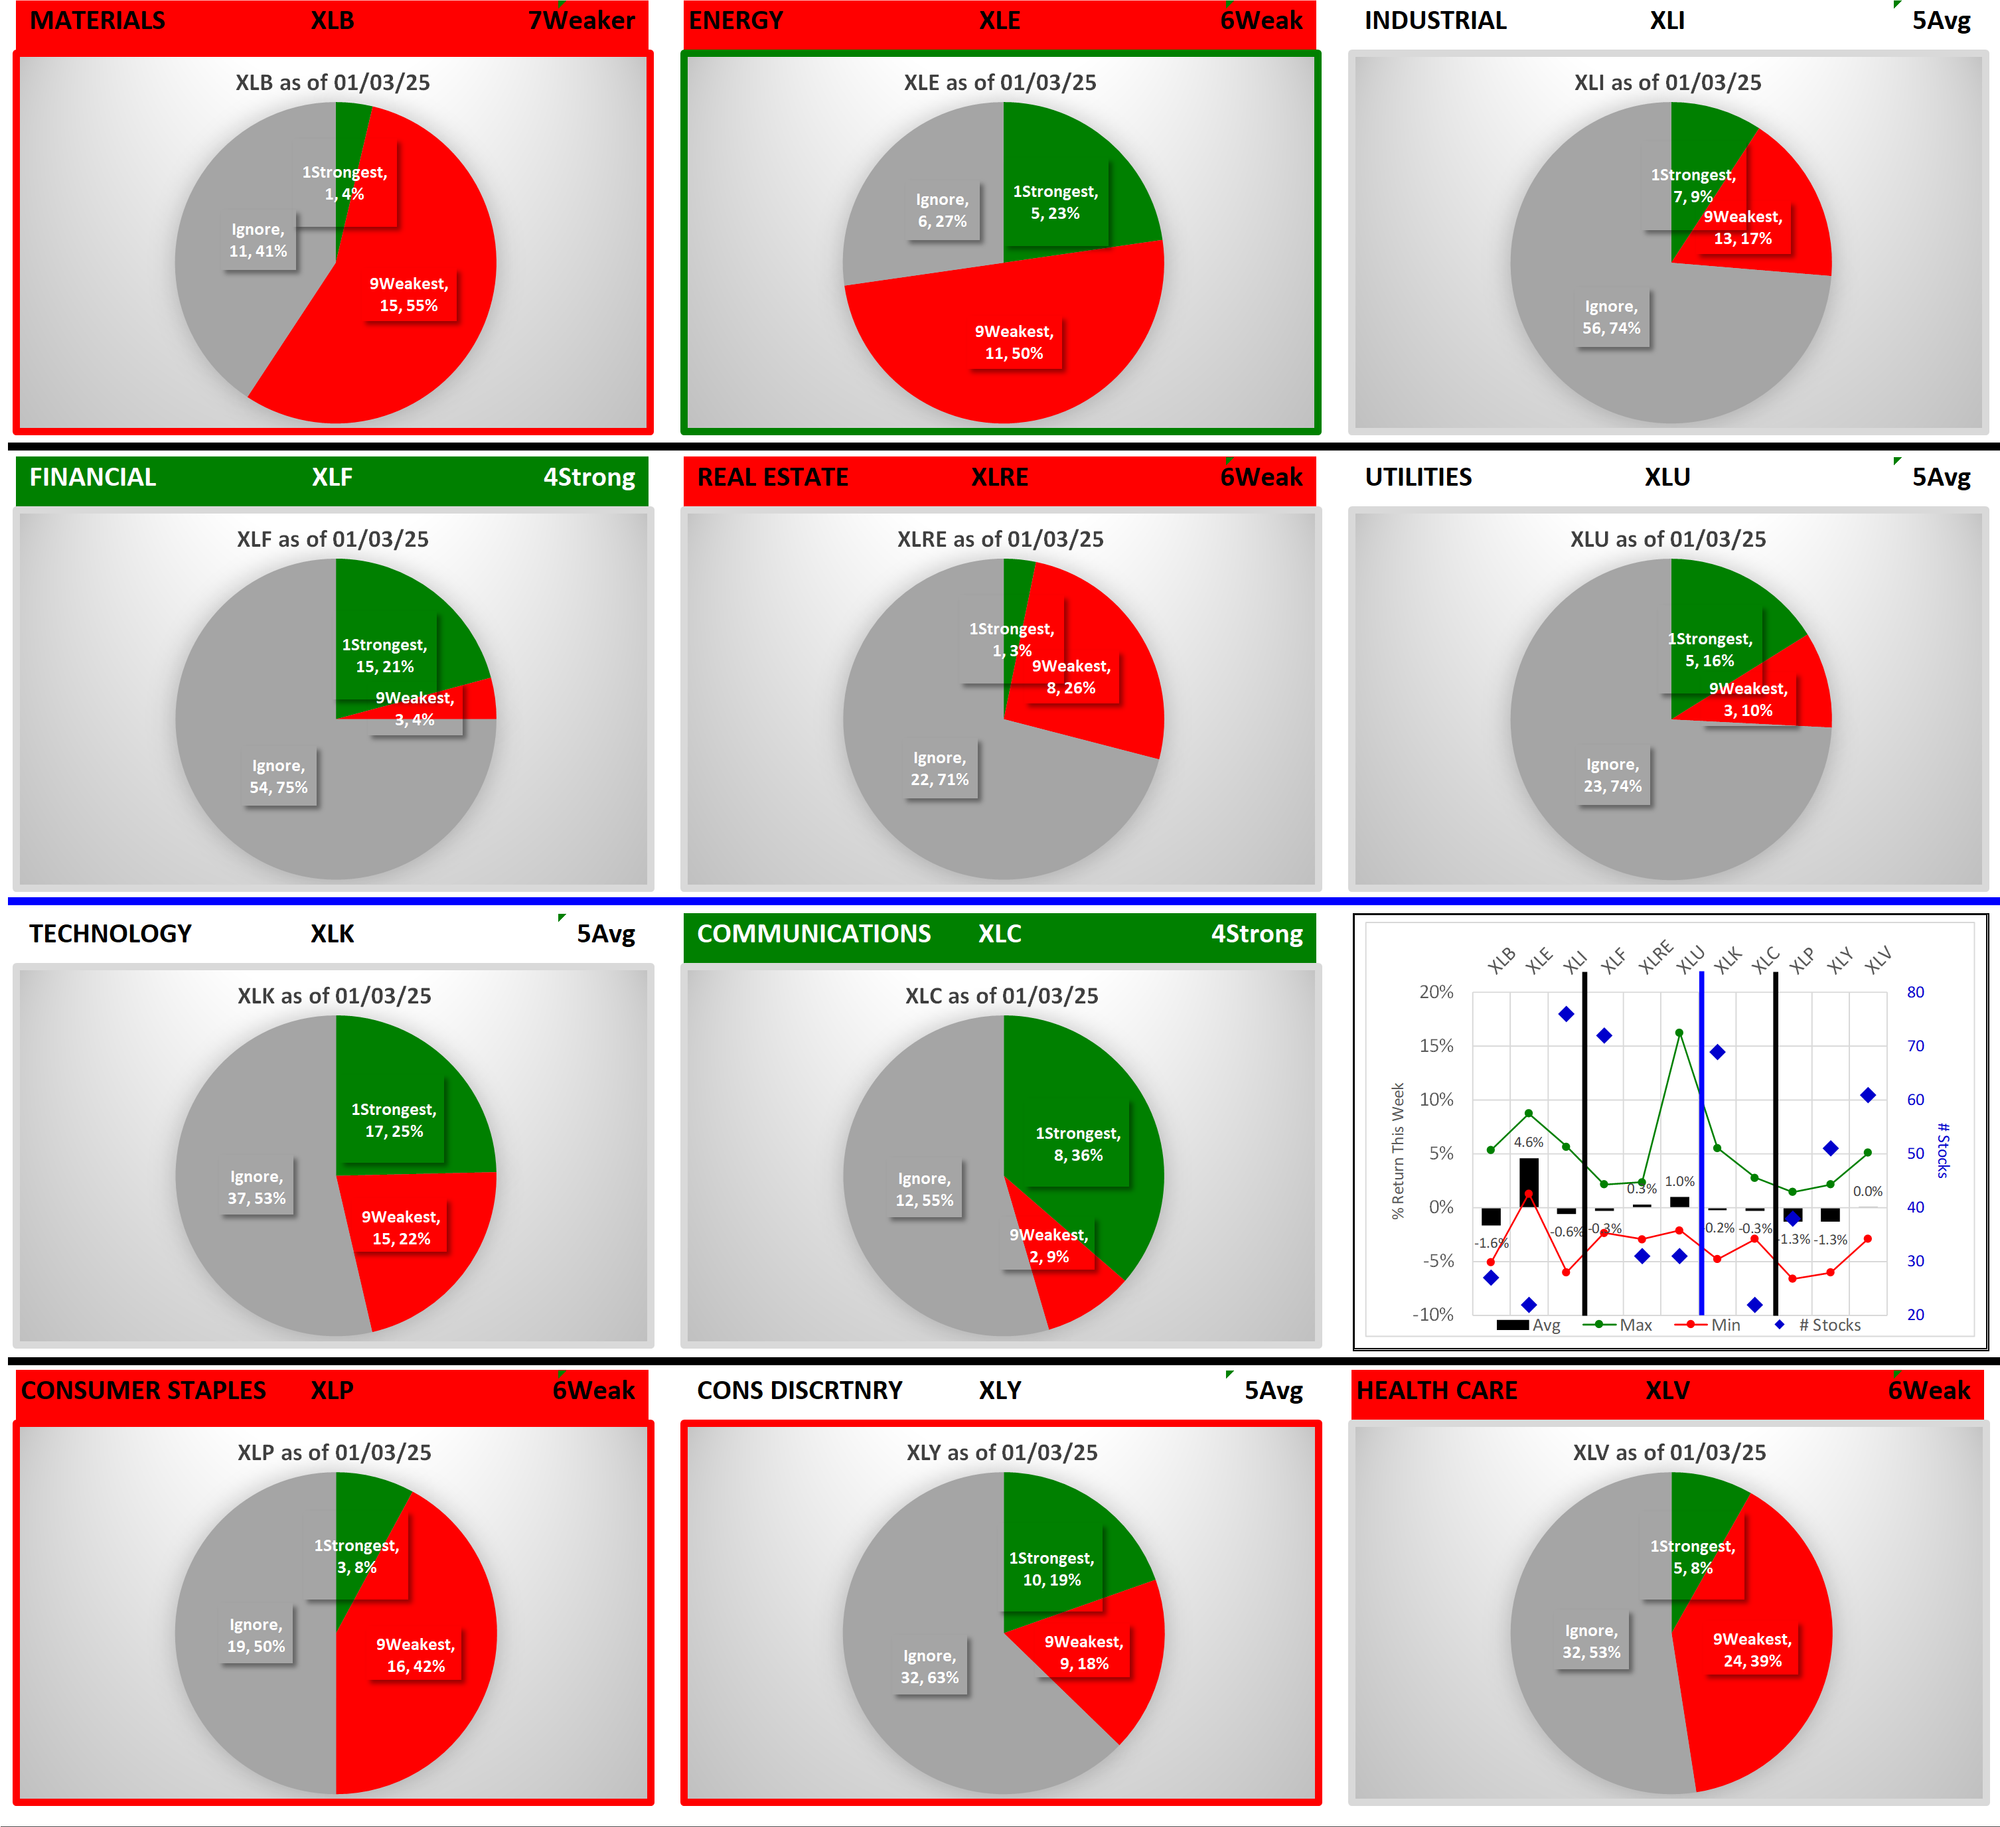
The headers for each graphic are color-coded. ETFs rated 4Strong or better have green headings - currently, two of 11 ETFs qualify. ETFs that changed rating this week have thick green or red borders. ETFs that strengthened or weakened but did not change rating have thin green or red borders.
1.2 Current: Component Stocks Positive vs. Negative Weekly Returns
The following pie charts show the breadth of positive and negative returns for the week for the component stocks of each ETF.
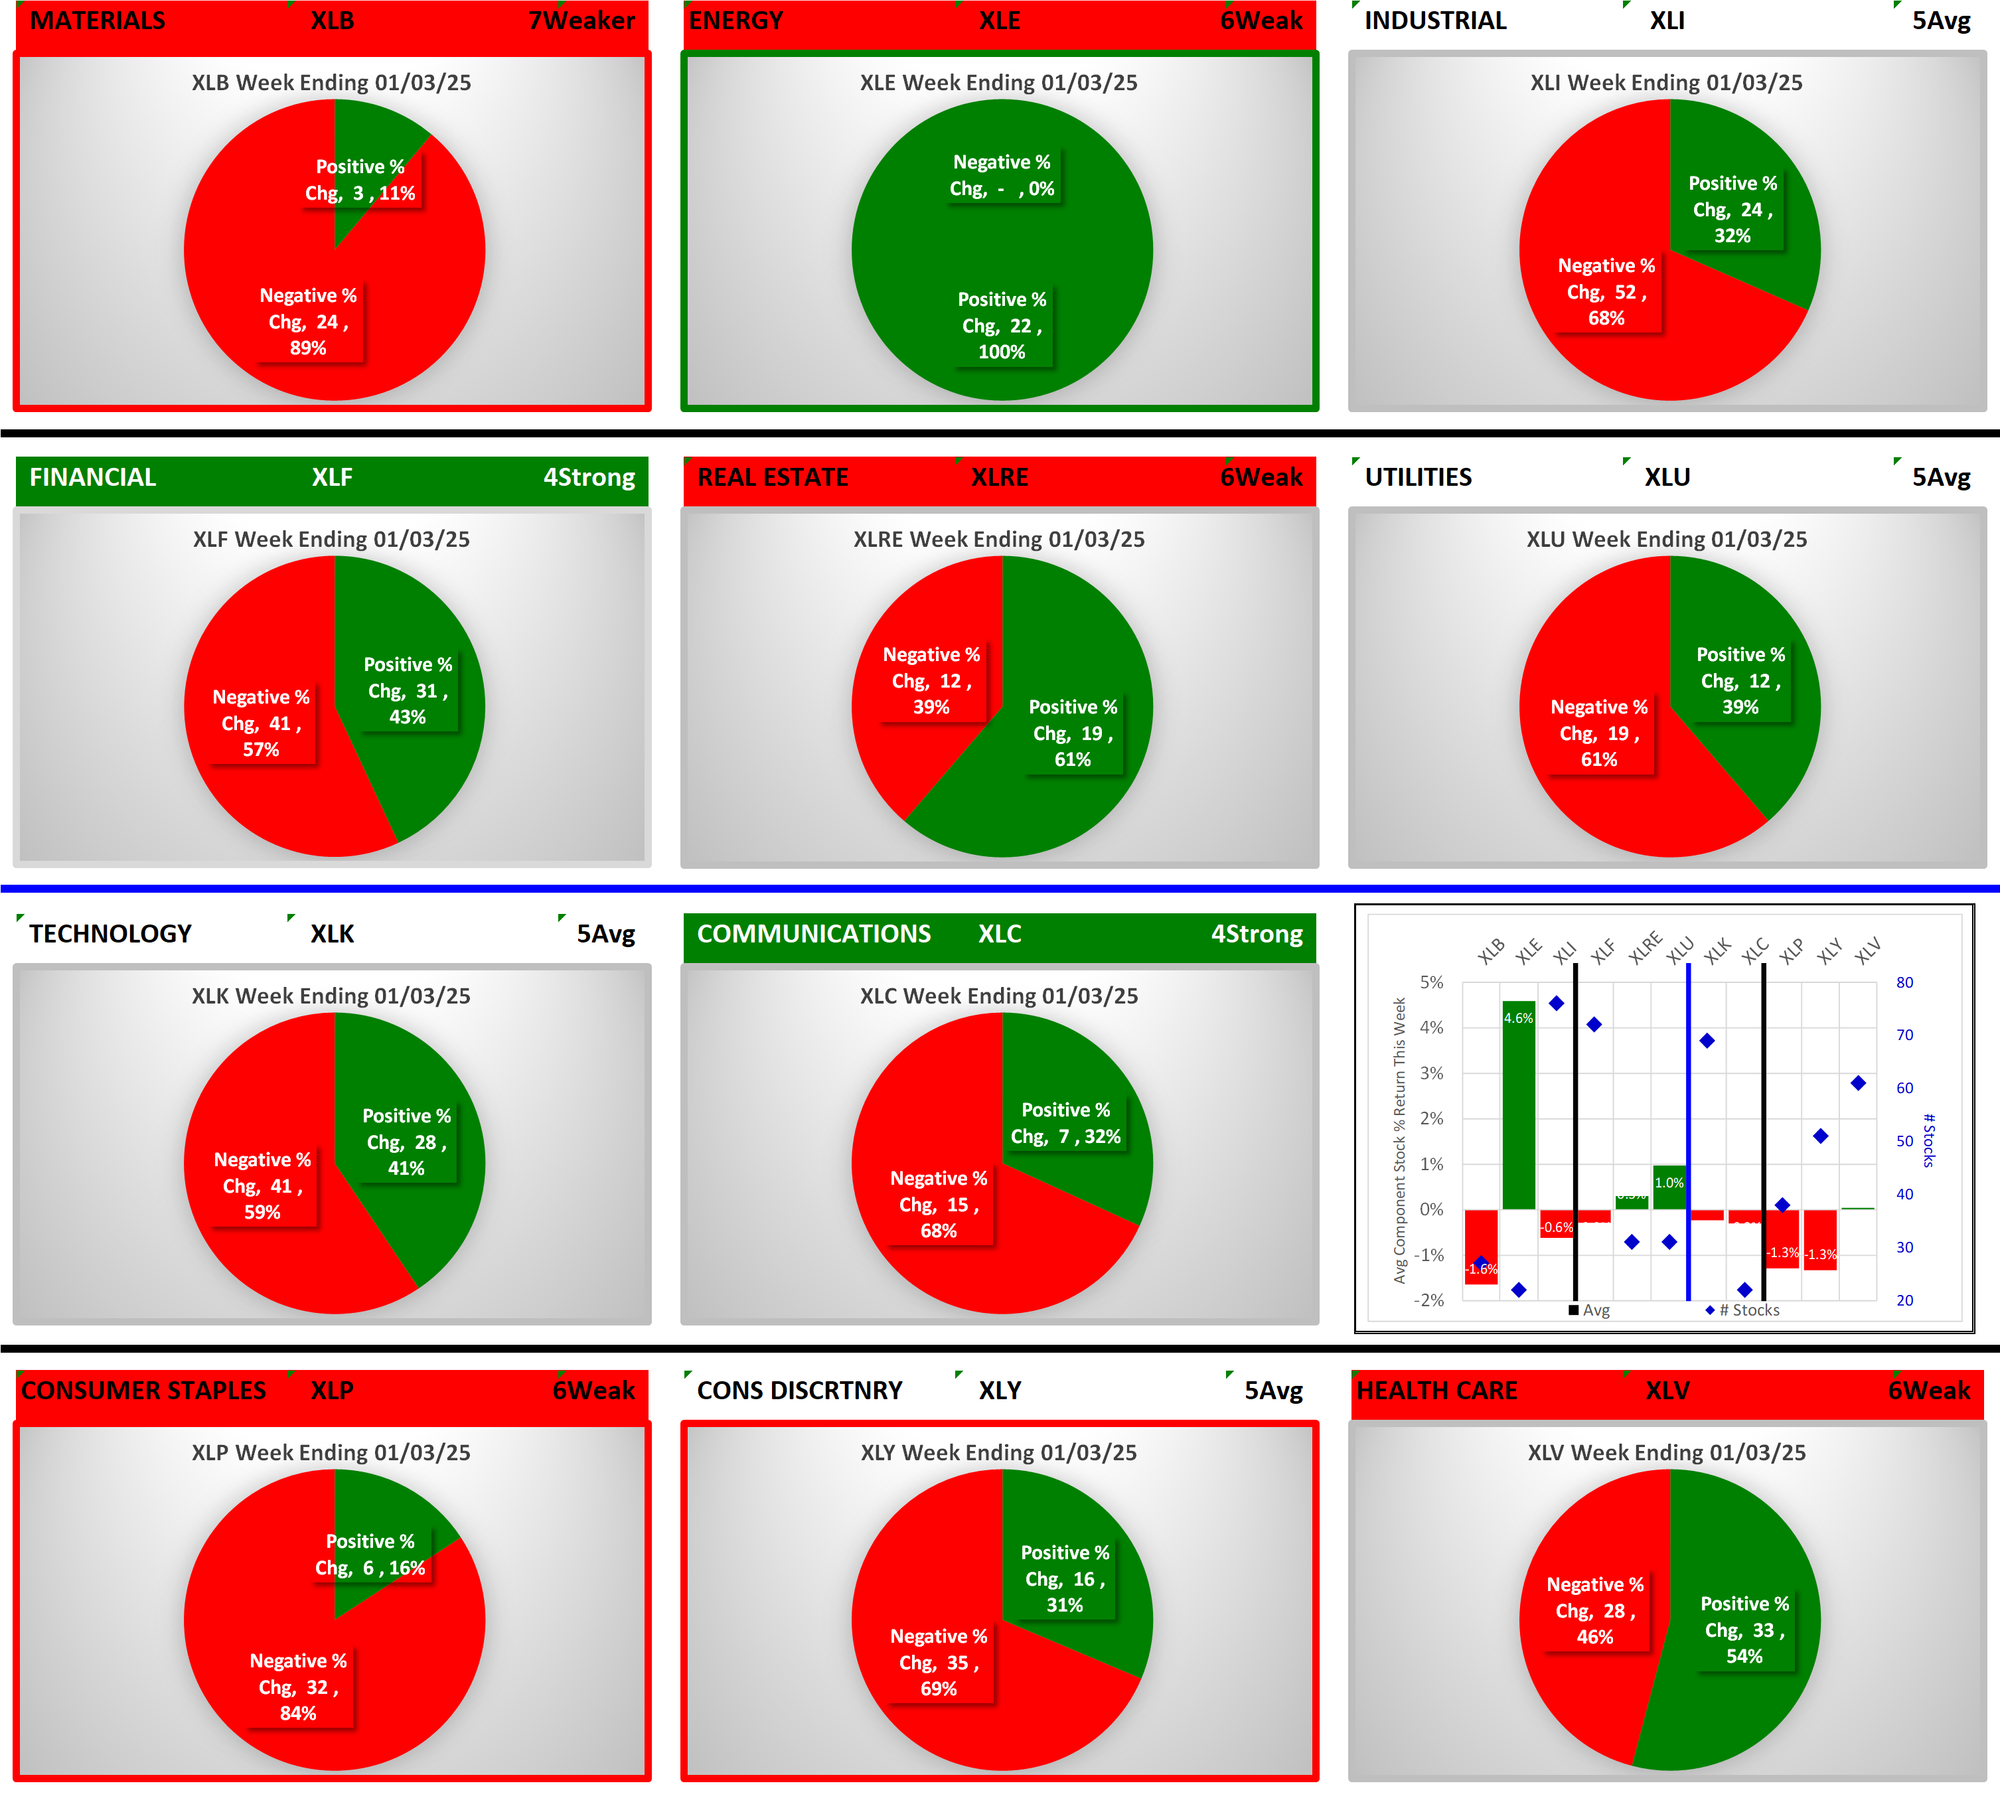
XLE/Energy was the relative strong performer this week with 100% positive stocks and - by far - the highest positive average return at 4.6%.
1.3 Historical: 10 Week Ratings by ETF
Below are 10-week historical strength rating summaries of the ETFs, sorted by ETF - each grouping shows the 10-week ratings change for individual ETFs. This shows the path each ETF has taken over the past 10 weeks to arrive at the current strength rating.
1.4 Historical: 10-Week Ratings by Week
Below are 10-week historical strength rating summaries of the ETFs, sorted by week - each grouping shows one week for all 11 ETFs in newest-to-oldest format. This reveals the weekly strengthening/weakening path of all the ETFs.
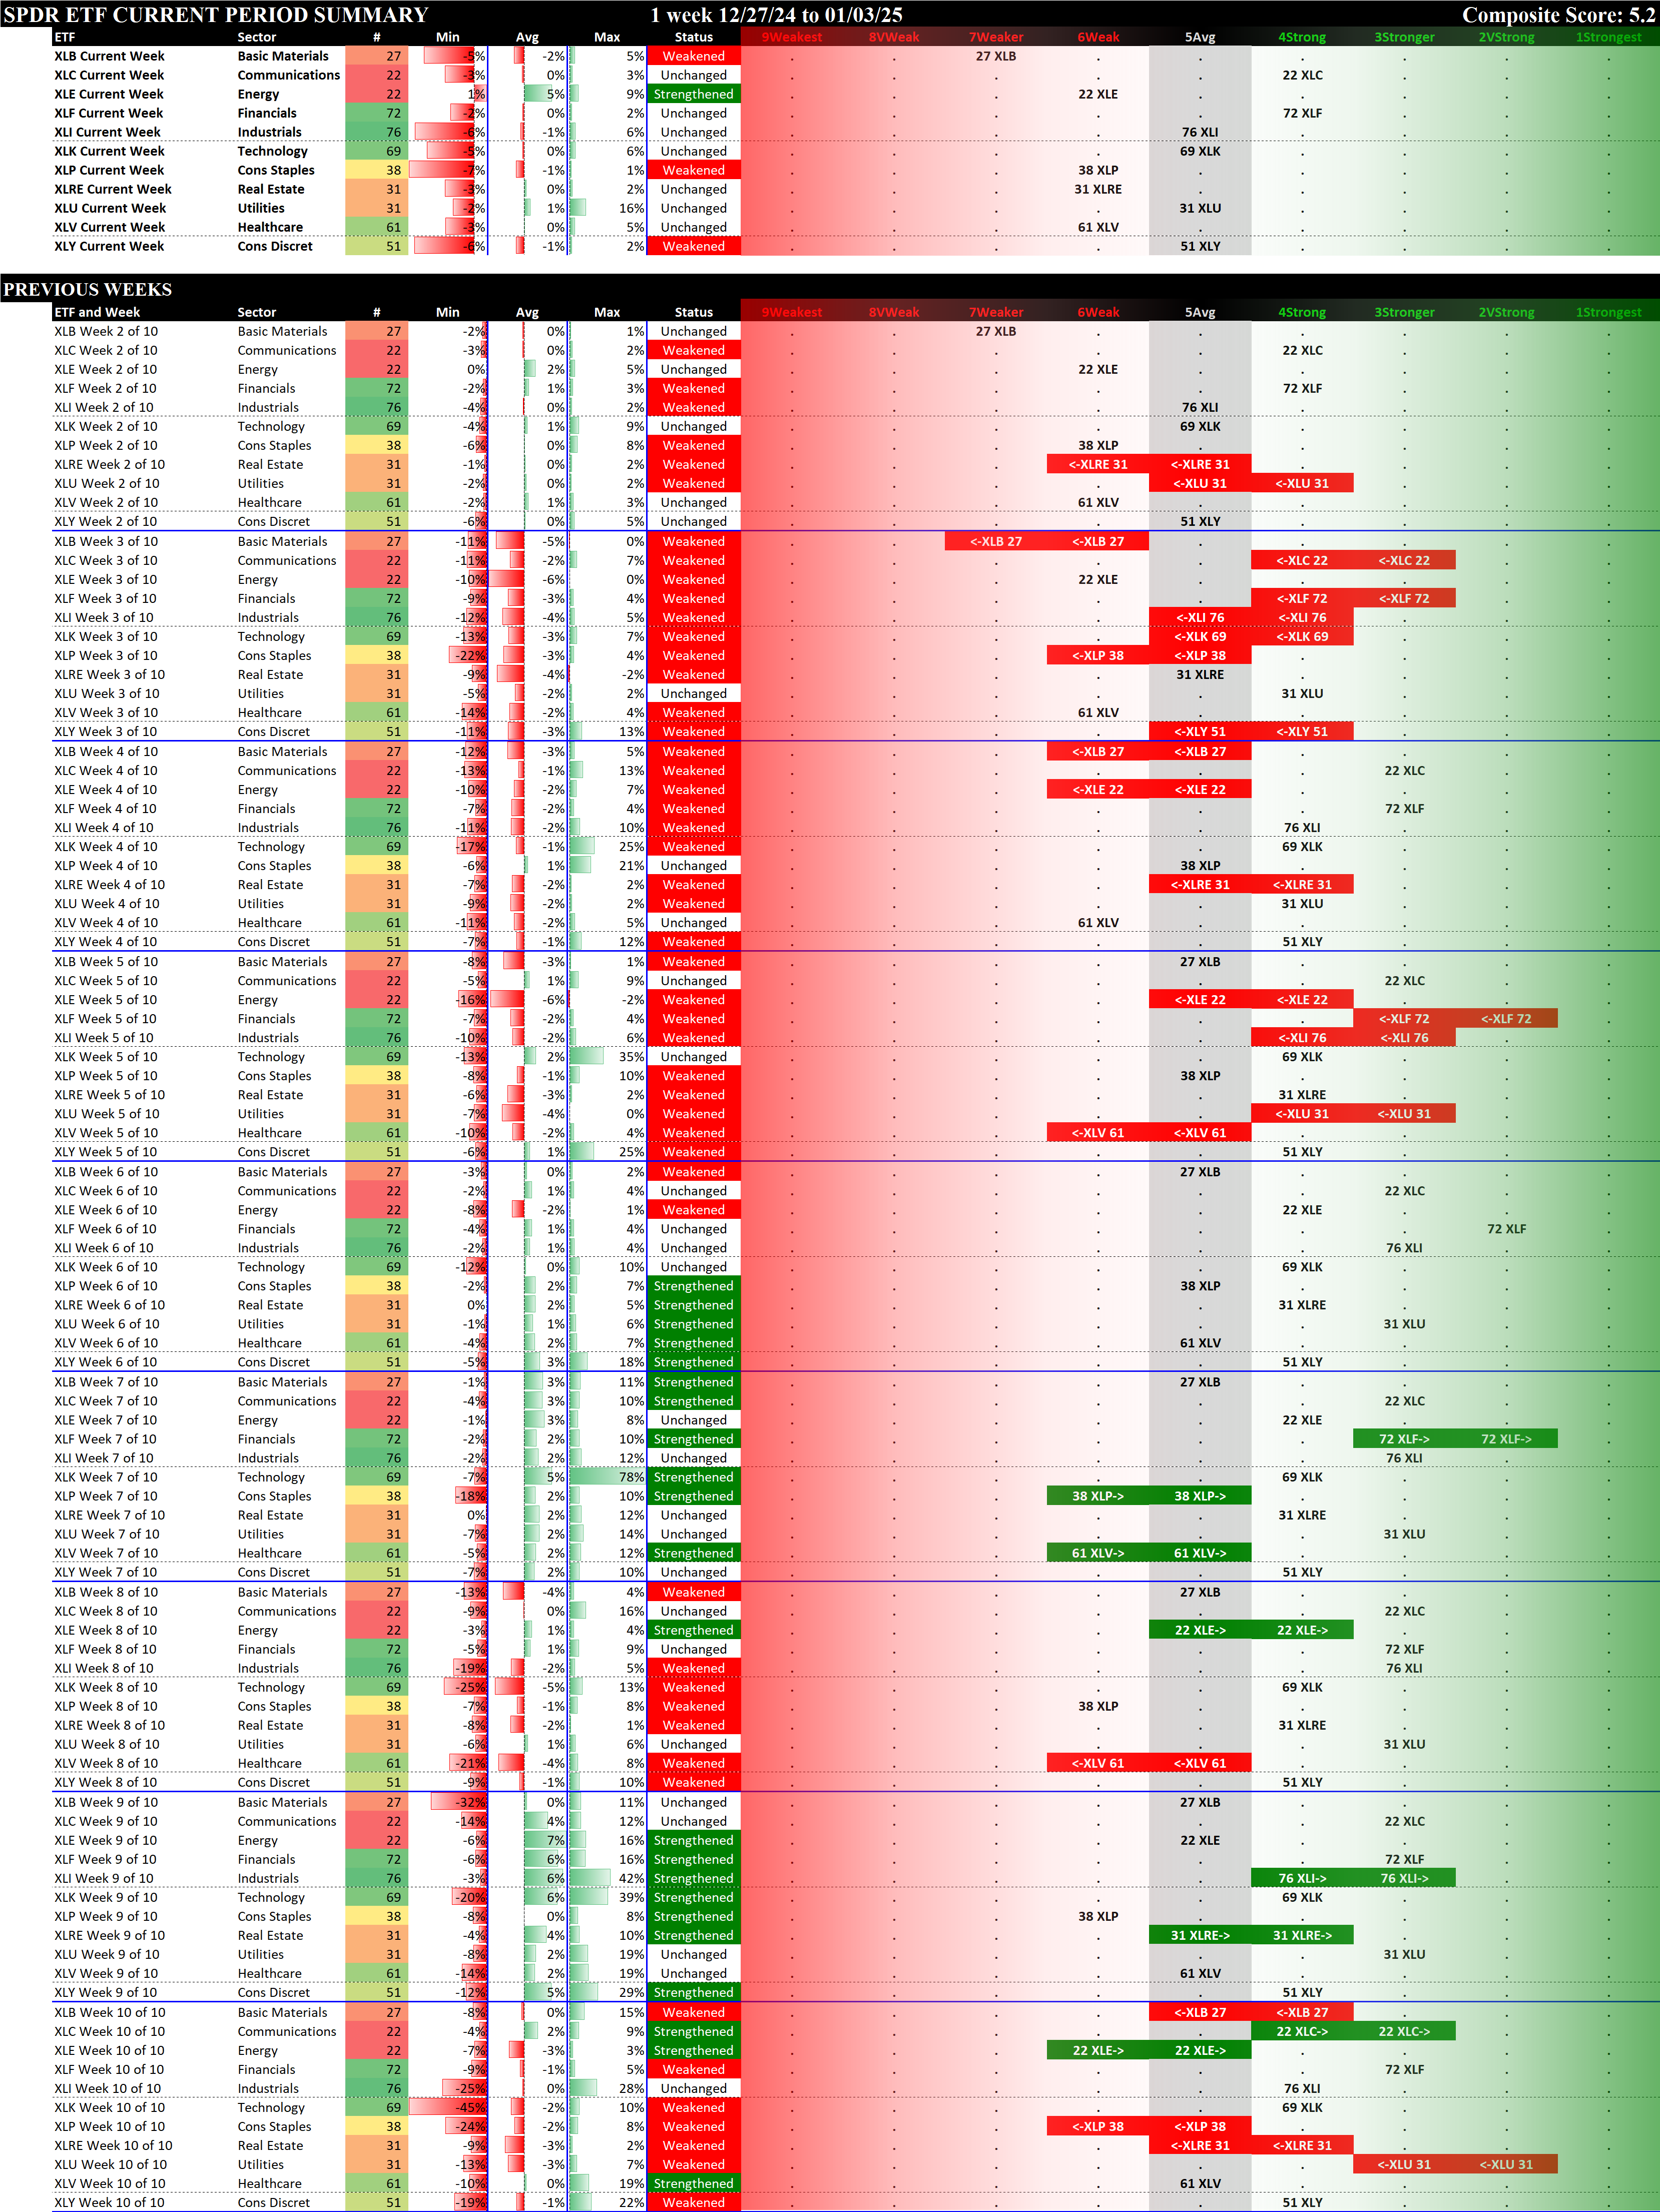
The market weakness is clear going back to week 5. Week 3 was very weak, but the market has been less weak last week and during the current week.
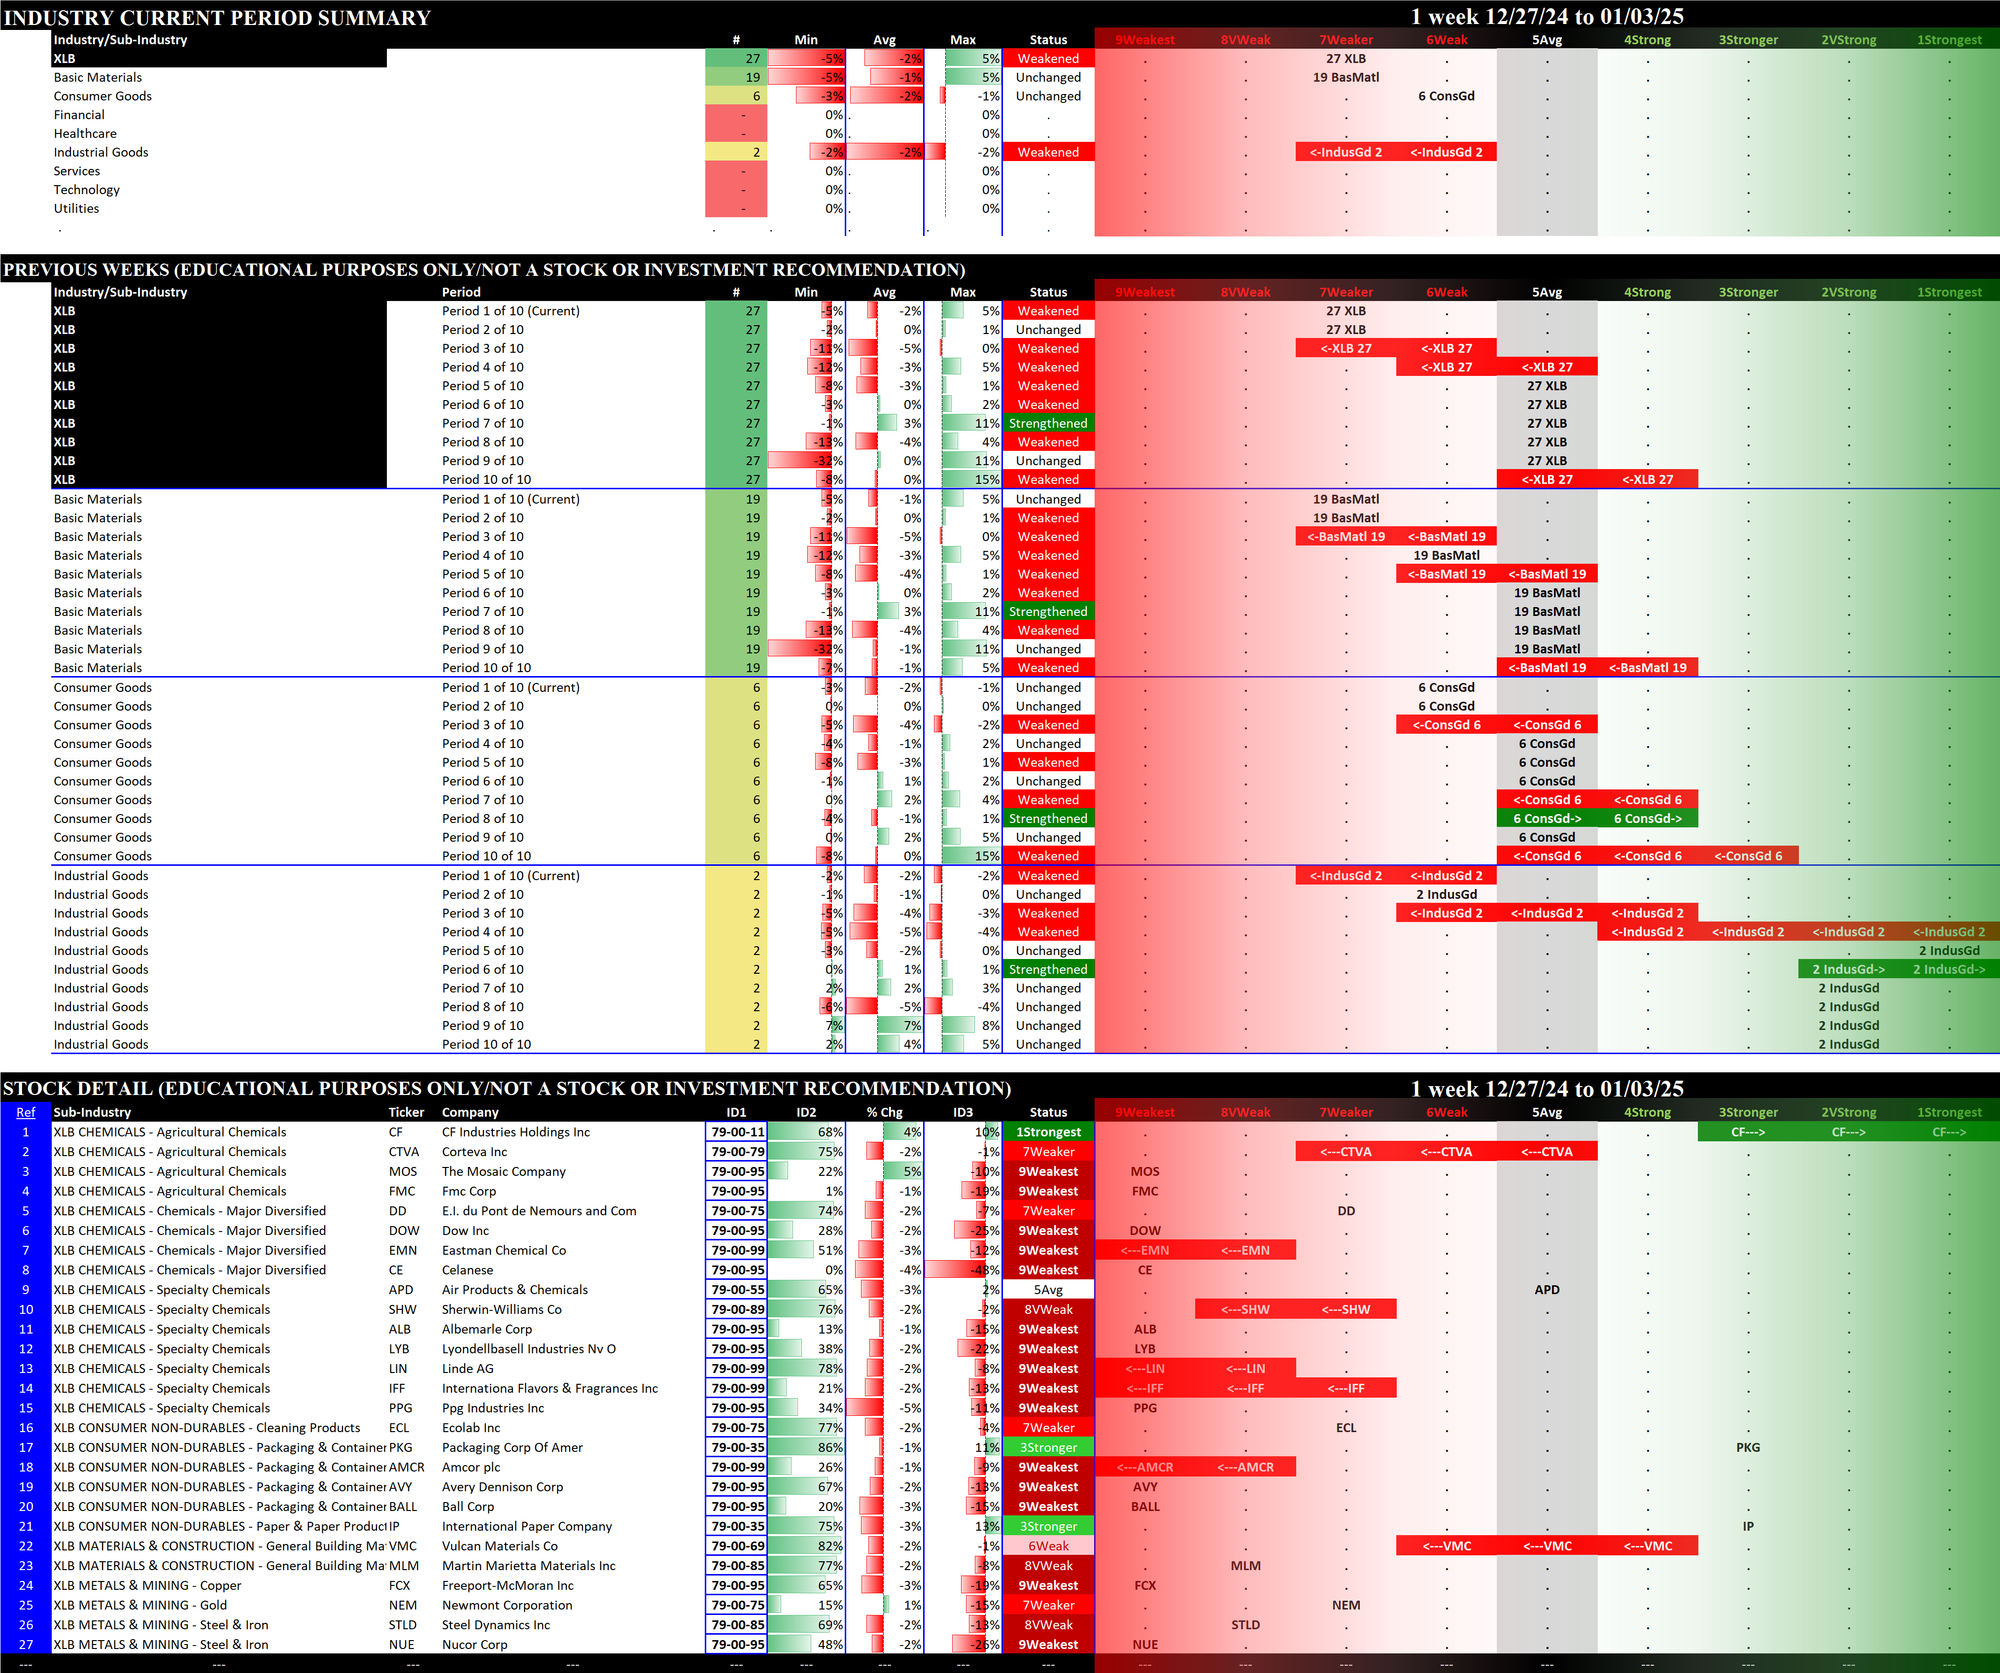
2. ETFs Detail
Details for each of the 11 ETFs are provided below. Comments:
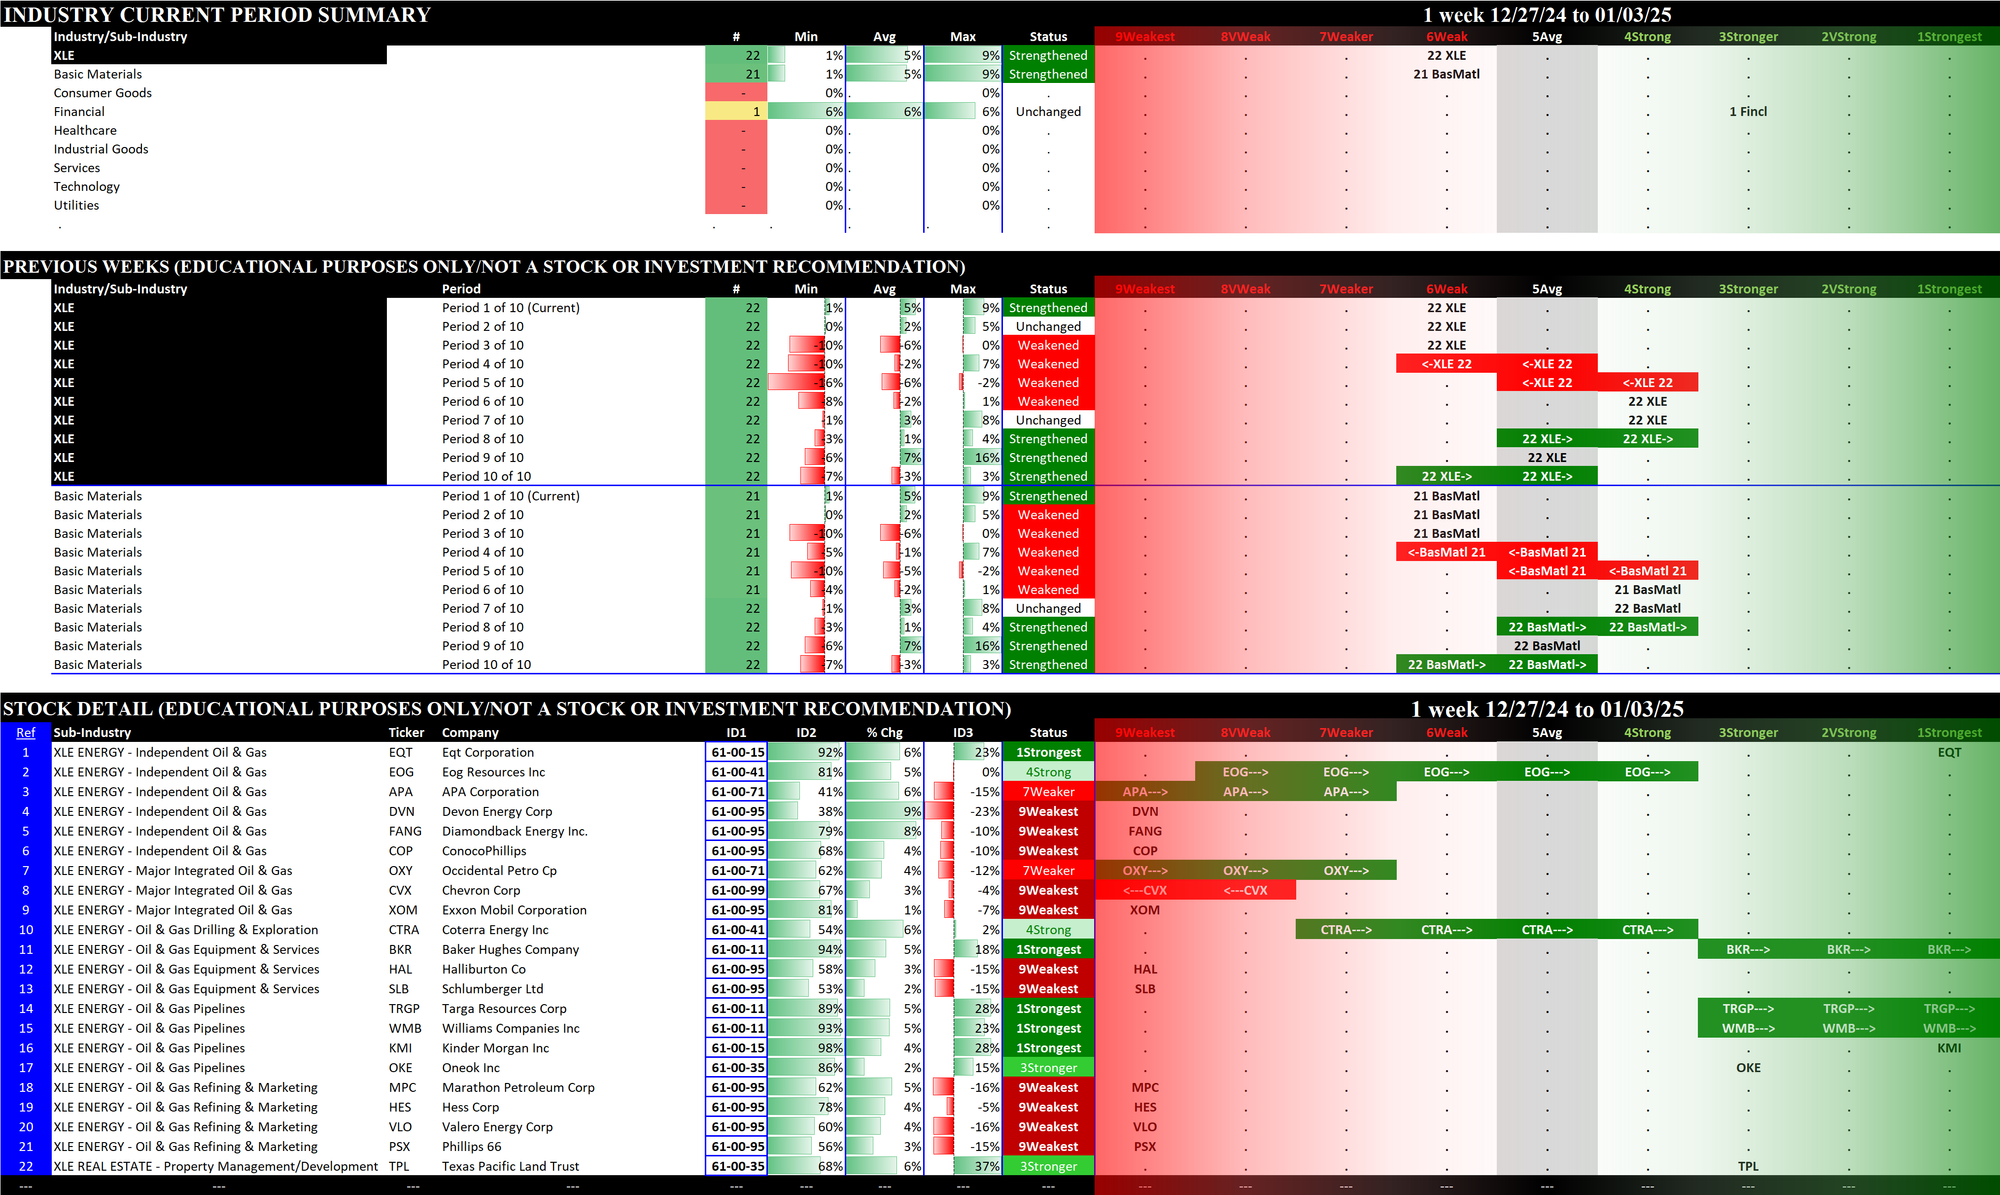
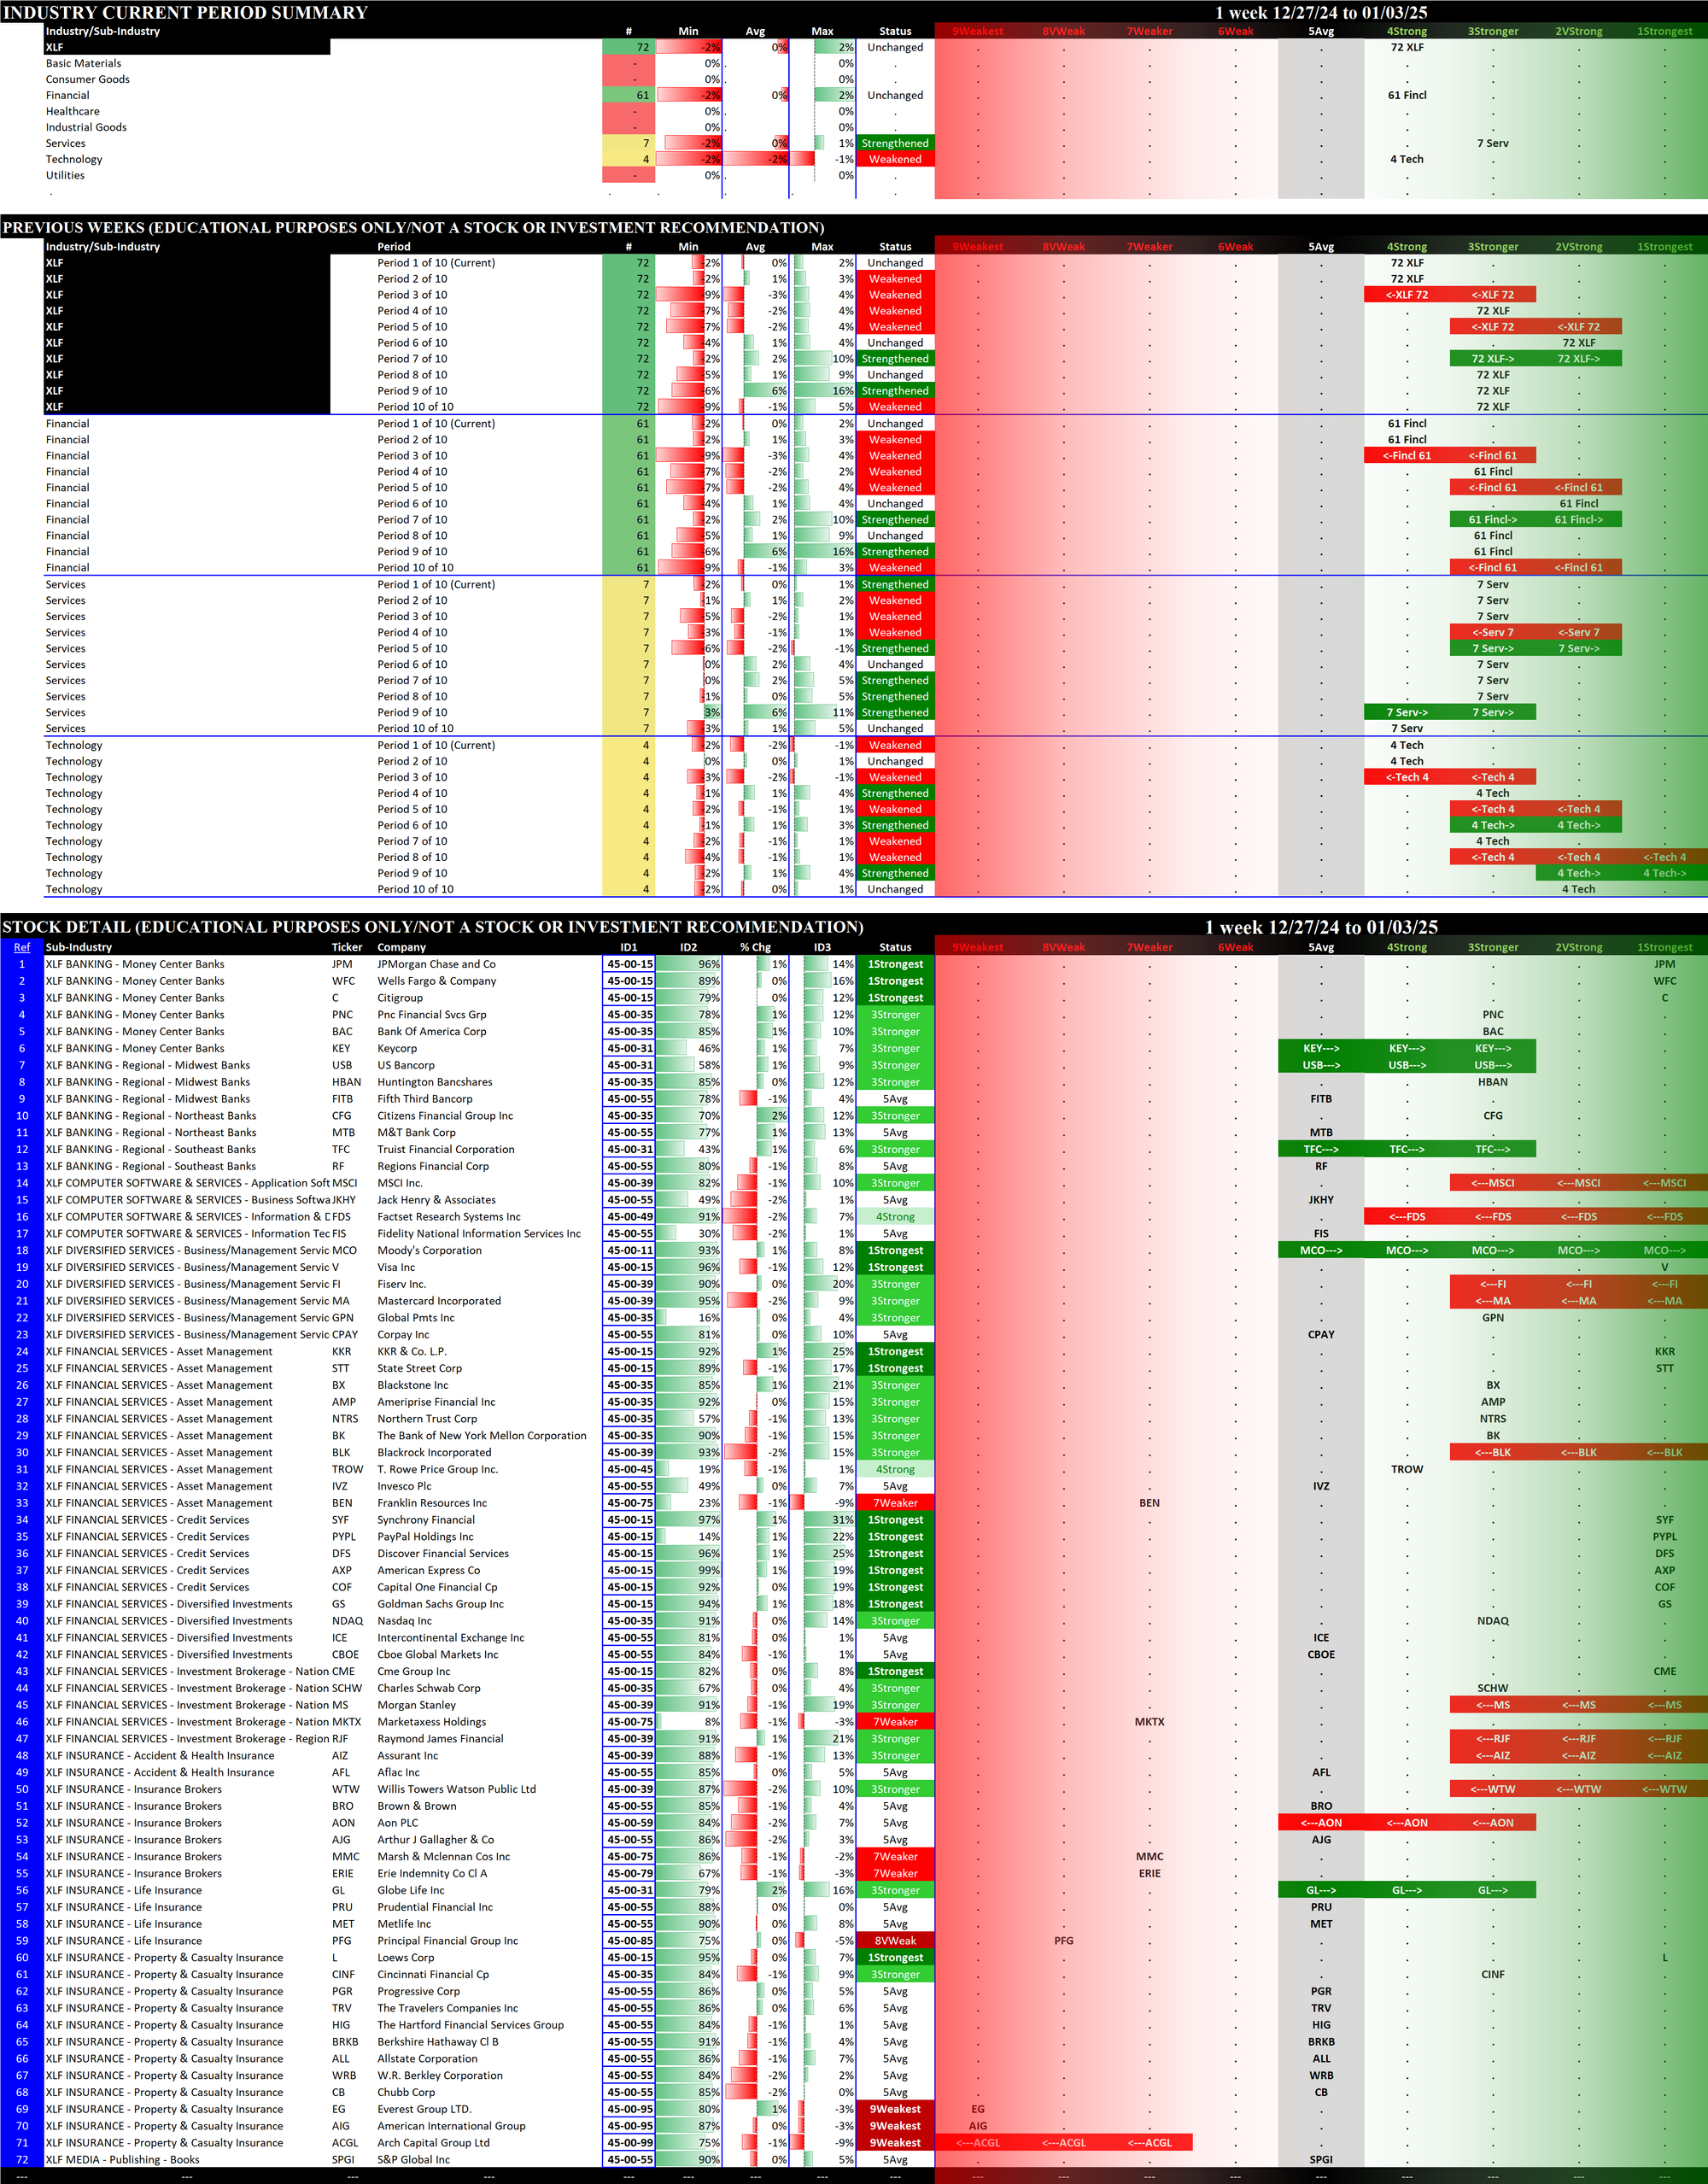
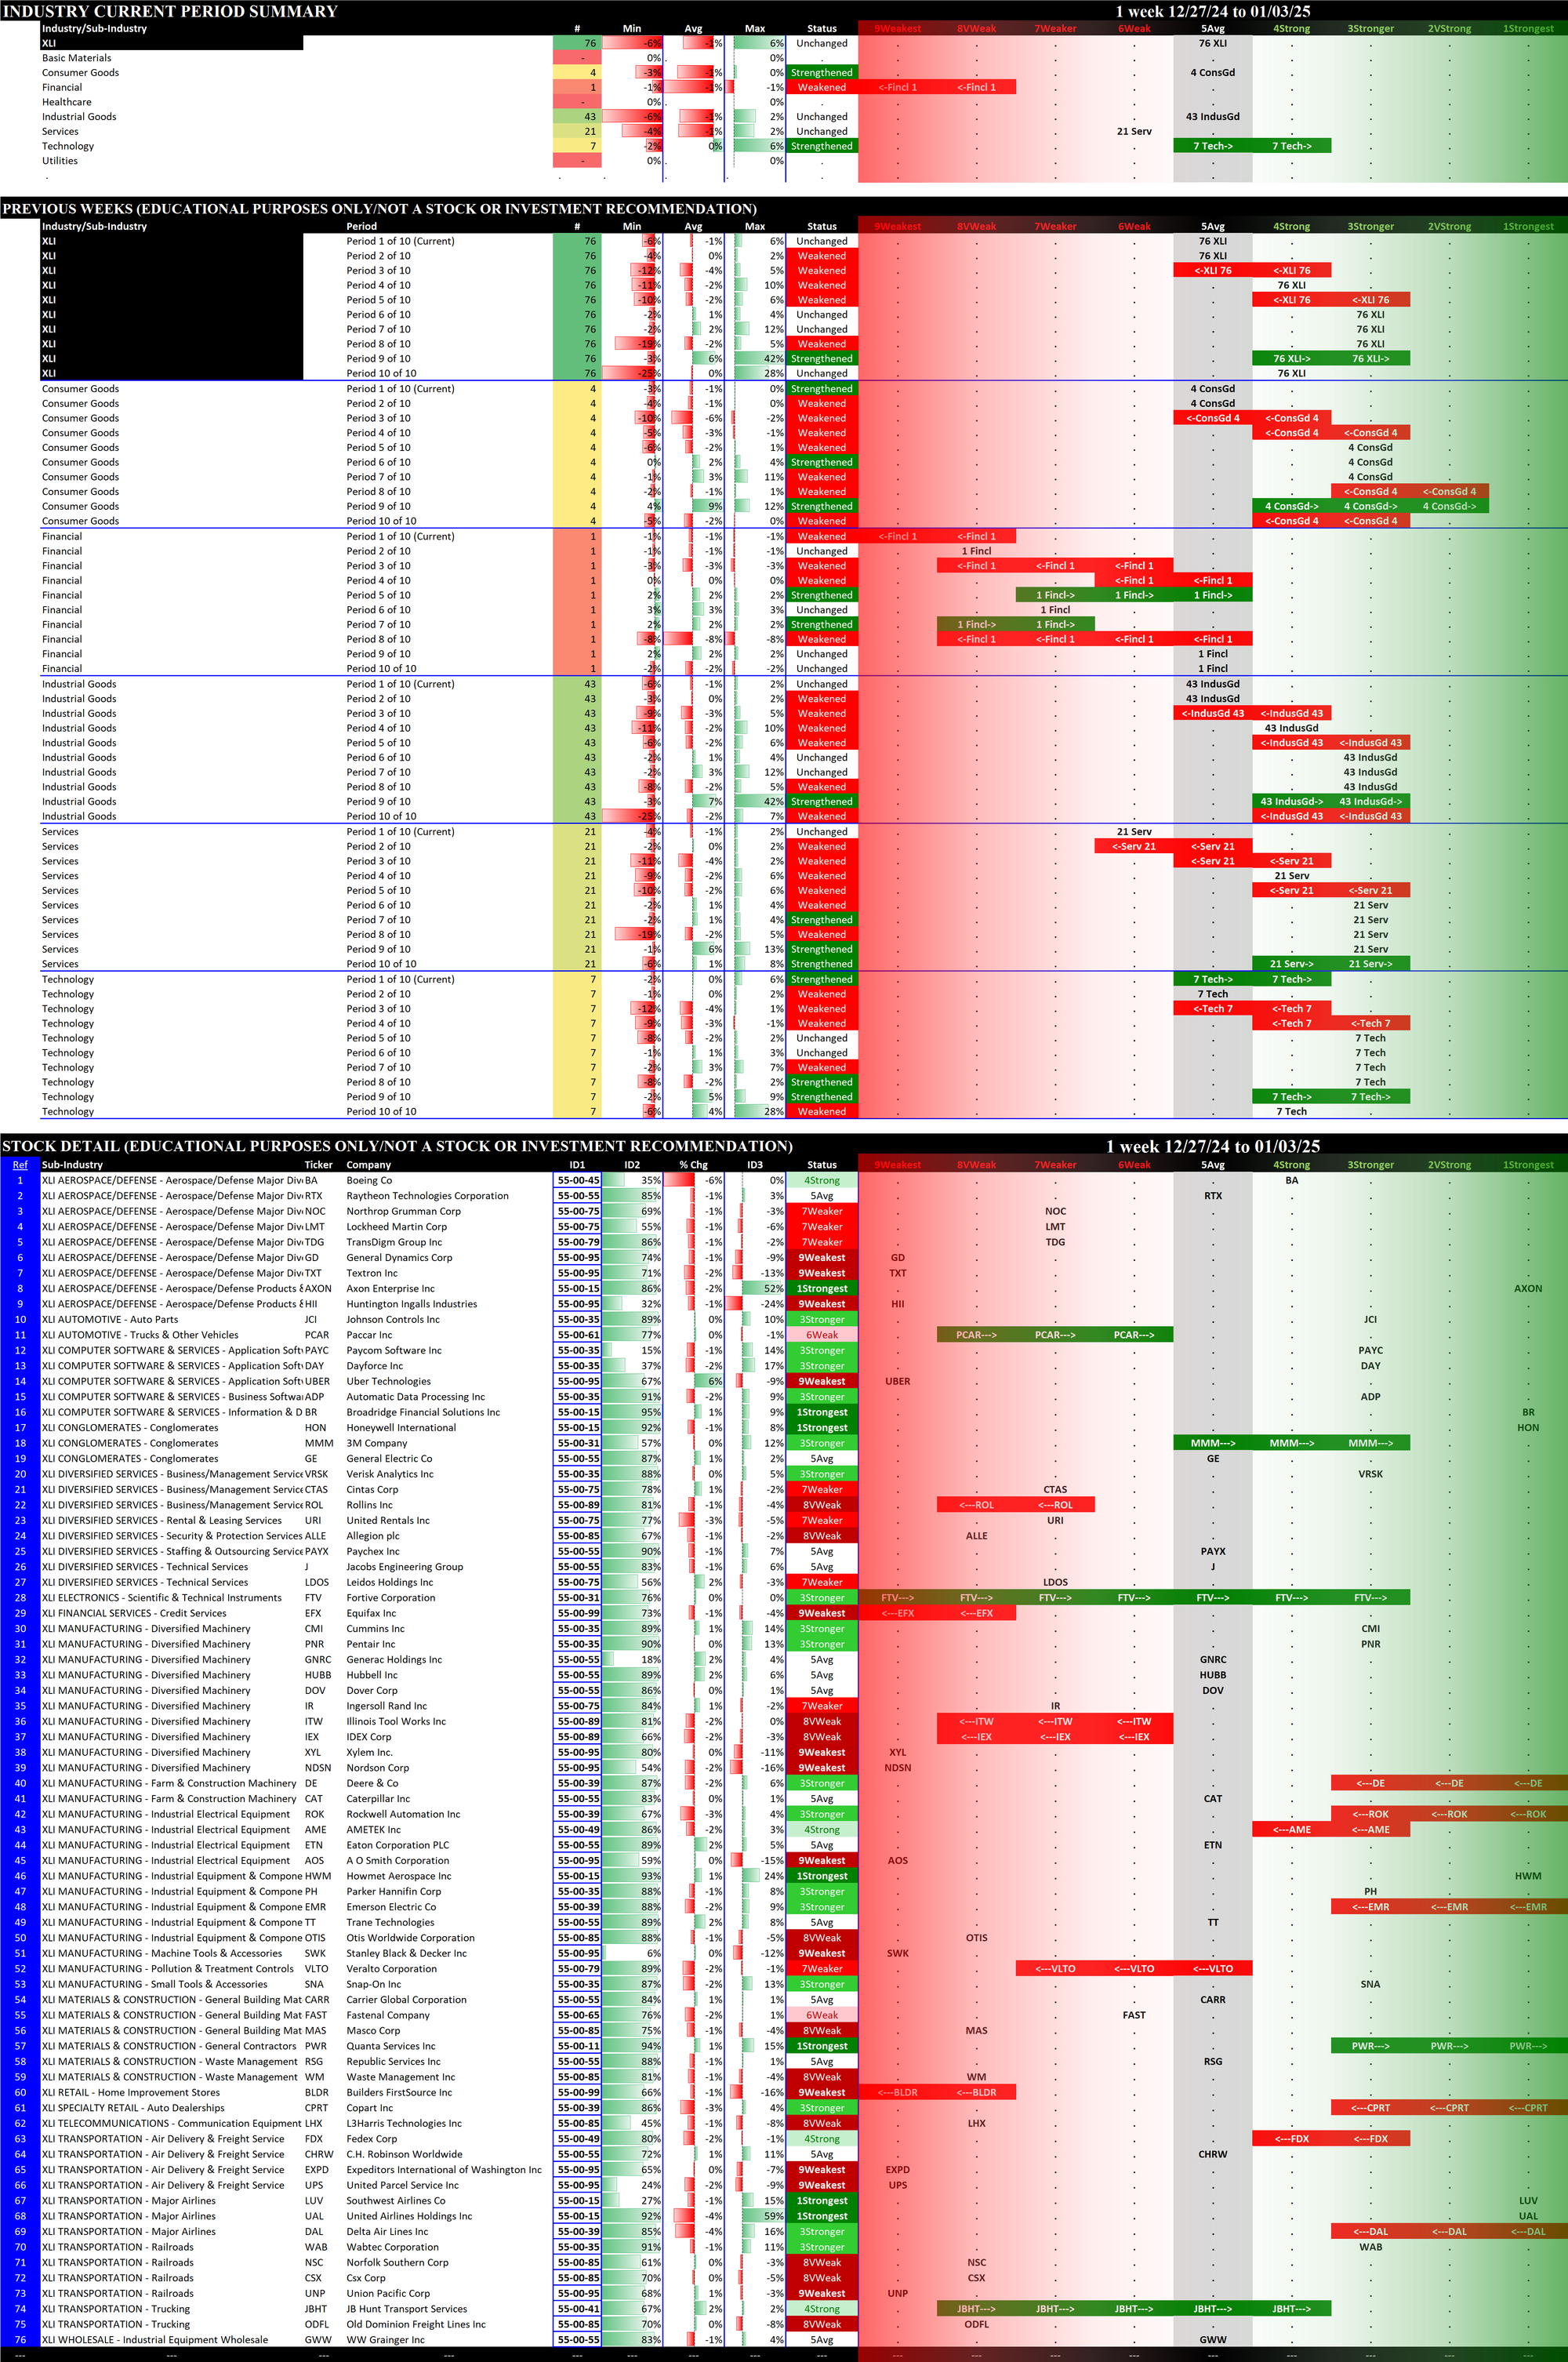
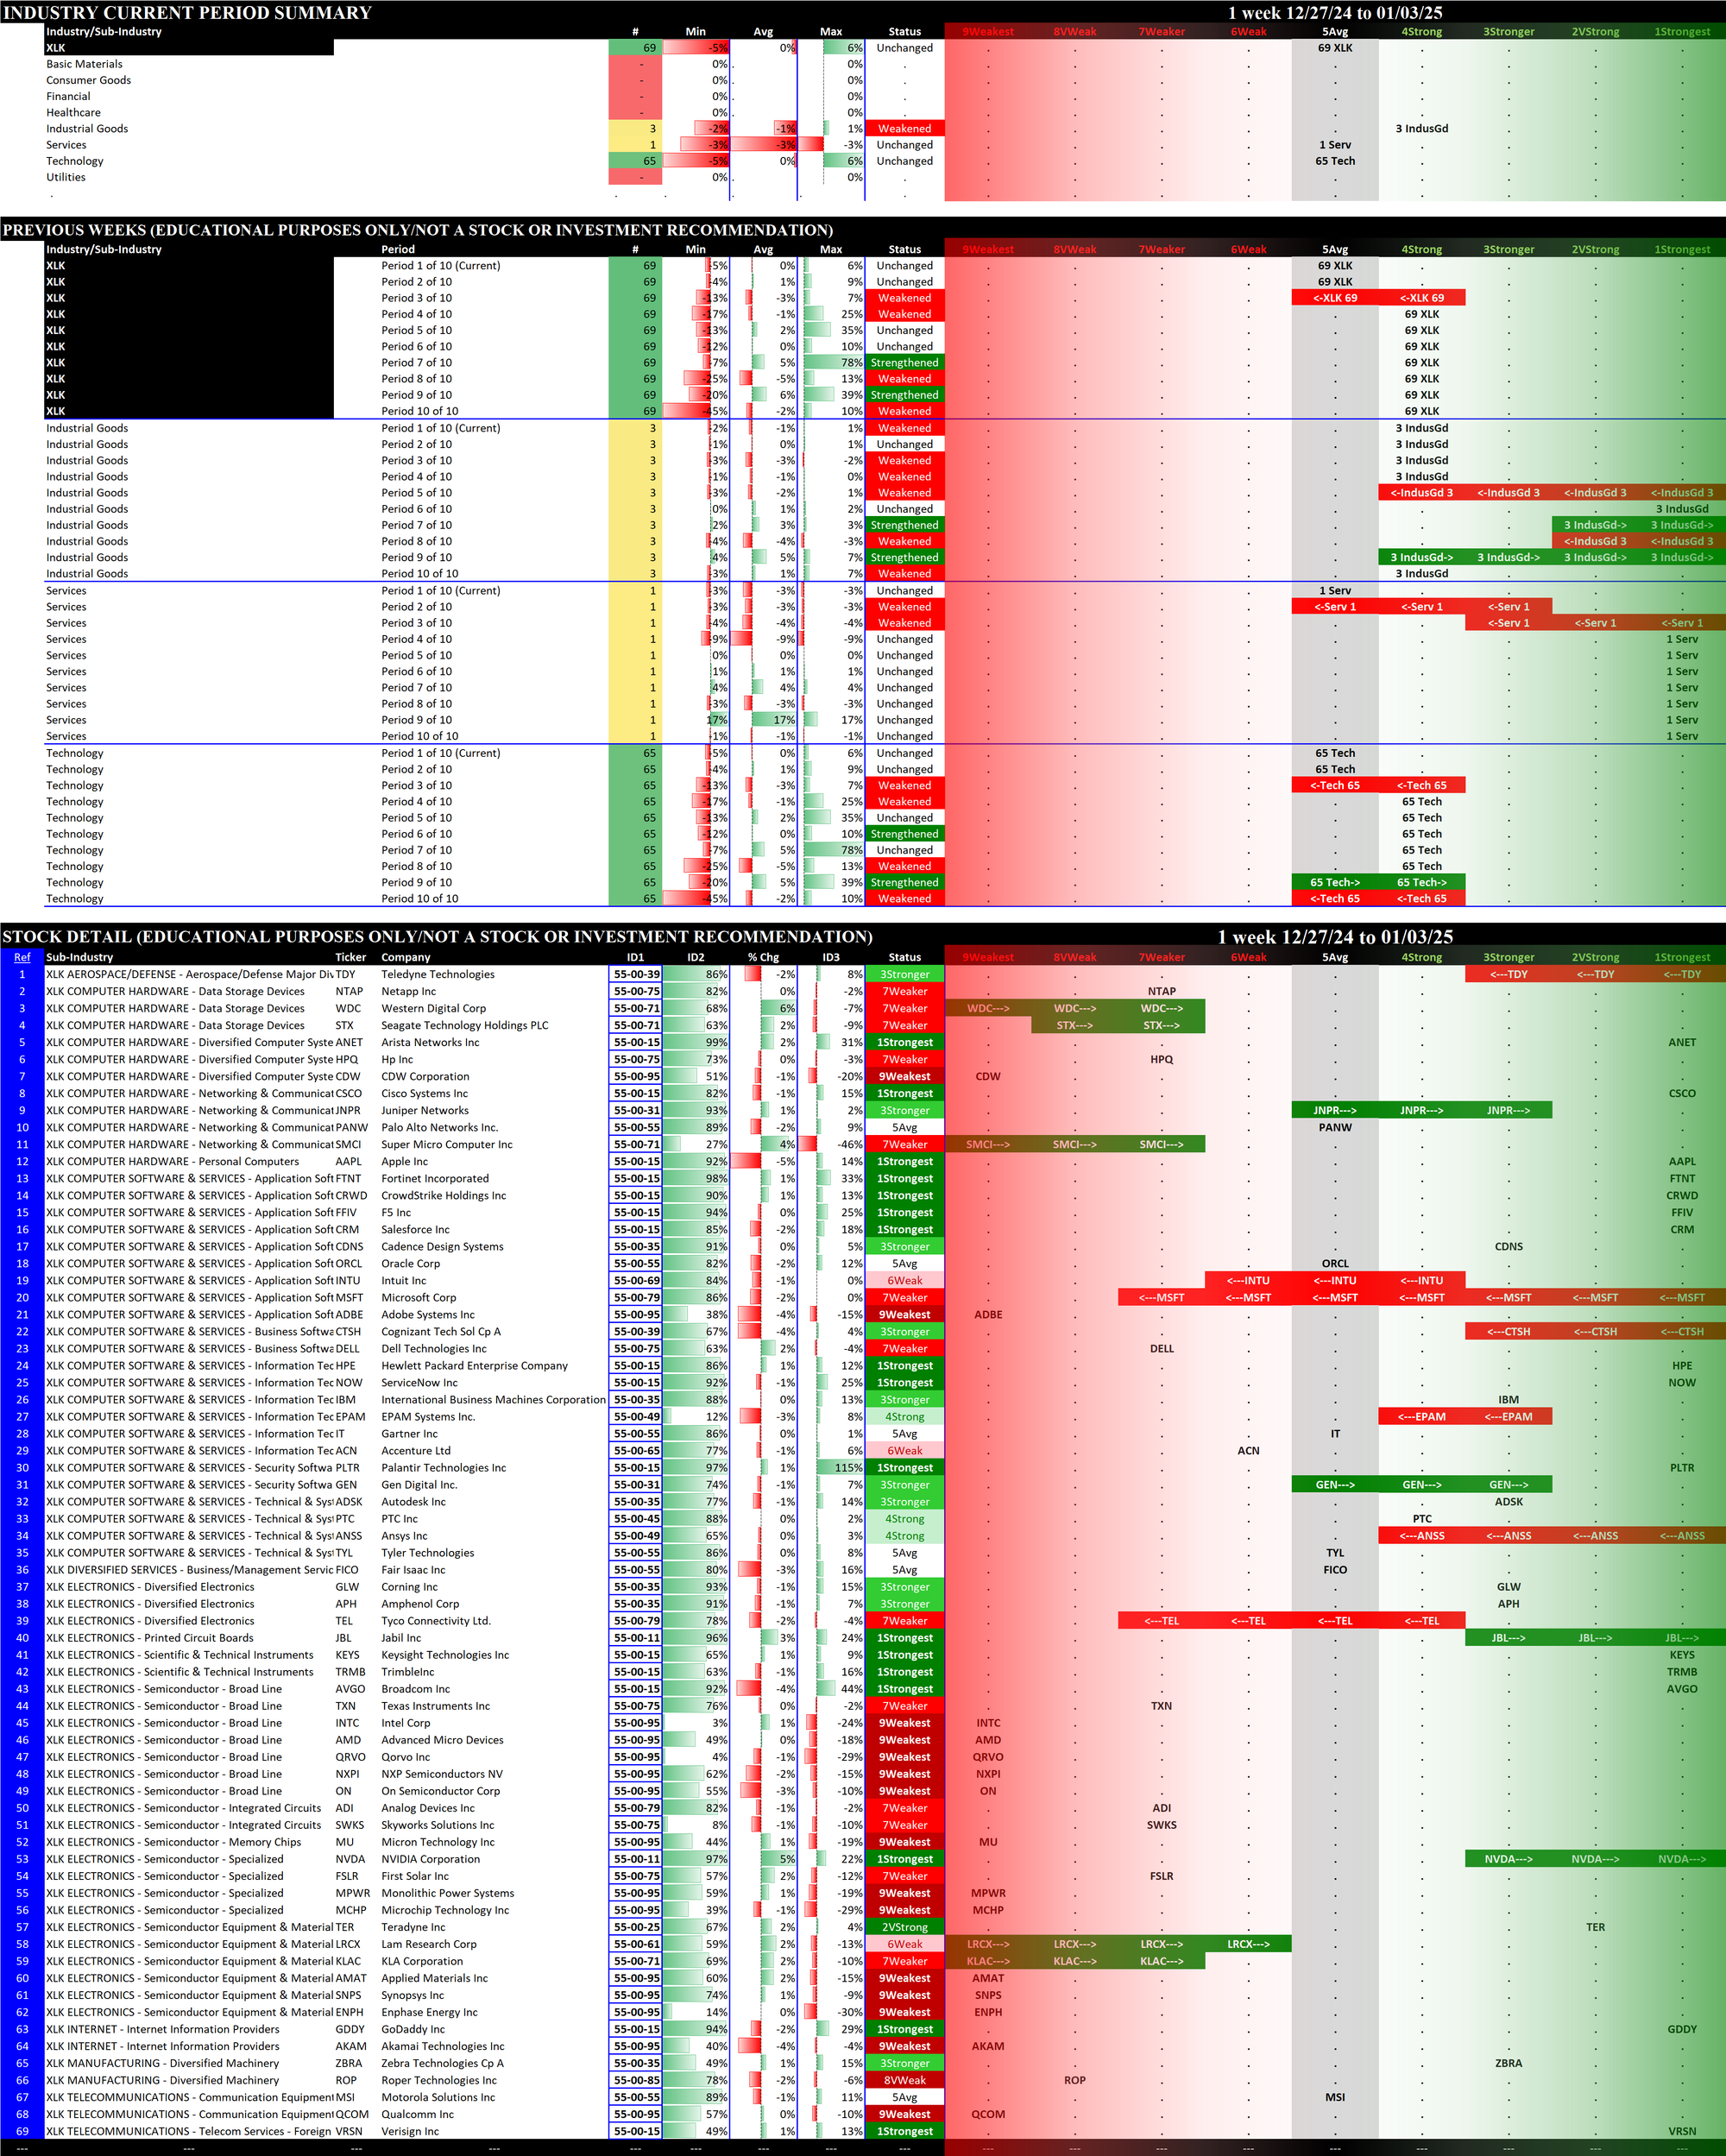
- The top section shows the strength rating of the sectors comprising each ETF, based on the eight original Stock Market Organizer classifications and NOT the 11 ETF classifications. For example, the XLB Basic Materials ETF consists of 19 Basic Materials stocks, 6 Consumer Goods stocks, and 2 Industrial Goods stocks.
- The middle section shows the previous 10 weeks' strengthening and weakening of the relevant sectors. For example, since the XLB has Basic Materials, Consumer Goods, and Industrial Goods stocks, these three sectors are shown in the middle section of the XLB detail. The XLF (Financial) has Financial, Services, and Tech stocks.
- The bottom section shows strengthening/weakening for the underlying ETF component stocks, and includes the listing of their Stock Market Organizer industries and sub-industries. These stocks are listed in order based on Sub-industry then strongest to weakest comparative stock strength rating. The Basic Materials XLB ETF includes both Newmont Corporation/NEM in the Gold sub-industry within the Metals & Mining industry and Dow Inc./DOW in the Specialty Chemicals sub-industry within the Chemicals industry.
In these bottom sections, one can visually see the strength/strengthening and weakness/weakening of the component stocks in each ETF.
2.1 XLB Materials (27 stocks, small), Weakened at 7Weaker = WORST
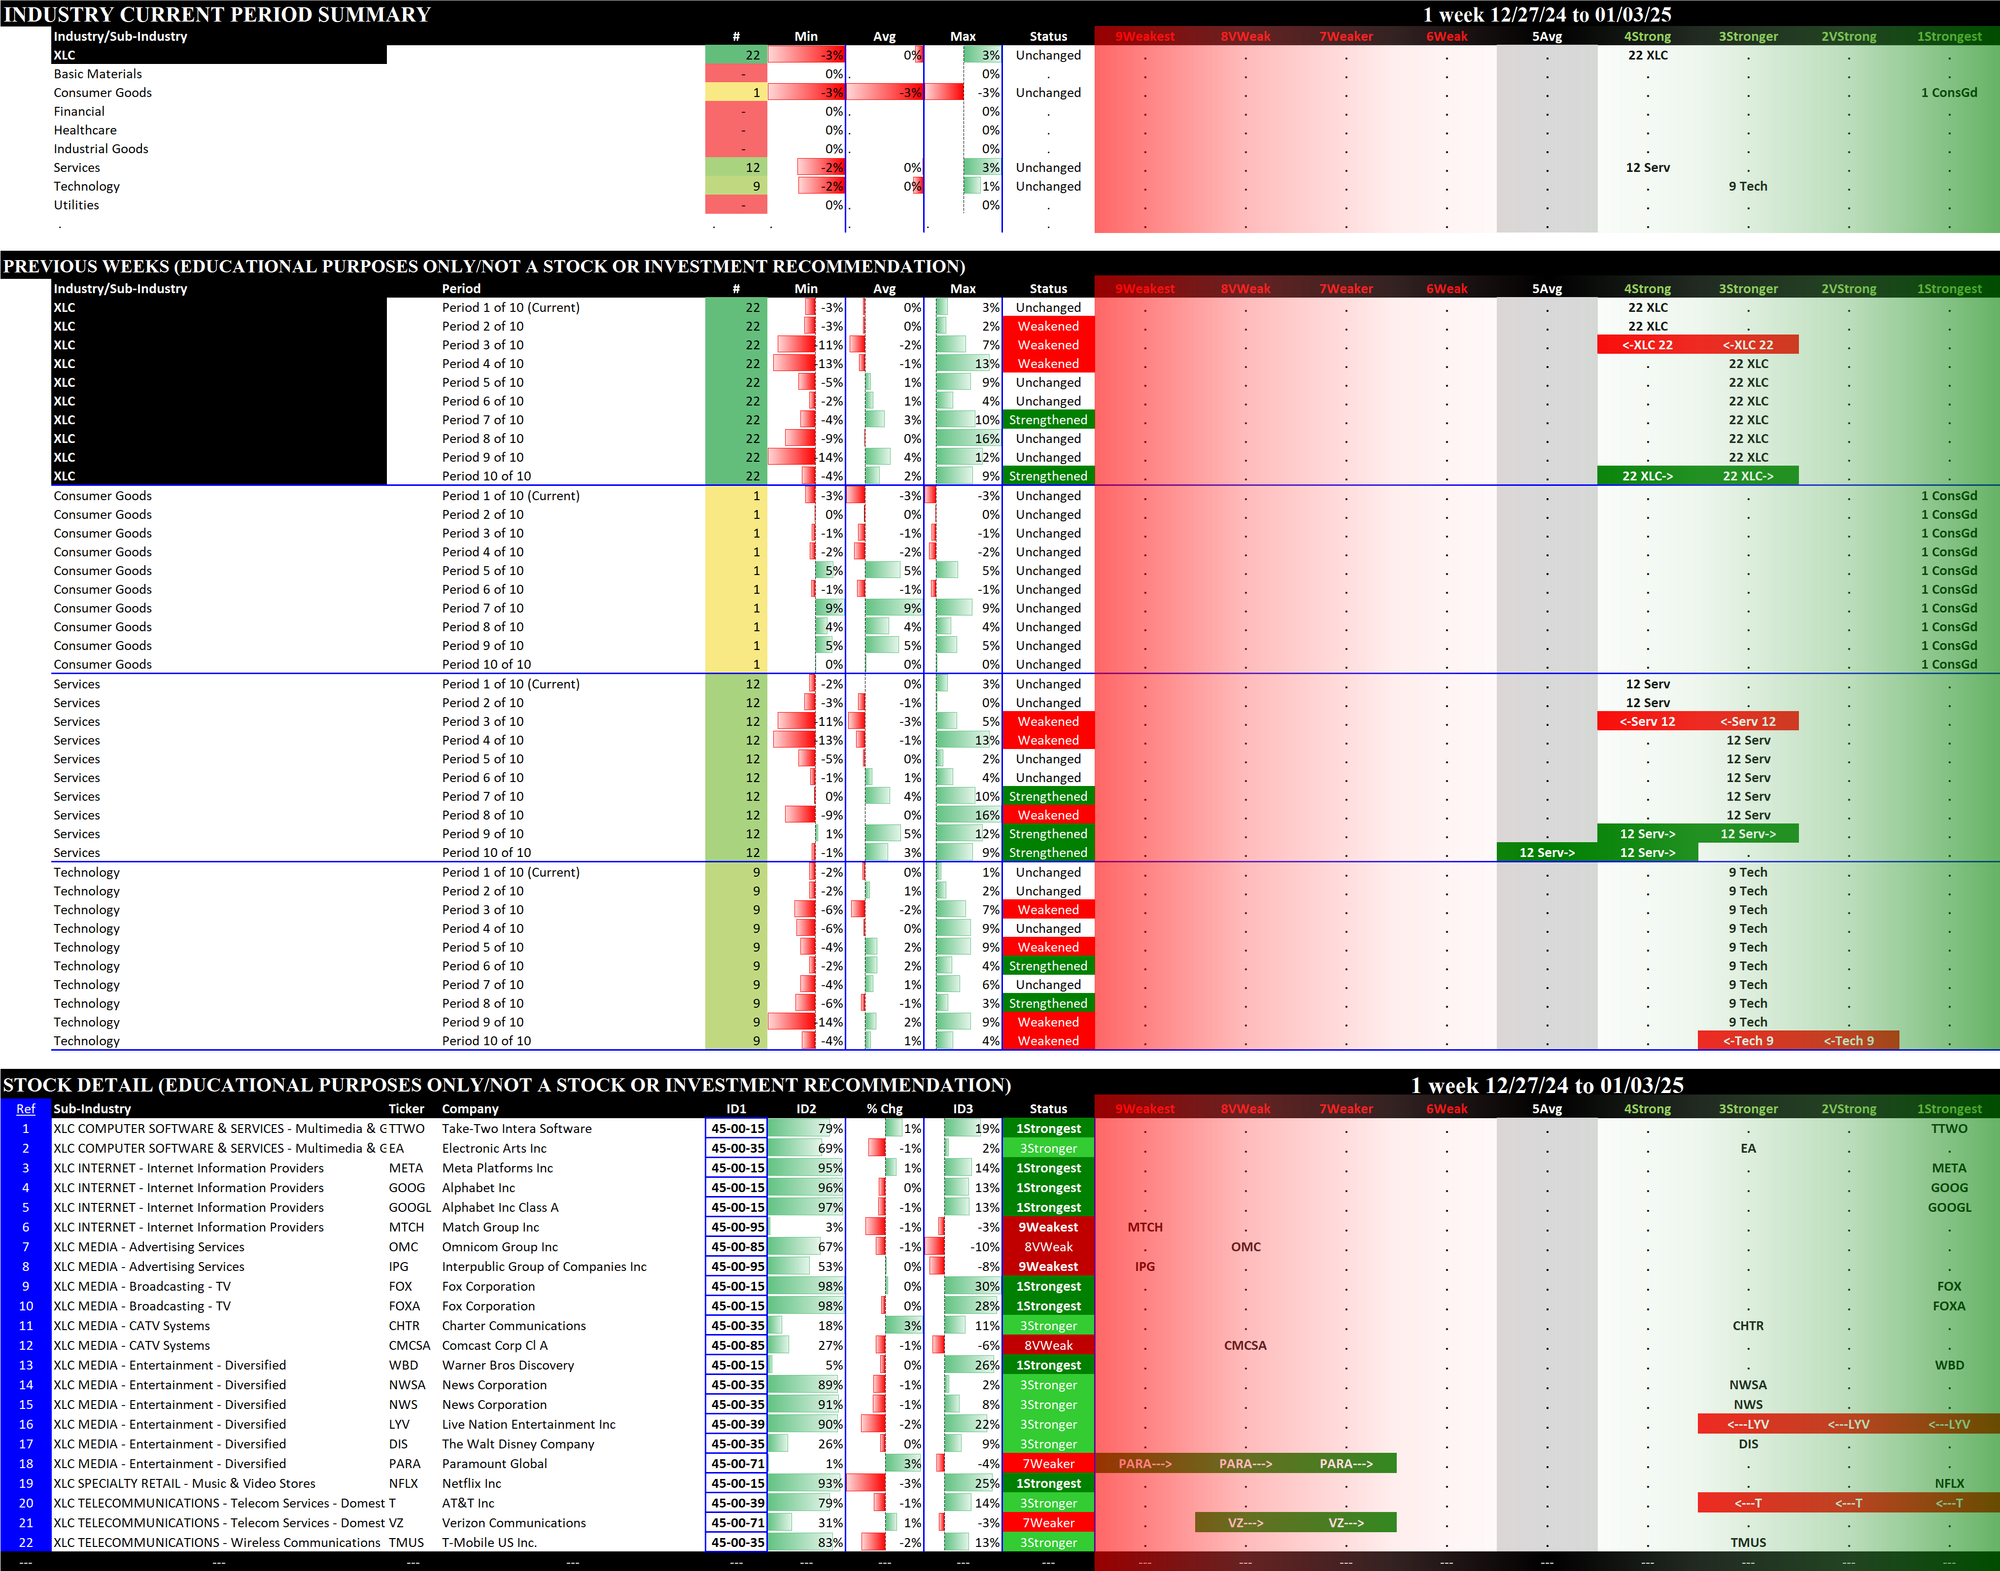
2.2 XLC Communication Services (22 stocks, small), Unchanged at 4Strong = tied for BEST
2.3 XLE Energy (22 stocks, small), Strengthened at 6Weak
2.4 XLF Financial (72 stocks, large), Unchanged at 4Strong = tied for BEST
2.5 XLI Industrial (76 stocks, large), Unchanged at 5Avg
2.6 XLK Technology (69 stocks, large), Unchanged at 5Avg
2.7 XLP Consumer Staples (38 stocks, mid-sized), Weakened at 6Weak
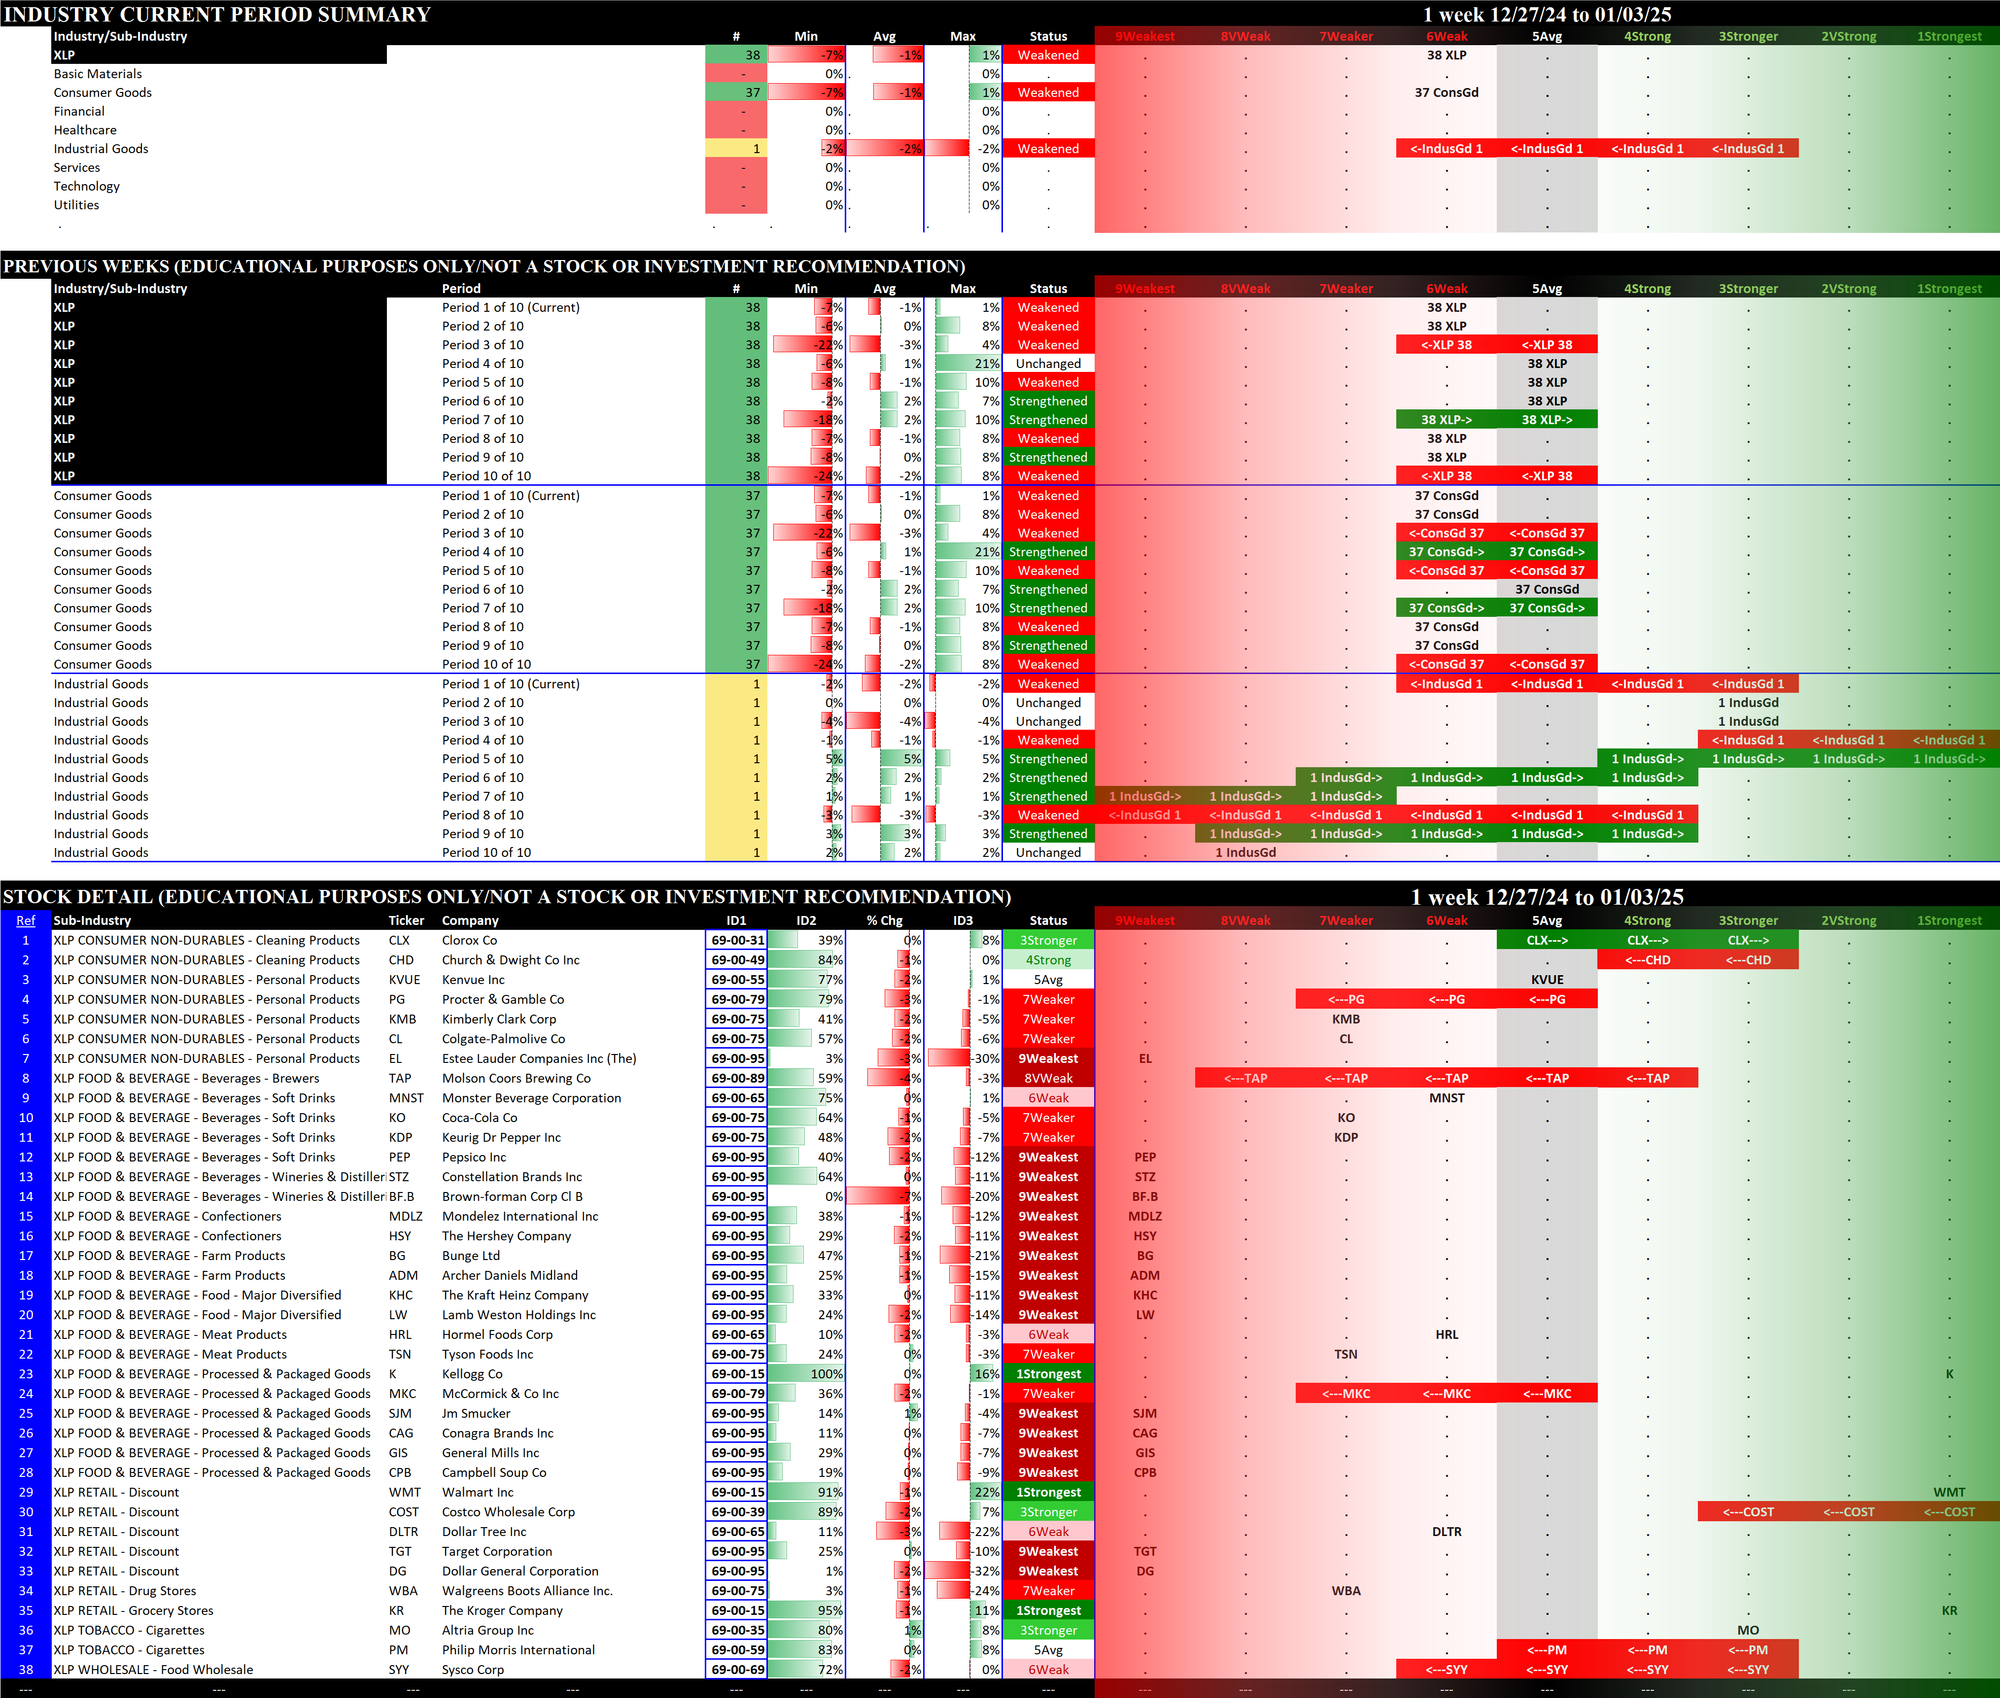
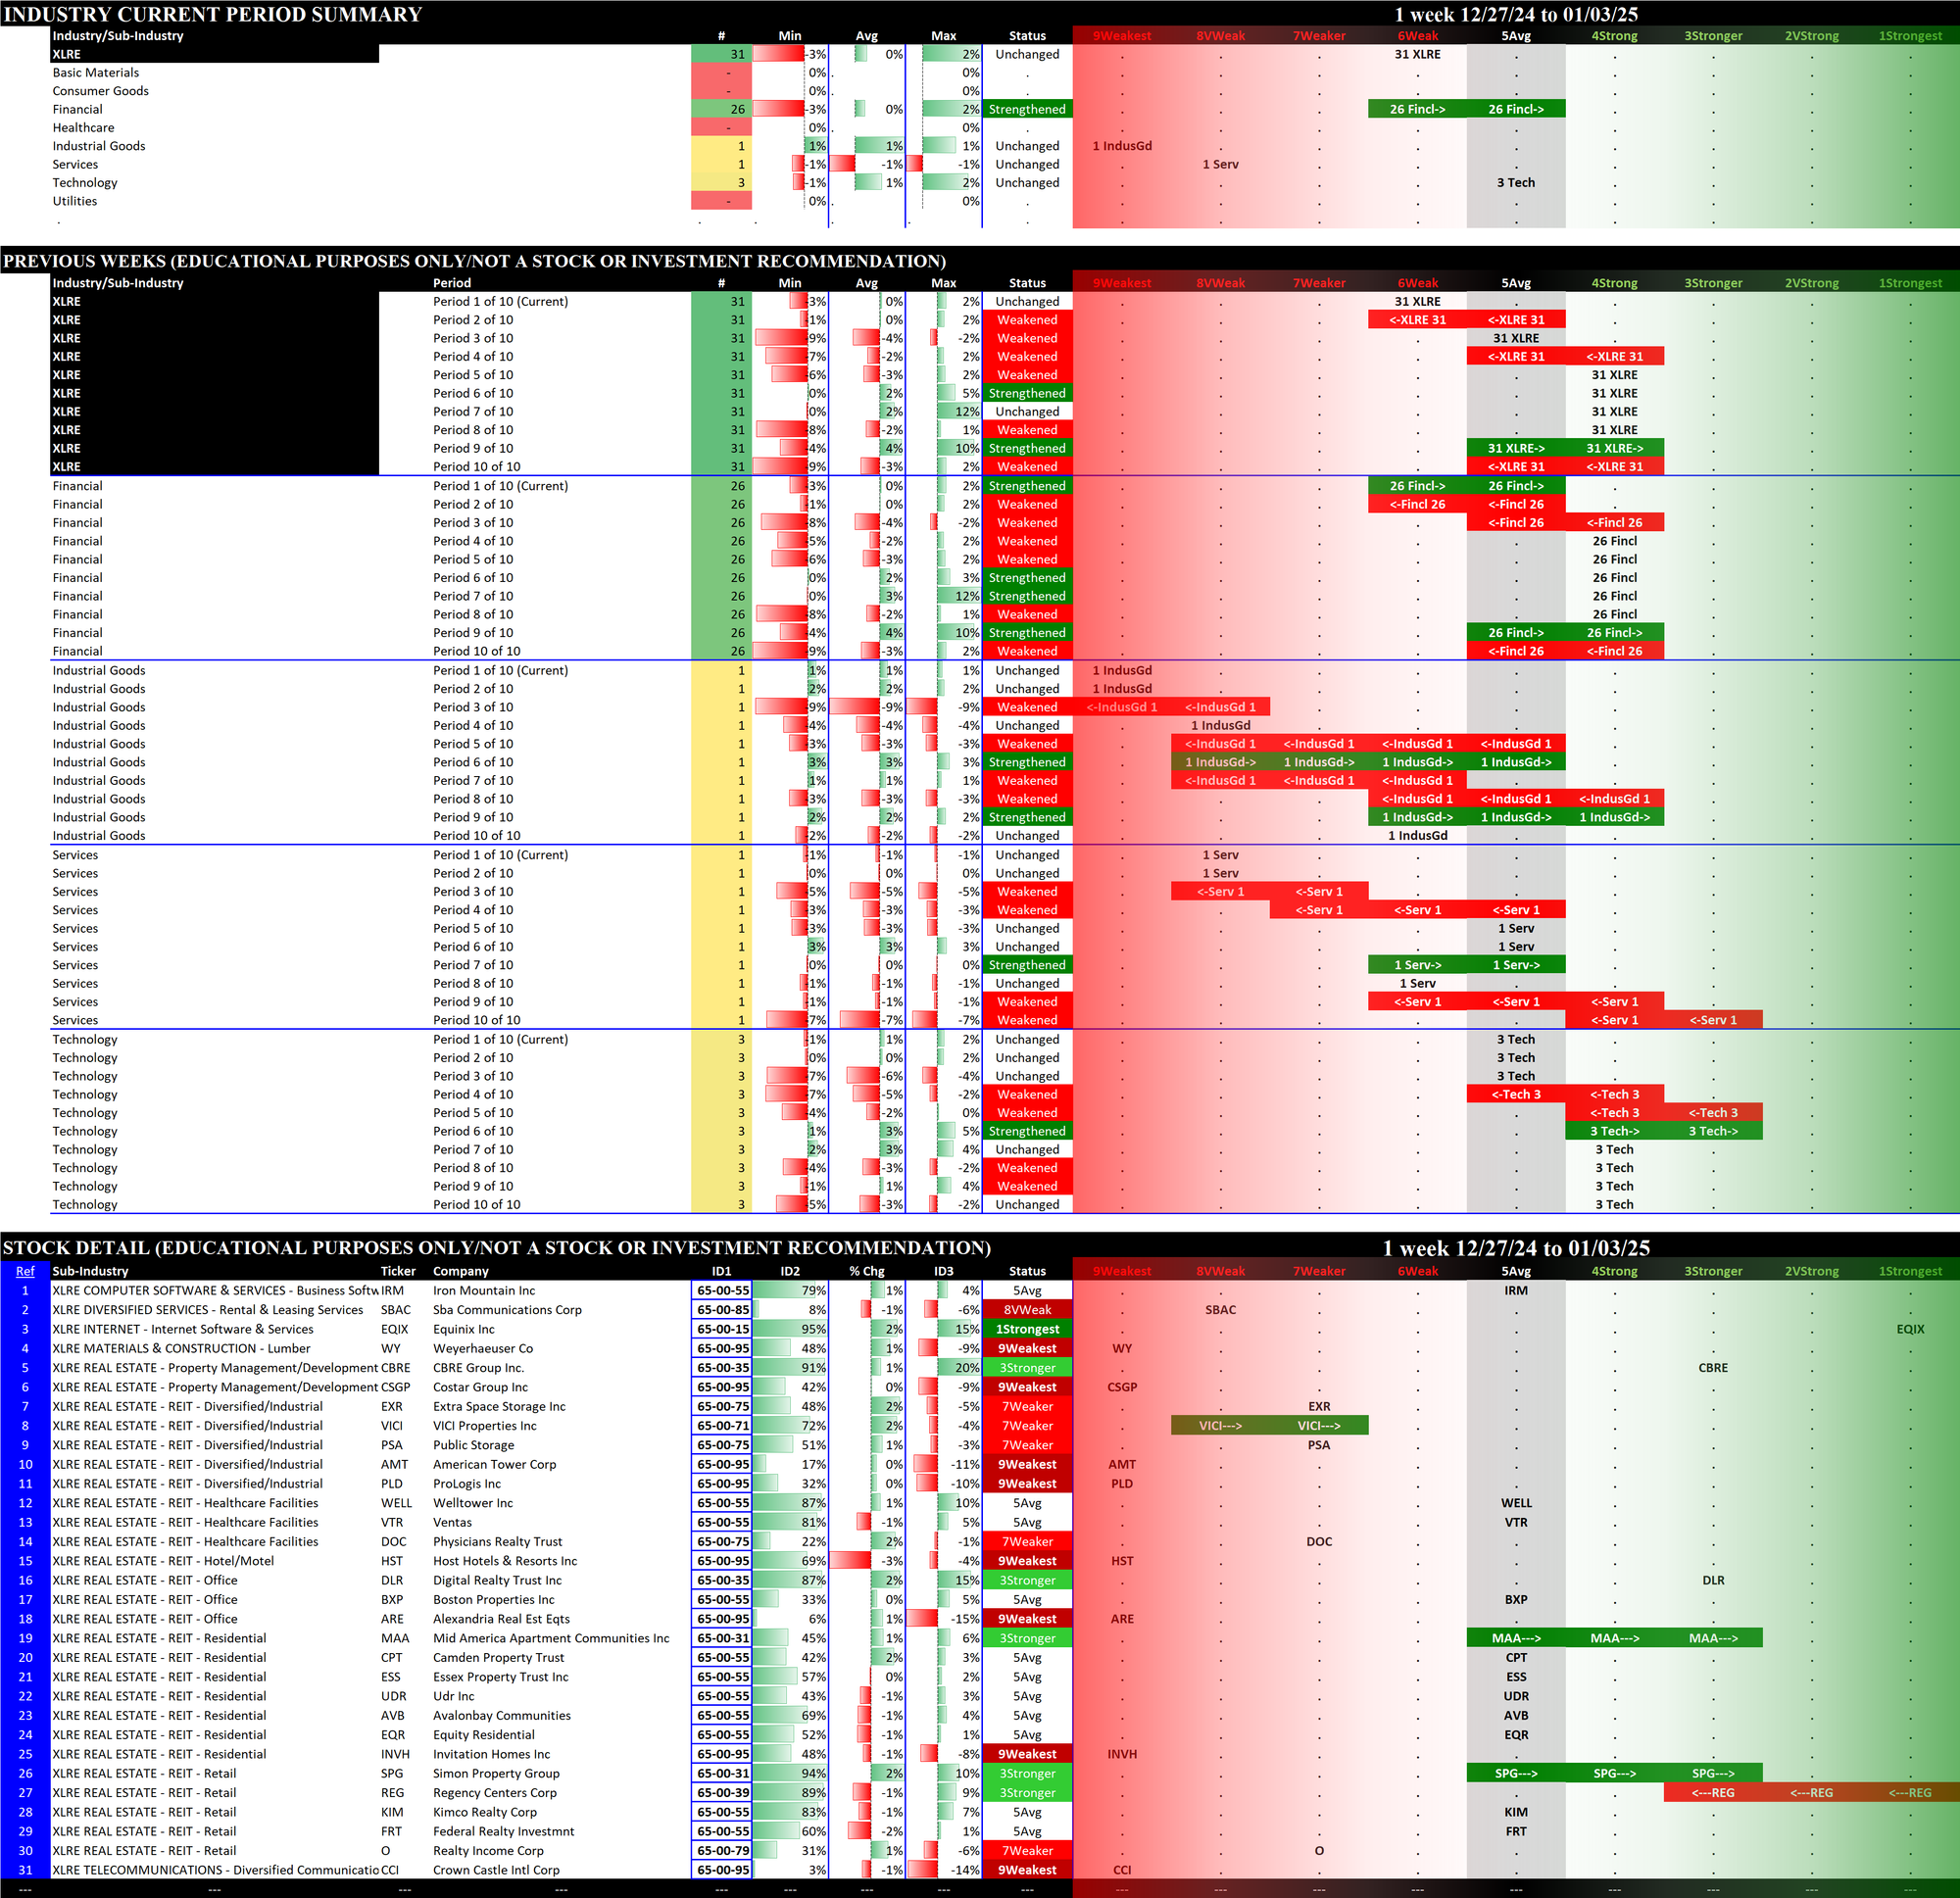
2.8 XLRE Real Estate (31 stocks, small/mid-sized), Unchanged at 6Weak
2.9 XLU Utilities (31 stocks, small/mid-sized), Unchanged at 5Avg
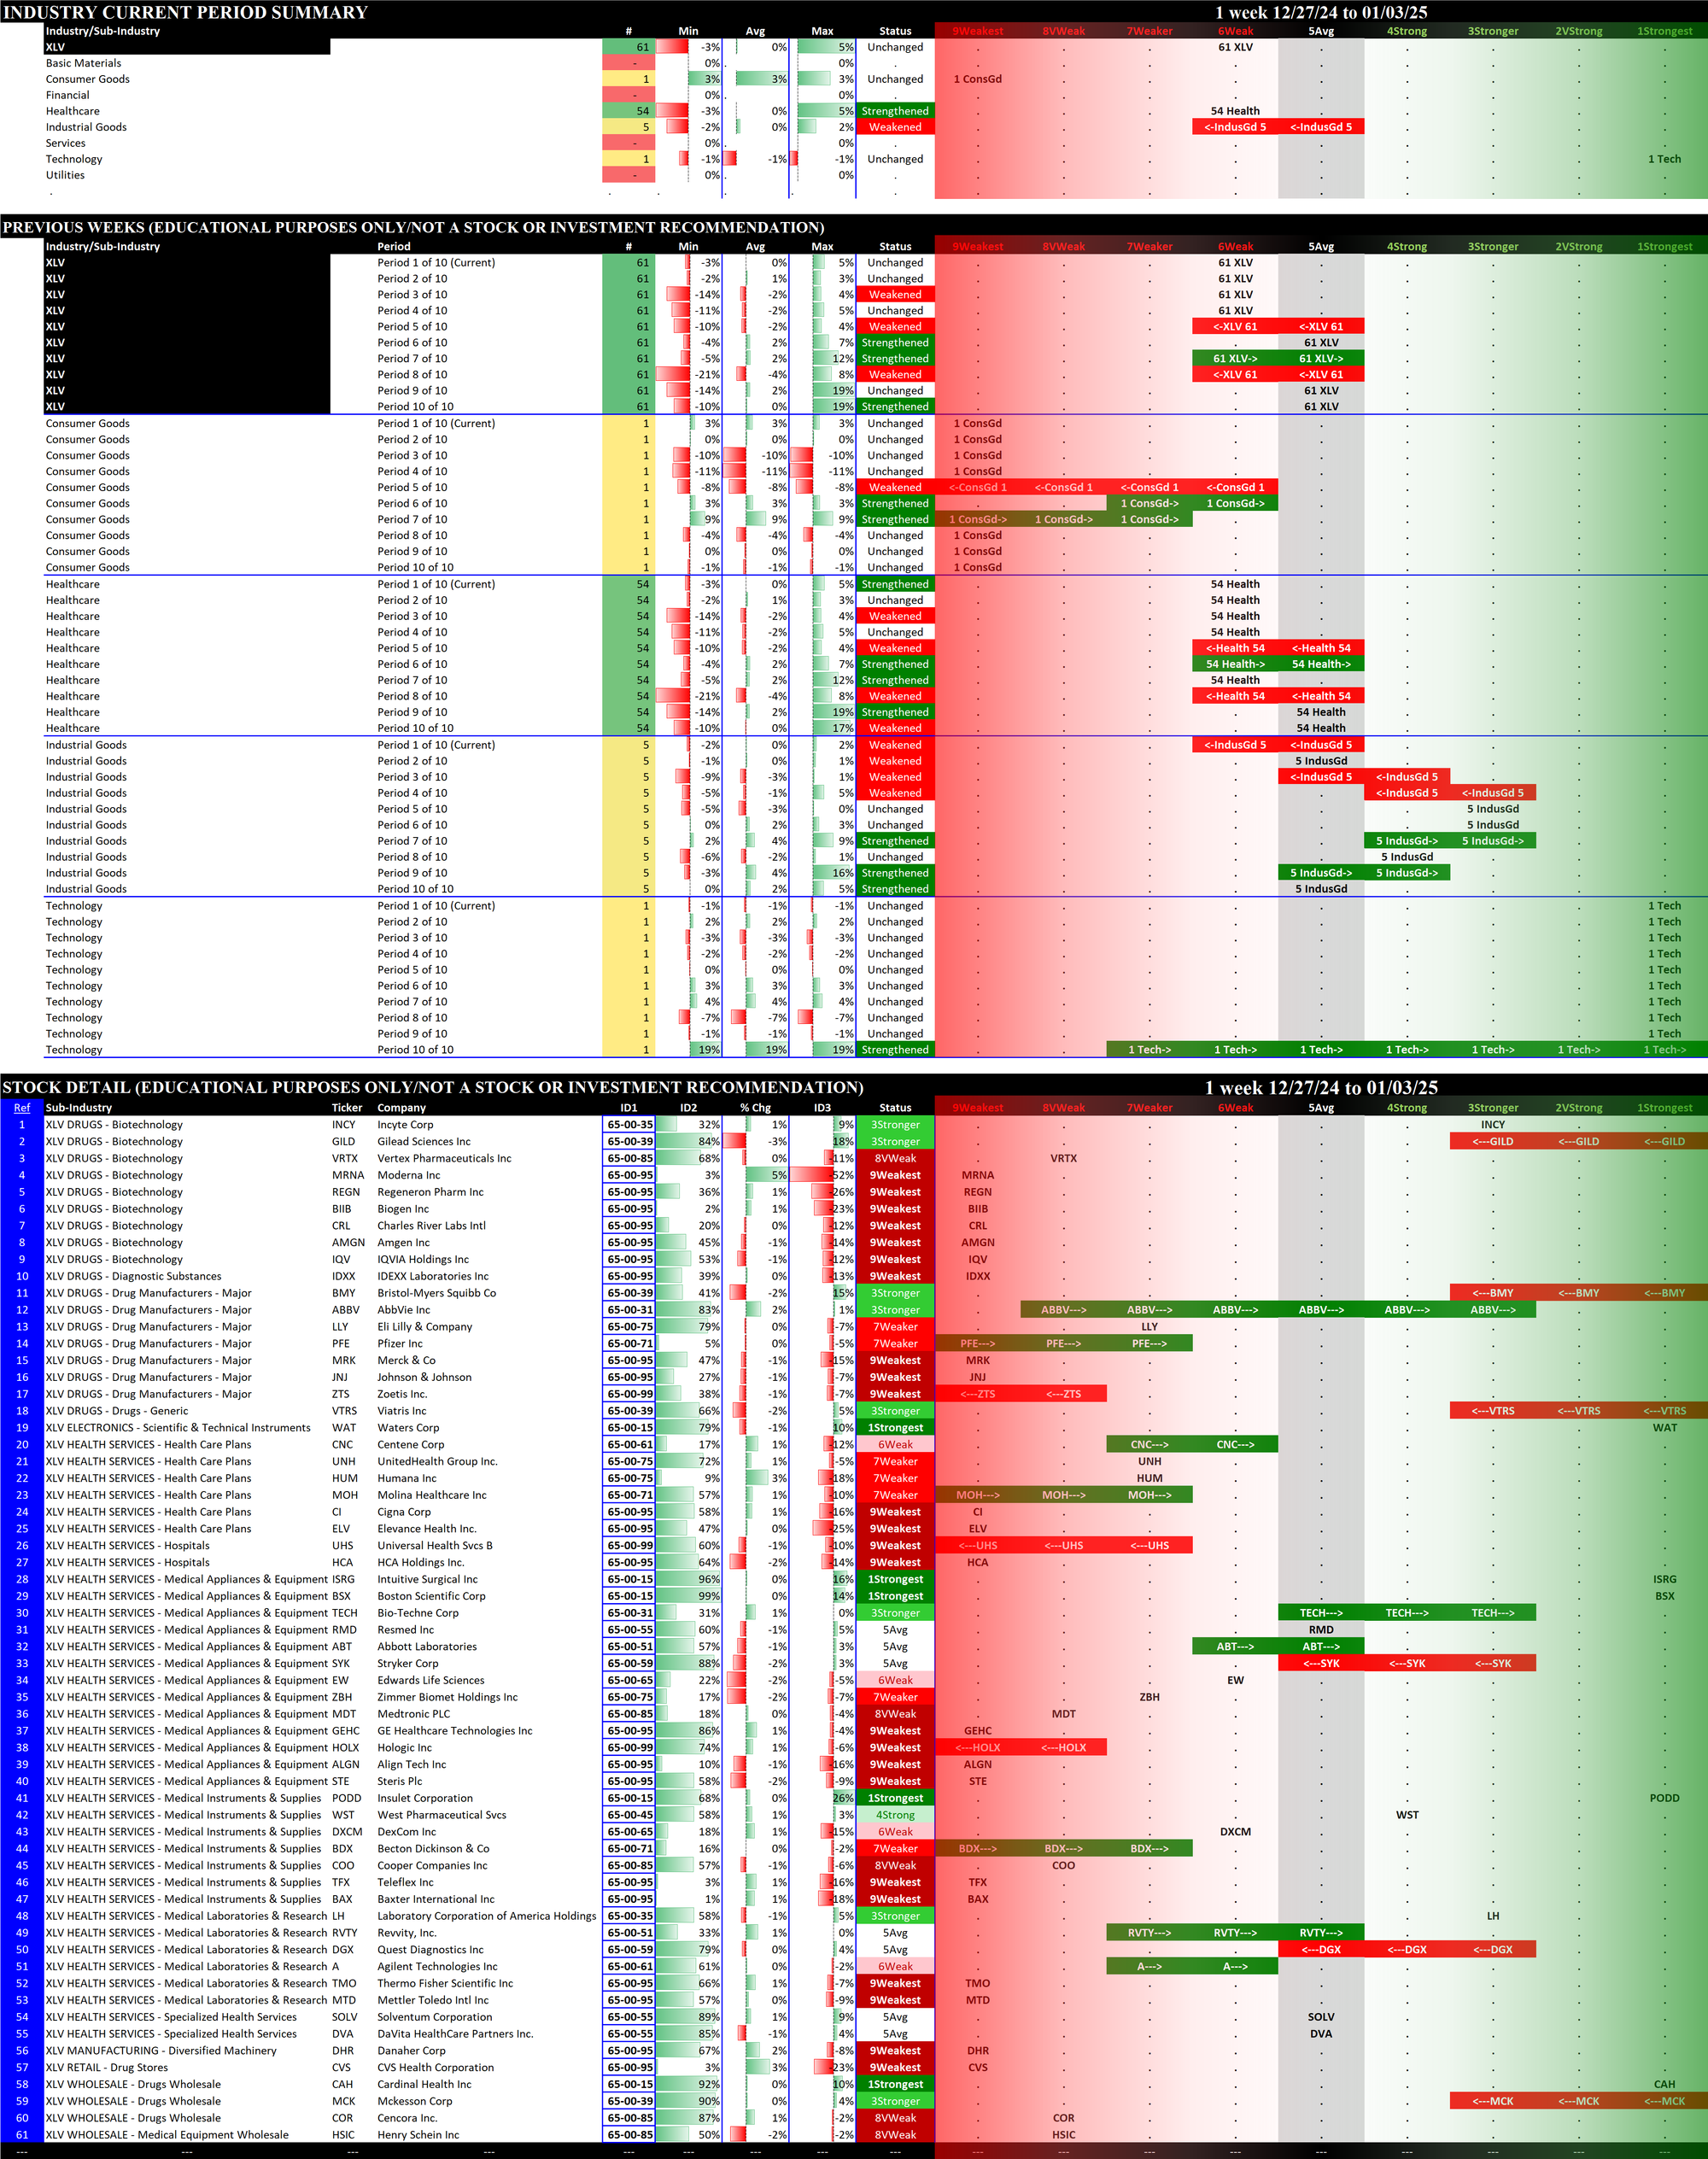
2.10 XLV Health Care (61 stocks, large), Unchanged at 6Weak
2.11 XLY Consumer Discretionary (51 stocks, mid-sized/large), Weakened at 5Avg
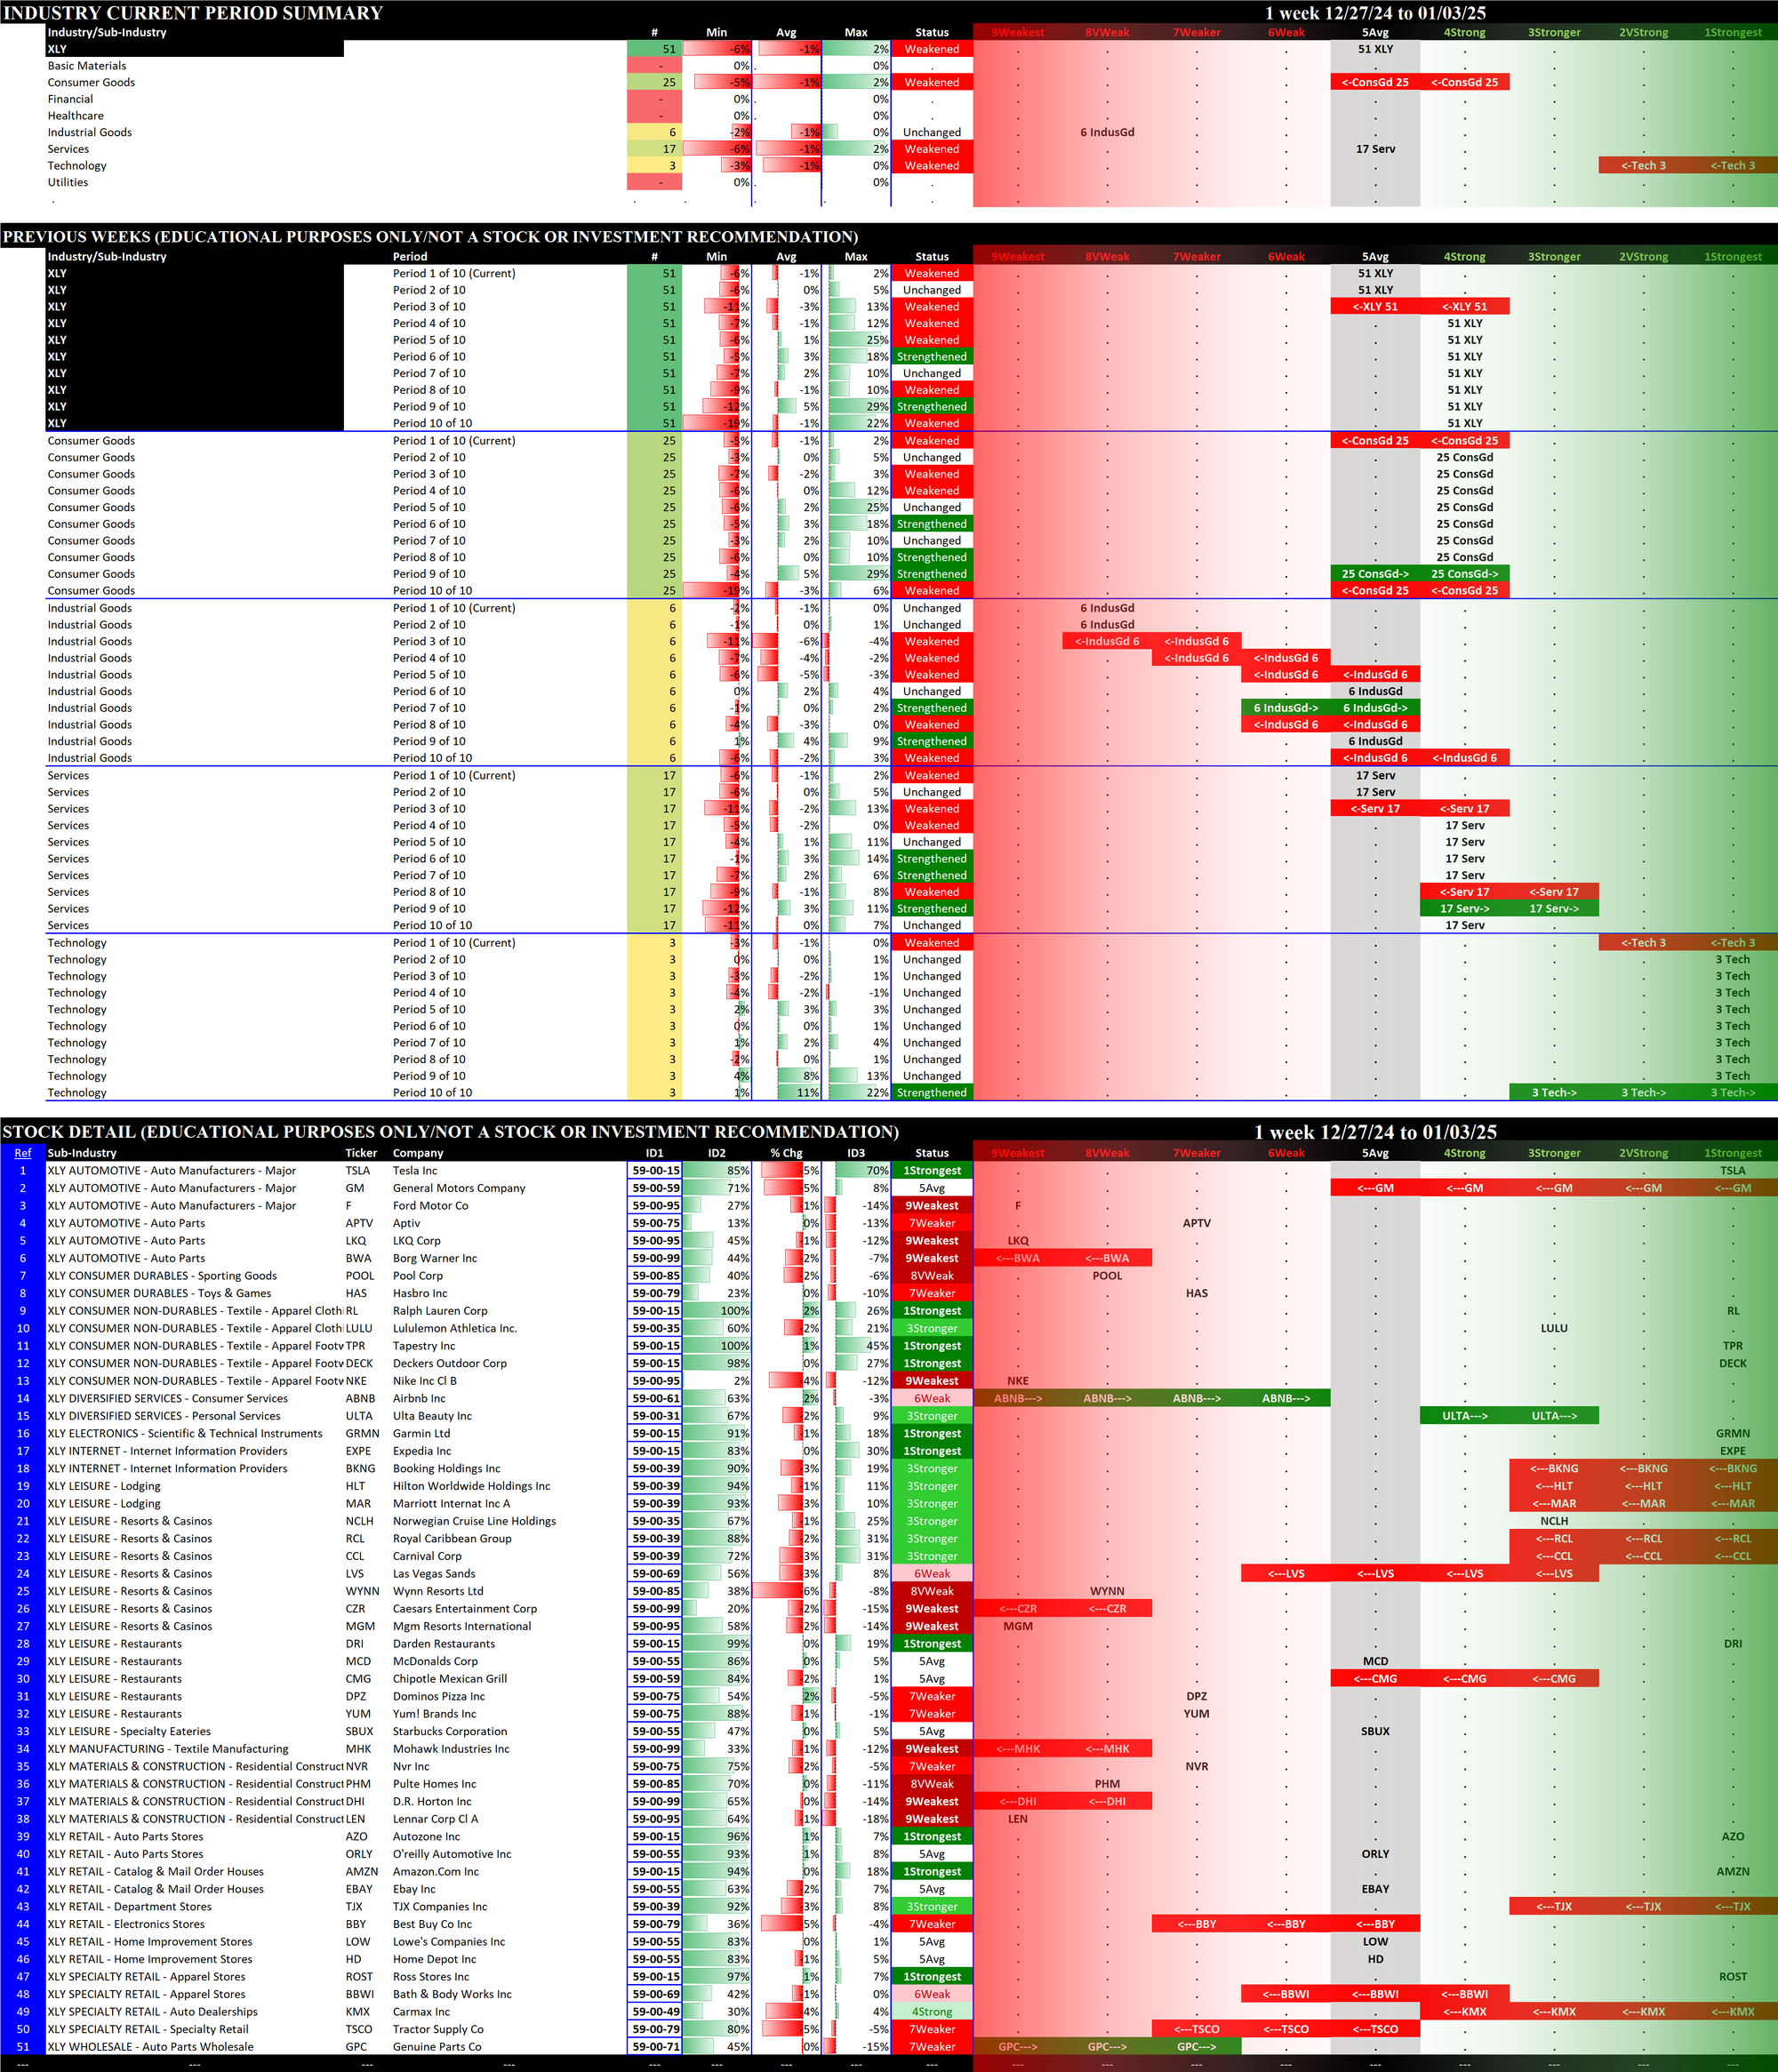
3. Stock Detail
The downloadable PDF below lists all component stocks in order of first Strongest to Weakest ETF and second Strongest to Weakest Stock. The difference between this report and the 11 ETF stock listings above is this report consolidates all component stocks whereas the above listings are segregated by ETF.
Download the following Excel file if you are interested in sorting results yourself.