SMO Exclusive: SPDR Sector ETFs Strength Report Friday 2024-11-29 Unchanged at 3.7 Strength Score
Background
This analysis consists of the Stock Market Organizer stock-by-stock strength analysis applied to the 500 stocks that comprise the 11 SPDR Select ETFs.
These results are combined with overall market environment readings (via the Market Strength Score and the Sector Risk Gauge) to discern appropriate portfolio exposure given prevailing market and sector conditions.
Why do you care?
This dynamic market analysis provides a continuously updated, apples-to-apples comparison of the strengthening and weakening trends in the US market. By tracking the 500 large-cap stocks across 11 key sectors (via SPDR ETFs), this analysis offers valuable insights for investors seeking to harness momentum in their portfolios.
Each week, the analysis clearly identifies which sectors and stocks have gained, remained flat, or lost ground. With this data, investors can objectively assess sector and stock strength, refining their timing and positioning for new investments. Ultimately, this approach aims to enhance long-term portfolio performance by leveraging momentum – a proven market factor – to inform data-driven investment decisions.
Strengthening Status: Most Important Ranking
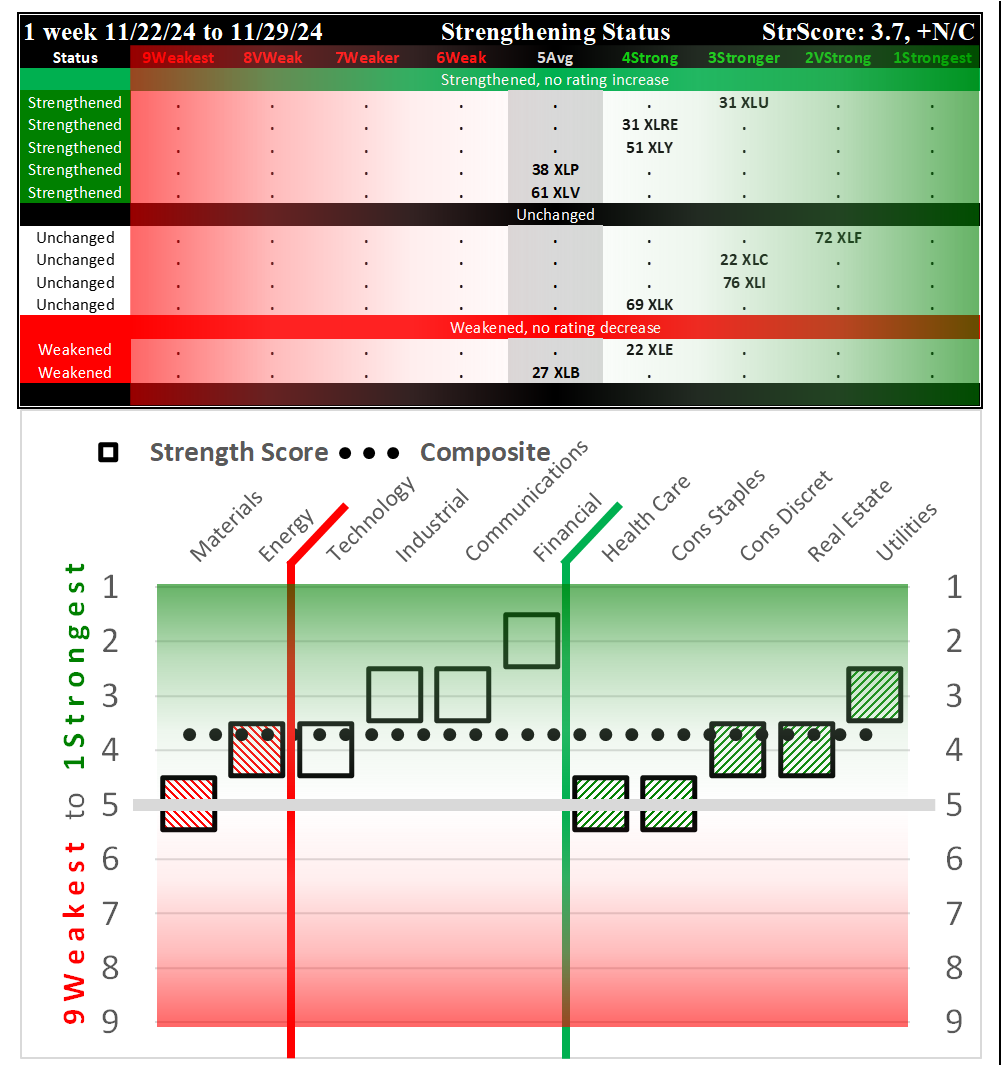
The following spectrum graph shows the ETFs based on their strengthening status, as compared to last week.
These are ordered based on whether or not and to where an ETF strengthened or weakened rating. These distinctions are important - that 1) a sector strengthened or weakened rating, and 2) from/to where this strengthening happened are key features to note.
The top section ("Strengthened, no rating increase") shows the five ETFs that strengthened this week, though without enough movement to change rating. Note that for the prior week ending 11/22/24, XLF/Financial strengthened from an already-strong rating, while the other two XLP/Consumer Staples and XLV/Health Care strengthened from comparatively much weaker ratings. The key factor is each strengthened enough to change ratings - a material change that has great influence in this system. It is impossible to determine how long these signals will last - they could reverse at any time. However, the change itself is an objectively actionable signal.
Weekly Returns
Average Returns - Strong Positive Week
The average returns for the underlying stocks in each ETF are shown below. Only one was negative (XLE/Energy) with returns ranging from -2.0% to +2.6%. The best and worst are highlighted below:
Best:
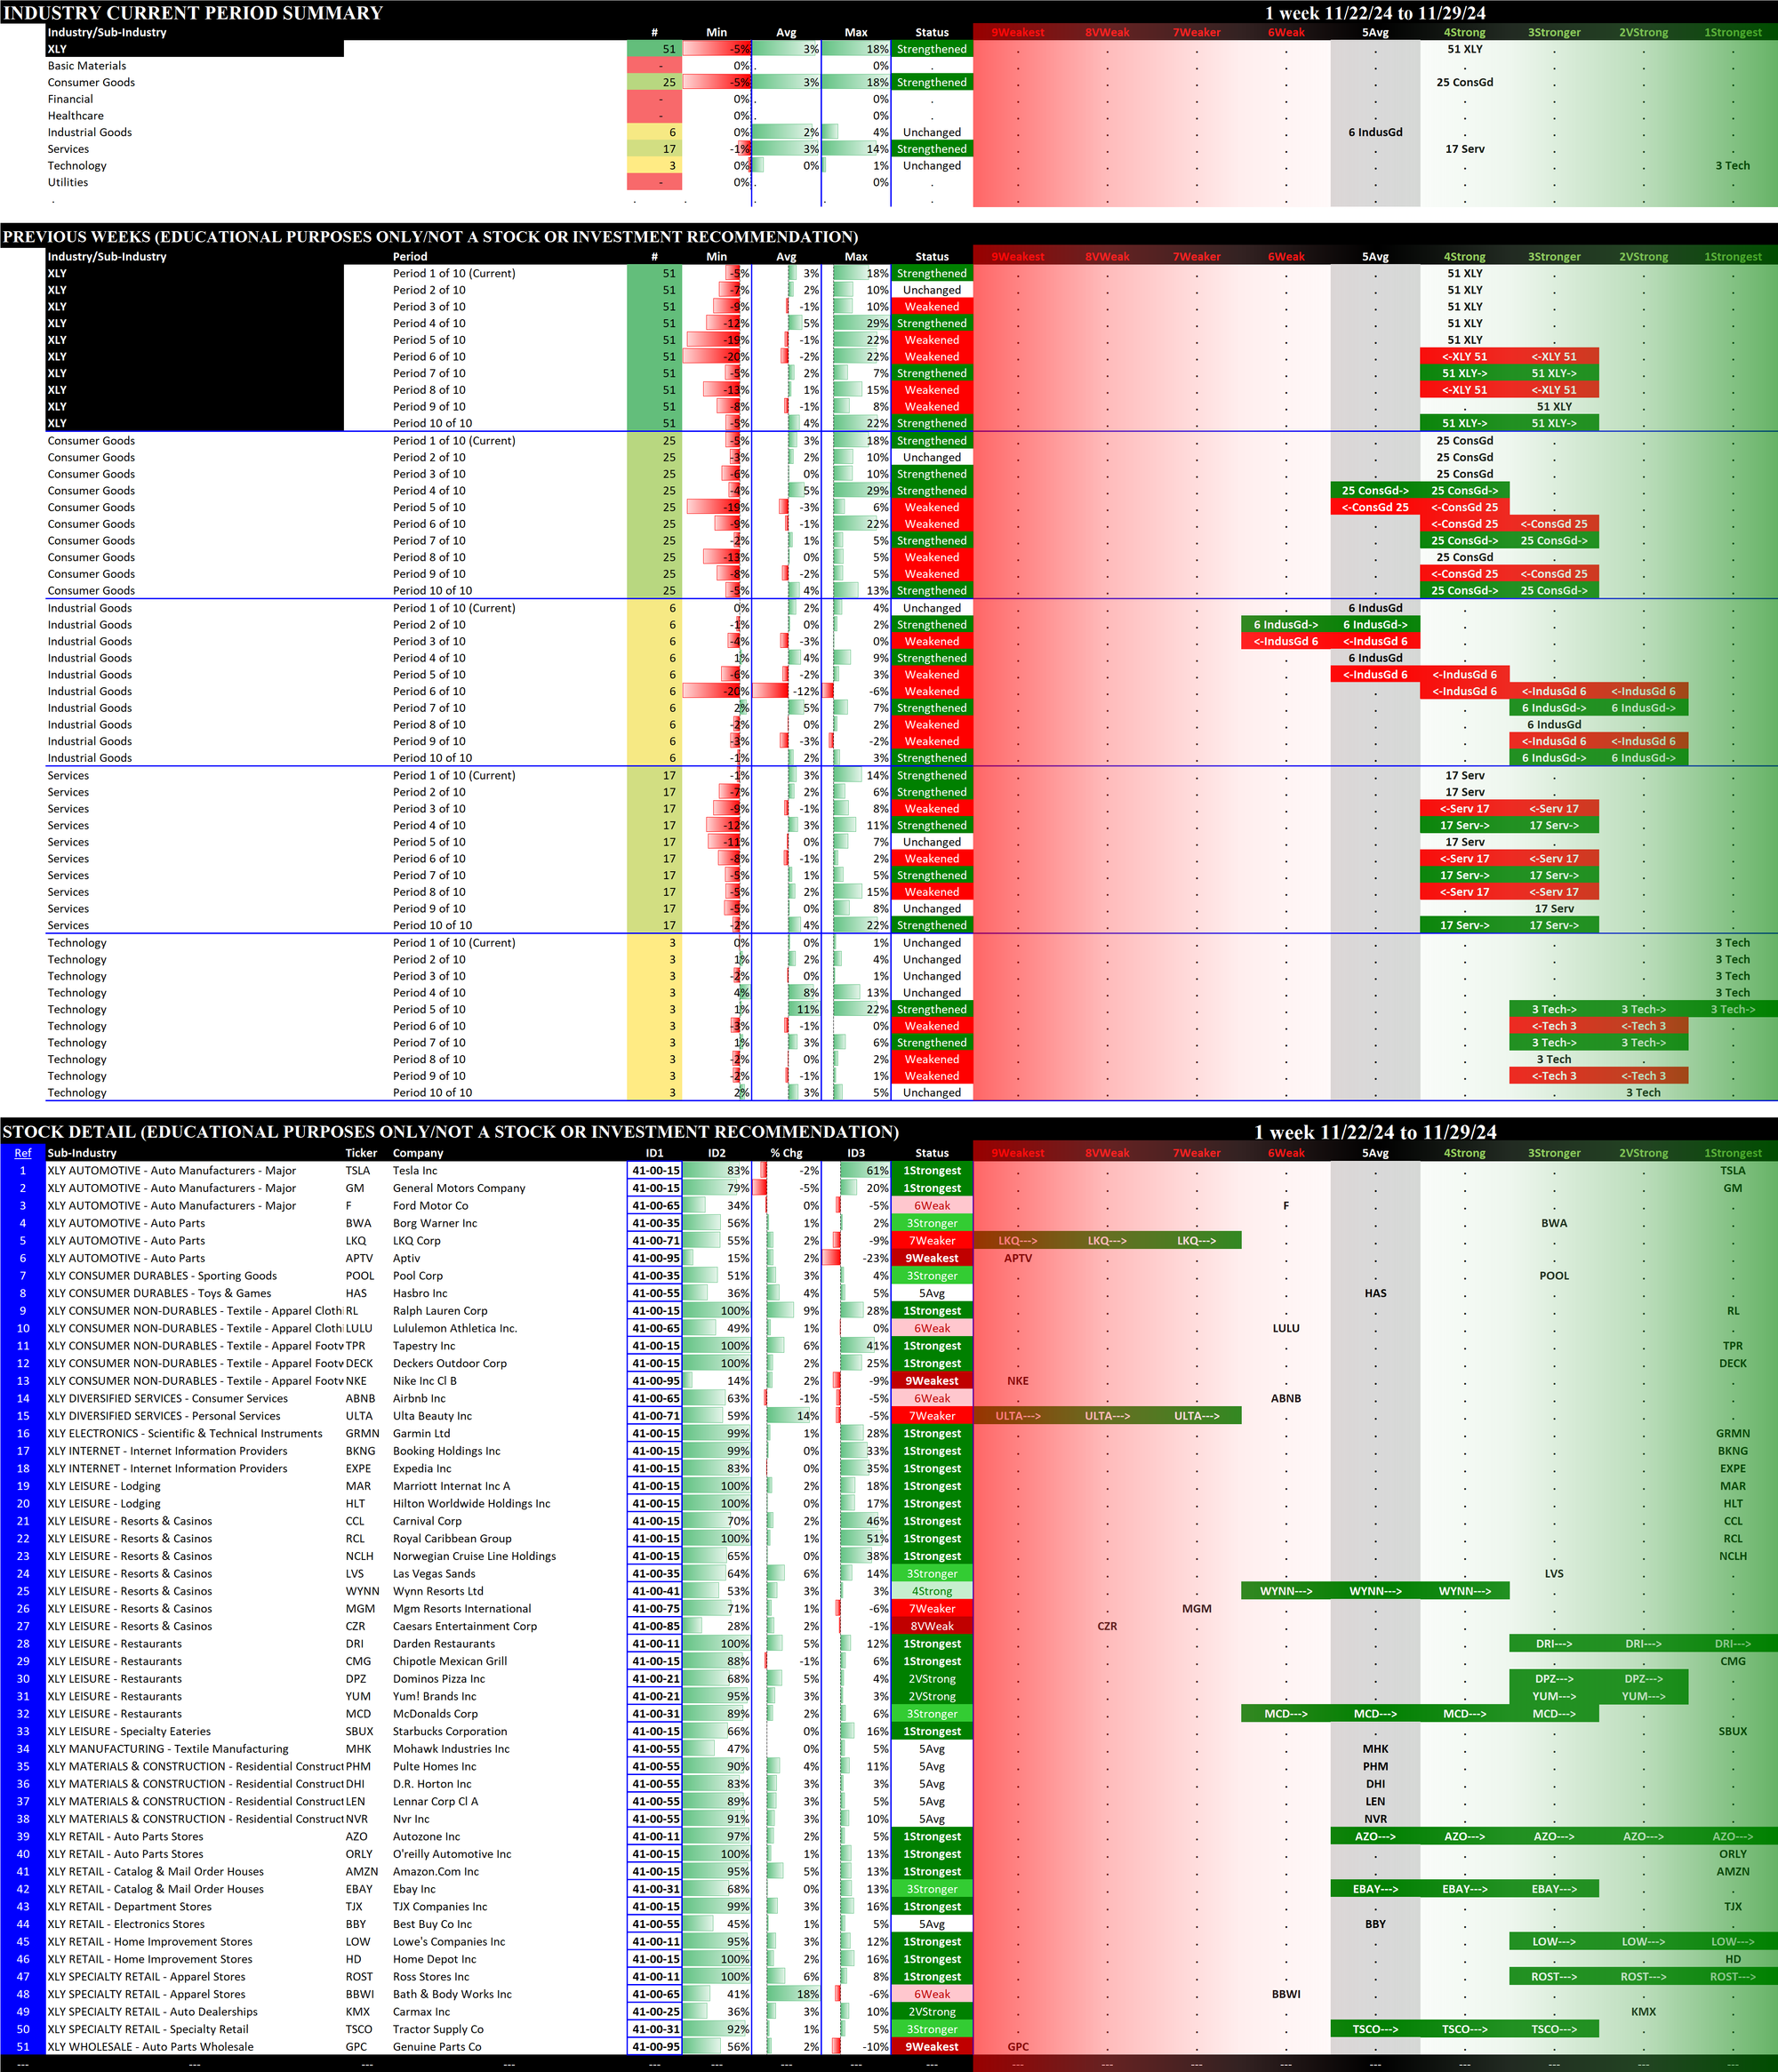
- XLY/Consumer Discretionary, 2.6% average for 51 stocks
- XLRE/Real Estate, 1.9% average for 31 stocks
- XLP/Consumer Staples, 1.8% average for 38 stocks
Worst:
- XLE/Energy, -2.0% average for 22 stocks
- XLK/Technology, 0.2% average for 69 stocks
- XLB/Materials, 0.4% average for 27 stocks
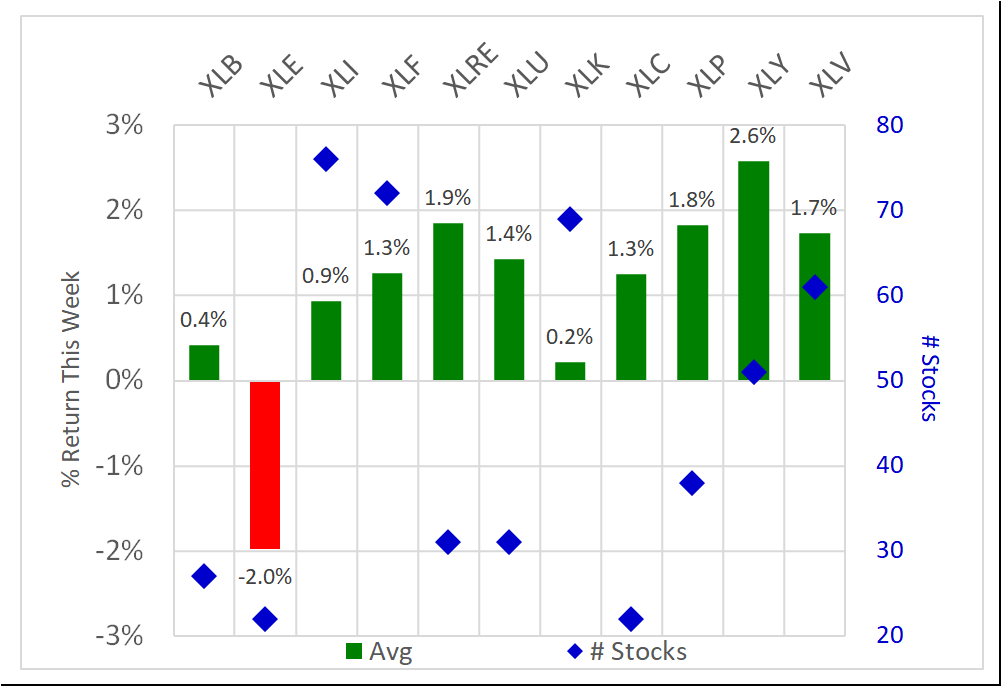
10 of 11 positive returns for the week.
High and Low Returns
The following graphic overlays the lowest and highest returns in each sector.
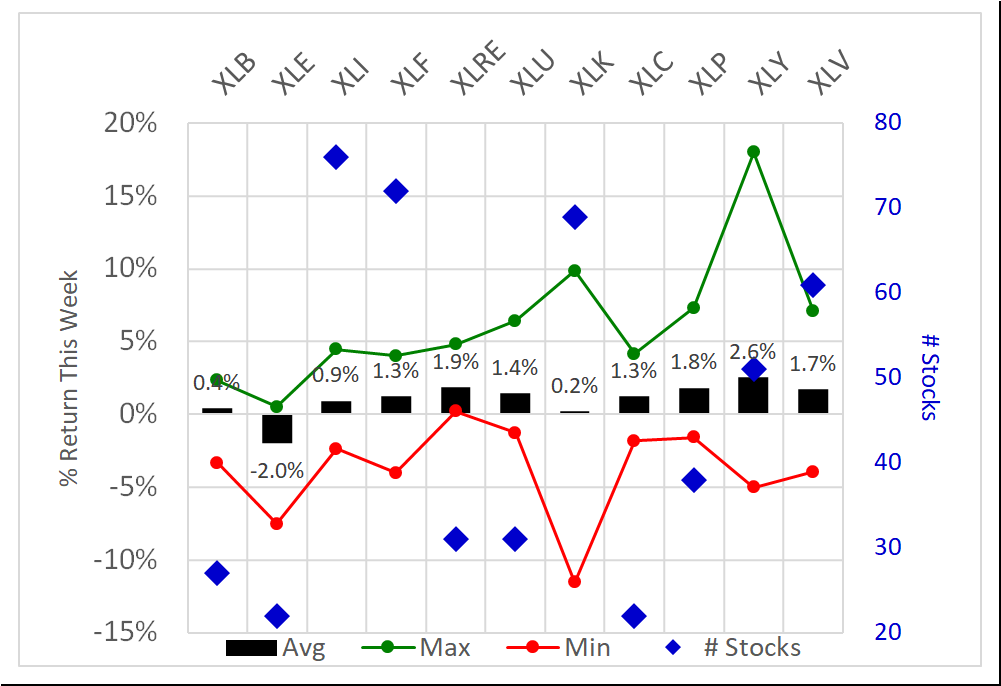
The XLY/Consumer Discretionary outlier to the upside was BBWI/Bath & Body Works Inc +18% (a stock rated 6Weak). The XLK/Technology outlier to the downside was DELL/Dell Technologies Inc -12% but still rated 1Strongest.
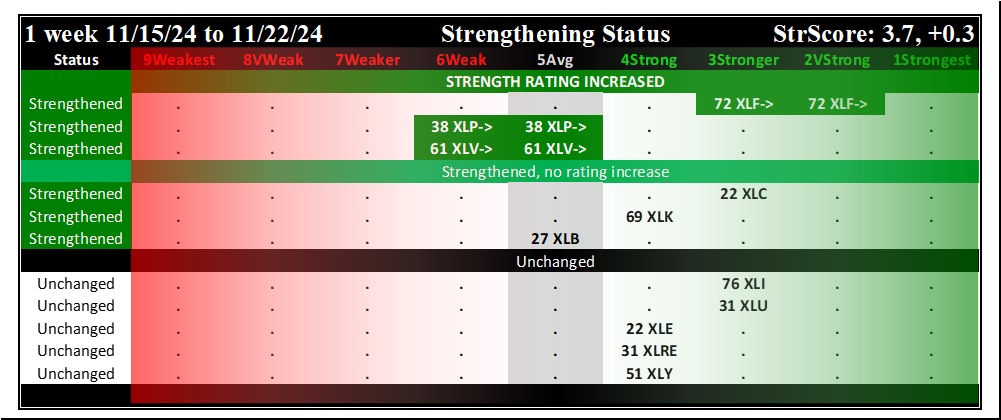
Context: Comparison to Previous Weeks
The following graphics show recent week-to-week changes ending on Fridays:
- 11/15/24: Flat/Weakening
- 11/22/24: Strengthening
- 11/29/24: Flat/Strengthening
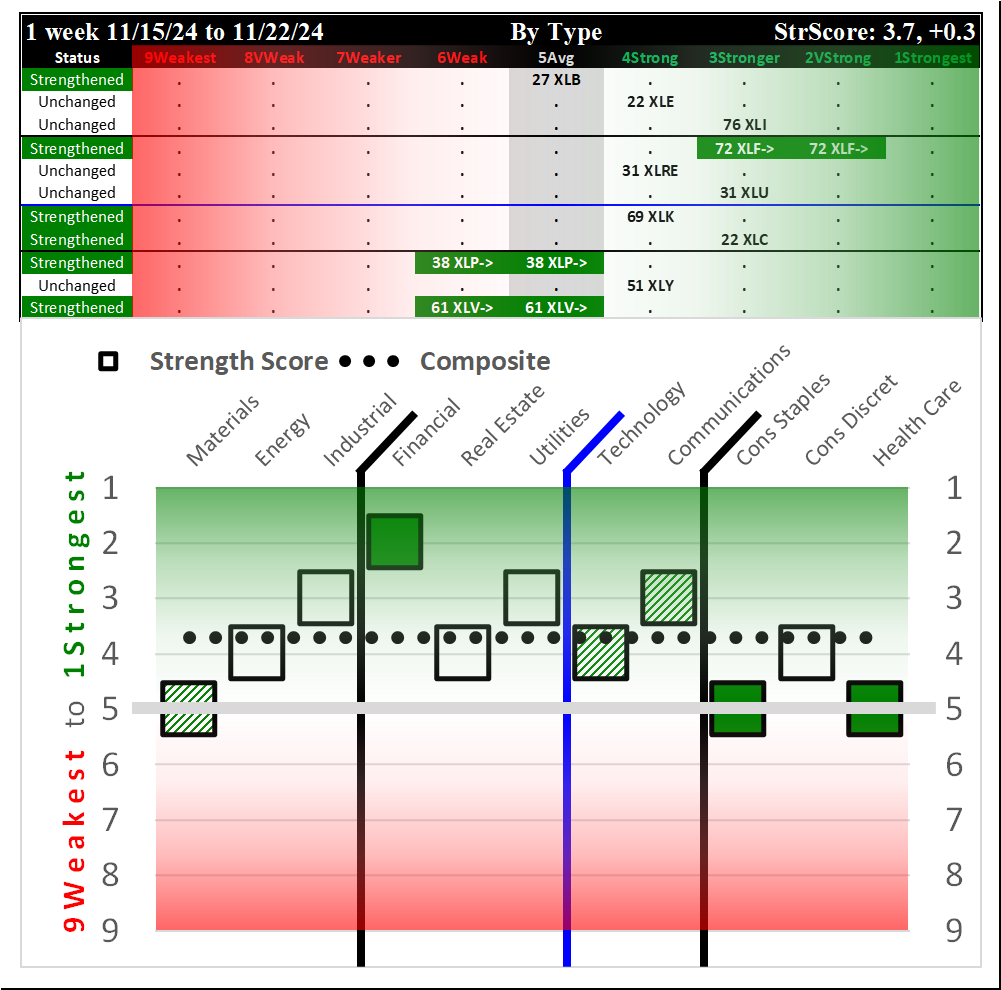
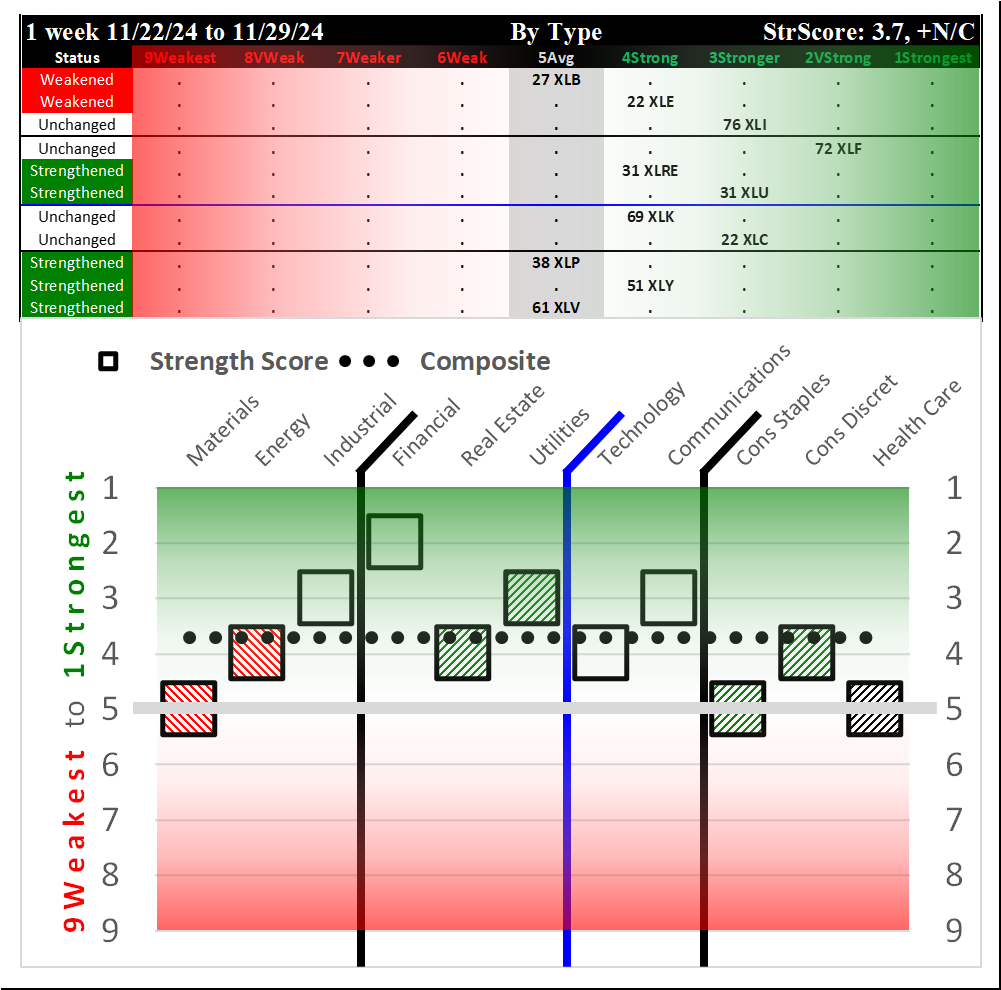
Flat/slightly strengthening bias for the just-completed week ending Friday, 2024-11-29.
Current Status: 3.7 Composite Score, No Change this week
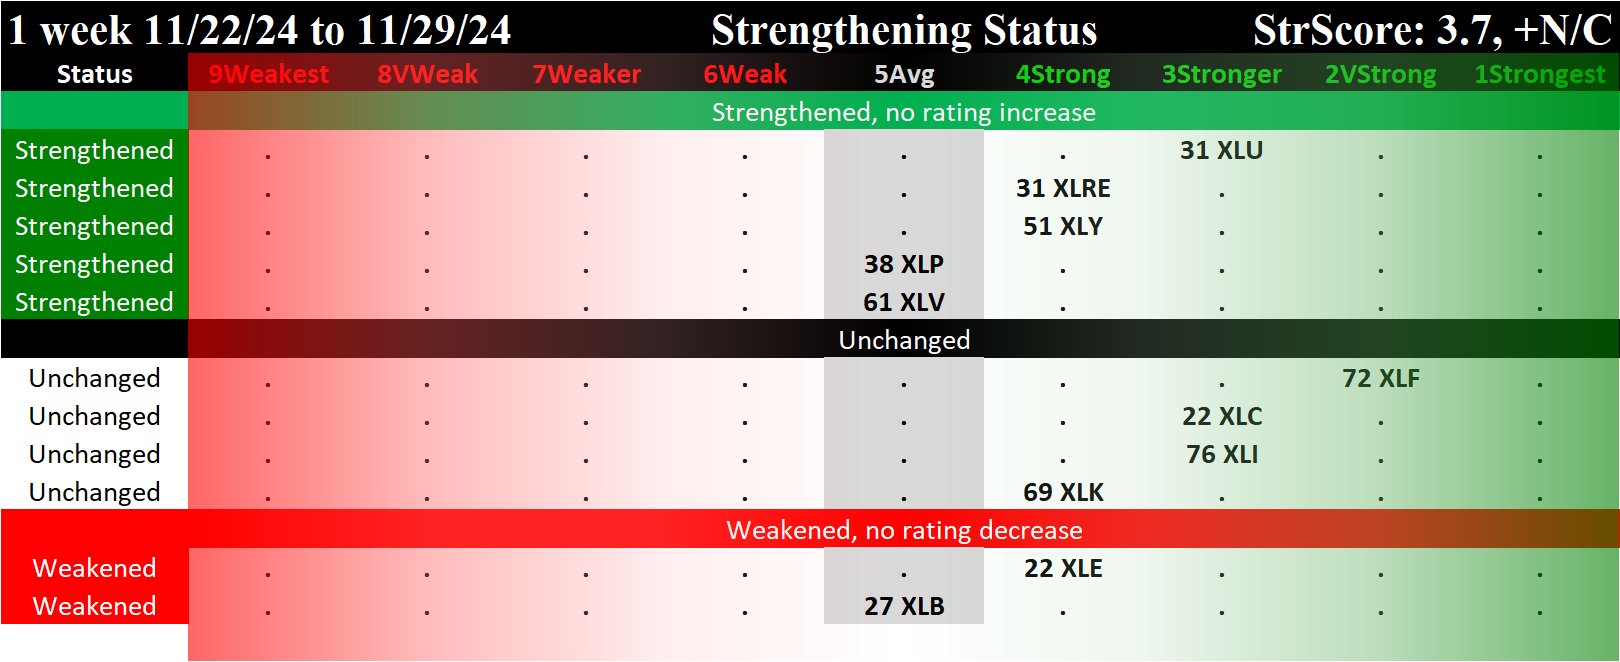
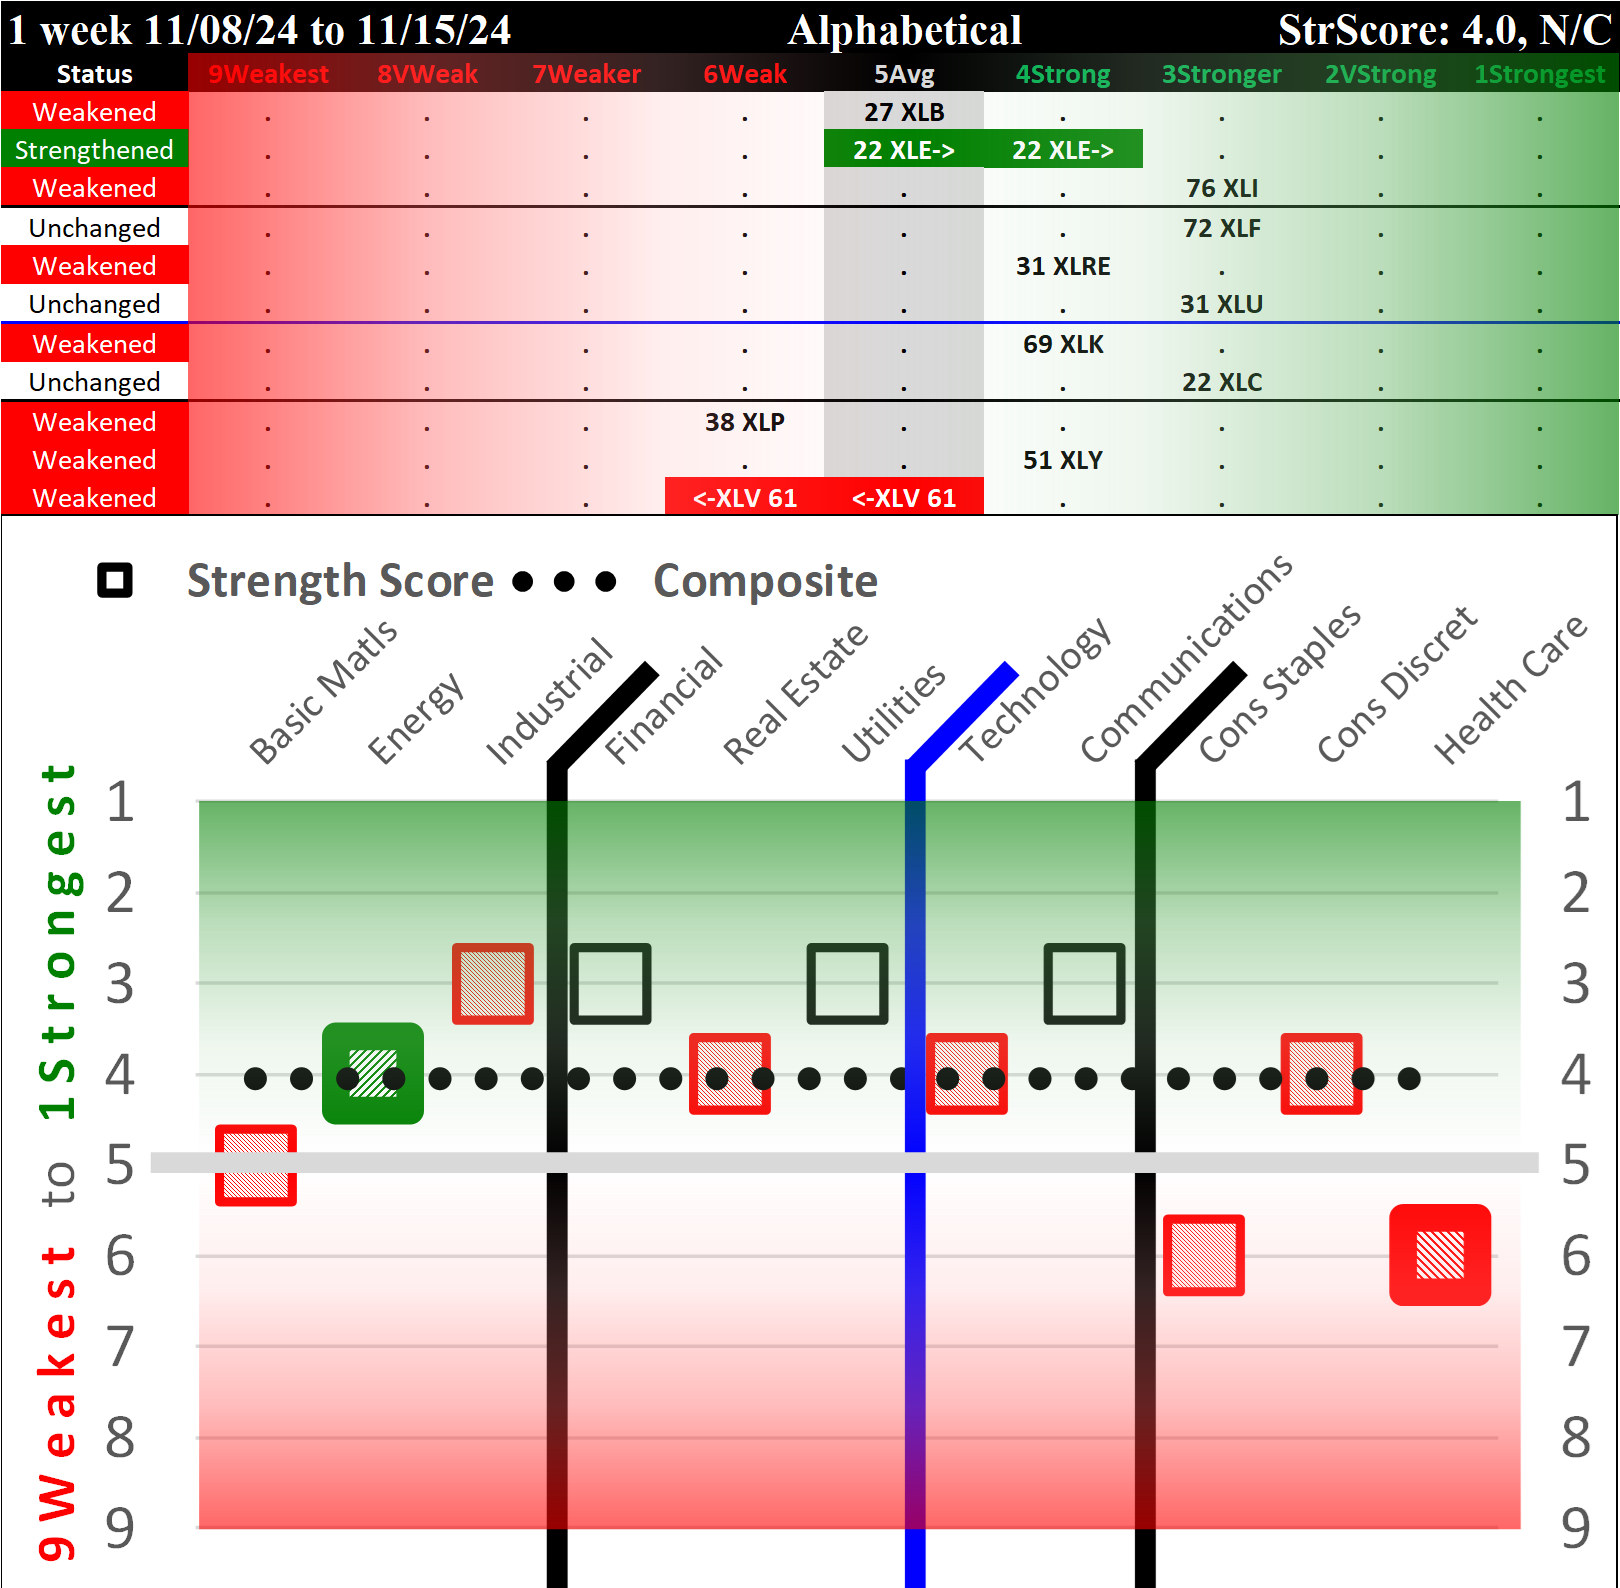
The following spectrum graph Strongest to Weakest shows the composition of the ETF ratings that comprise the current 3.7 composite score, in order of Strength Rating. This is followed by a spectrum graph with the ETFs listed alphabetically.
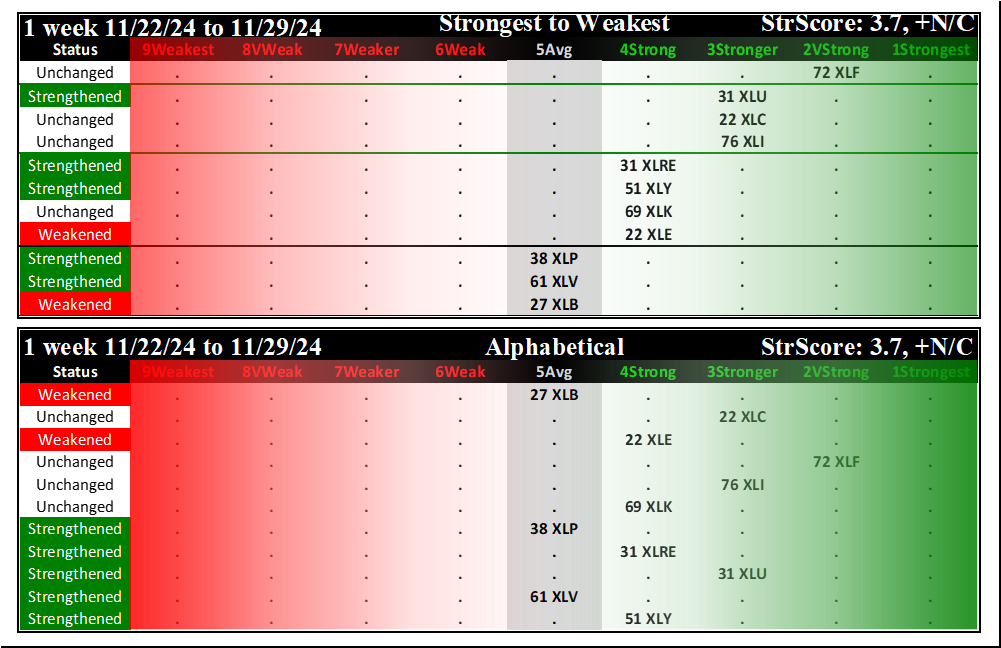
The upper spectrum graph shows the ETFs in decreasing order of Strength Rating and strengthening for the week while the lower spectrum graph is alphabetical. In the upper graphic, sectors with the same rating are listed as follows: first, sectors that strengthened rating during the week; second, sectors with ratings that did not change during the week but did strengthen; third, sectors with ratings that did not change during the week but did weaken; and fourth, sectors which weakened rating during the week. The color-coded lines delineate different ratings - 4Strong or stronger are separated by green lines, 6Weak or weaker are separated by red lines, and 5Average is separated by black lines.
The ETFs are listed below based on their strength rating.
1Strongest
None
2VeryStrong
- XLF/Financial (Unchanged)
3Stronger
- XLU/Utilities (Strengthened)
- XLC/Communications (Unchanged)
- XLI/Industrials (Unchanged)
3.7 - Composite Score
4Strong
- XLRE/Real Estate (Strengthened)
- XLY/Consumer Discretionary (Strengthened)
- XLK/Technology (Unchanged)
- XLE/Energy (Weakened)
5Average
- XLP/Consumer Staples (Strengthened)
- XLV/Healthcare (Strengthened)
- XLB/Basic Materials (Weakened)
6Weak
None
7Weaker
None
8VeryWeak
None
9Weakest
None
Today's Market Context
Key Headlines
"Stocks ride to best month in a year as ‘Red Sweep’ unleashes ‘animal spirits’"
"Super Micro leads S&P 500 losers to cap turbulent month for AI stocks"
"The Dow traded above 45,000 for the first time. It may be time to rethink what makes a milestone."
(Marketwatch)
"Dow jumps nearly 200 points to record in short session, S&P 500 posts best month of 2024"
"Bitcoin heads for nearly 40% November gain as it edges closer to $100,000"
"10-year Treasury yield slides to lowest point since October on holiday-shortened trading day"
(CNBC)
Key Current Readings
SP500: 6,032
Nasdaq: 19,218
Nasdaq 100: 20,930
Russell 2000: 2,435
10Y Treasury: 4.178%
2YT: 4.163%
Oil (WTI Crude): $68.15
Bitcoin: $97,481.79
Dollar Index: 105.78
Gold: $2,660
VIX: 13.51
(CNBC)
Sector ETF Analysis Contents
The following Stock Market Organizer strengthening/weakening analysis looks at the 11 SPDR ETFs and their underlying component stocks for the week ending Friday 2024-11-29, as follows:
- ETFs Summary
1.1 Current Overview
1.2 Historical Summaries - ETFs Detail
2.1 XLB Materials
2.2 XLC Communications
2.3 XLE Energy
2.4 XLF Financials
2.5 XLI Industrials
2.6 XLK Technology
2.7 XLP Consumer Staples
2.8 XLRE Real Estate
2.9 XLU Utilities
2.10 XLV Health Care
2.11 XLY Consumer Discretionary - Stock Detail (downloads)
1. ETFs Summary
1.1 Current Overview
The following graphs reflect the composition of each of the ETFs based on their underlying stock strength ratings which range from 1Strongest to 9Weakest. Since I only care about the strongest and weakest in each sector, stocks rated from 2VeryStrong through 8VeryWeak are categorized as "Ignore."
- Top row: XLB/Basic Materials, XLE/Energy, and XLI/Industrials
- Second row: interest rate-sensitive ETFs XLF/Financials, XLRE/Real Estate, and XLU/Utilities
- Third row: XLK/Technology and XLC/Communications
- Bottom row: XLP/Consumer Staples, XLY/Consumer Discretionary, and XLV/Healthcare
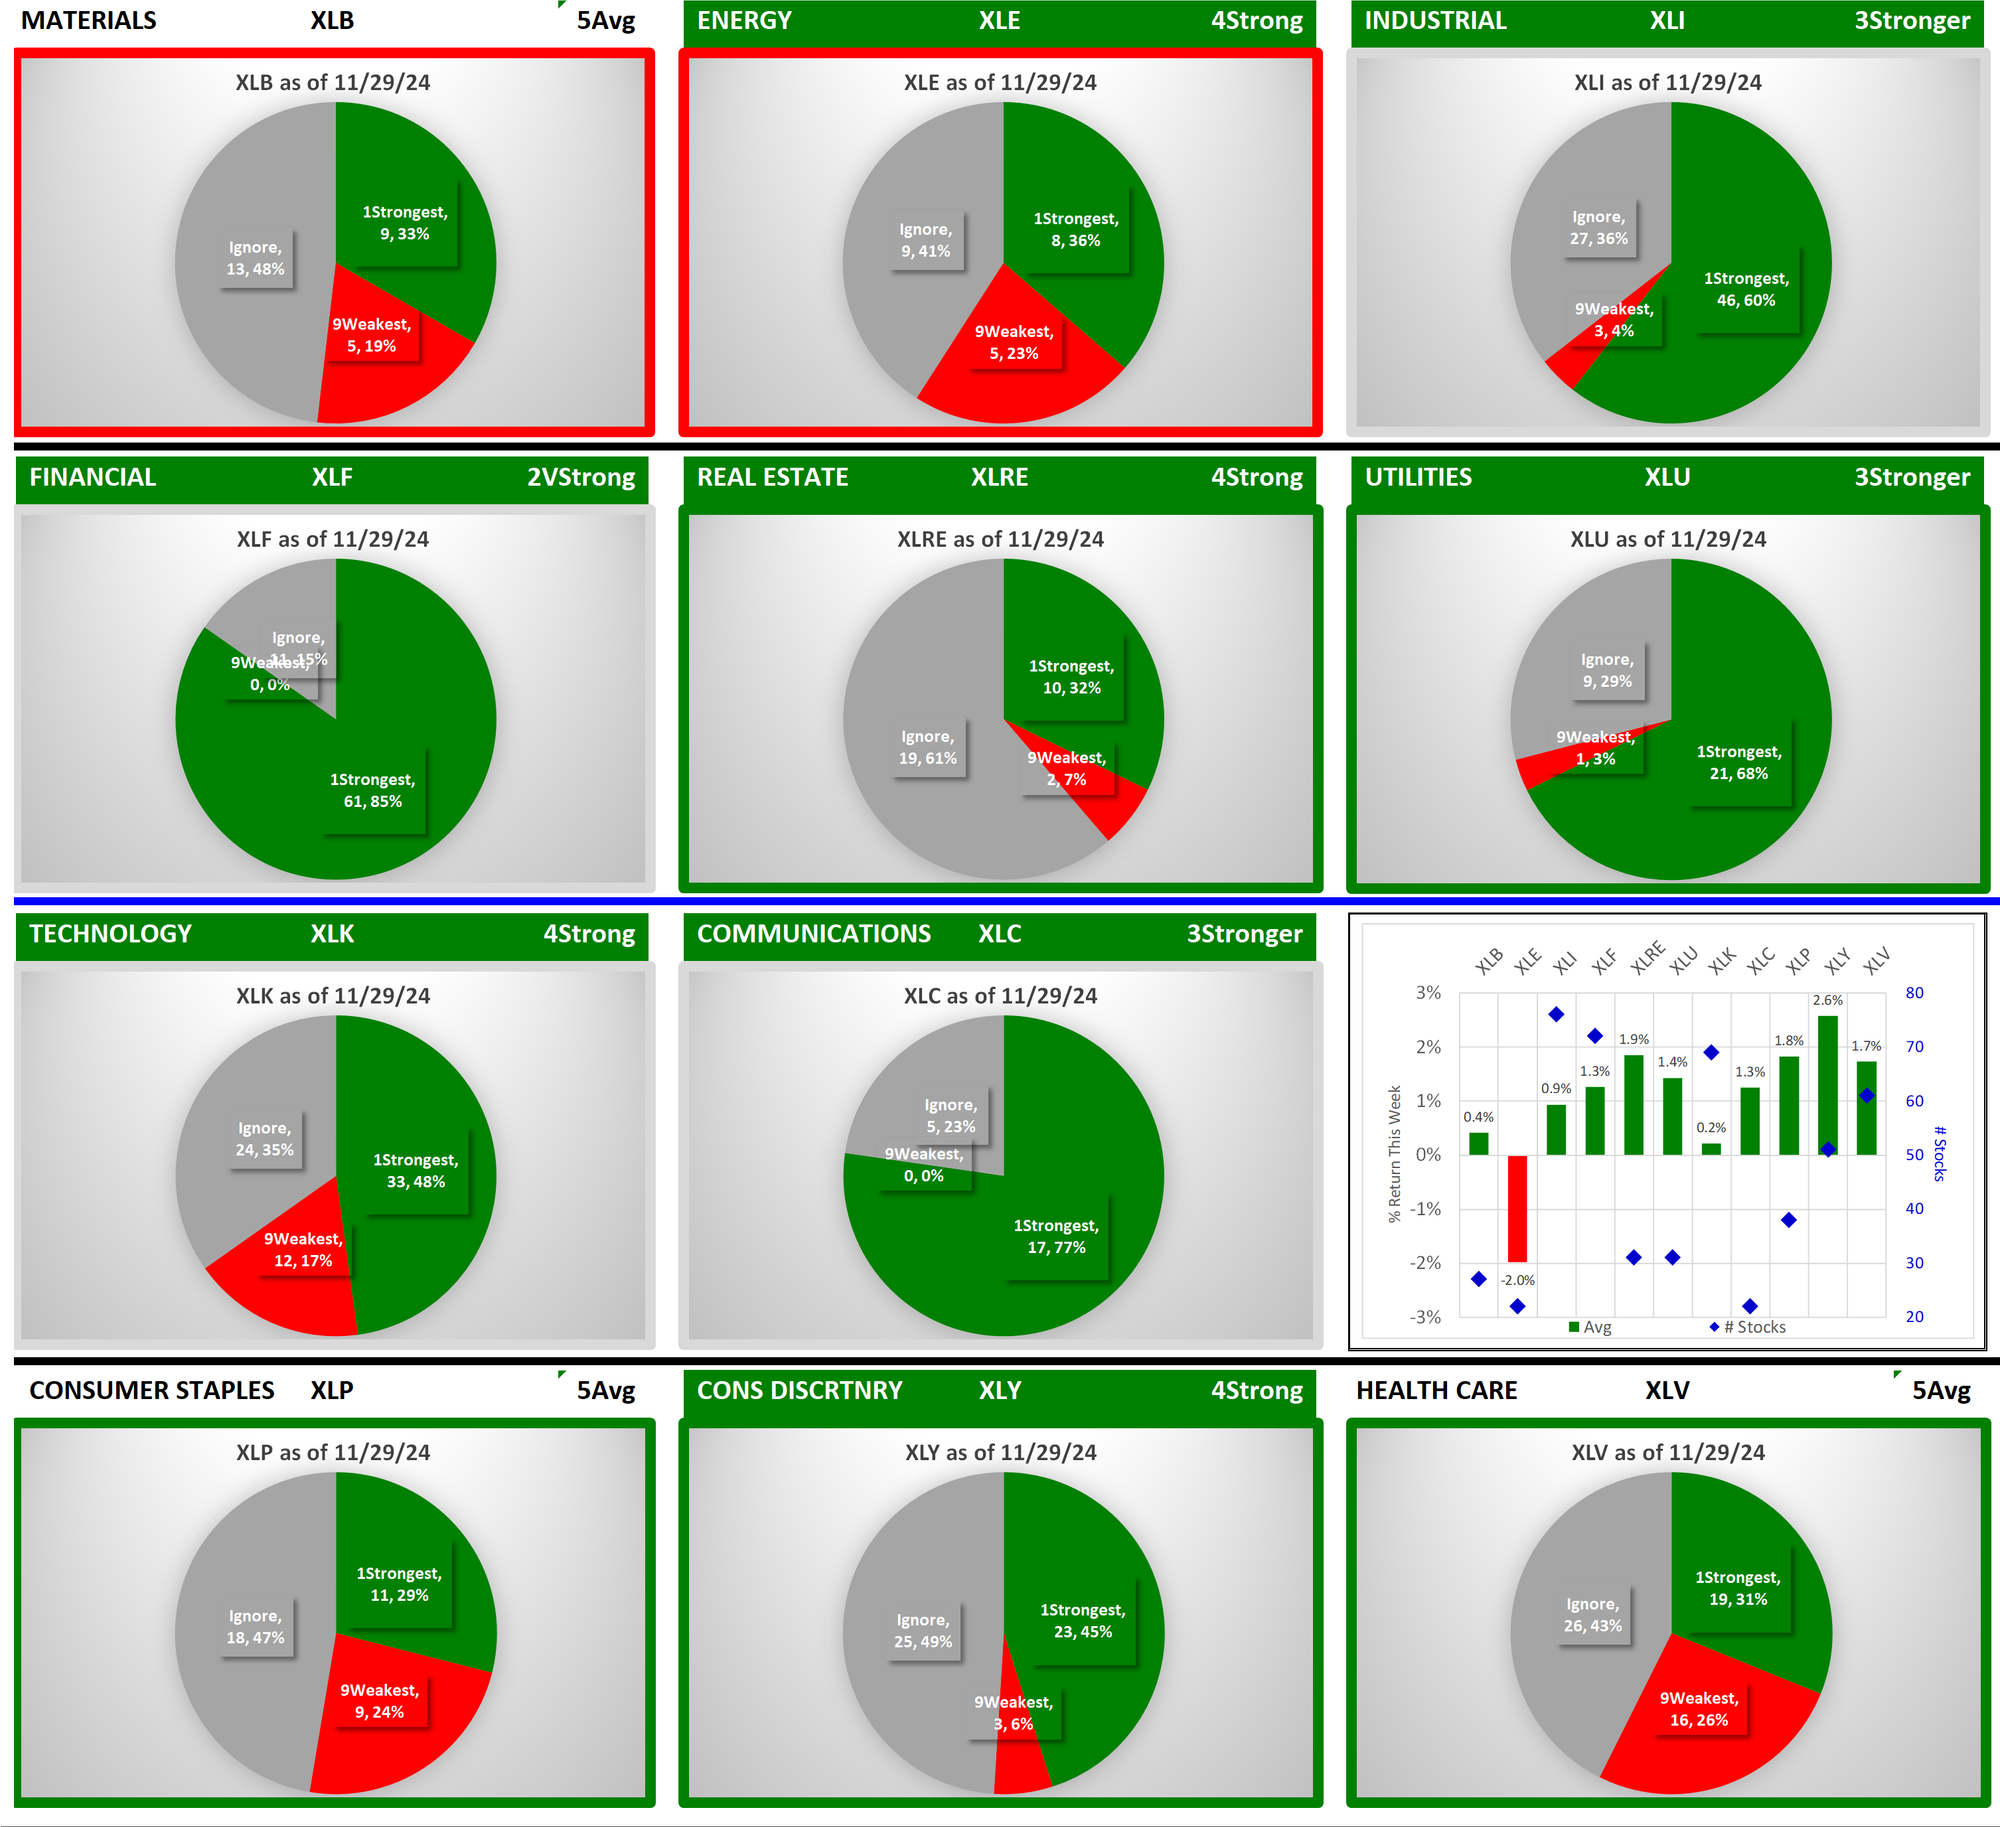
The headers for each graphic are color-coded. ETFs rated 4Strong or better have green headings - currently, 8 of 11 ETFs qualify. The weakest ETFs XLB/Materials, XLP/Consumer Staples, and XLY/Healthcare have 5Average ratings - a reflection of overall market strength. ETFs that changed rating this week have thick green or red borders. ETFs that strengthened or weakened but did not change rating have thin green or red borders.
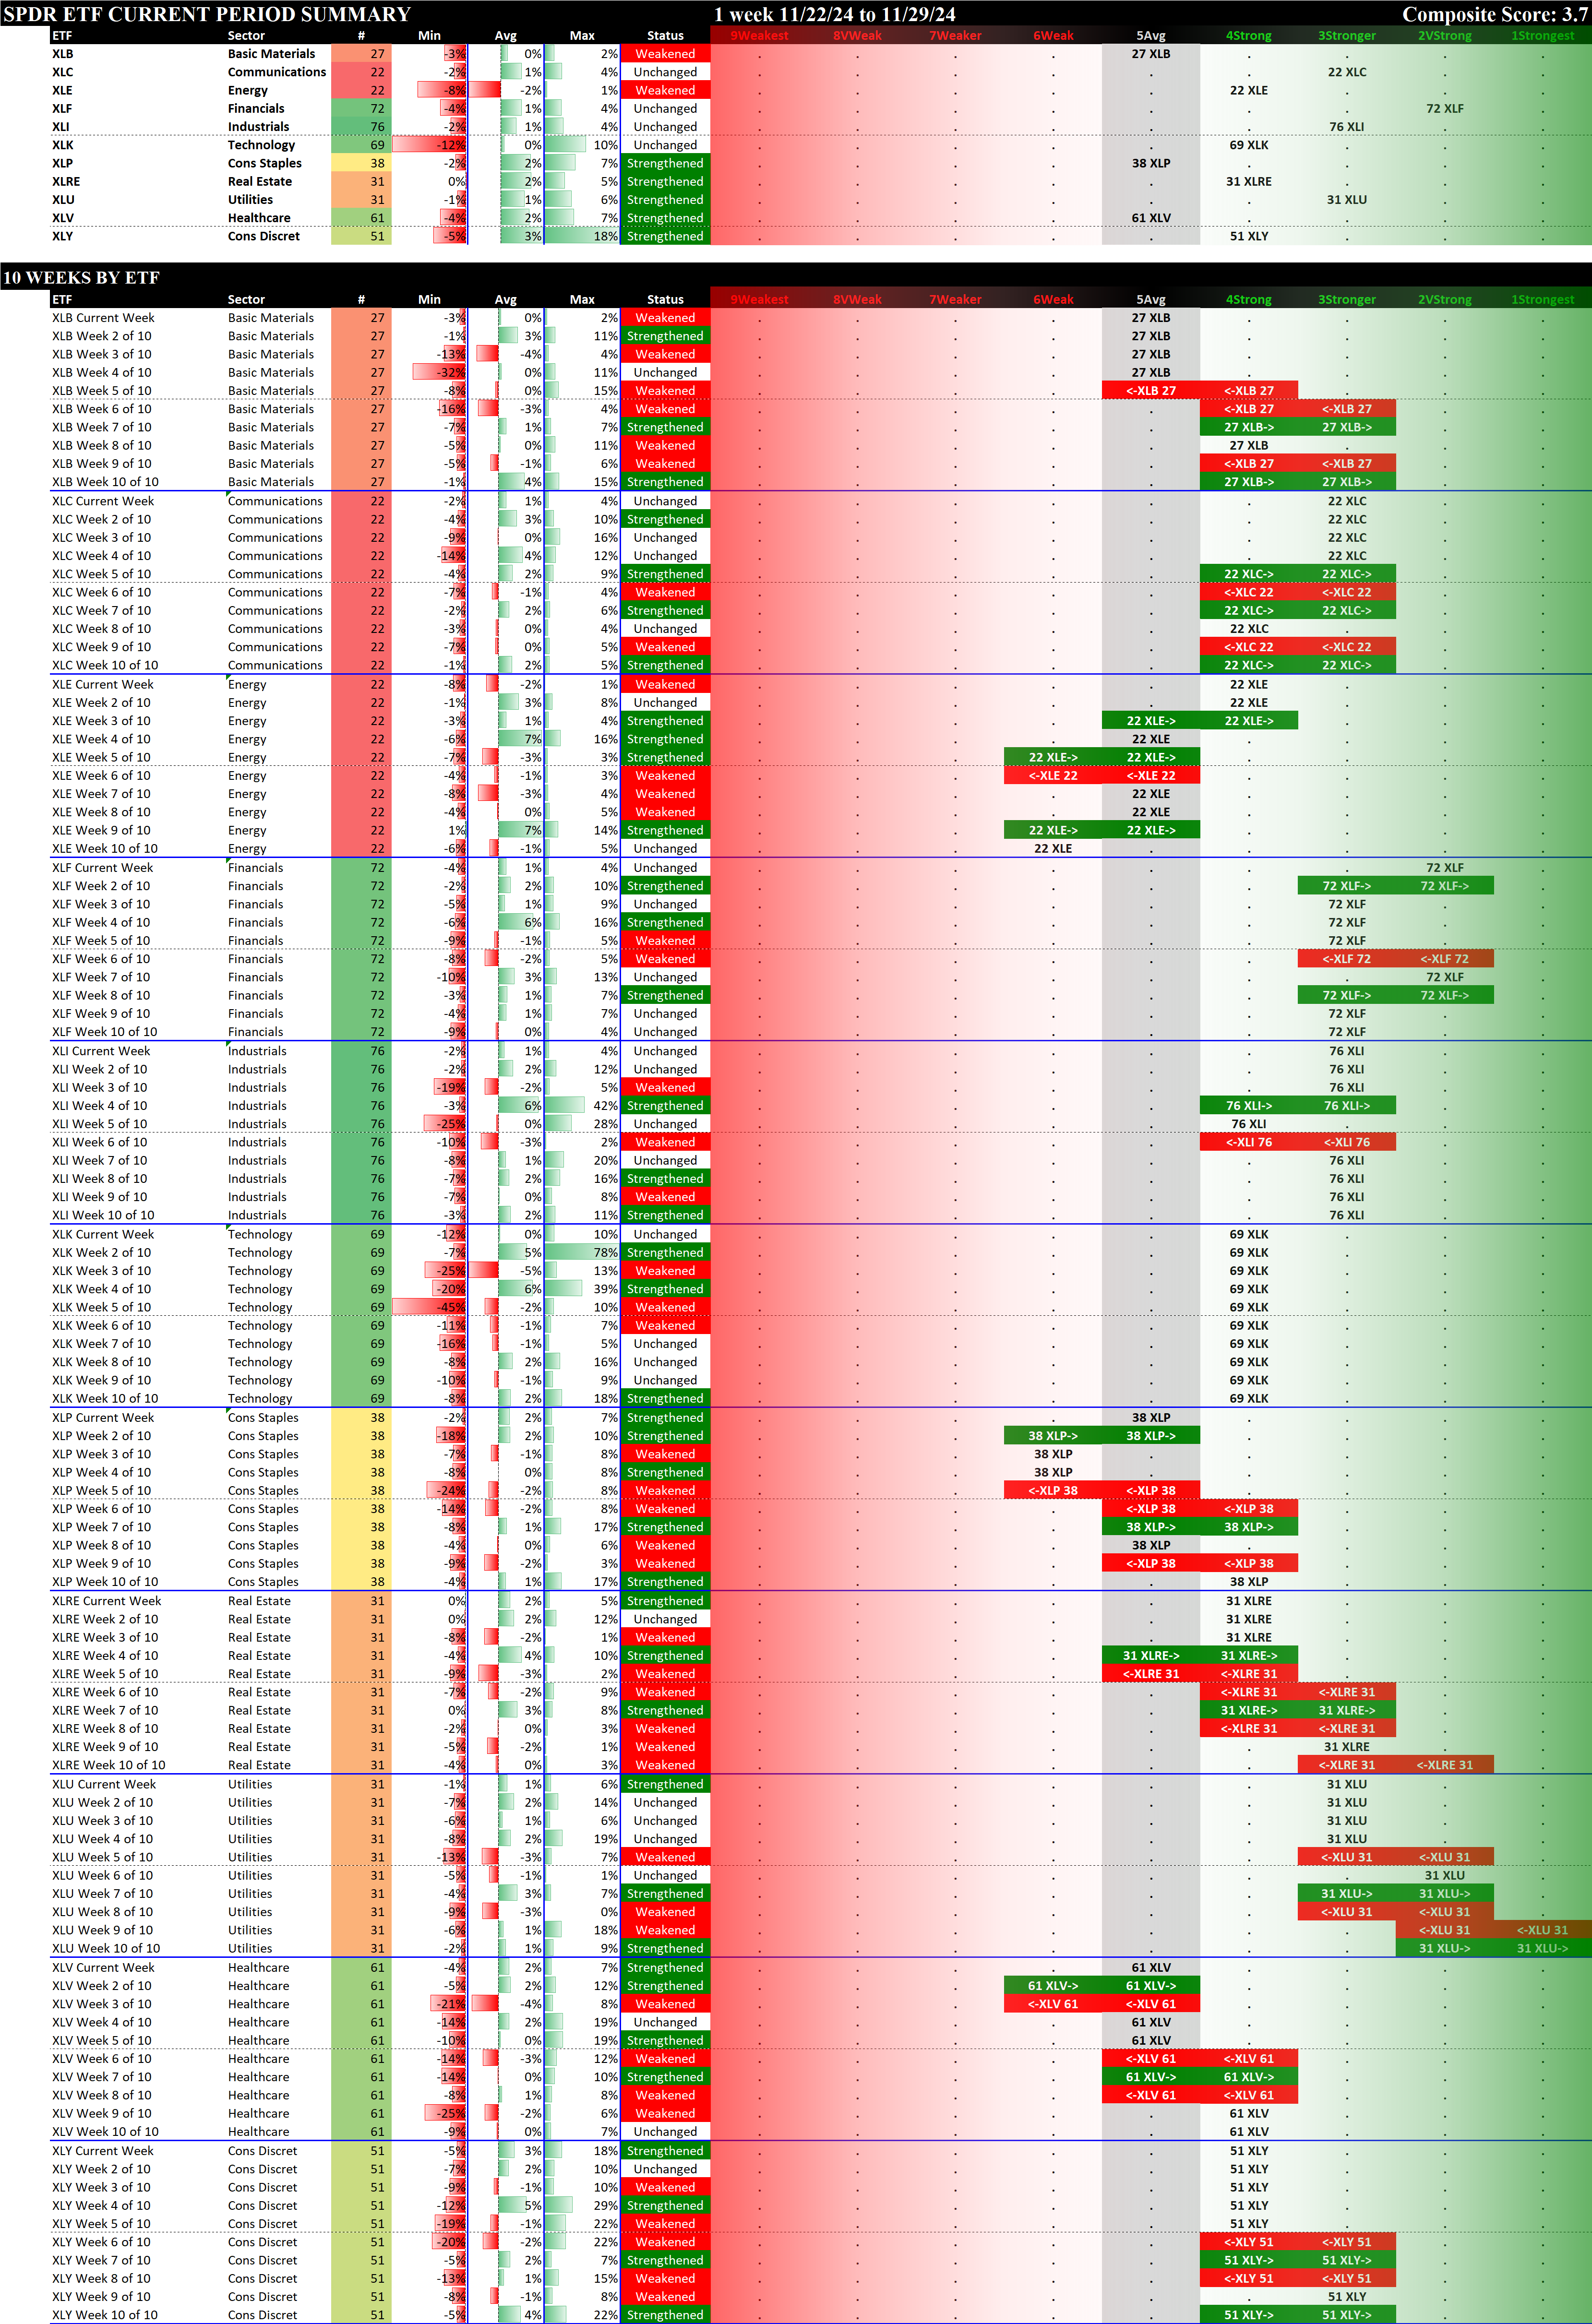
1.2 Historical Summaries
Below are 10-week historical strength rating summaries of the ETFs, sorted first by ETF and then by Week. The graphics make it easy to compare strengthening and weakening between ETFs over the most recent 10 weeks.
Sorted by ETF
This graphic shows the past 10 weeks strengthening and weakening segregated by ETF.
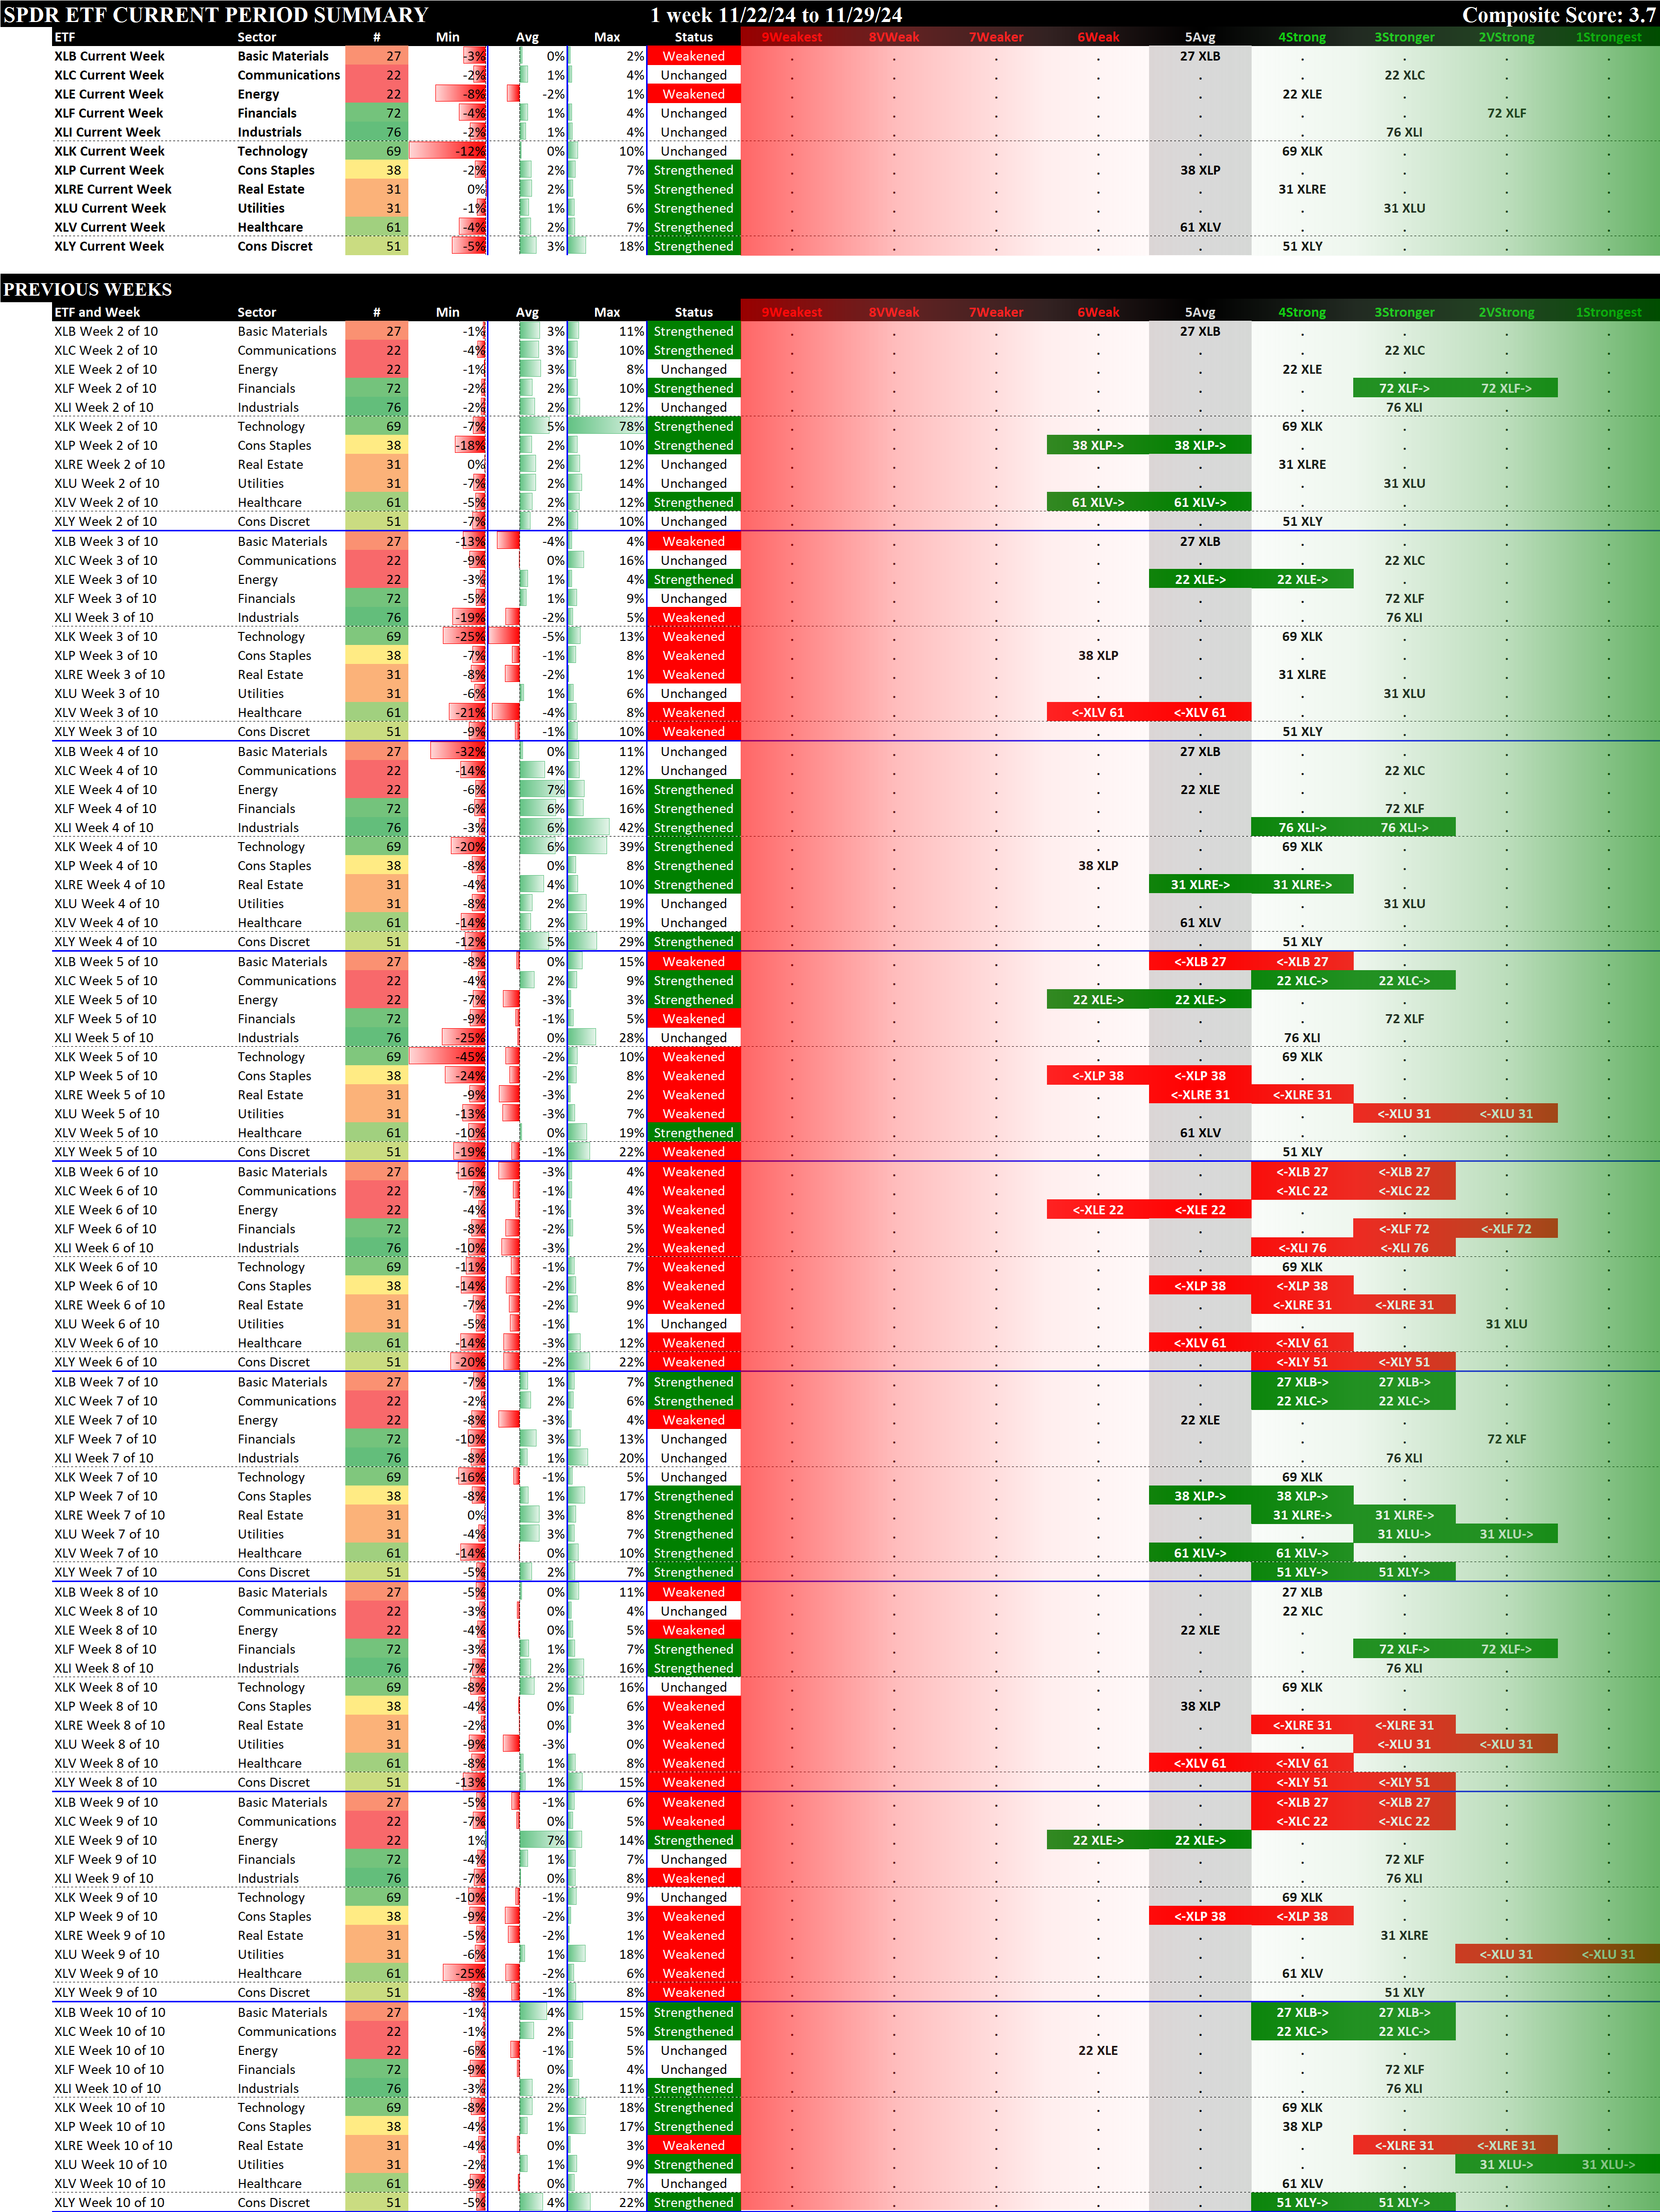
Sorted by Week
This graphic shows the past 10 weeks strengthening and weakening segregated by week.
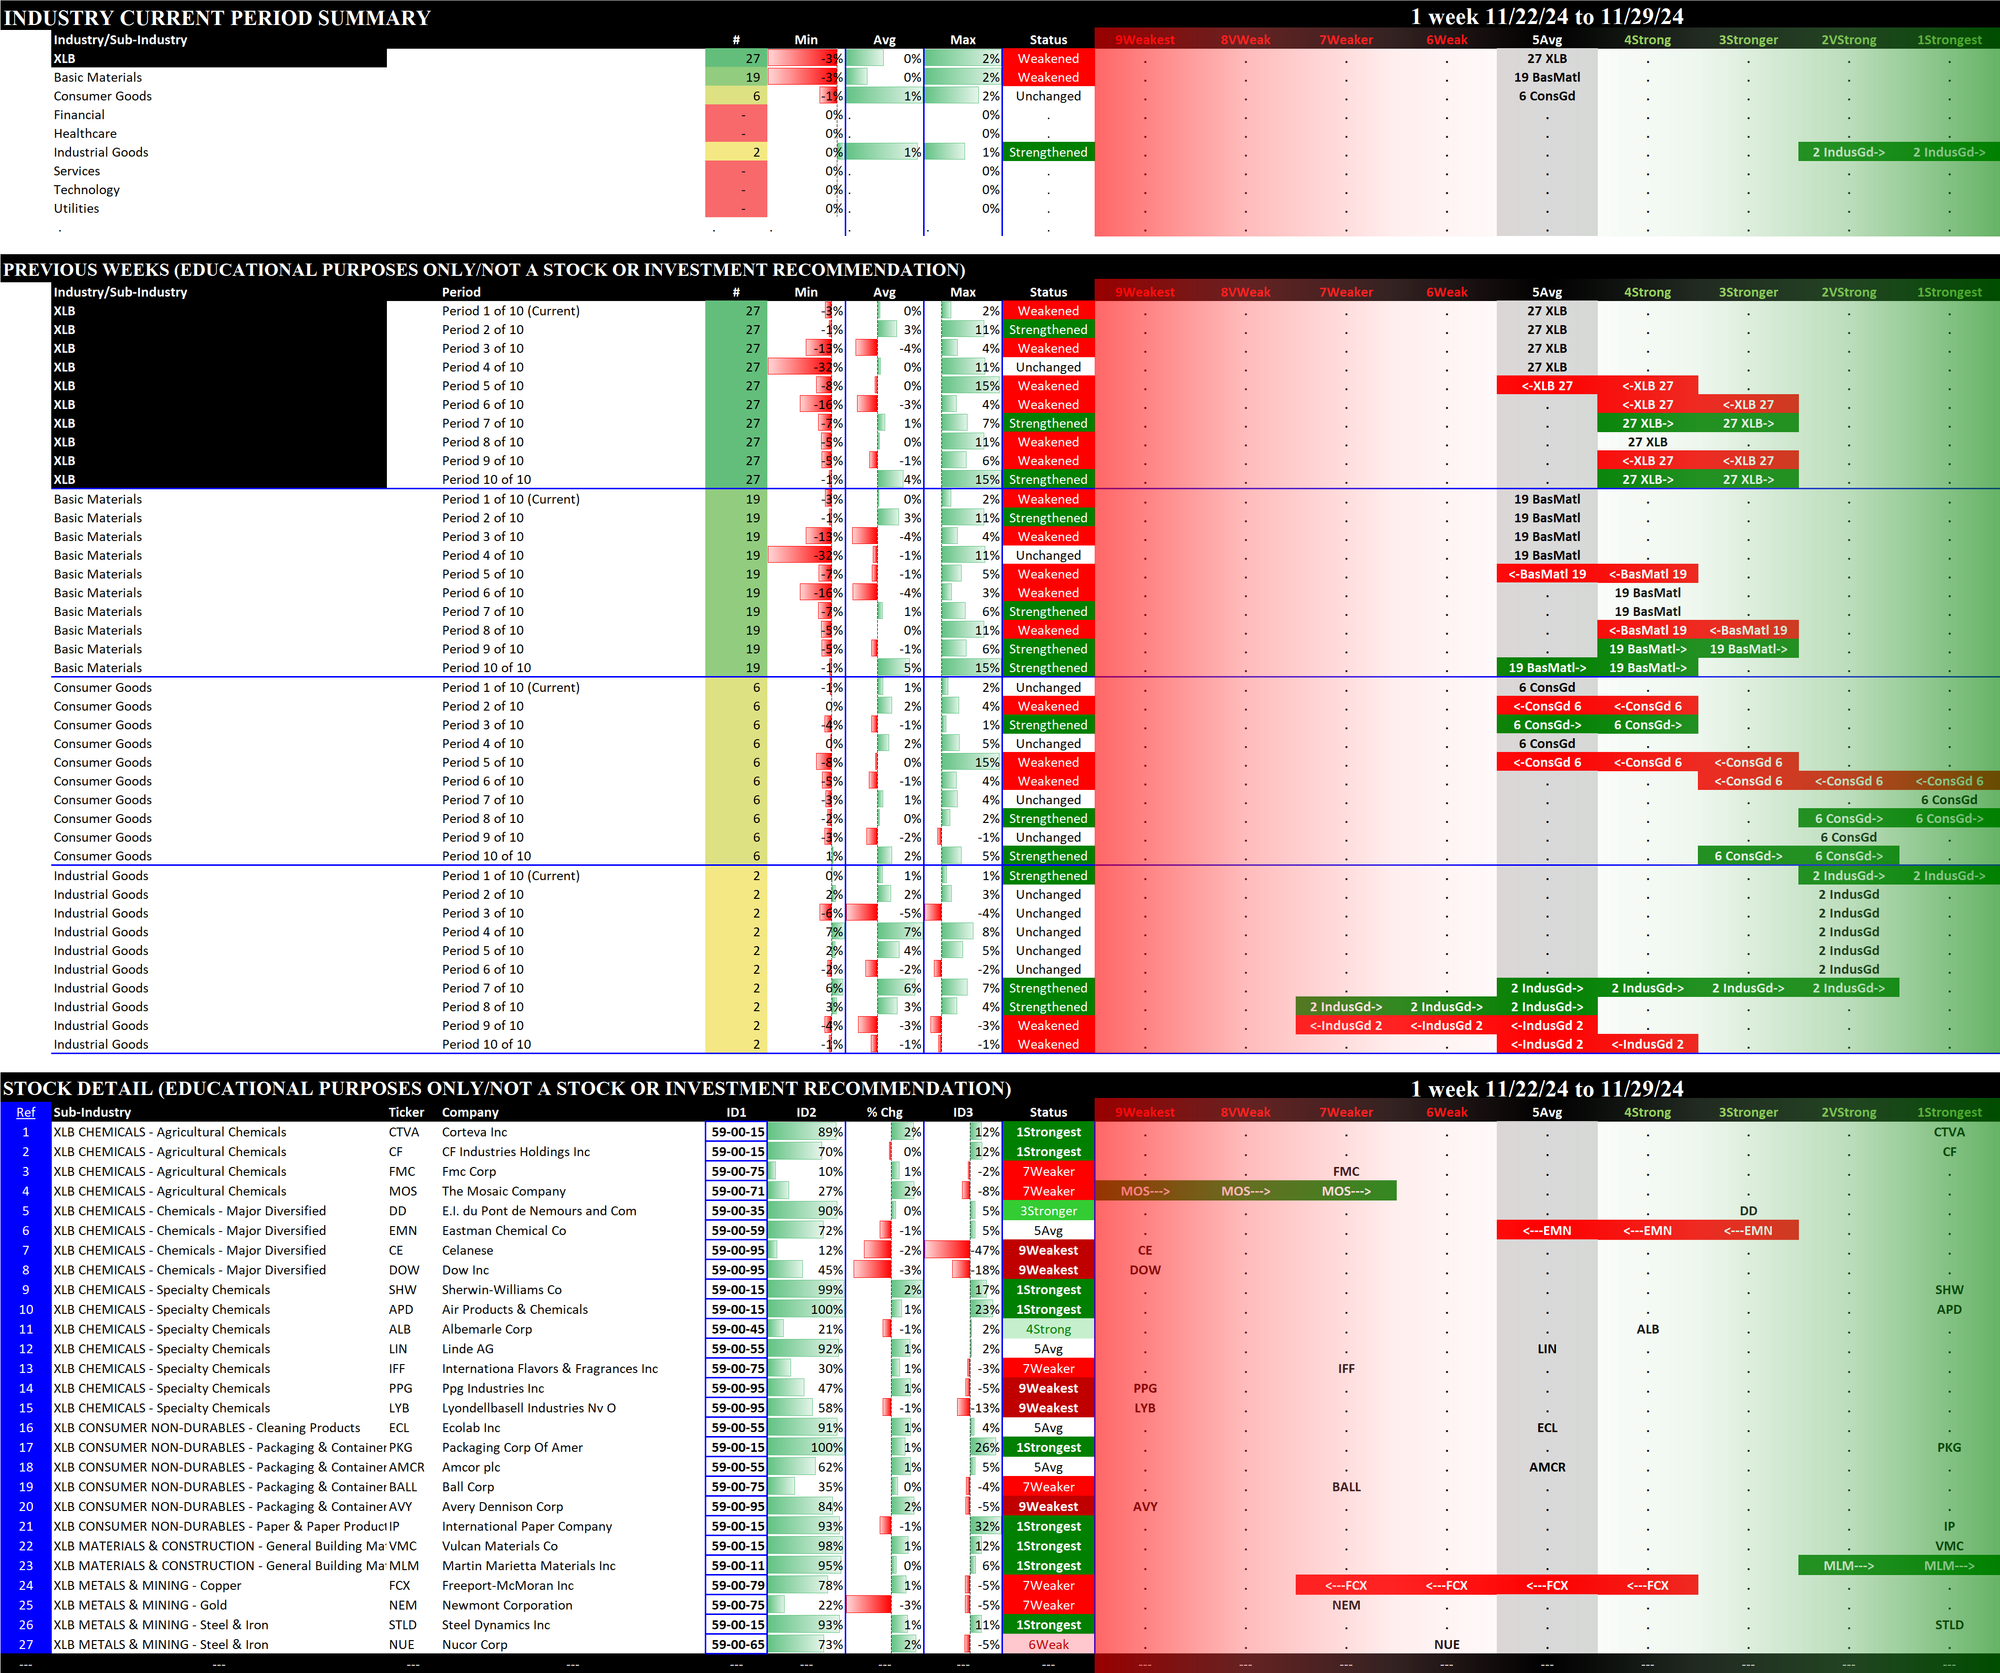
2. ETFs Detail
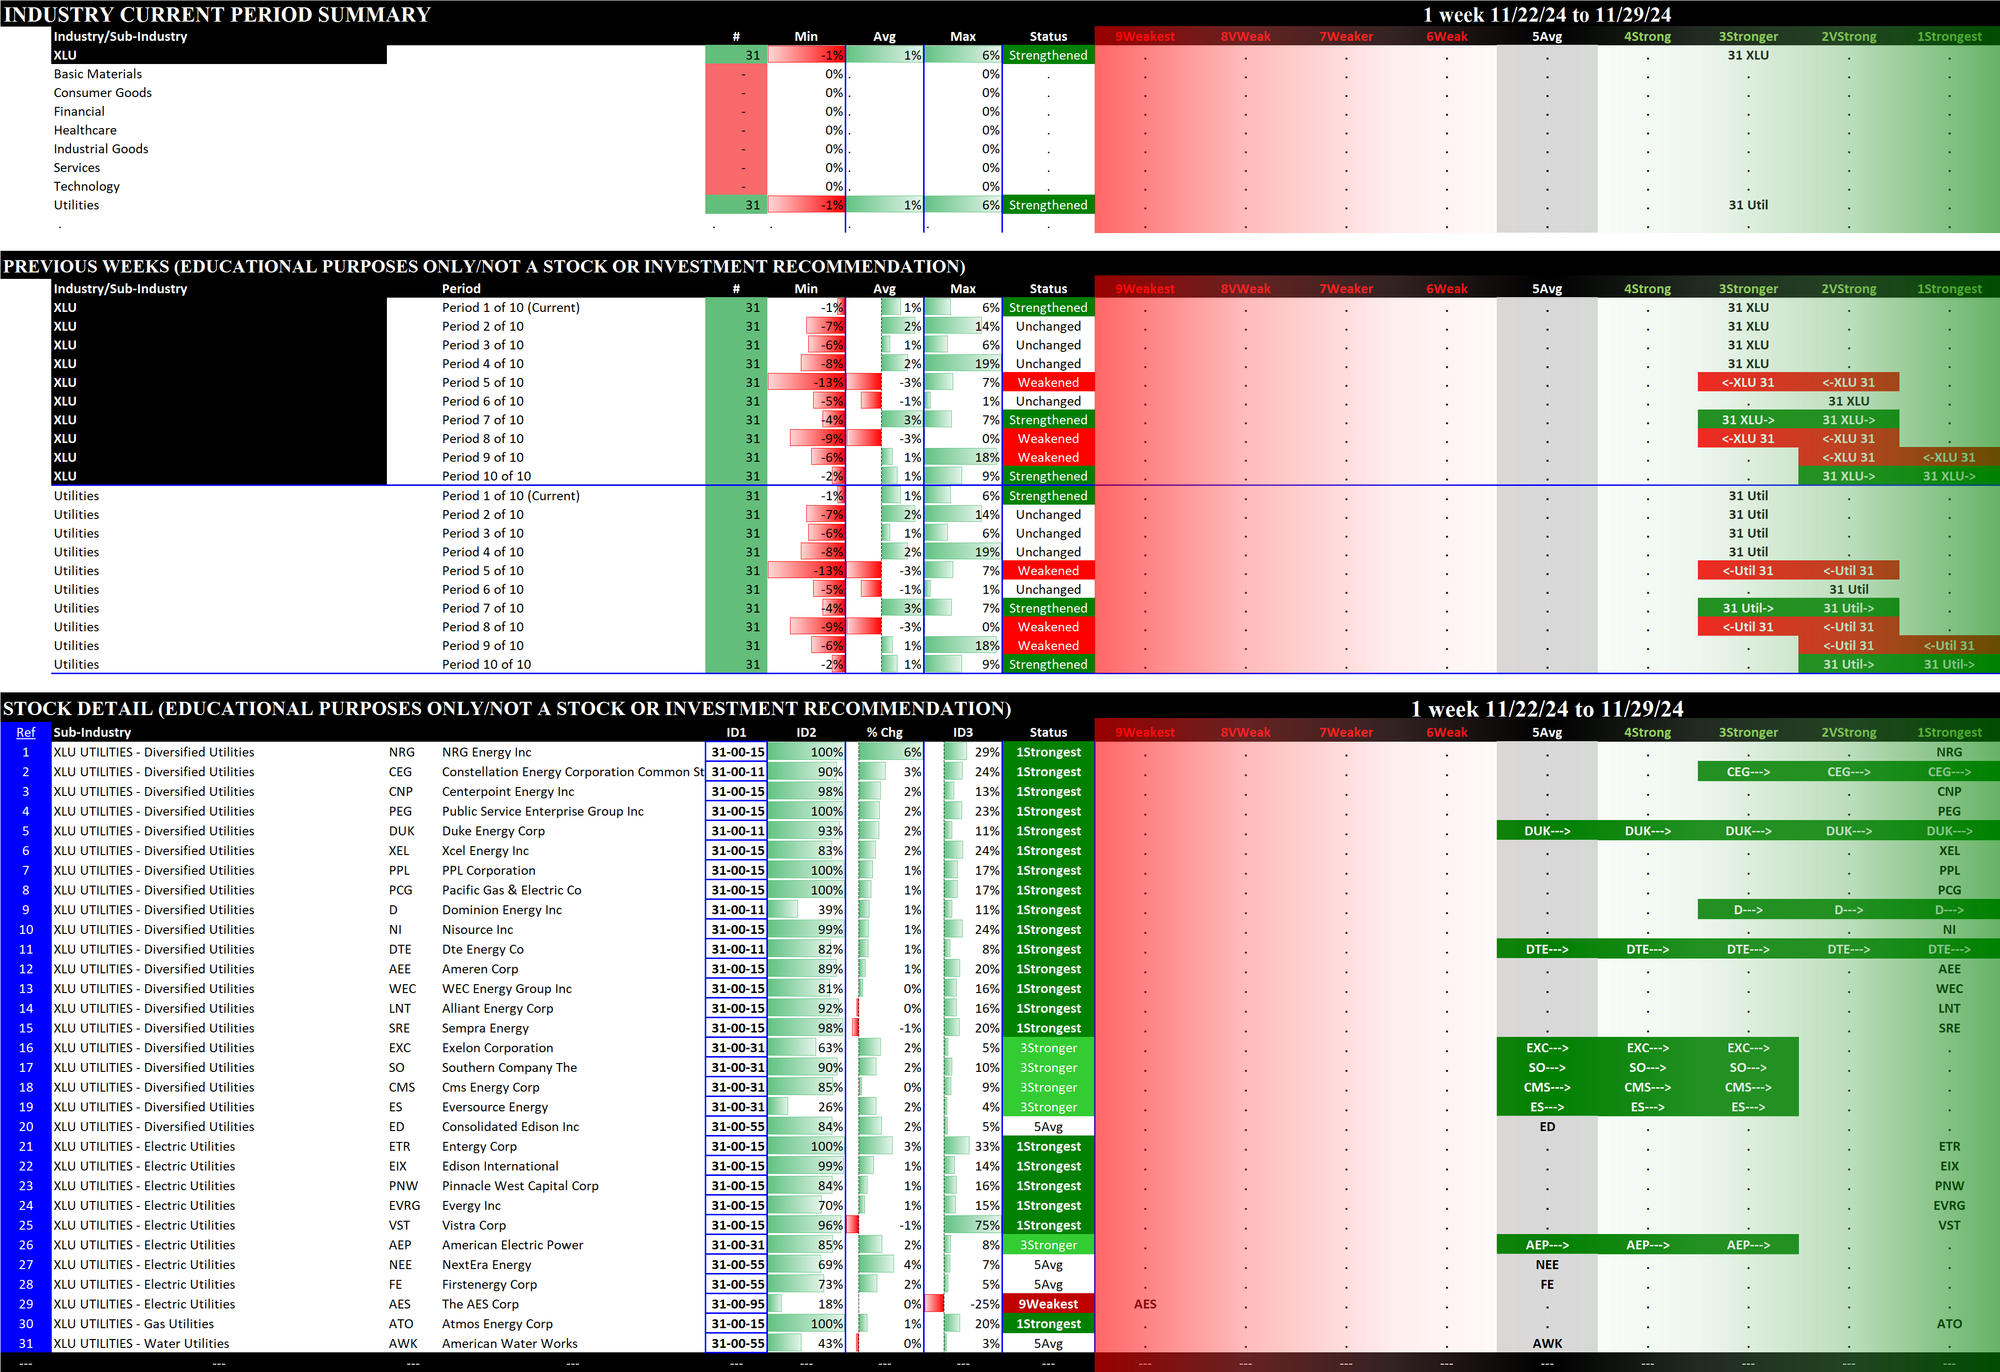
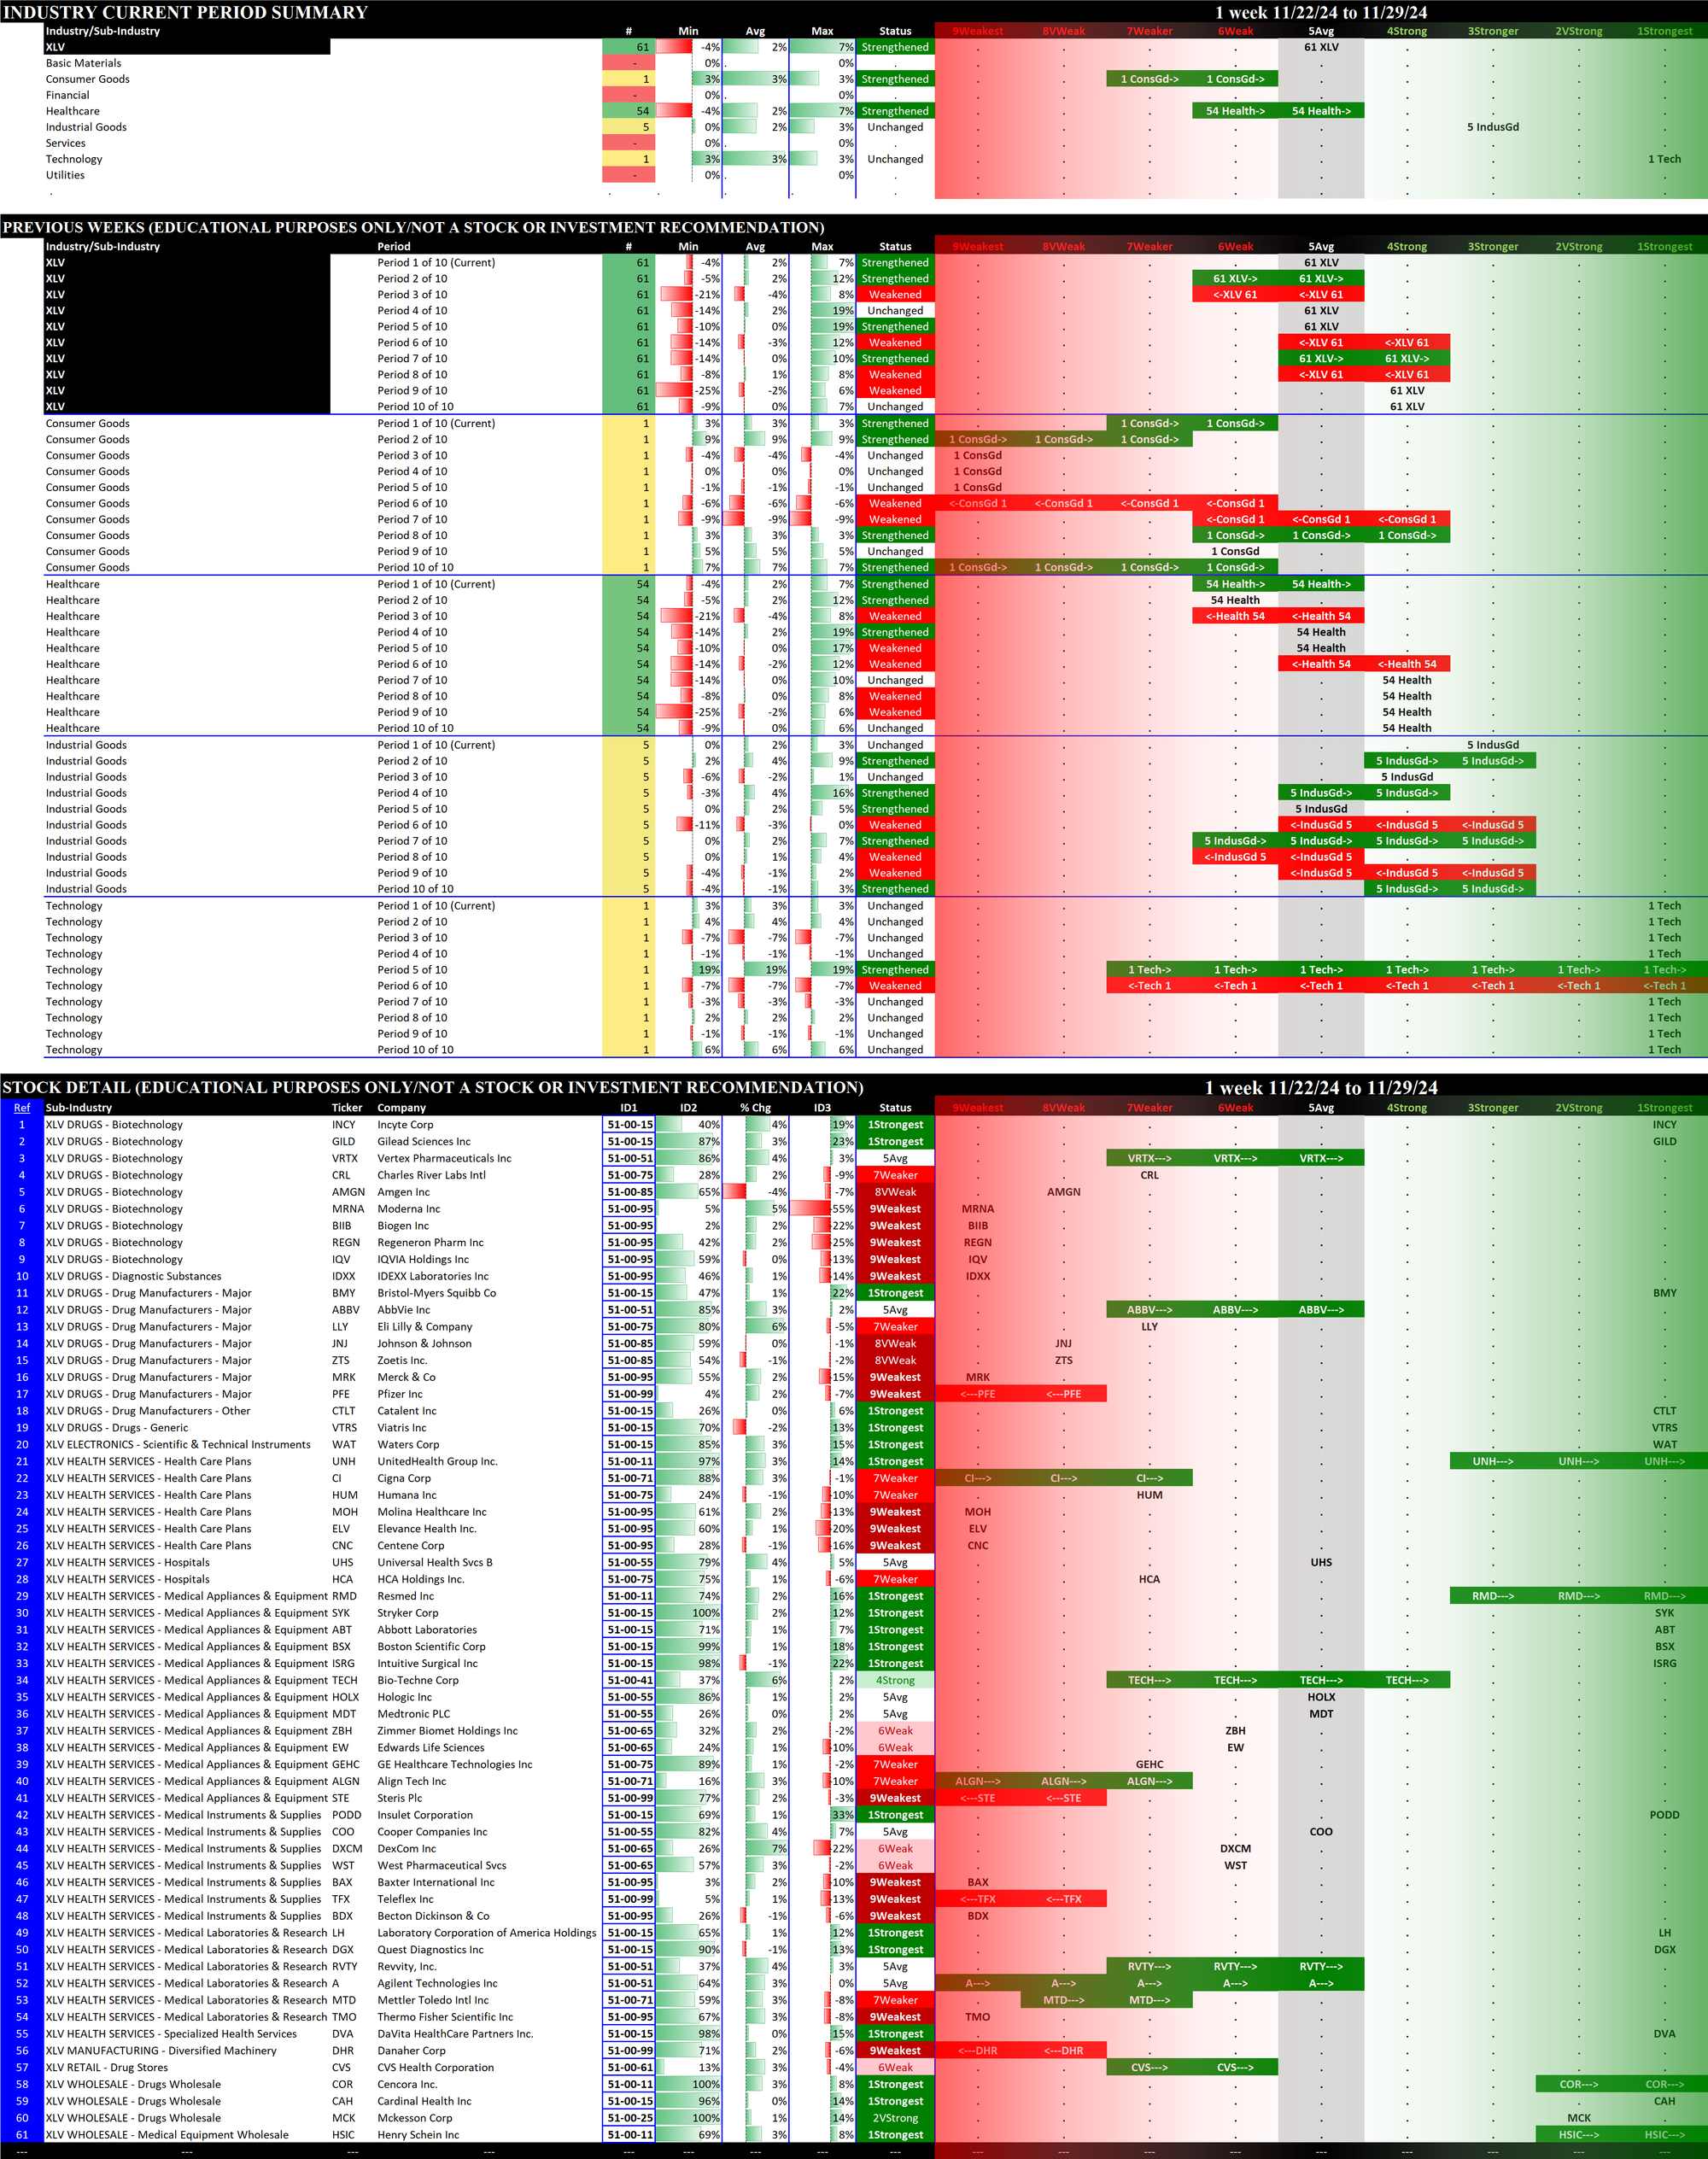
Details for each of the 11 ETFs are provided below. Comments:
- The top section shows the strength rating of the sectors comprising each ETF, based on the eight original Stock Market Organizer classifications and NOT the 11 ETF classifications. For example, the XLB Basic Materials ETF consists of 19 Basic Materials stocks, 6 Consumer Goods stocks, and 2 Industrial Goods stocks.
- The middle section shows the previous 10 weeks' strengthening and weakening of the relevant sectors. For example, since the XLB has Basic Materials, Consumer Goods, and Industrial Goods stocks, these three sectors are shown in the middle section of the XLB detail. The XLF (Financial) has Financial, Services, and Tech stocks.
- The bottom section shows strengthening/weakening for the underlying ETF components stocks, and includes the listing of their Stock Market Organizer industries and sub-industries. These stocks are listed in order based on Sub-industry then strongest to weakest comparative stock strength rating. The Basic Materials XLB ETF includes both Newmont Corporation/NEM in the Gold sub-industry within the Metals & Mining industry and Dow Inc./DOW in the Specialty Chemicals sub-industry within the Chemicals industry.
In these bottom sections, one can visually see the strength/strengthening and weakness/weakening of the component stocks in each ETF.
2.1 XLB Materials (27 stocks, small), Weakened at 5Avg = tied for WORST
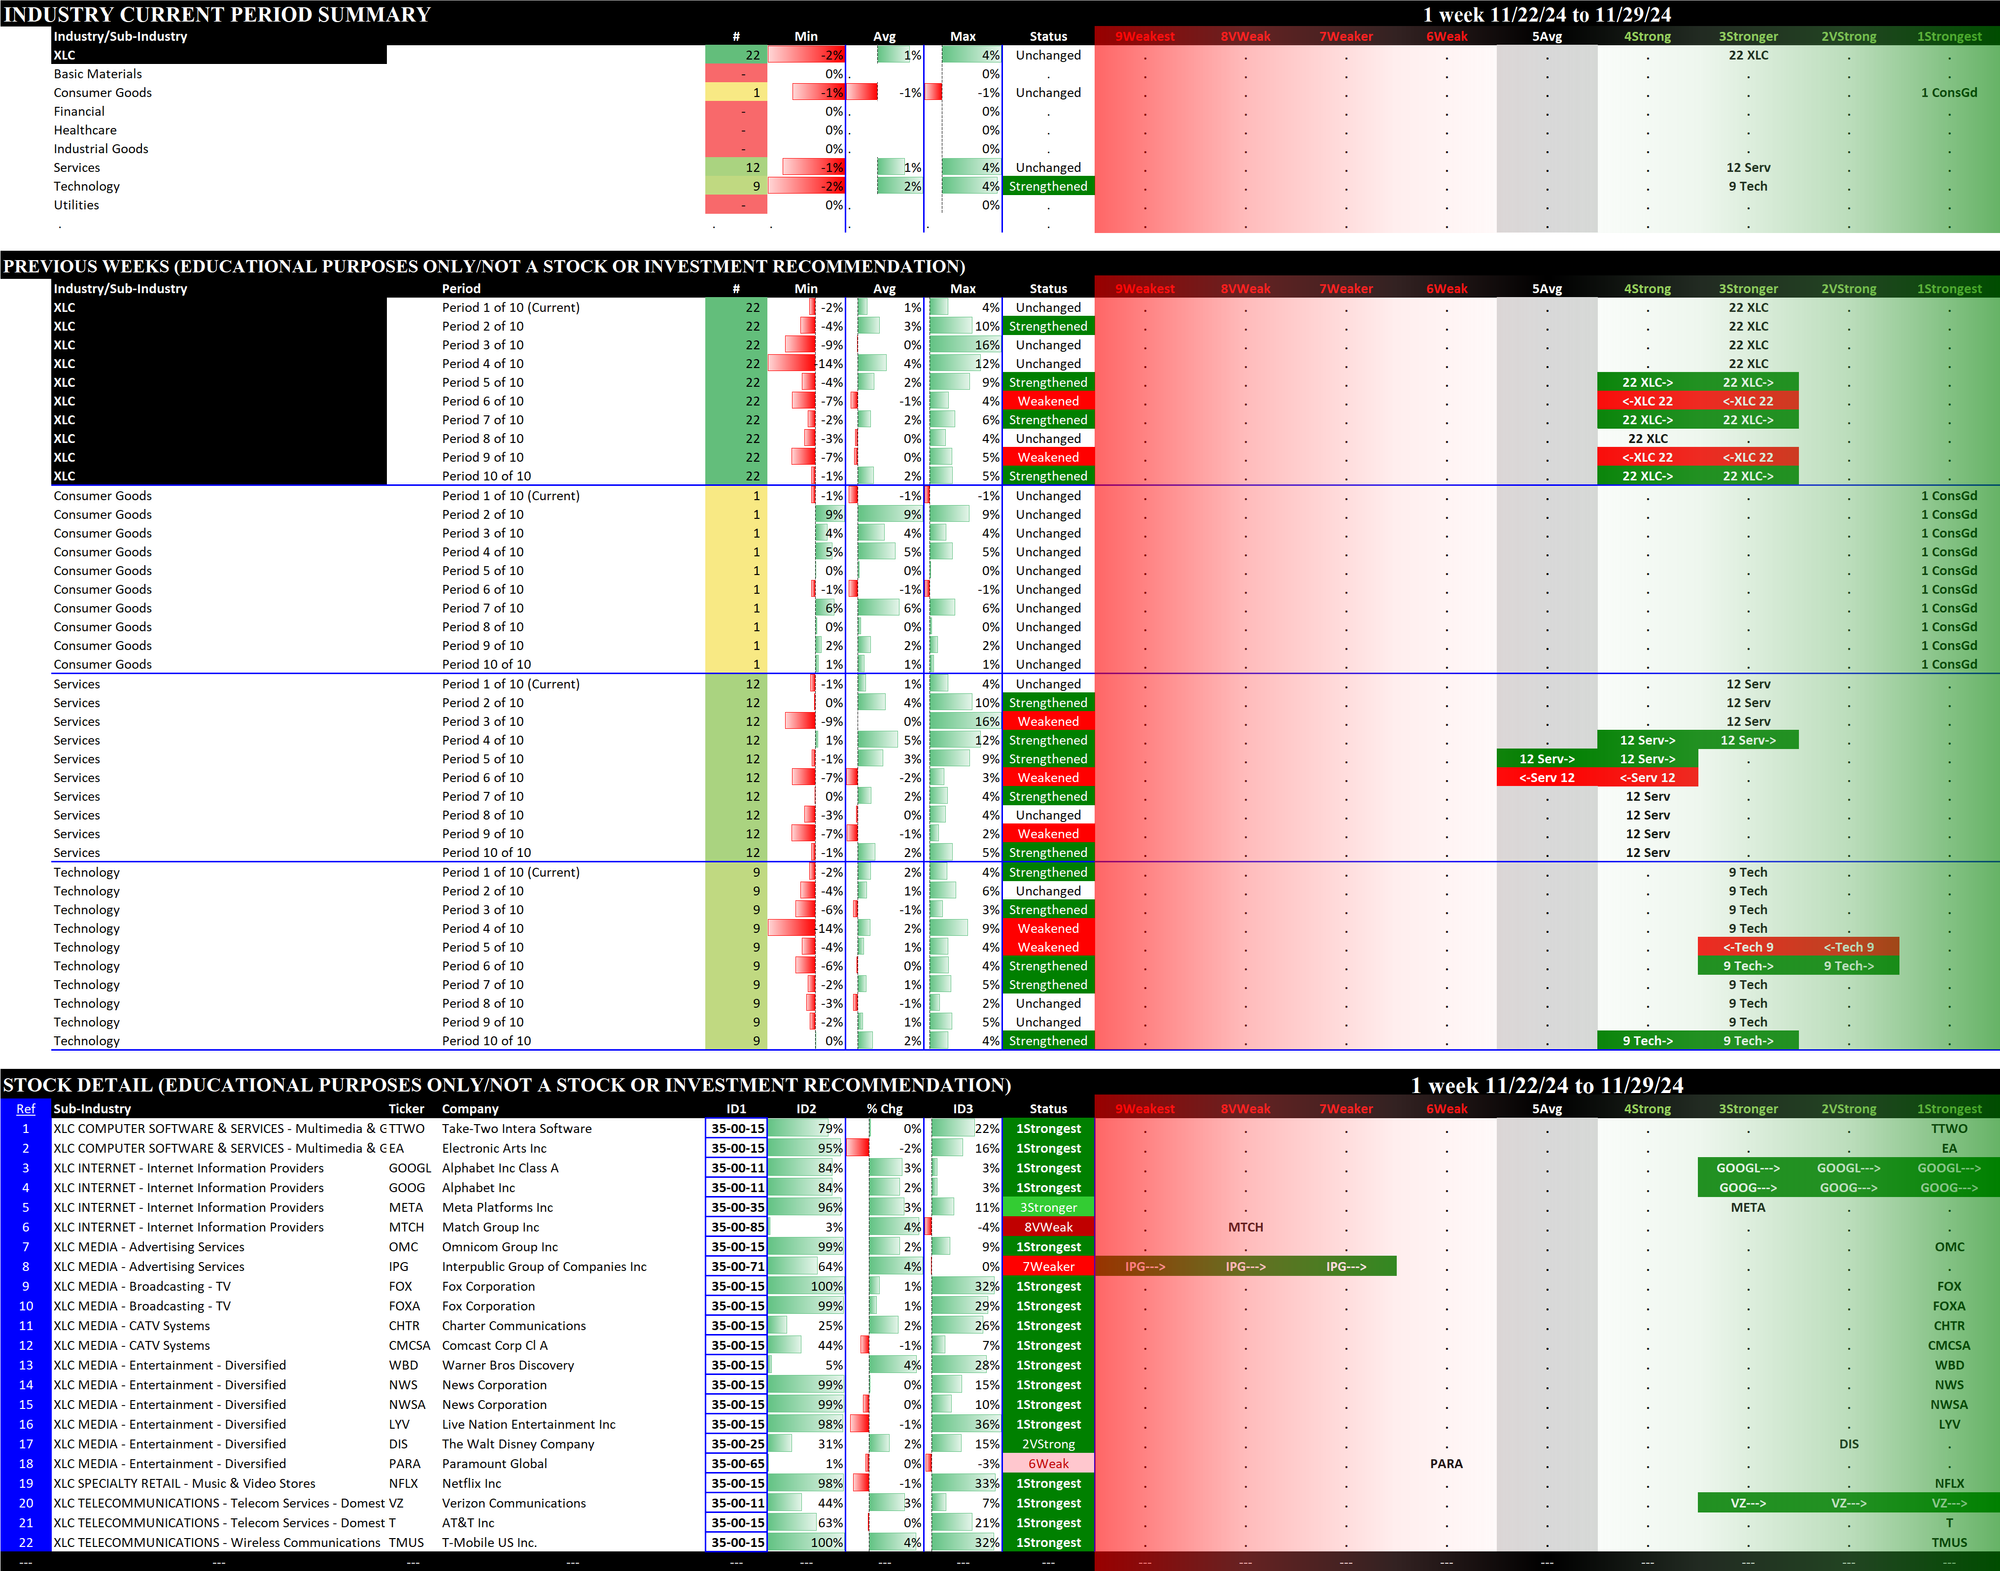
2.2 XLC Communication Services (22 stocks, small), Unchanged at 3Stronger
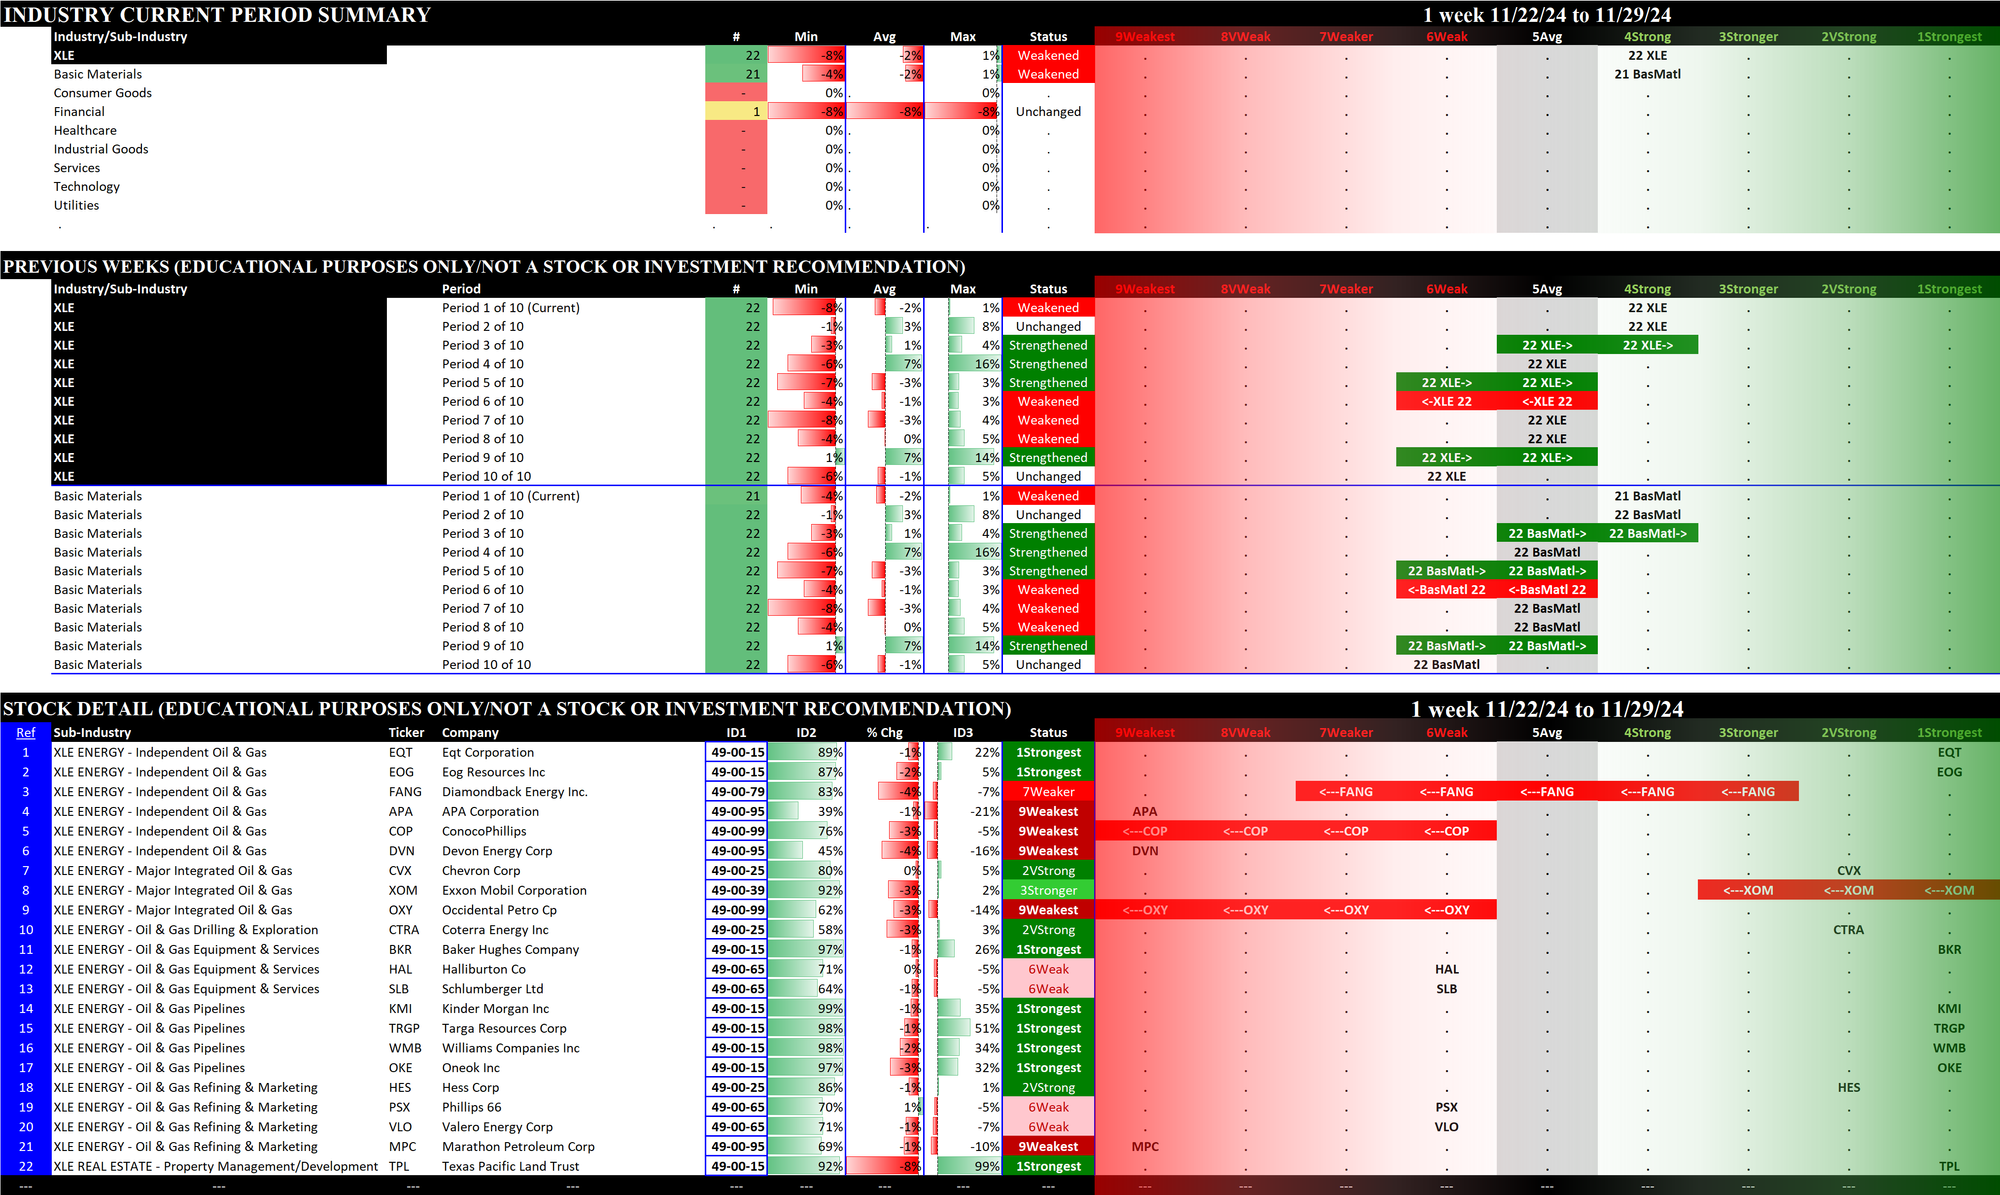
2.3 XLE Energy (22 stocks, small), Weakened at 4Strong
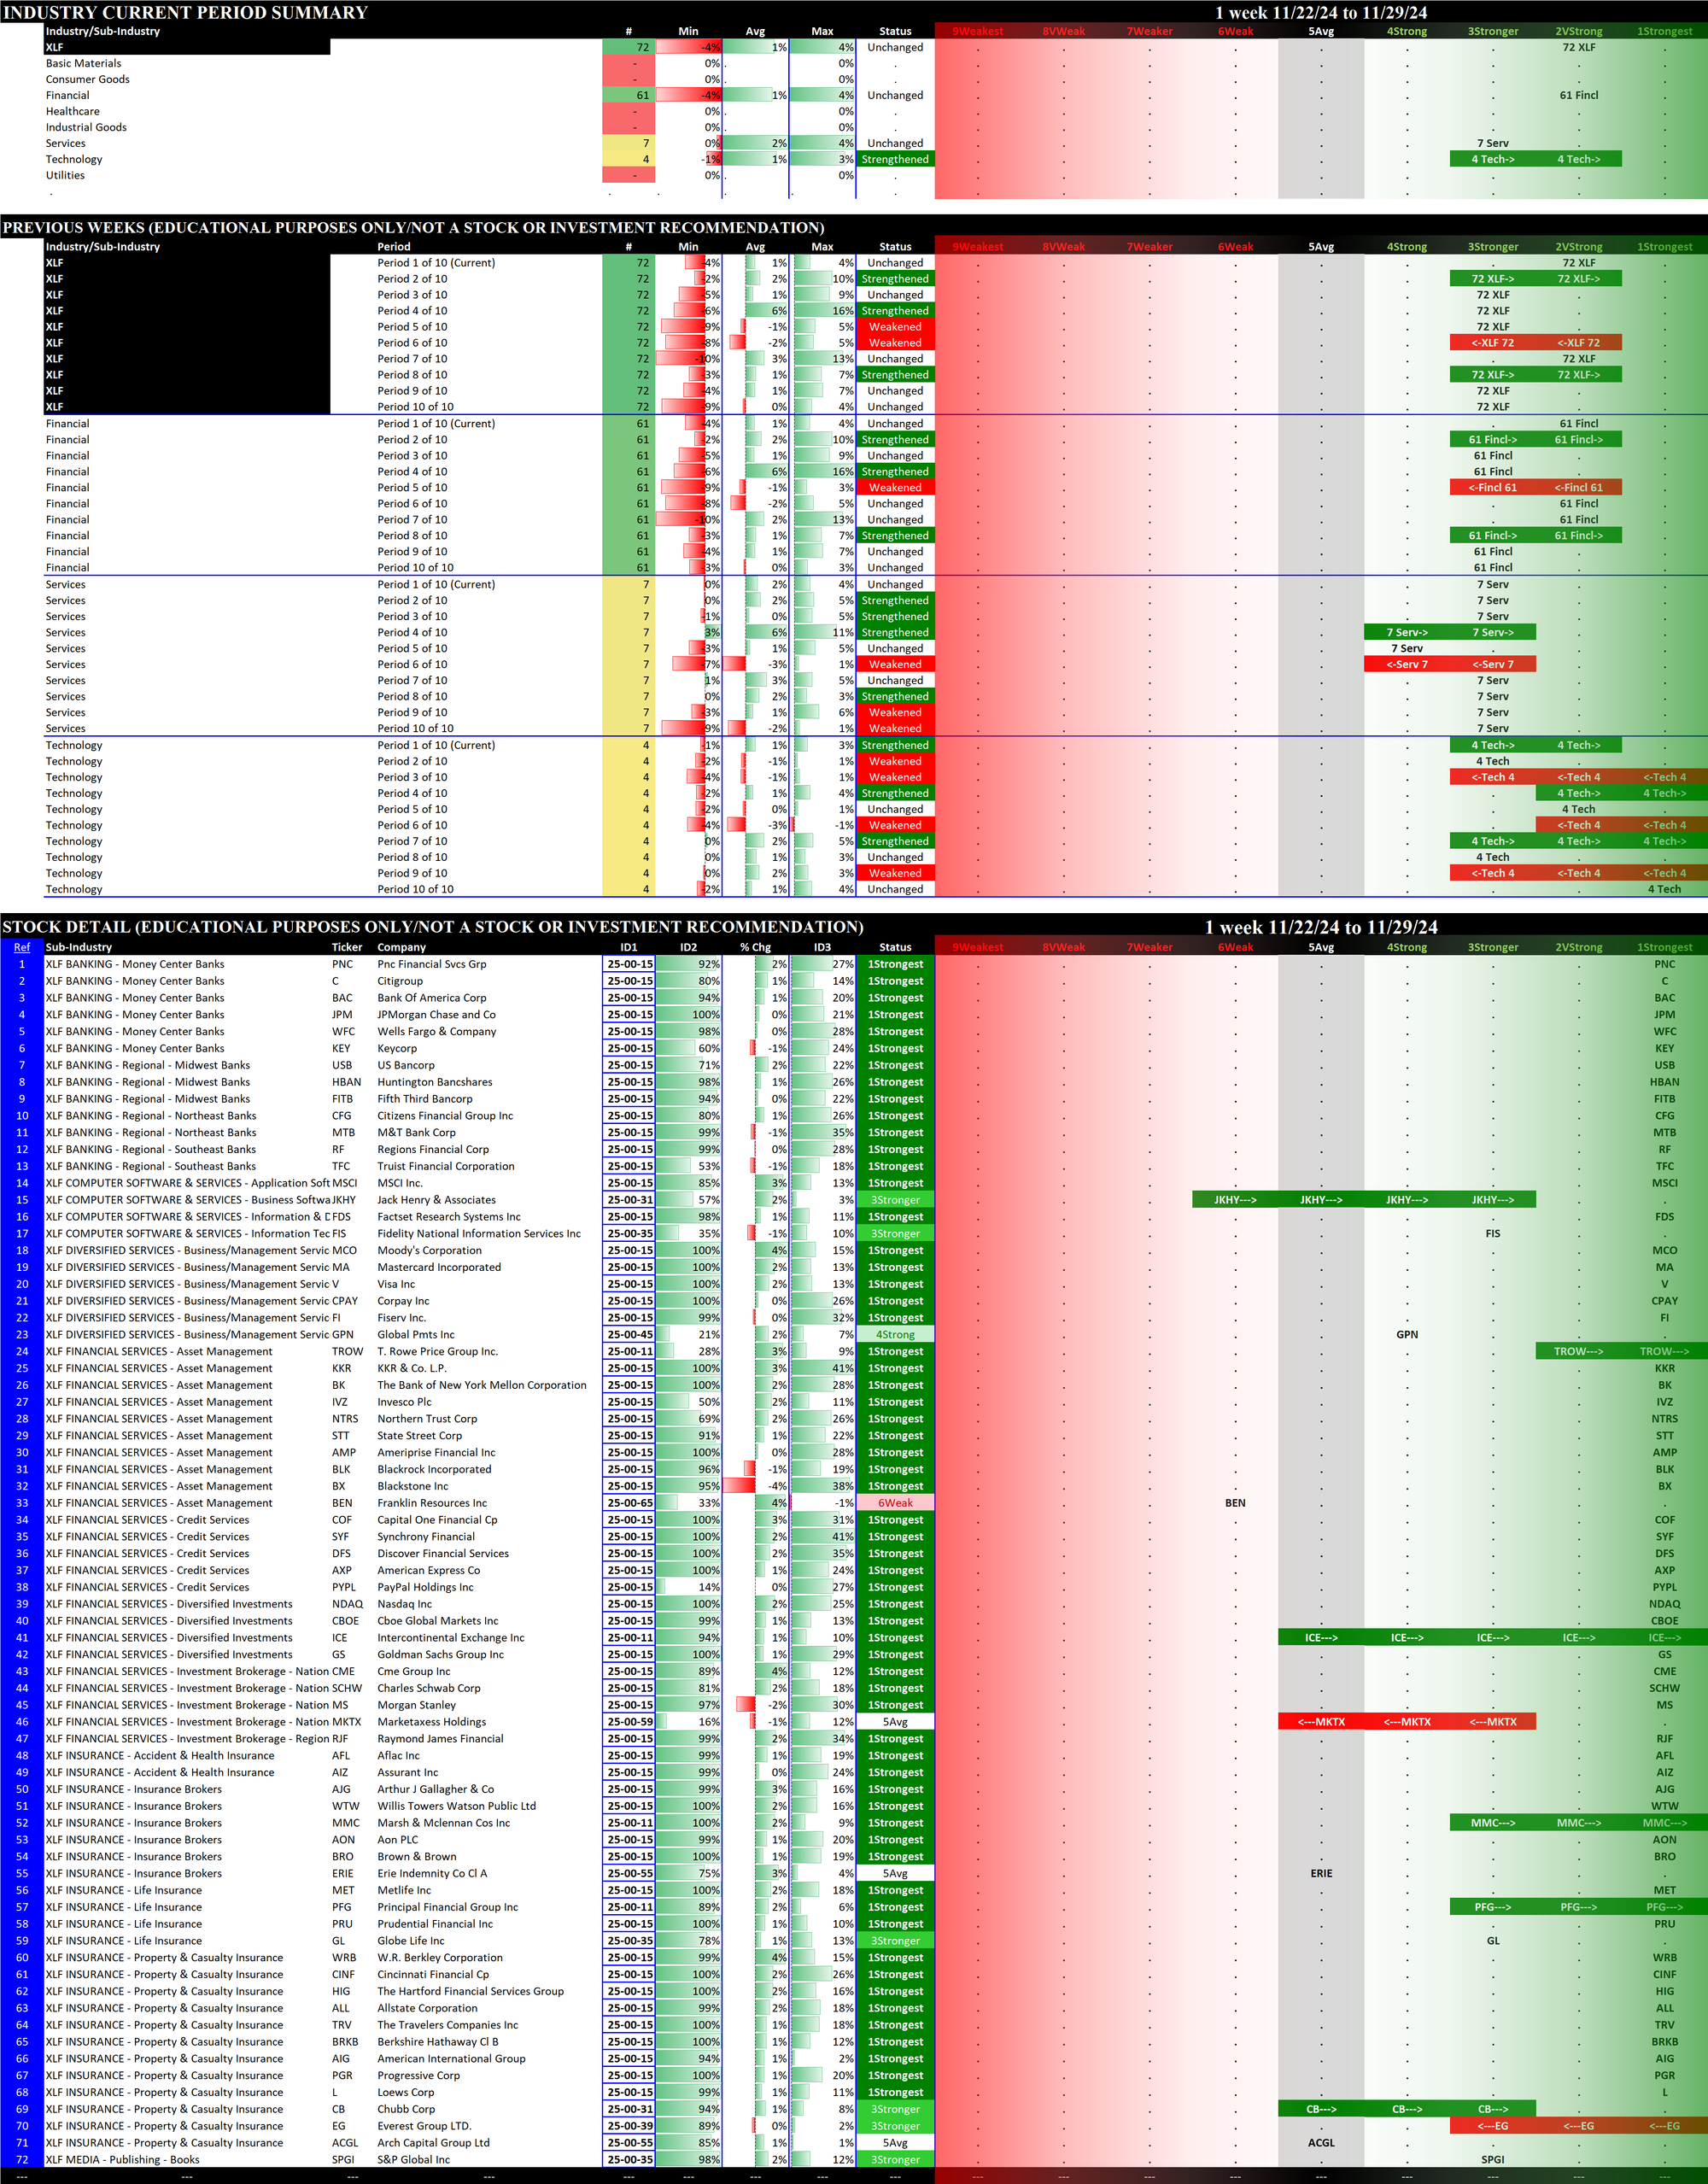
2.4 XLF Financial (72 stocks, large), Unchanged at 2VStrong = BEST
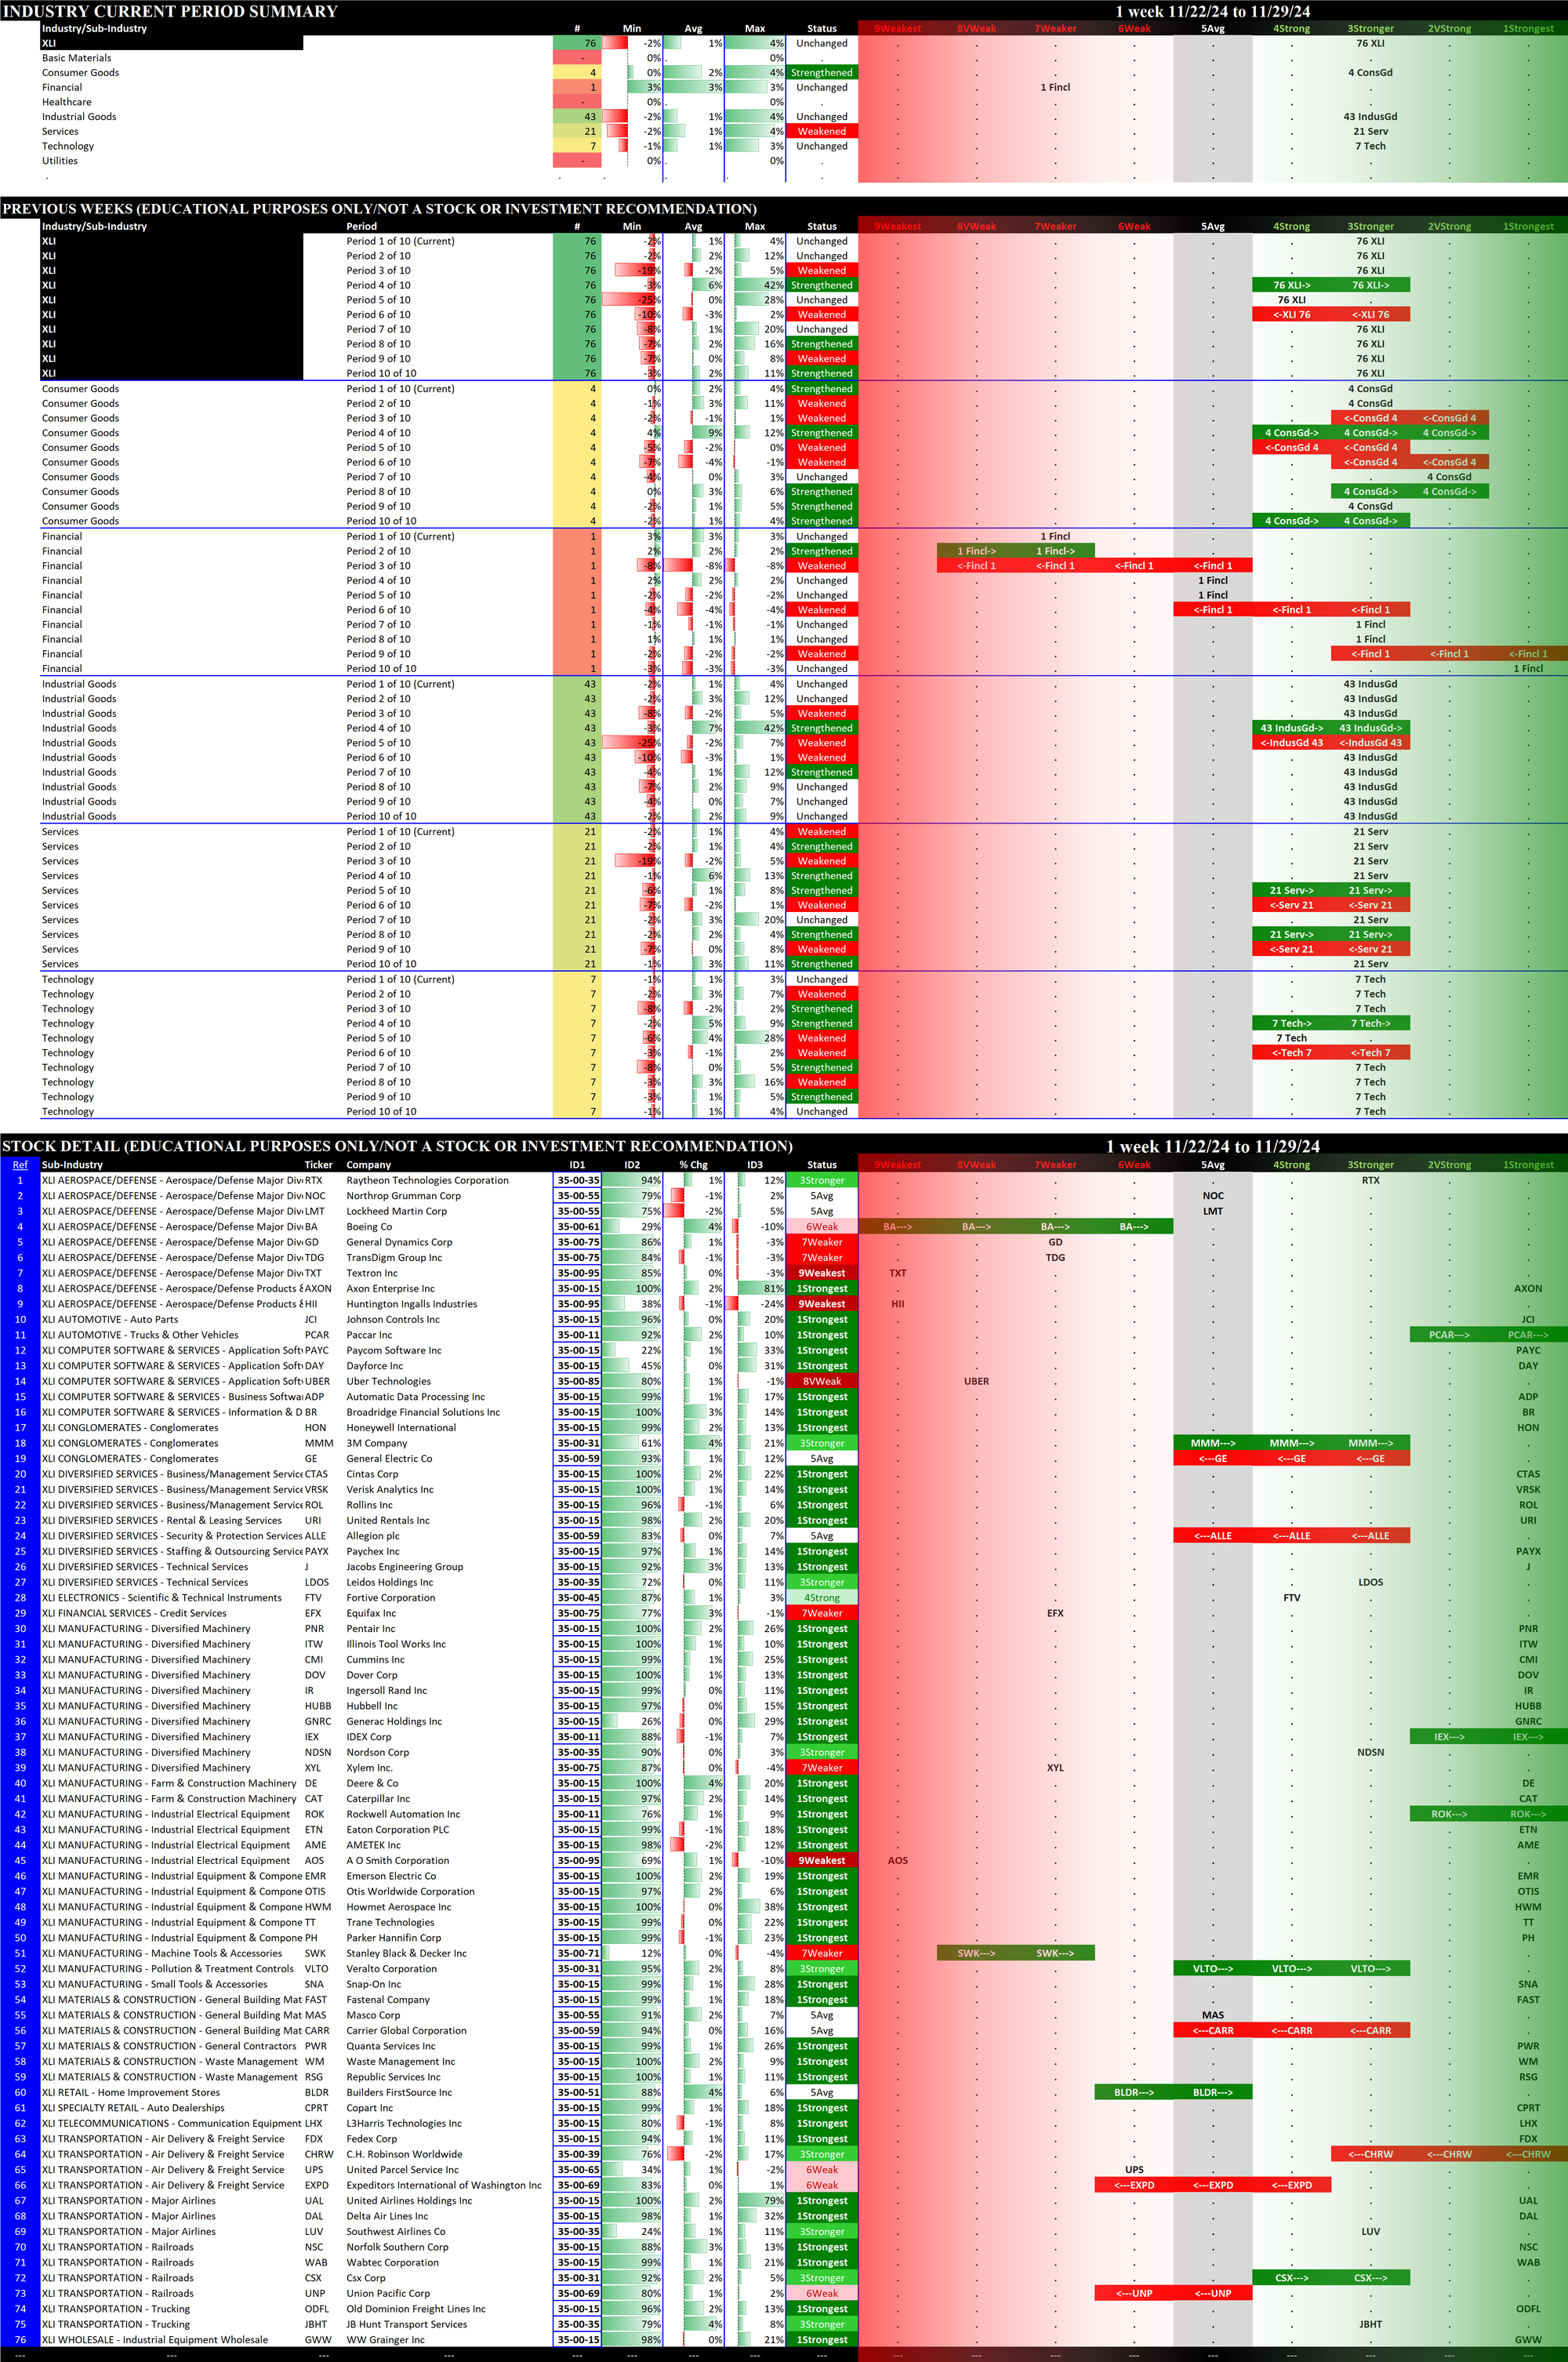
2.5 XLI Industrial (76 stocks, large), Unchanged at 3Stronger
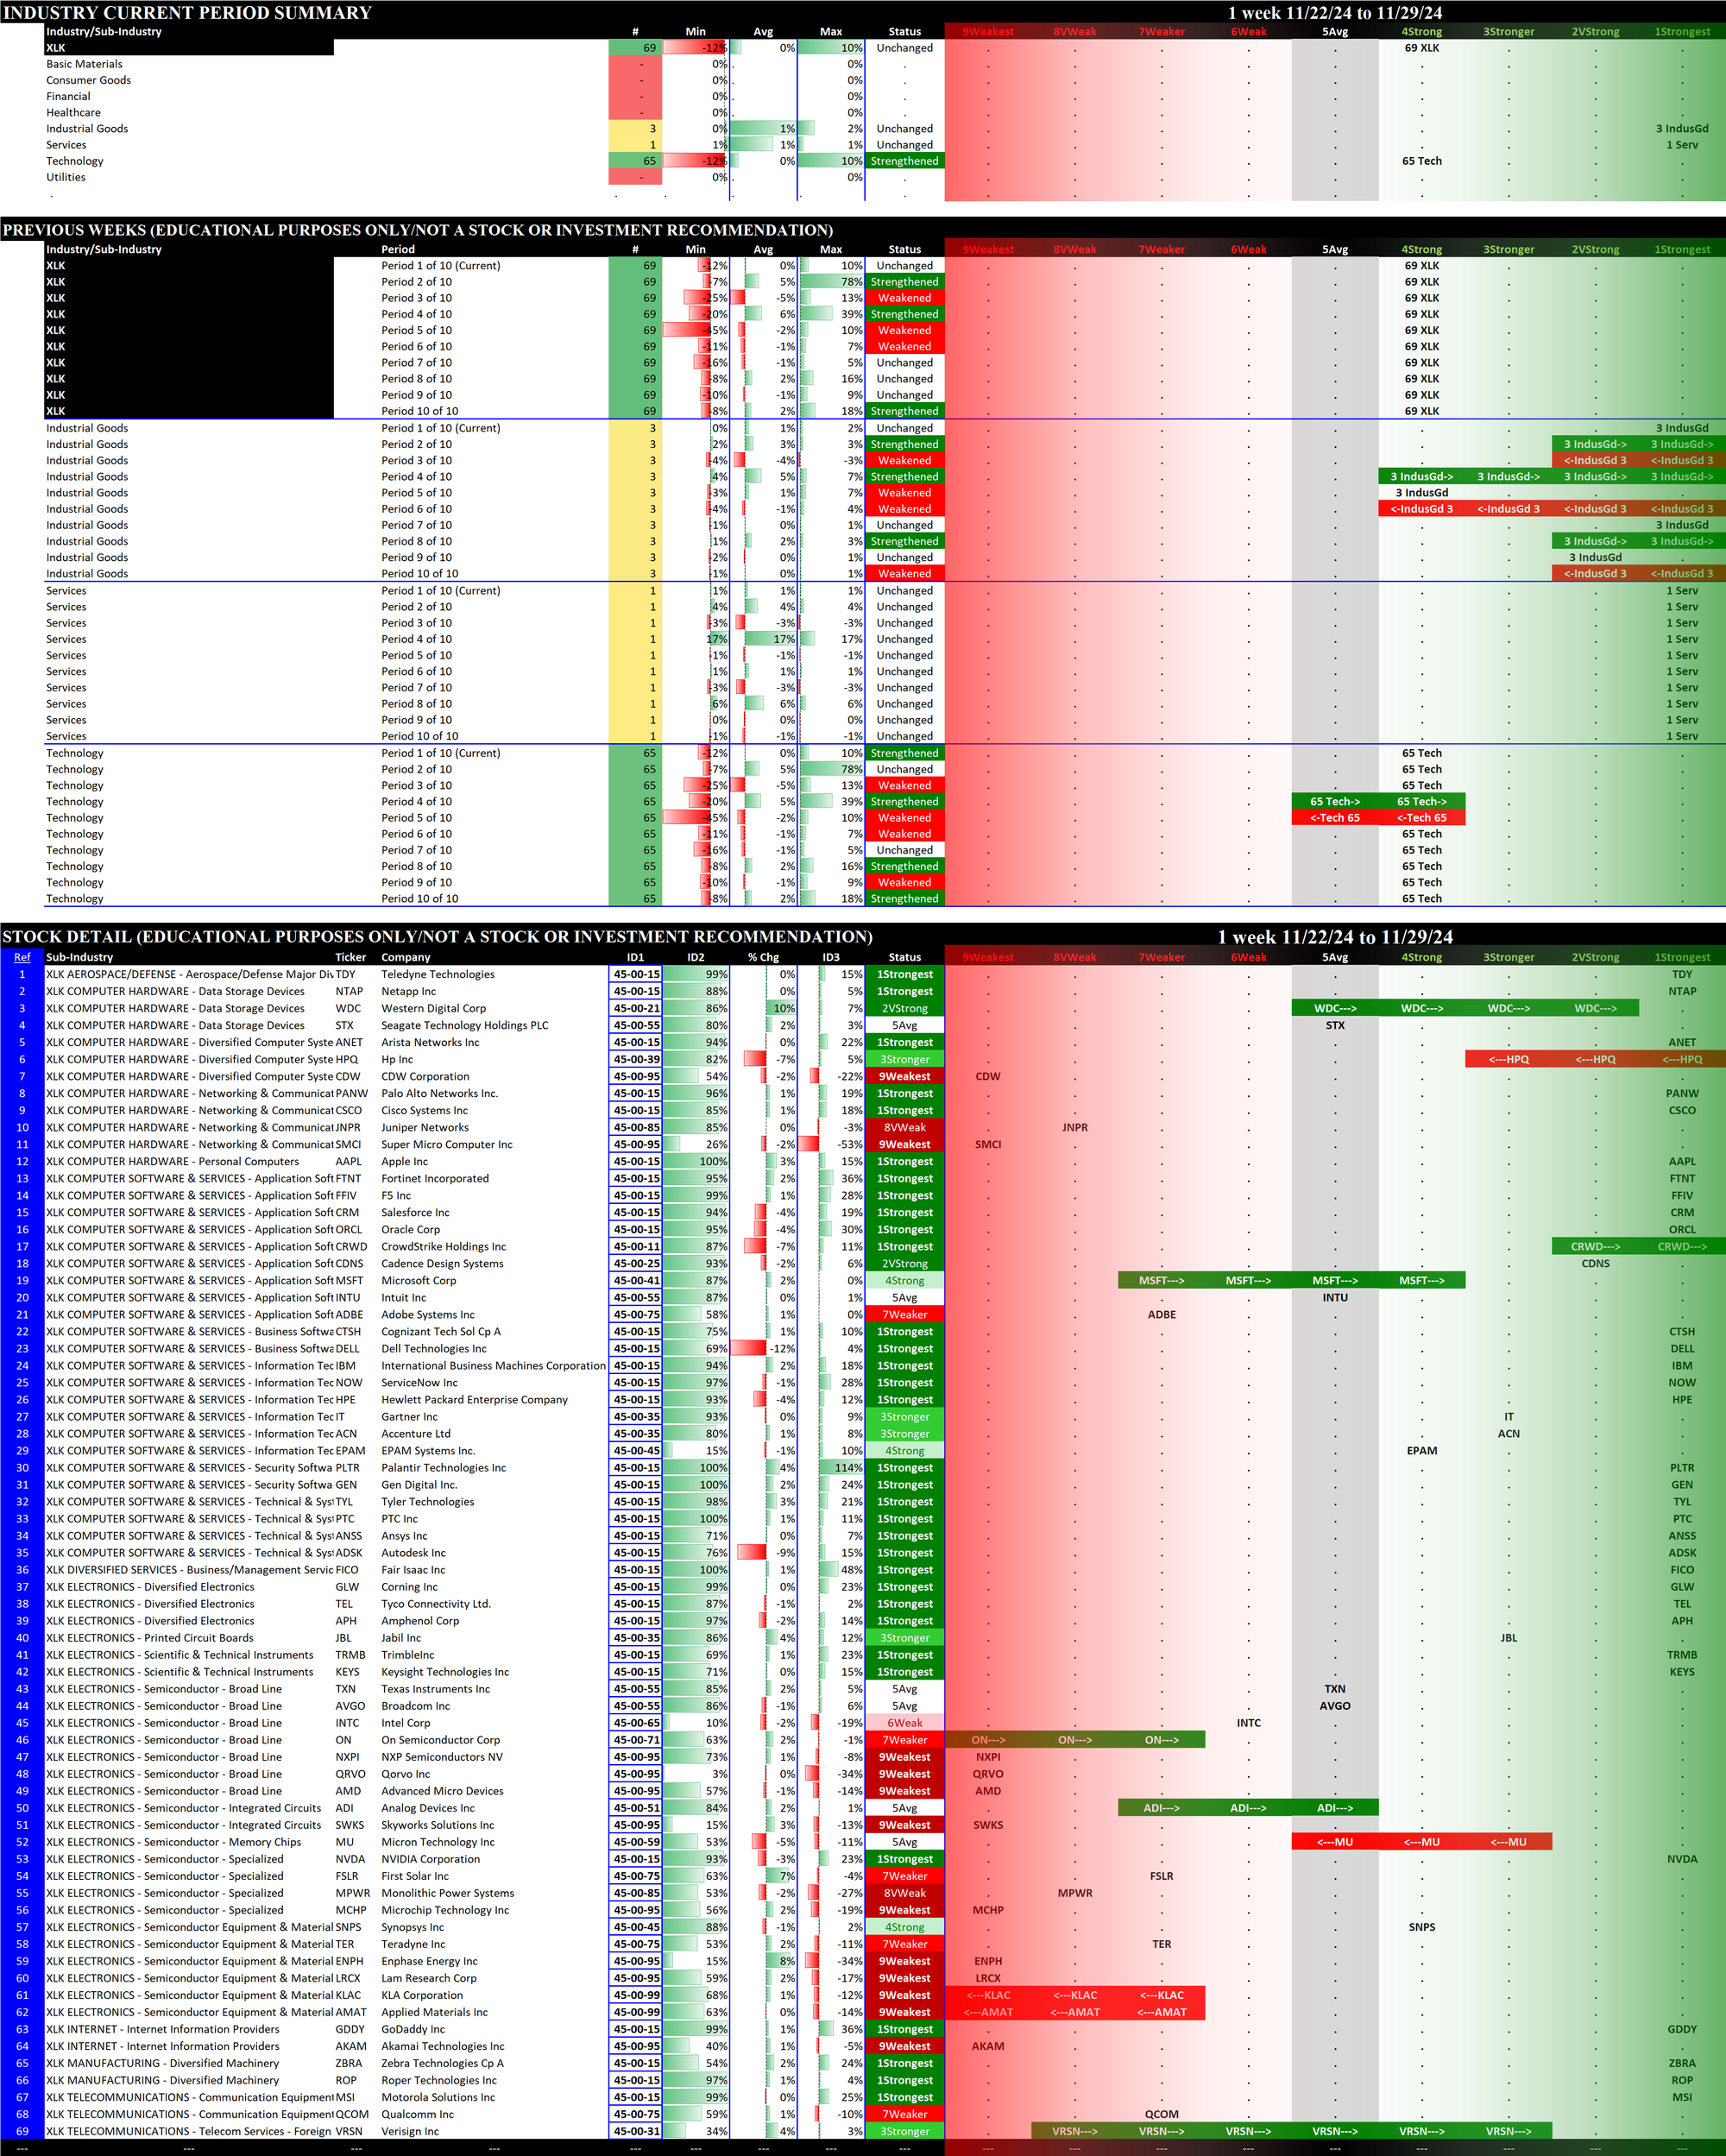
2.6 XLK Technology (69 stocks, large), Unchanged at 4Strong
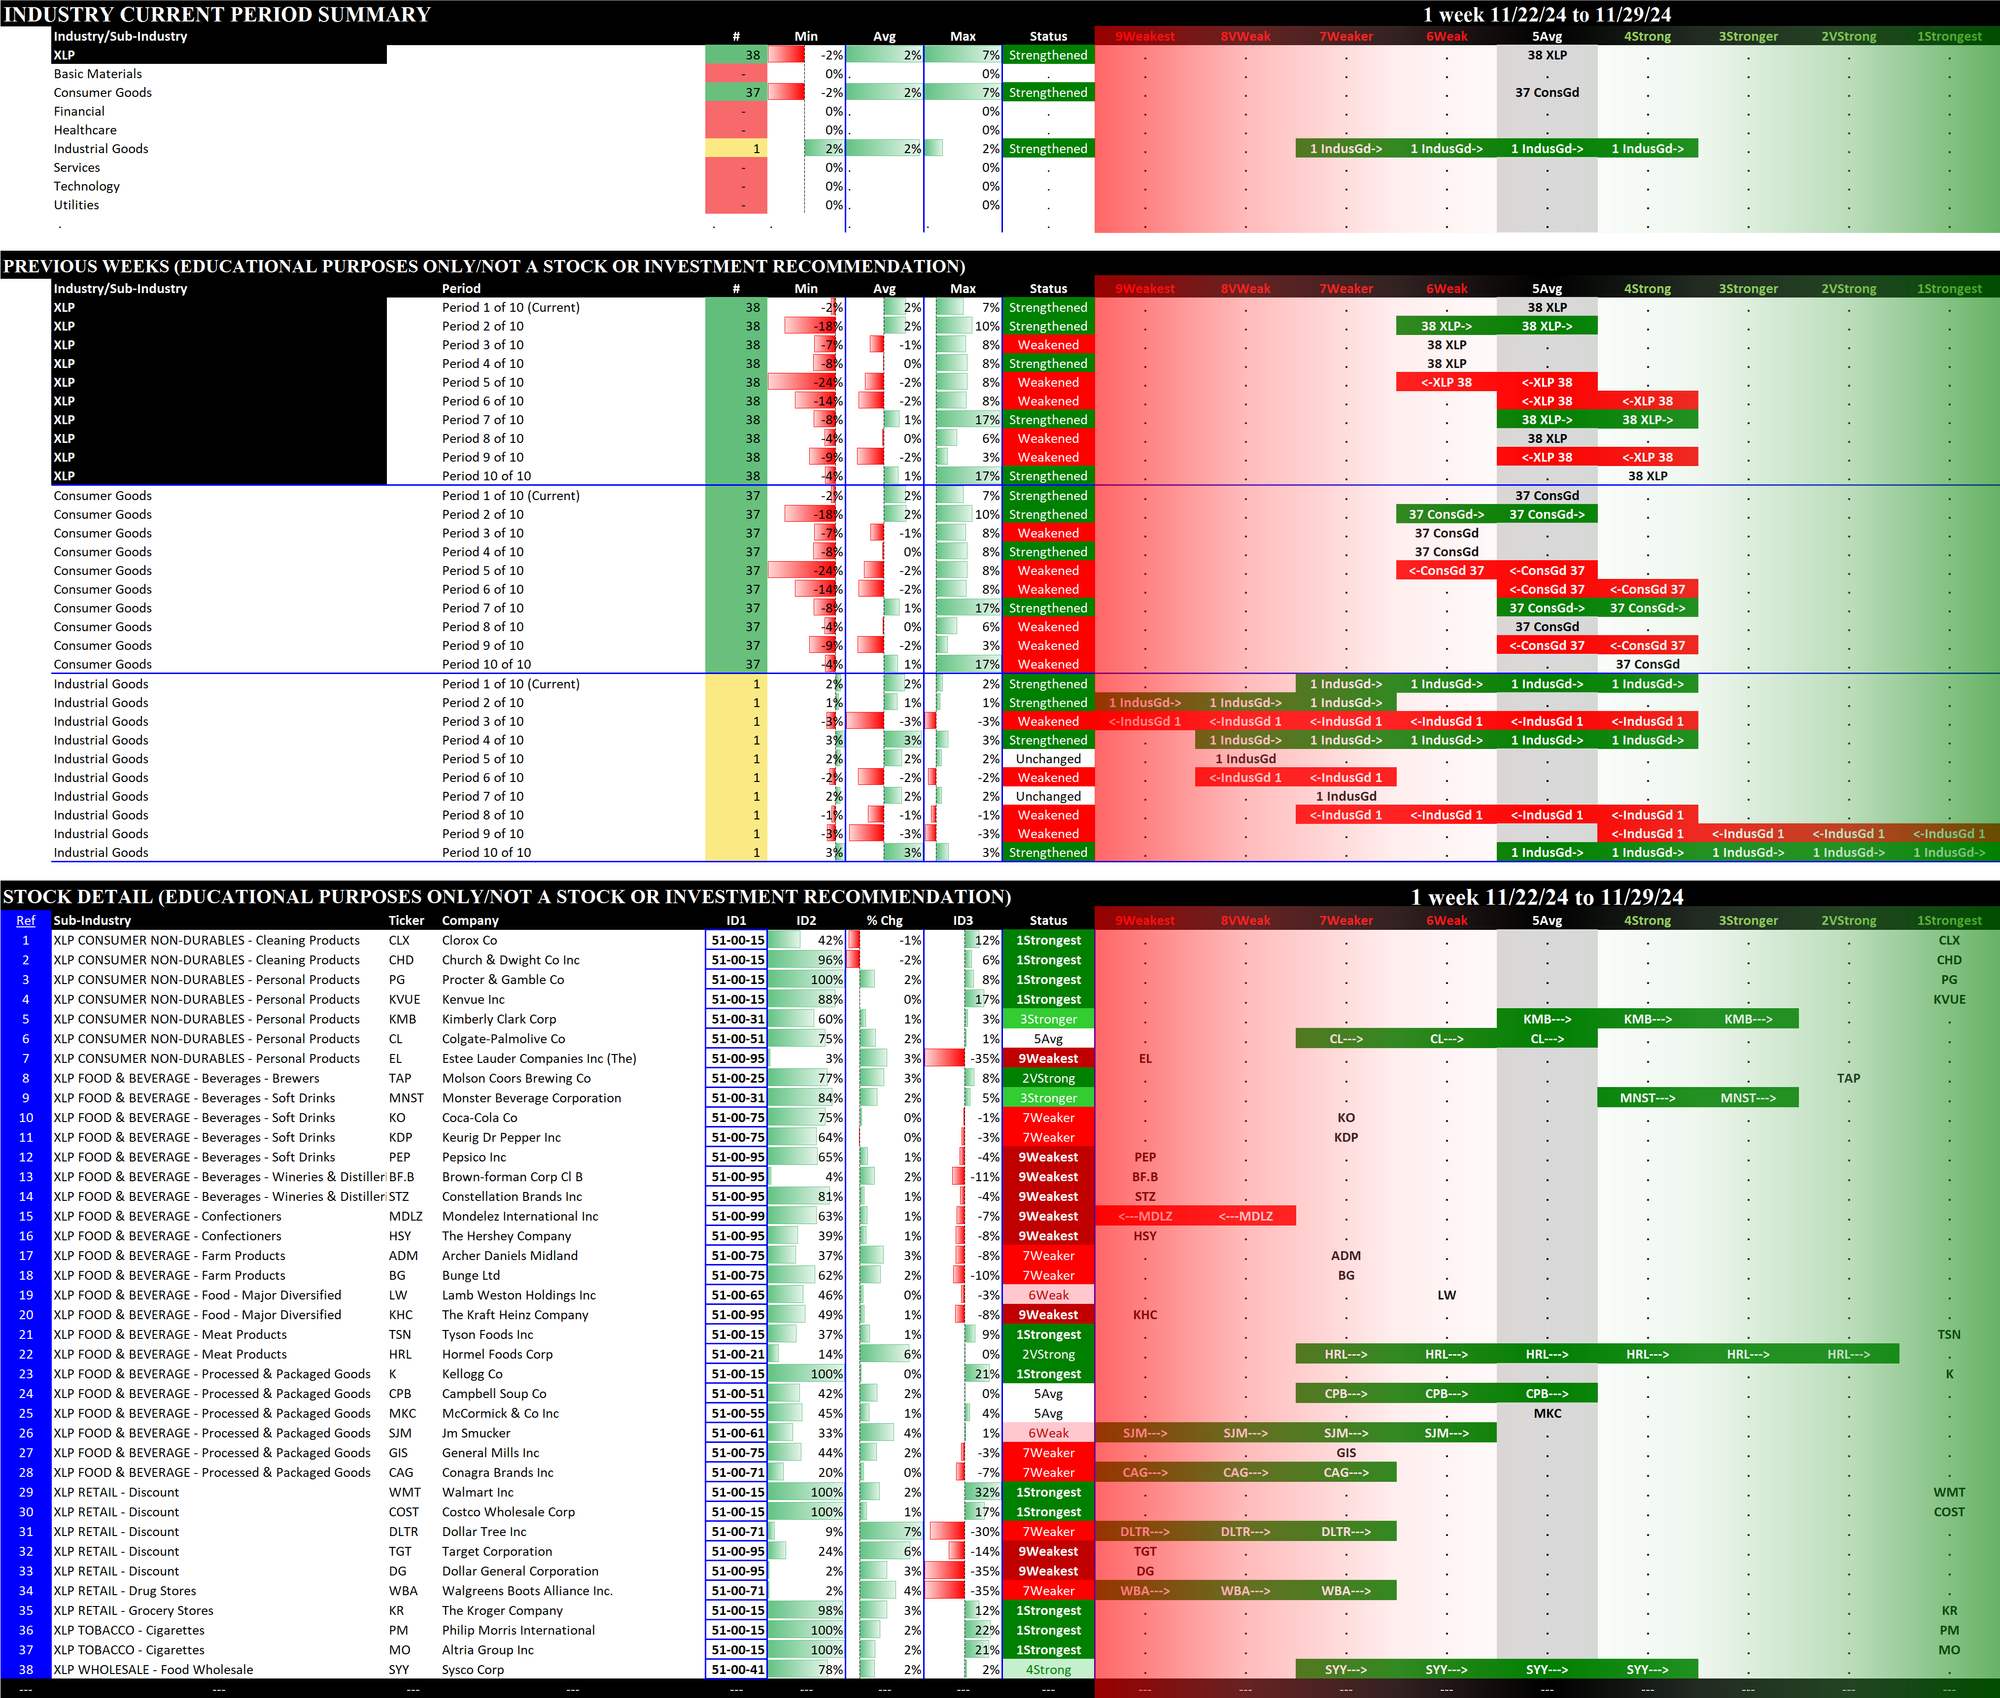
2.7 XLP Consumer Staples (38 stocks, mid-sized), Strengthened at 5Avg = tied for WORST
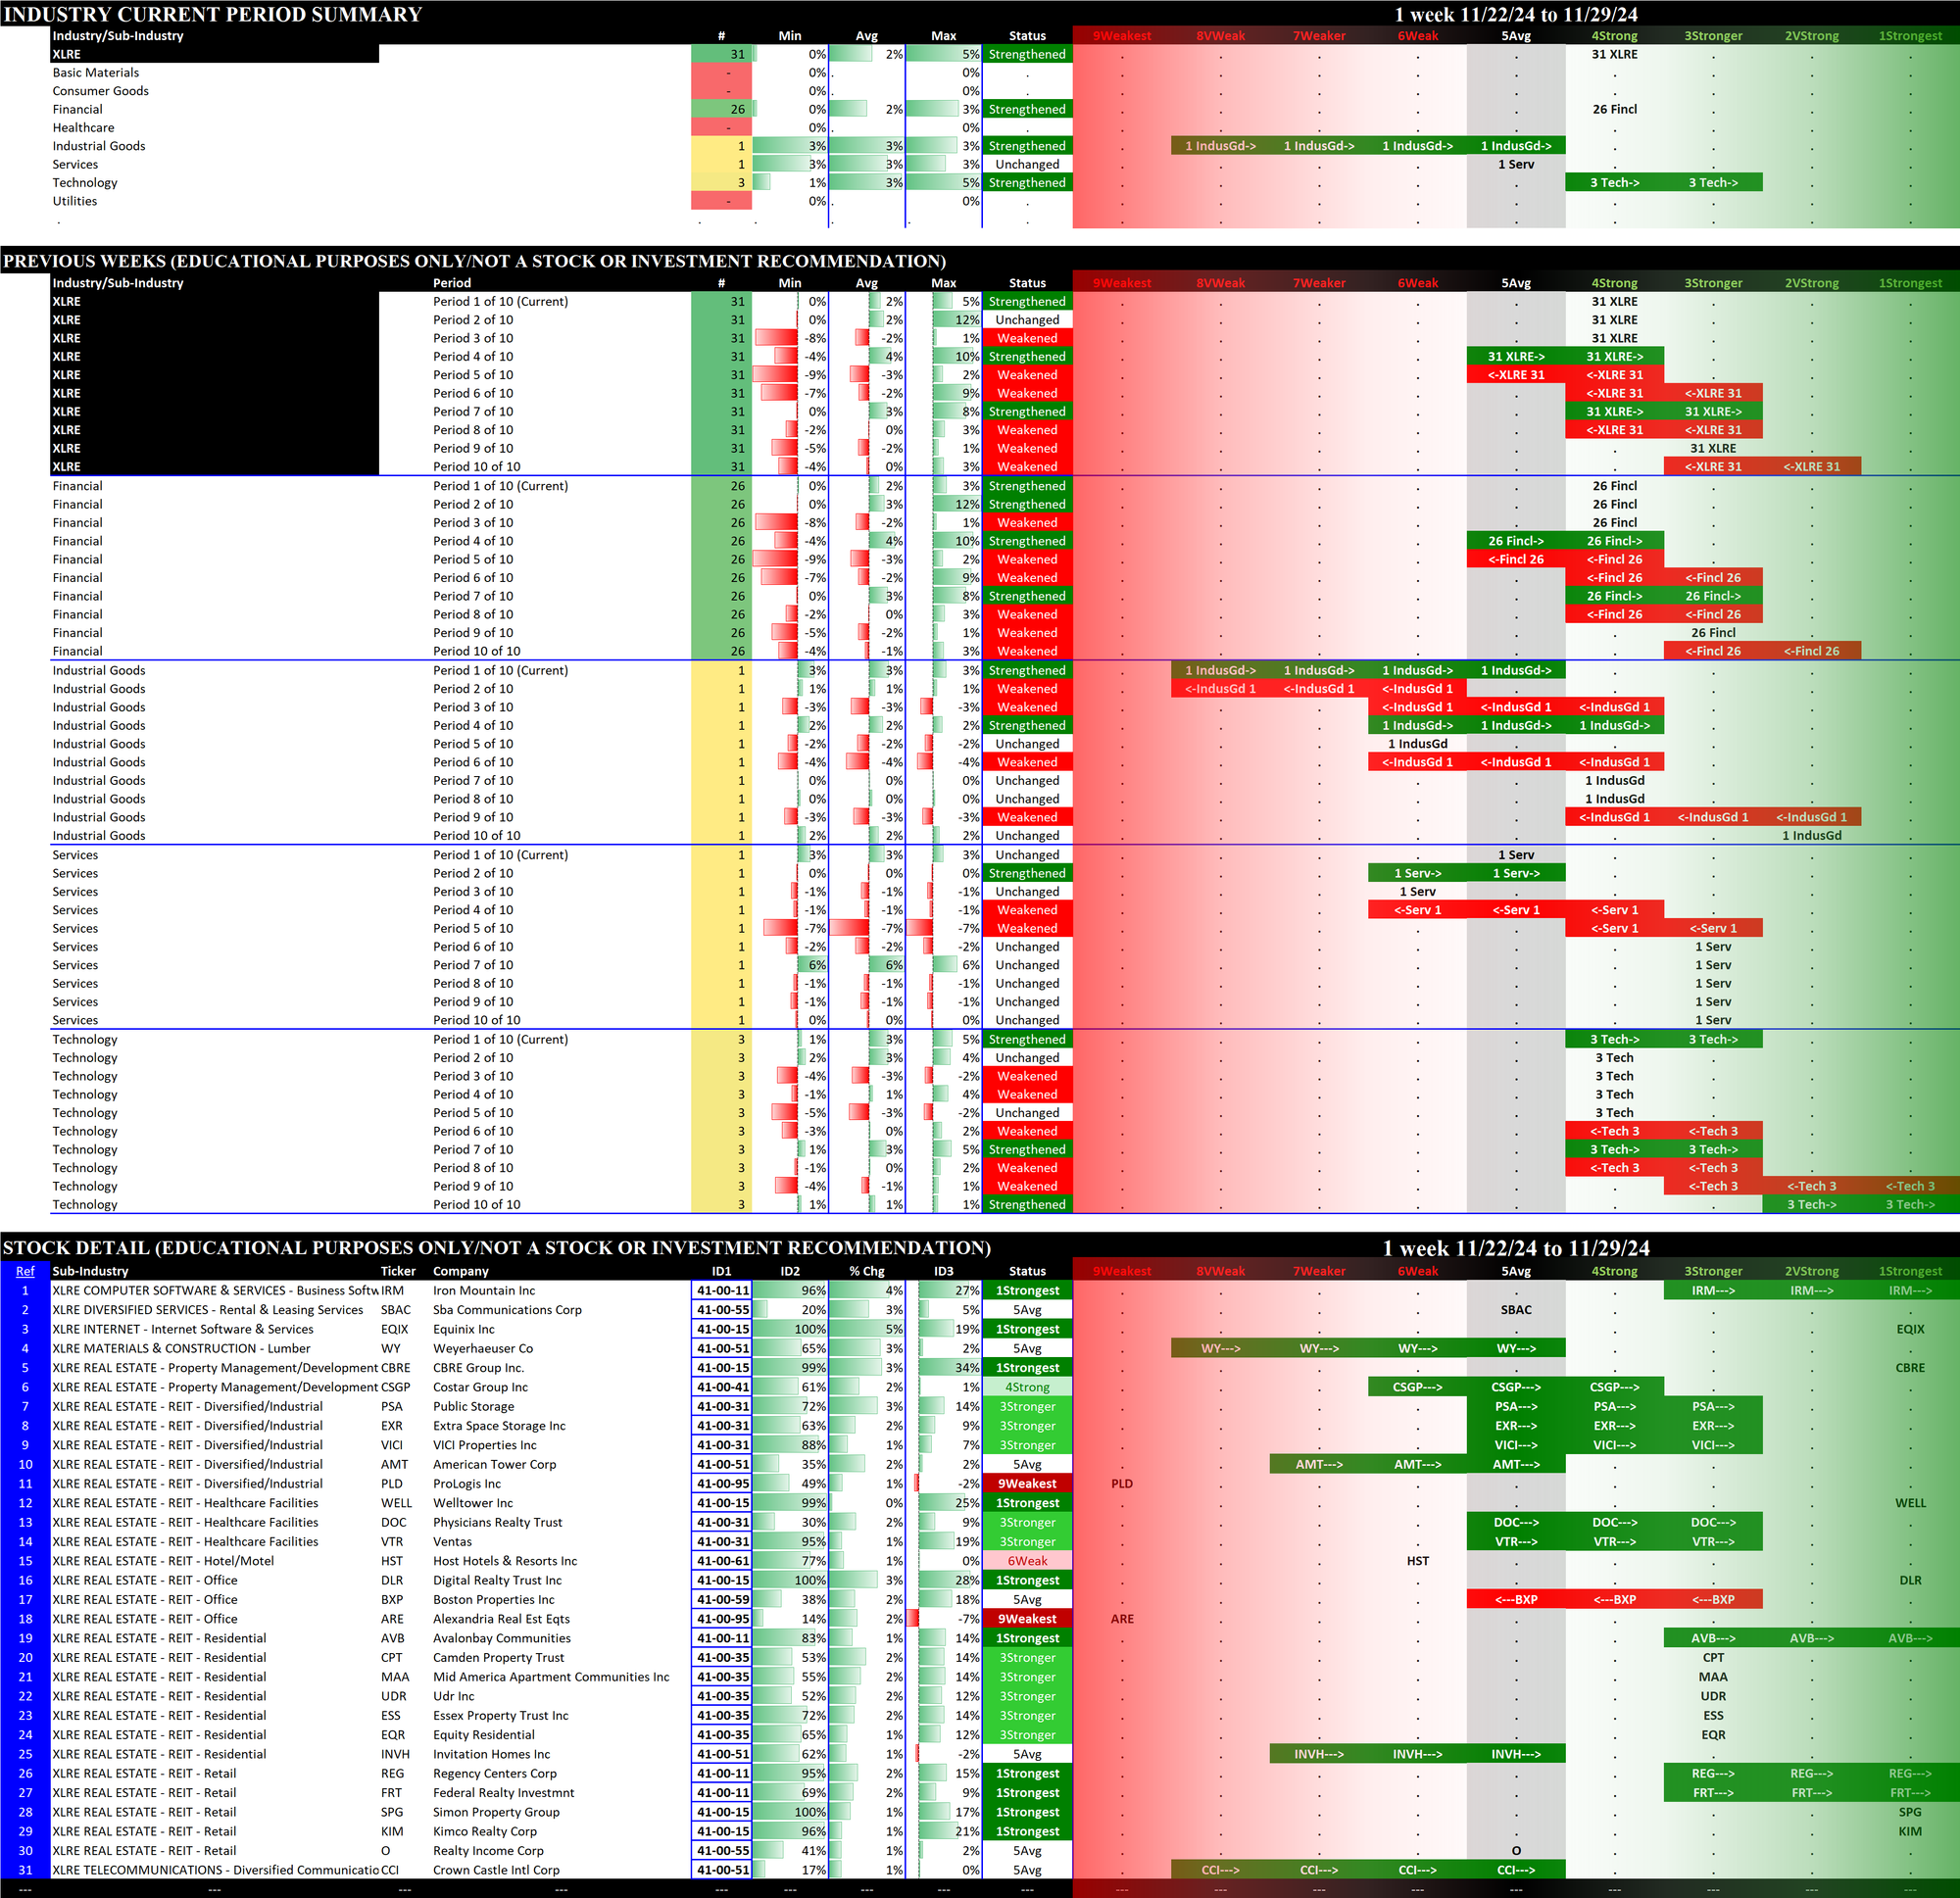
2.8 XLRE Real Estate (31 stocks, small/mid-sized), Strengthened at 4Strong
2.9 XLU Utilities (31 stocks, small/mid-sized), Strengthened at 3Stronger
2.10 XLV Health Care (61 stocks, large), Strengthened at 5Avg = tied for WORST
2.11 XLY Consumer Discretionary (51 stocks, mid-sized/large), Strengthened at 4Strong
3. Stock Detail
The downloadable PDF below lists all component stocks in order of first Strongest to Weakest ETF and second Strongest to Weakest Stock. The difference between this report and the 11 ETF stock listings above is this report consolidates all component stocks whereas the above listings are segregated by ETF.
Download the following Excel file if you are interested in sorting results yourself.