SMO Exclusive: SPDR Sector ETFs Strength Report 2024-10-11
Key Update from Previous ETF Reports
I have converted the ETFs to the more updated 11 SPDR Sector ETFs. Summary changes:
- The component stocks for 4 ETFs were unchanged - XLB/Basic Materials, XLE/Energy, XLRE/Real Estate, and XLU/Utilities
- Five ETFs were expanded: XLF/Financials, XLI/Industrials, XLK/Technology, XLV/Healthcare, and XLY/Consumer (see below)
- Formerly only XLY/Consumer is now split into XLY/Consumer Discretionary and XLP/Consumer Staples
- XTL/Telecommunications has been replaced by XLC/Communications
These 11 ETFs consist of 500 stocks. The 10 ETFs from previous posts contained 400.
Key Stock Market Organizer Context
I subscribe to the top-down concept that market and sector forces exert upwards of 70% to 80% influence on the price action of individual stocks. Therefore I seek to align stock, sector, and market direction - I want to 1) stack strength by going long strong stocks in strong sectors in rising markets and 2) stack weakness by going short weak stocks in weak sectors in declining markets.
To do so objectively and consistently I have created a repeatable process that includes these two analyses:
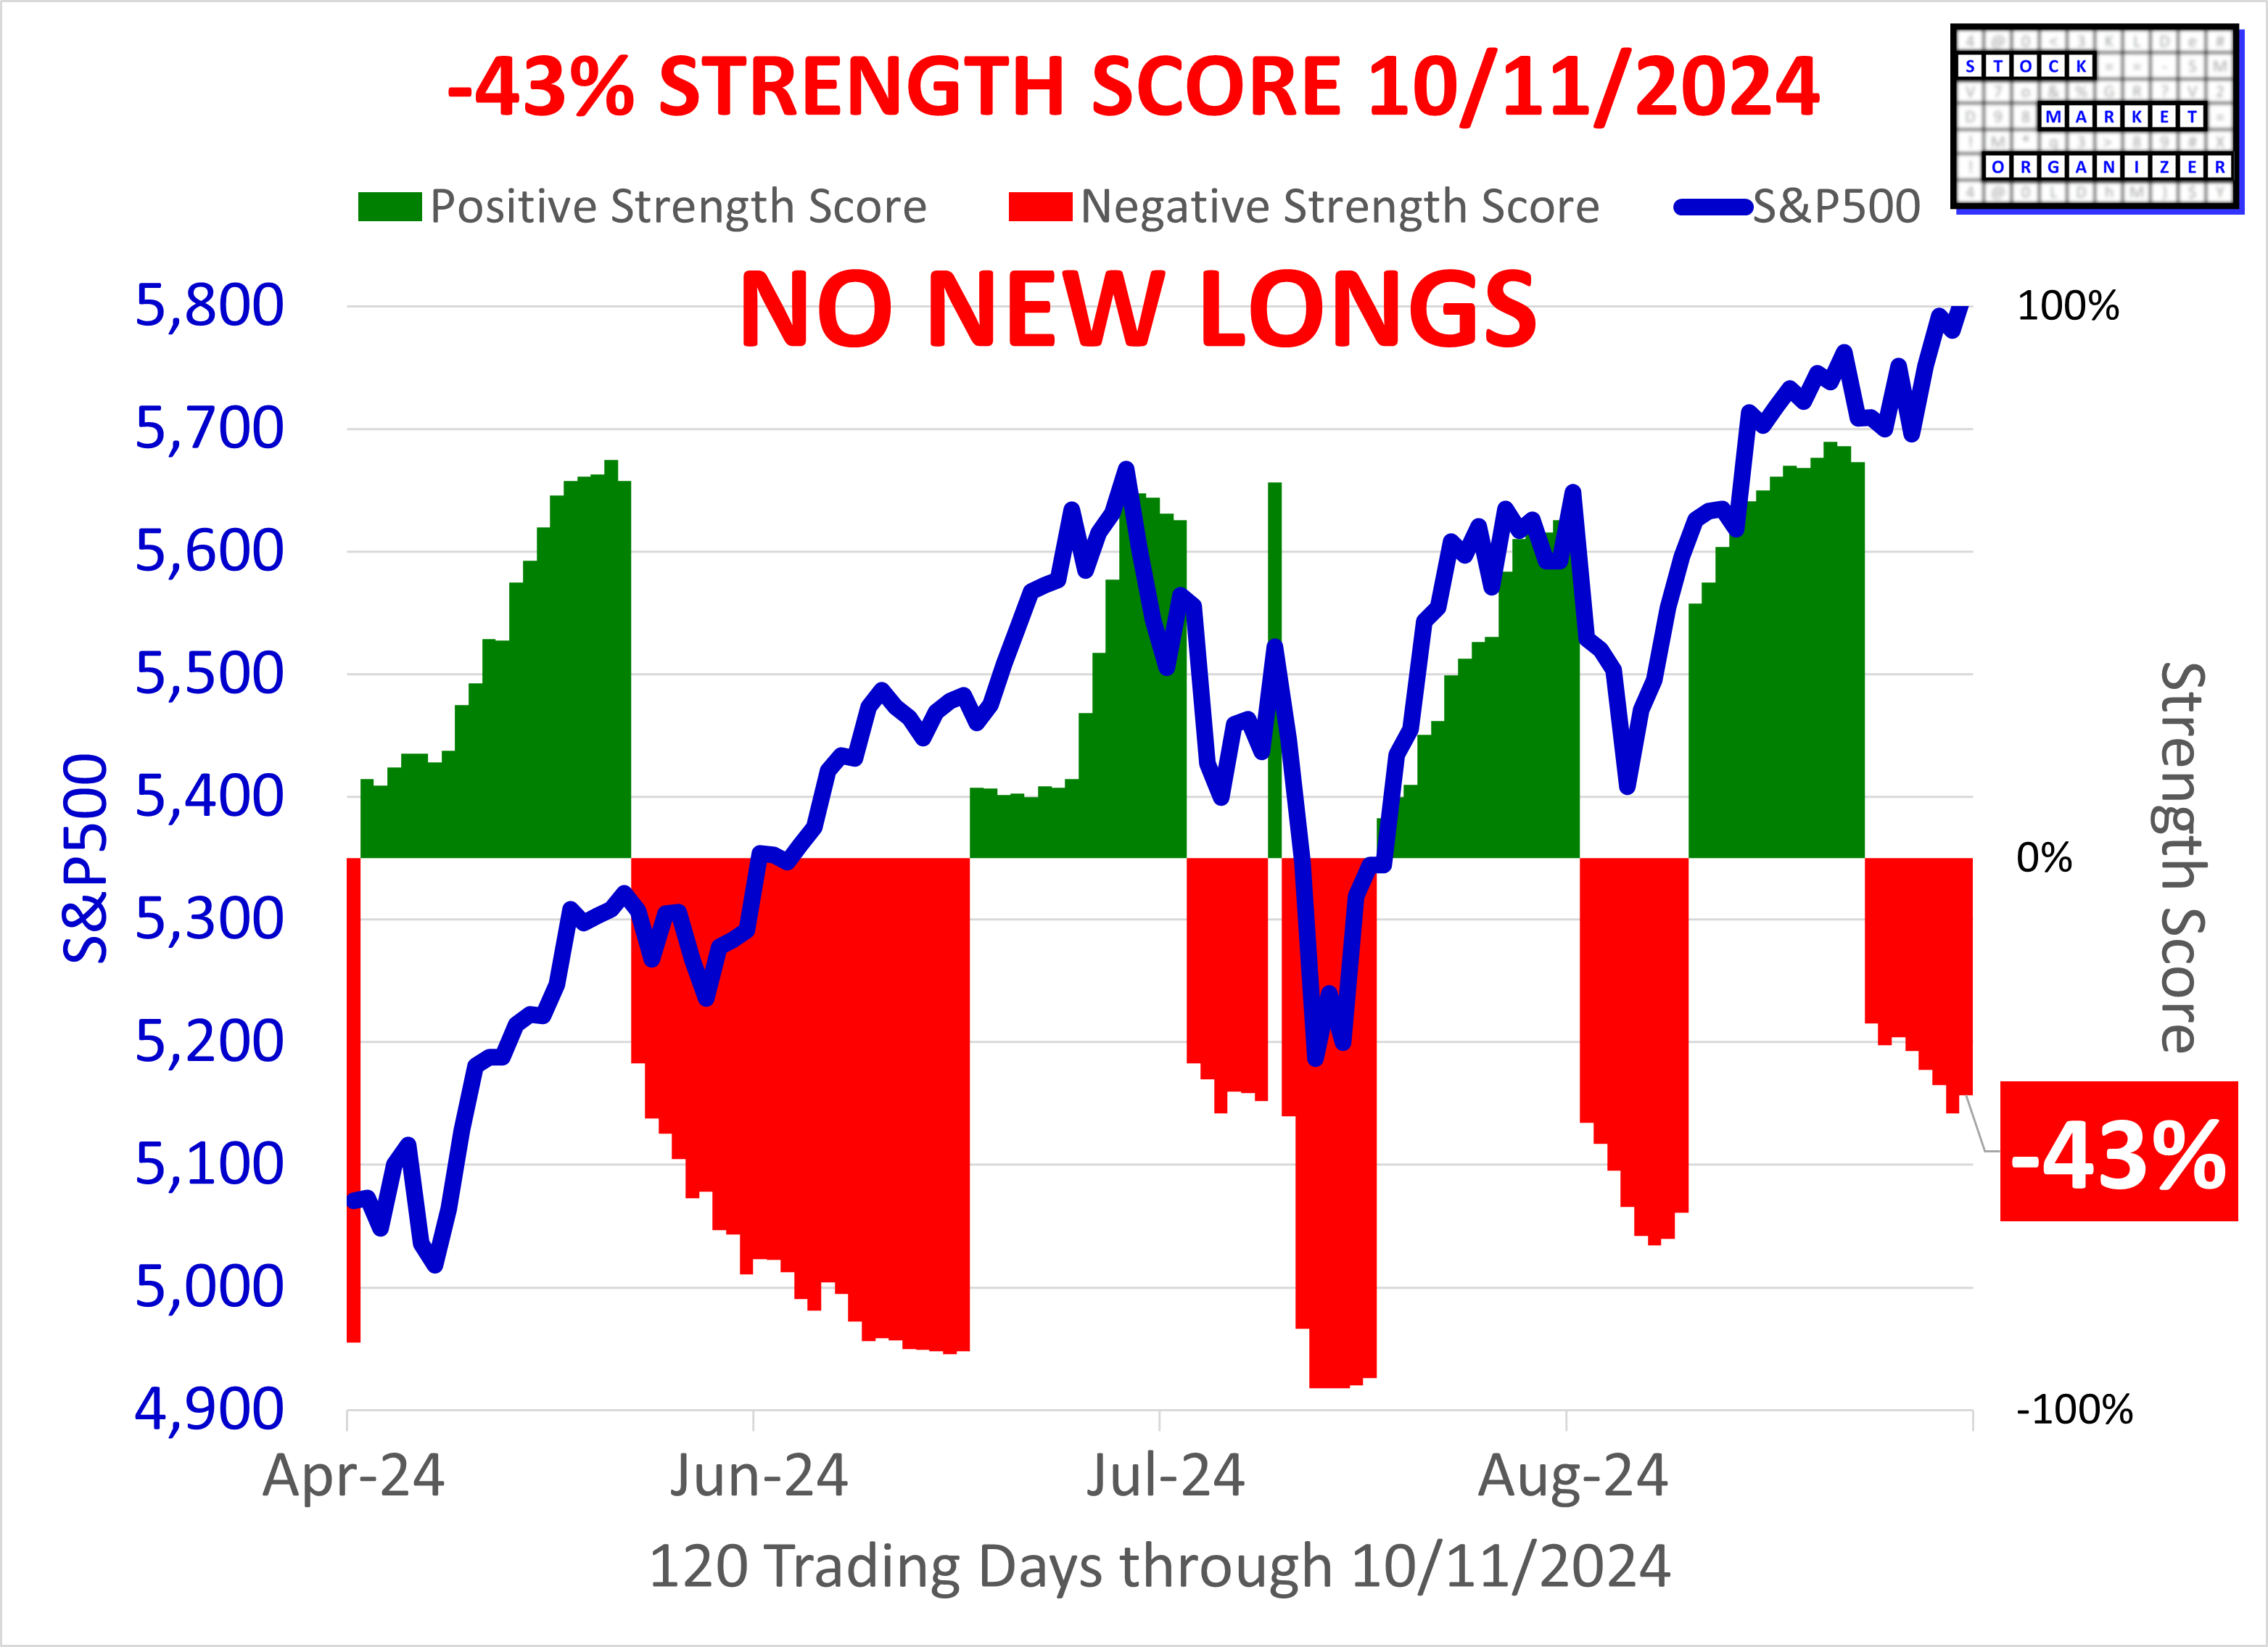
- MARKET Strength/Weakness: This analysis shows how I objectively measure market strength. This drives my current big picture "No New Longs" or "No New Shorts" decision and offers reasonable, objective guidance for how early or late the market is in its current move. The linked post shows a -30% reading which was the Market Strength Score from Wednesday, October 2. This is when the most recent change occurred, from Positive to Negative. This Negative score means No New Longs. A positive score would mean No New Shorts. The -30% is on a scale of -100% to +100%, reflecting that the current market environment is characterized by early weakness. (In contrast, a reading of +30% would indicate early strength, and a +90% reading would indicate late strength.) This is not a prediction - while more and extended weakness could come, the market strength could change and flip to positive at any time based on actual market action. This Market Strength Score simplifies current market strength to a number which reflects what is (based on the strength of the underlying component stocks) and not what will be, and can be used to compare the current to past environments.
- For the record, shown below is the 2024-10-11 -43% Market Strength Score.
- SECTOR Strength/Weakness: The analysis below shows how I objectively compare sector strength. This drives where I look for long and short candidates.
Today's Market Context
Key Headlines
- "Hurricanes Helene and Milton walloped parts of the U.S. What will they do to GDP?" (Marketwatch)
- "Dow jumps 400 points to a record on Friday, S&P 500 closes above 5,800 for the first time." (CNBC)
Key Current Readings
SP500: 5,815
Nasdaq: 18,343
Nasdaq 100: 20,272
Russell 2000: 2,234
10Y Treasury: 4.10%
2YT: 3.95%
Oil (WTI Crude): $75
Bitcoin: $62,737
Dollar Index: 102.92
Gold: $2,674
VIX: 20.46
(CNBC)
Sector ETF Analysis Contents
The following Stock Market Organizer strengthening/weakening analysis looks at the 11 SPDR ETFs and their underlying component stocks for the week ending Friday 2024-10-11, as follows:
- ETFs Summary
1.1 Current Overview
1.2 Historical Summaries - ETFs Detail
2.1 XLB Basic Materials
2.2 XLC Communications
2.3 XLE Energy
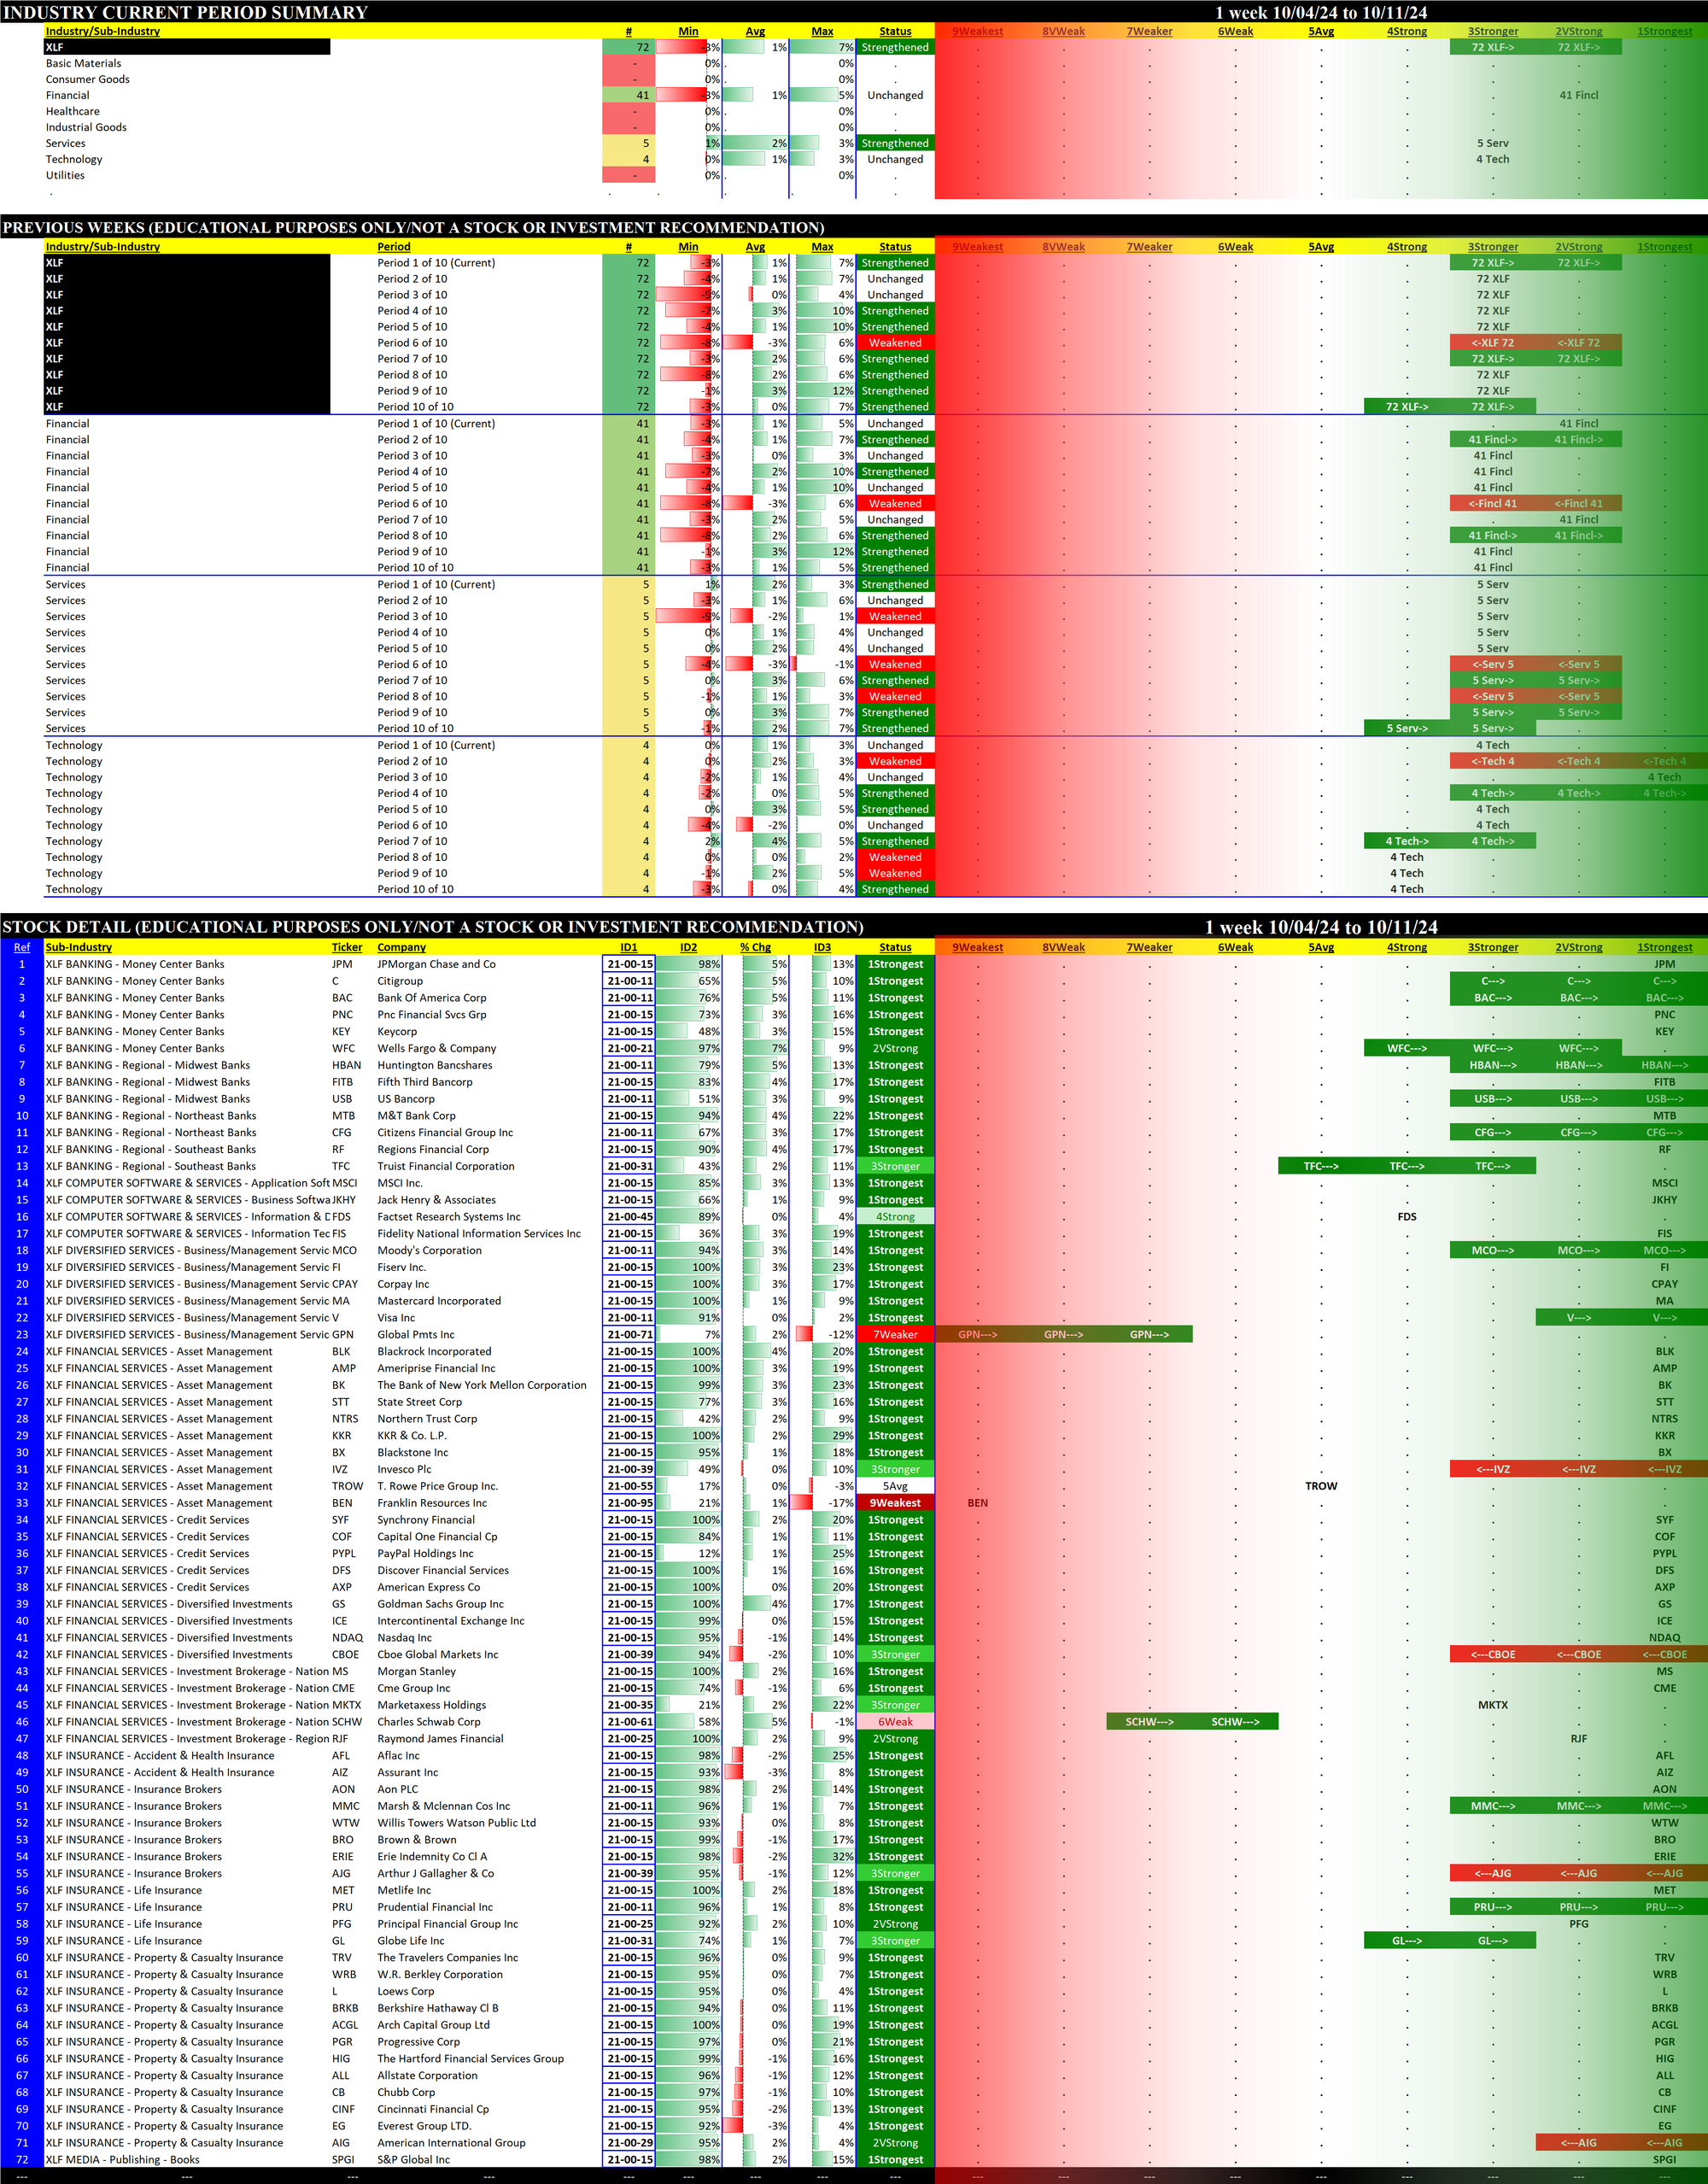
2.4 XLF Financials
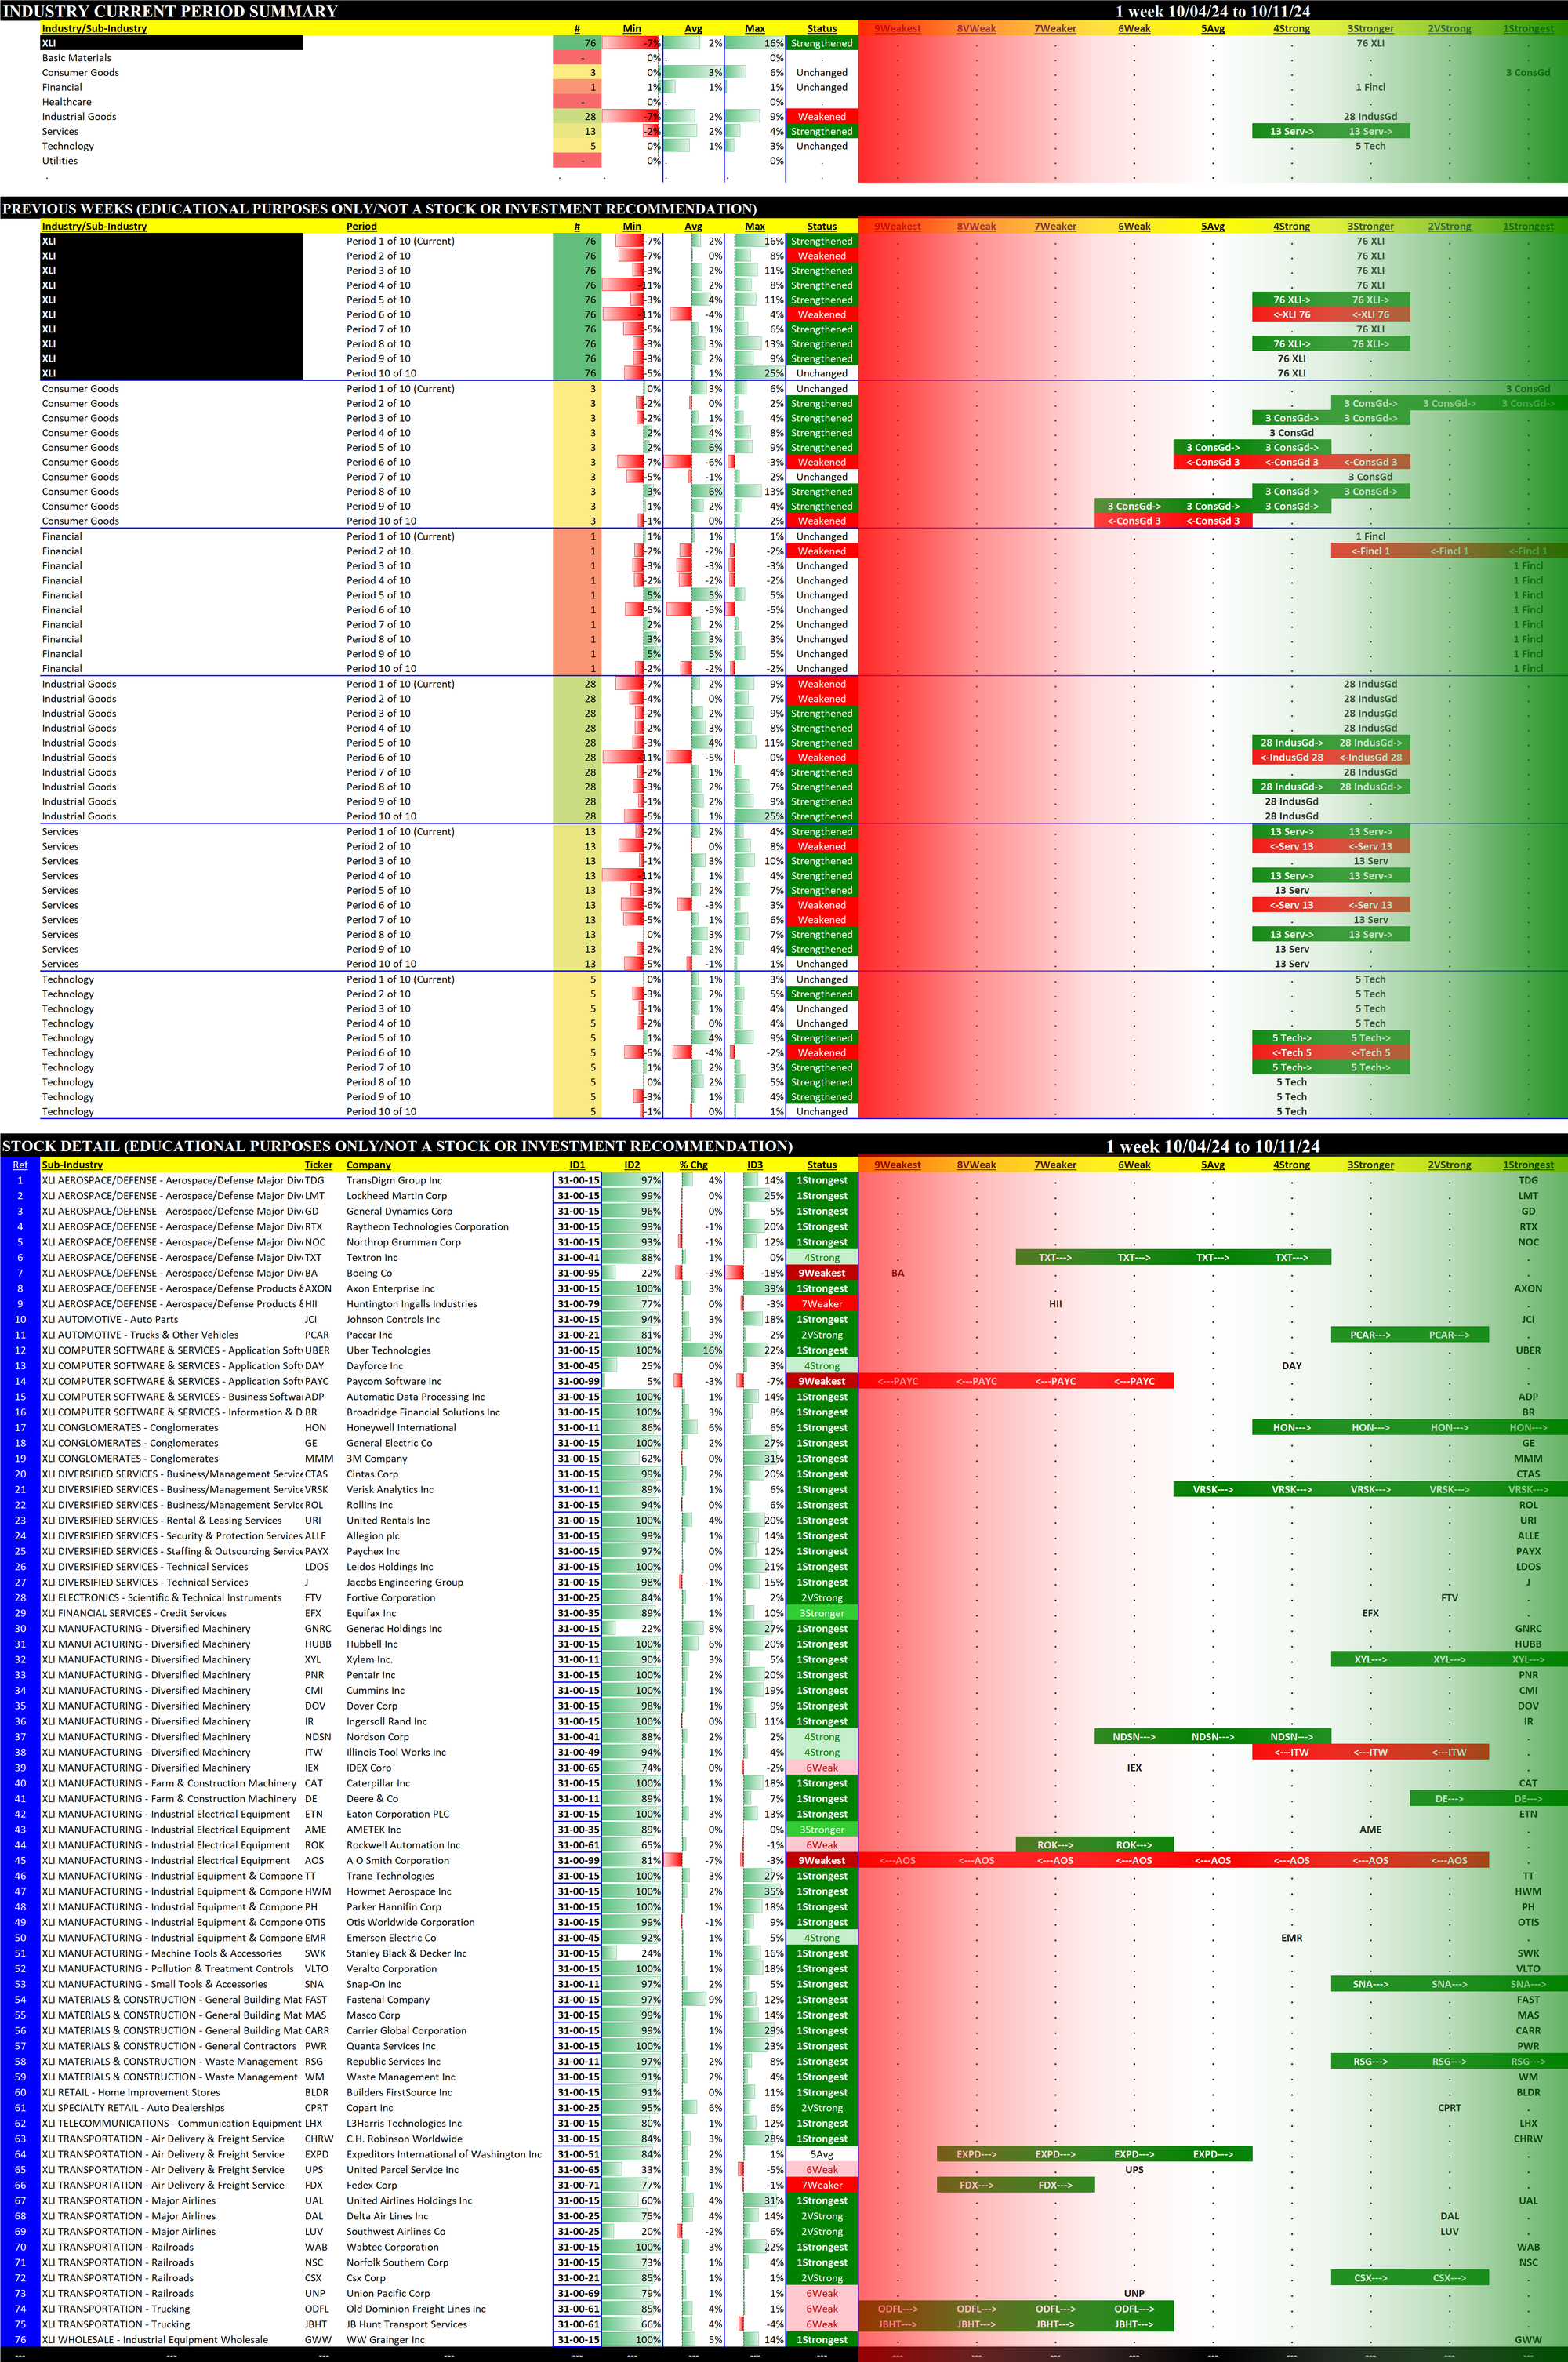
2.5 XLI Industrials
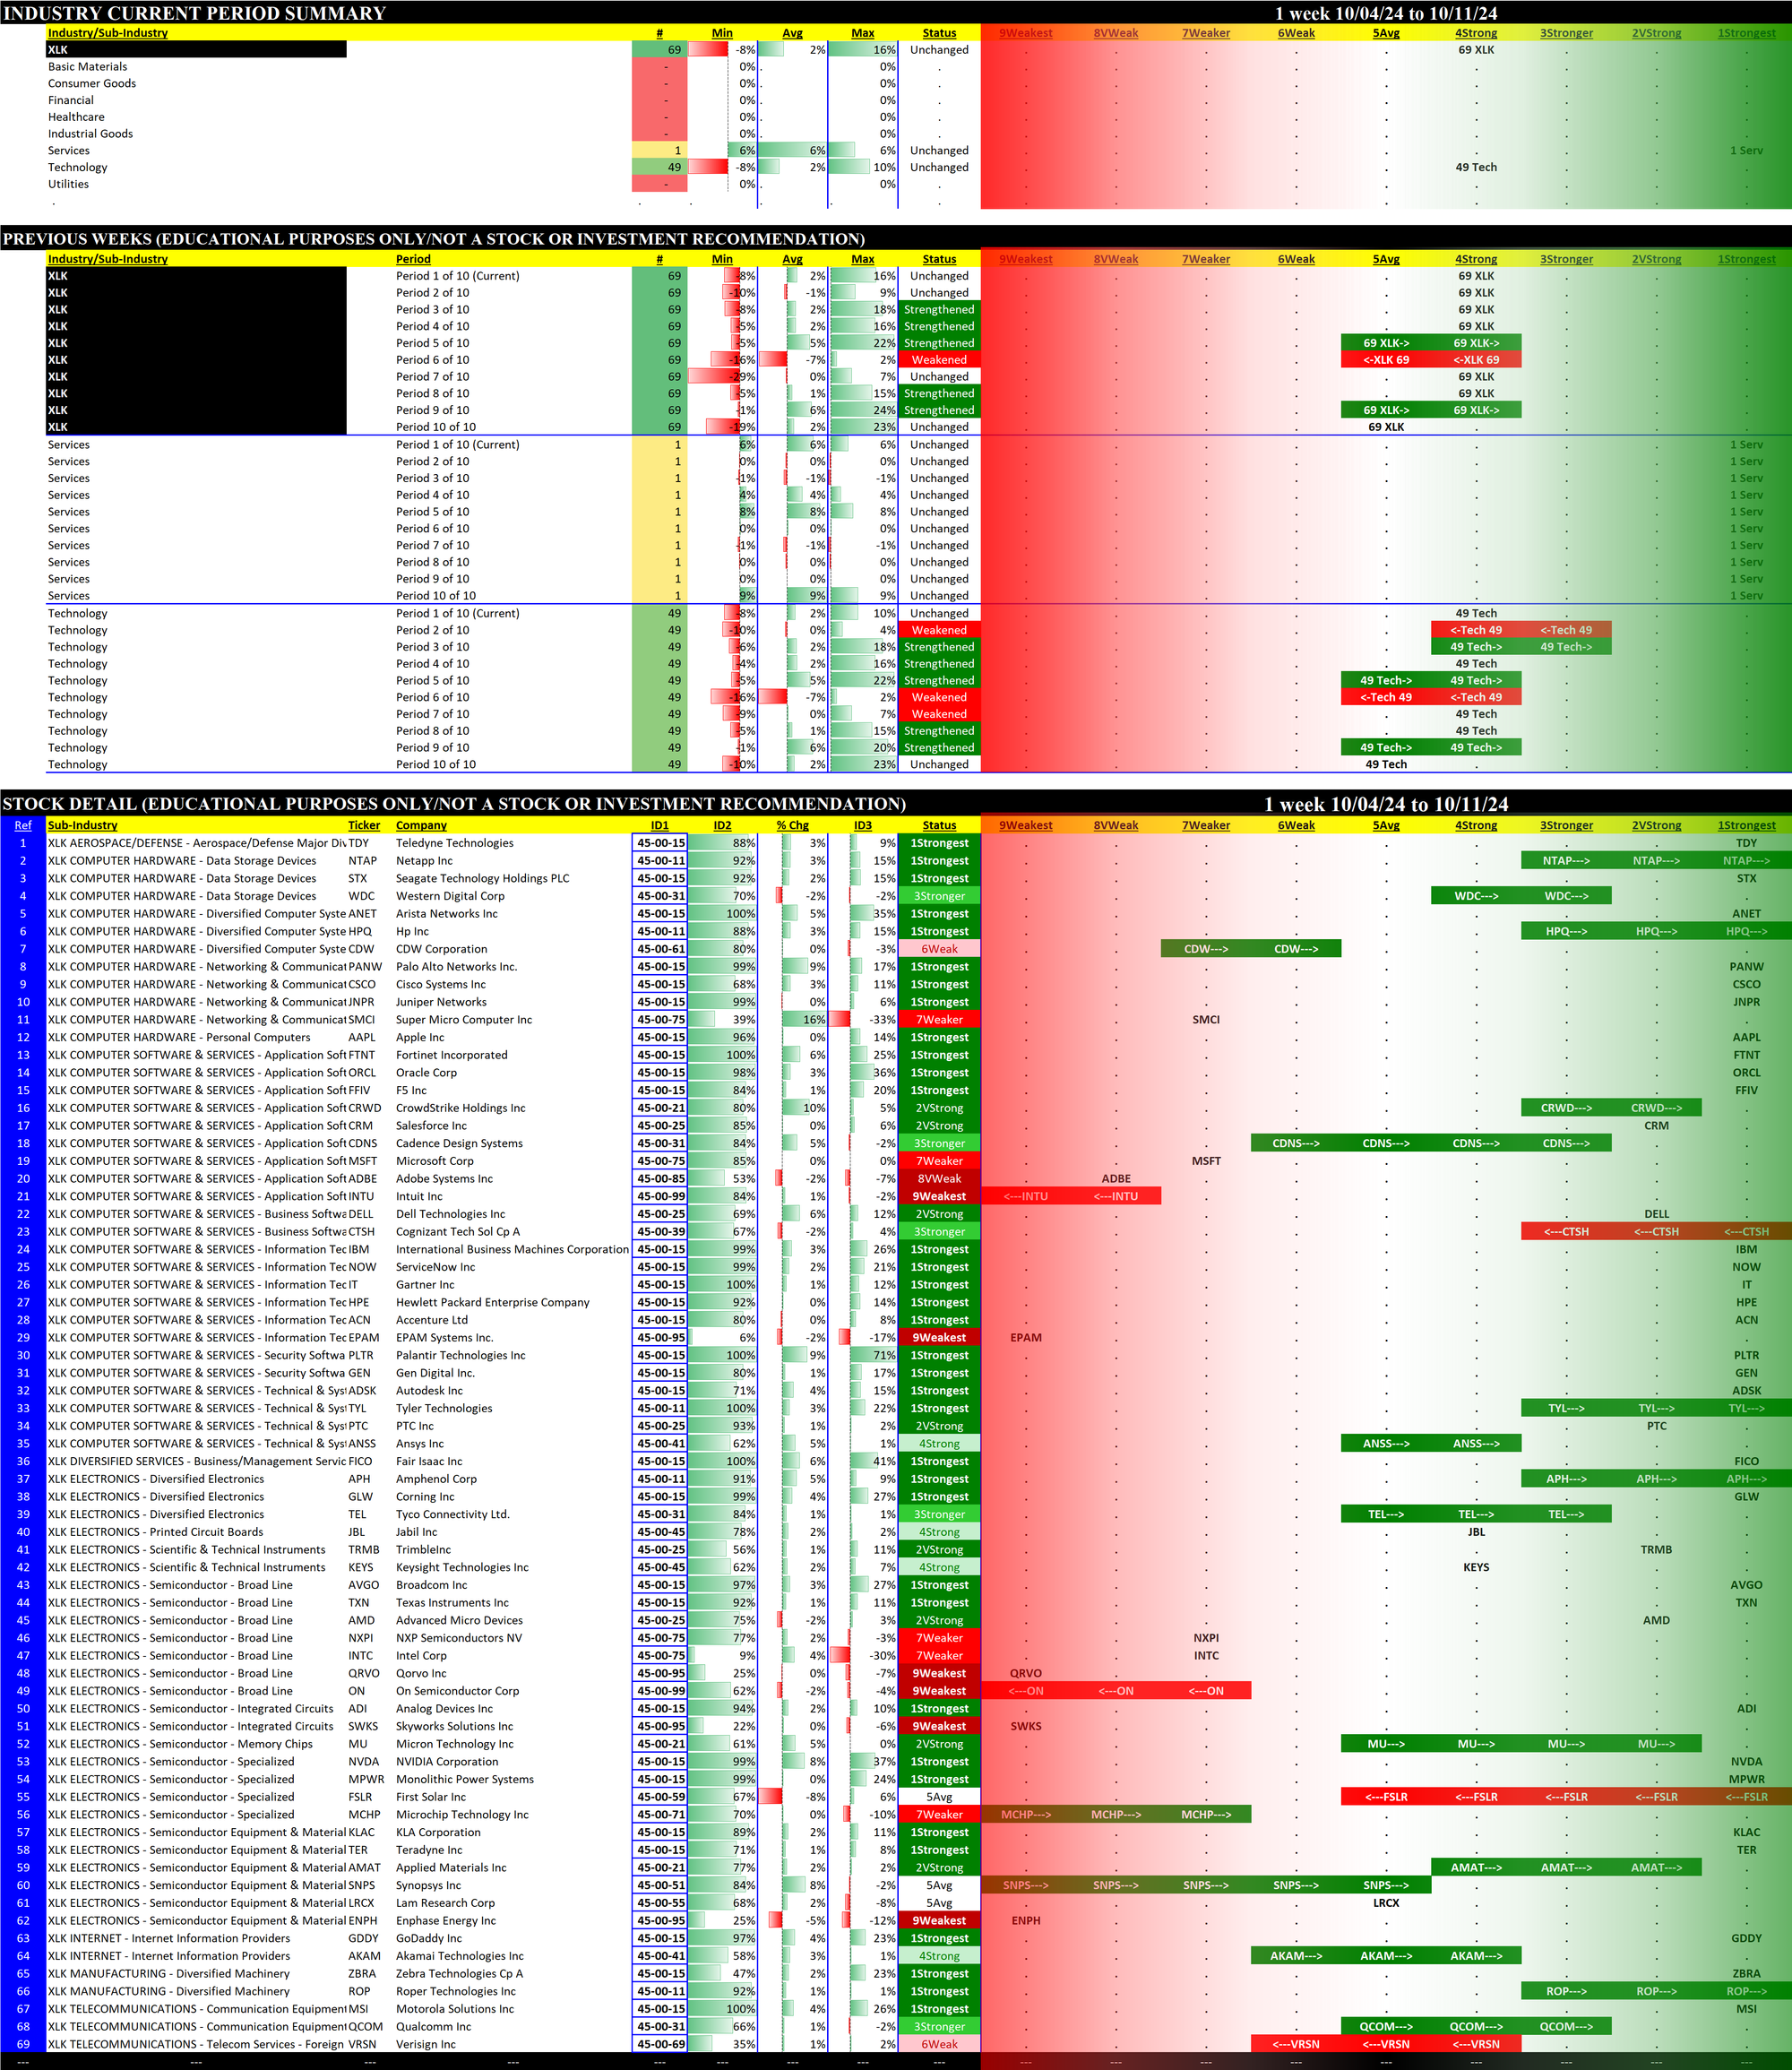
2.6 XLK Technology
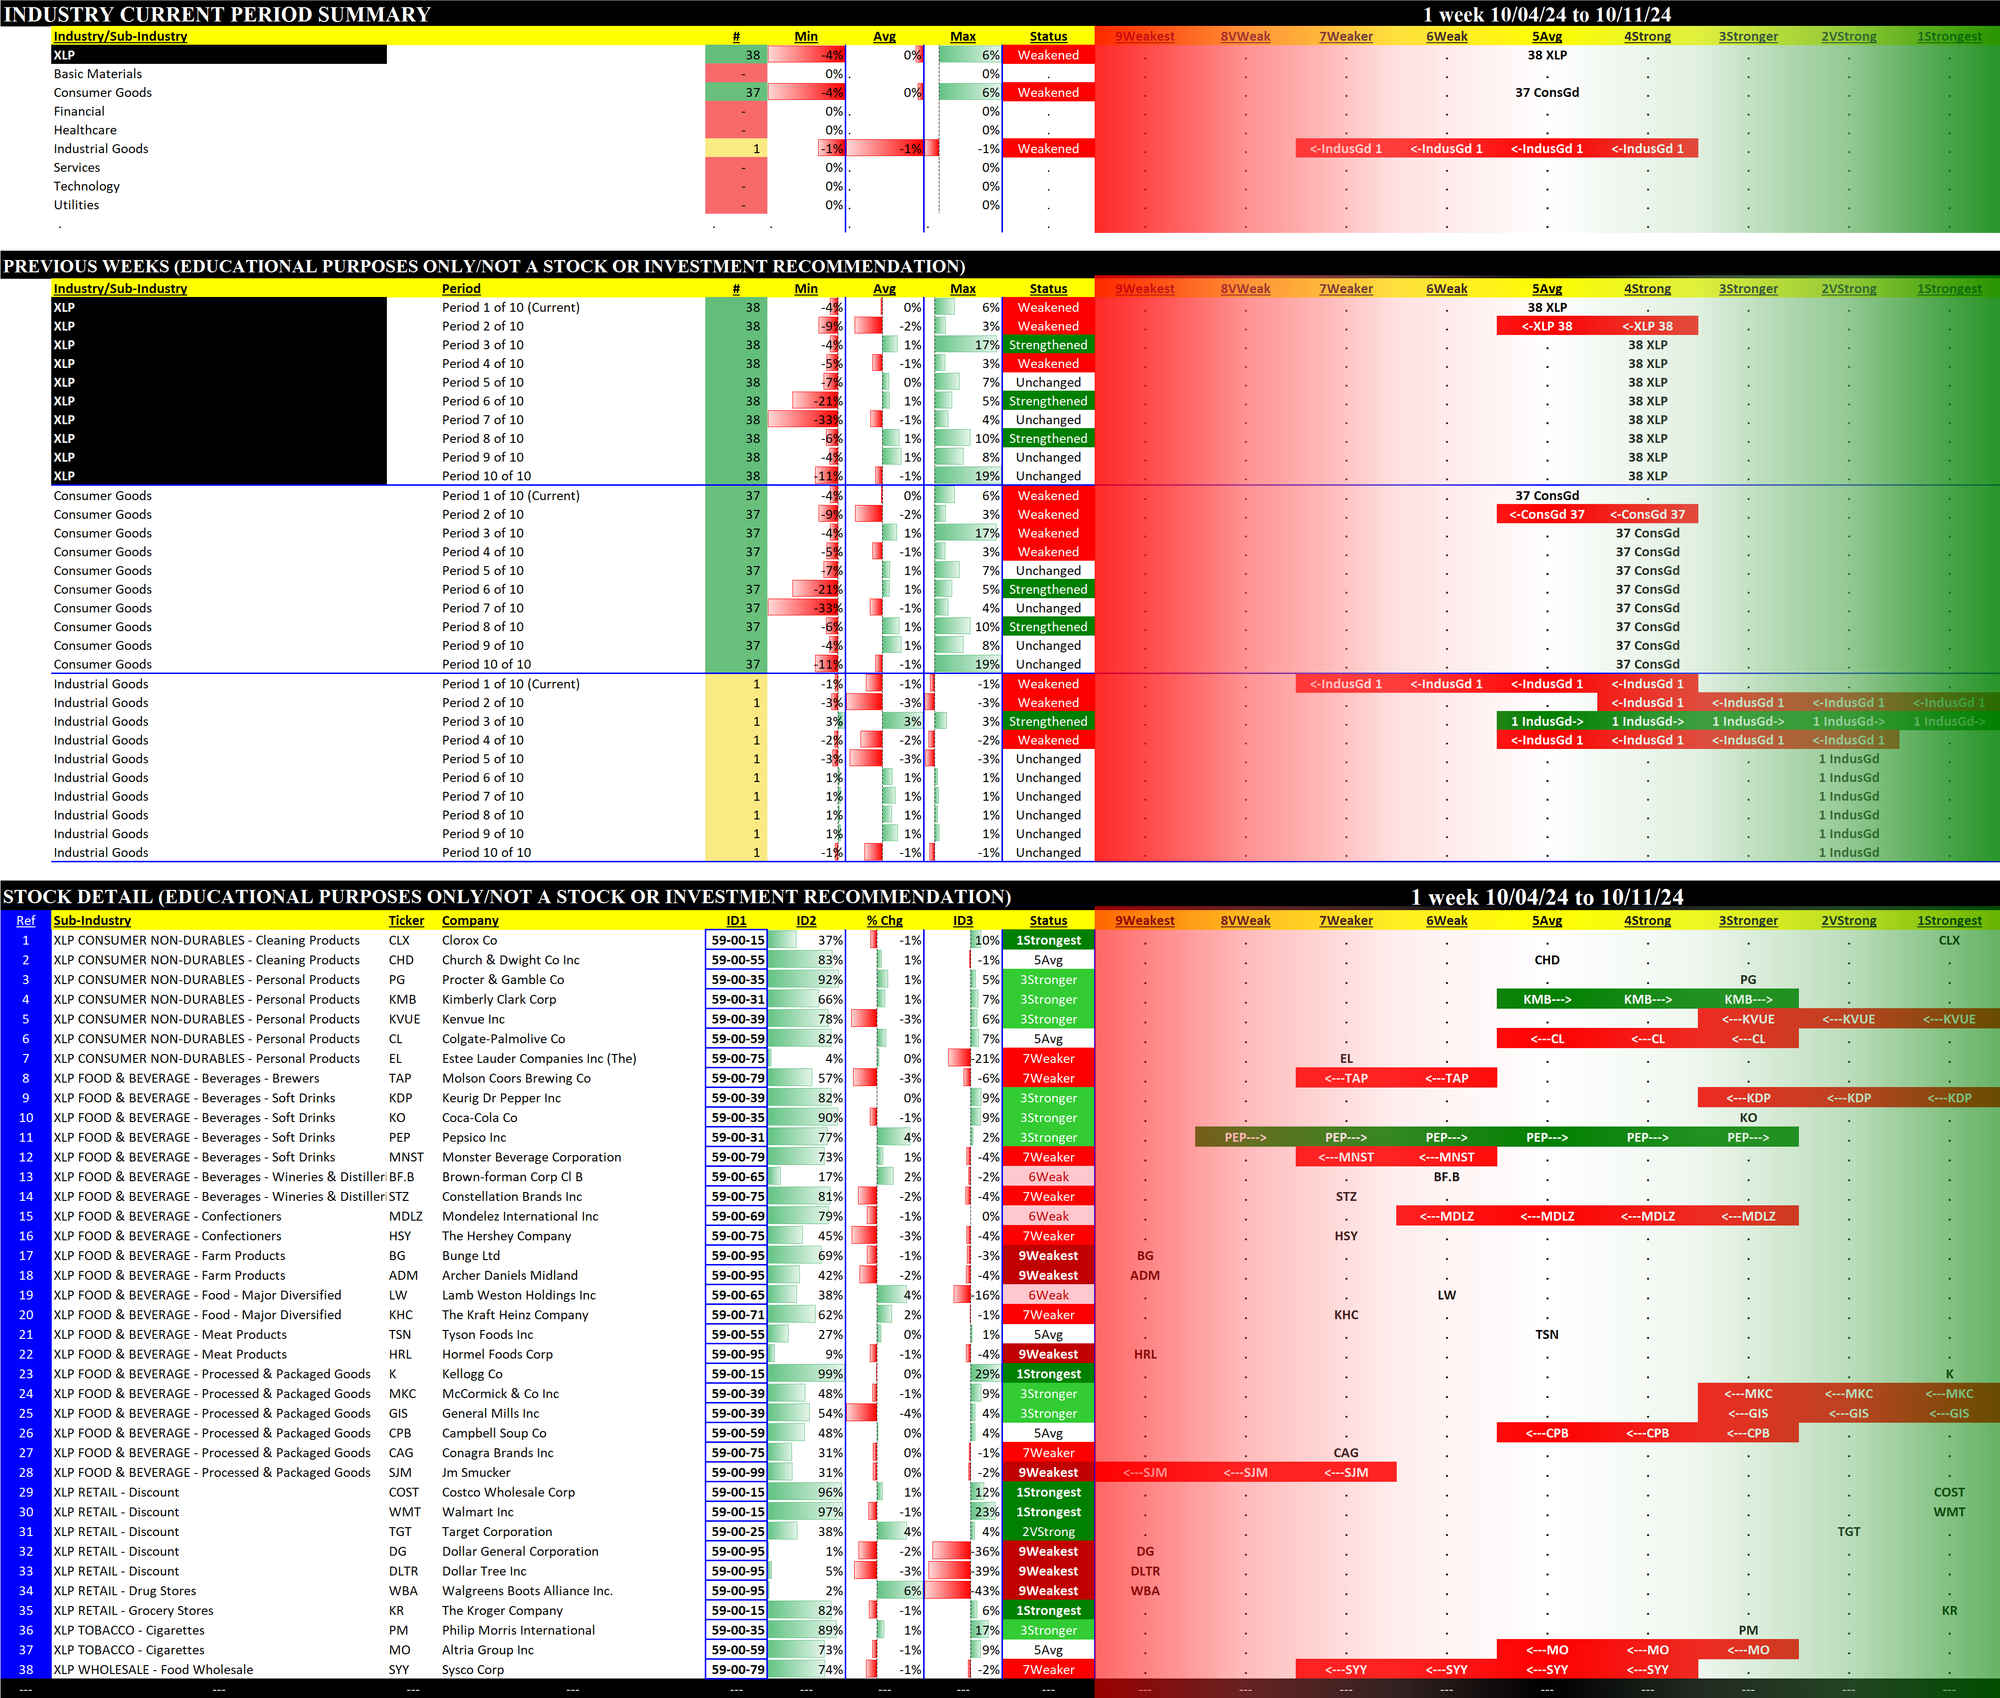
2.7 XLP Consumer Staples
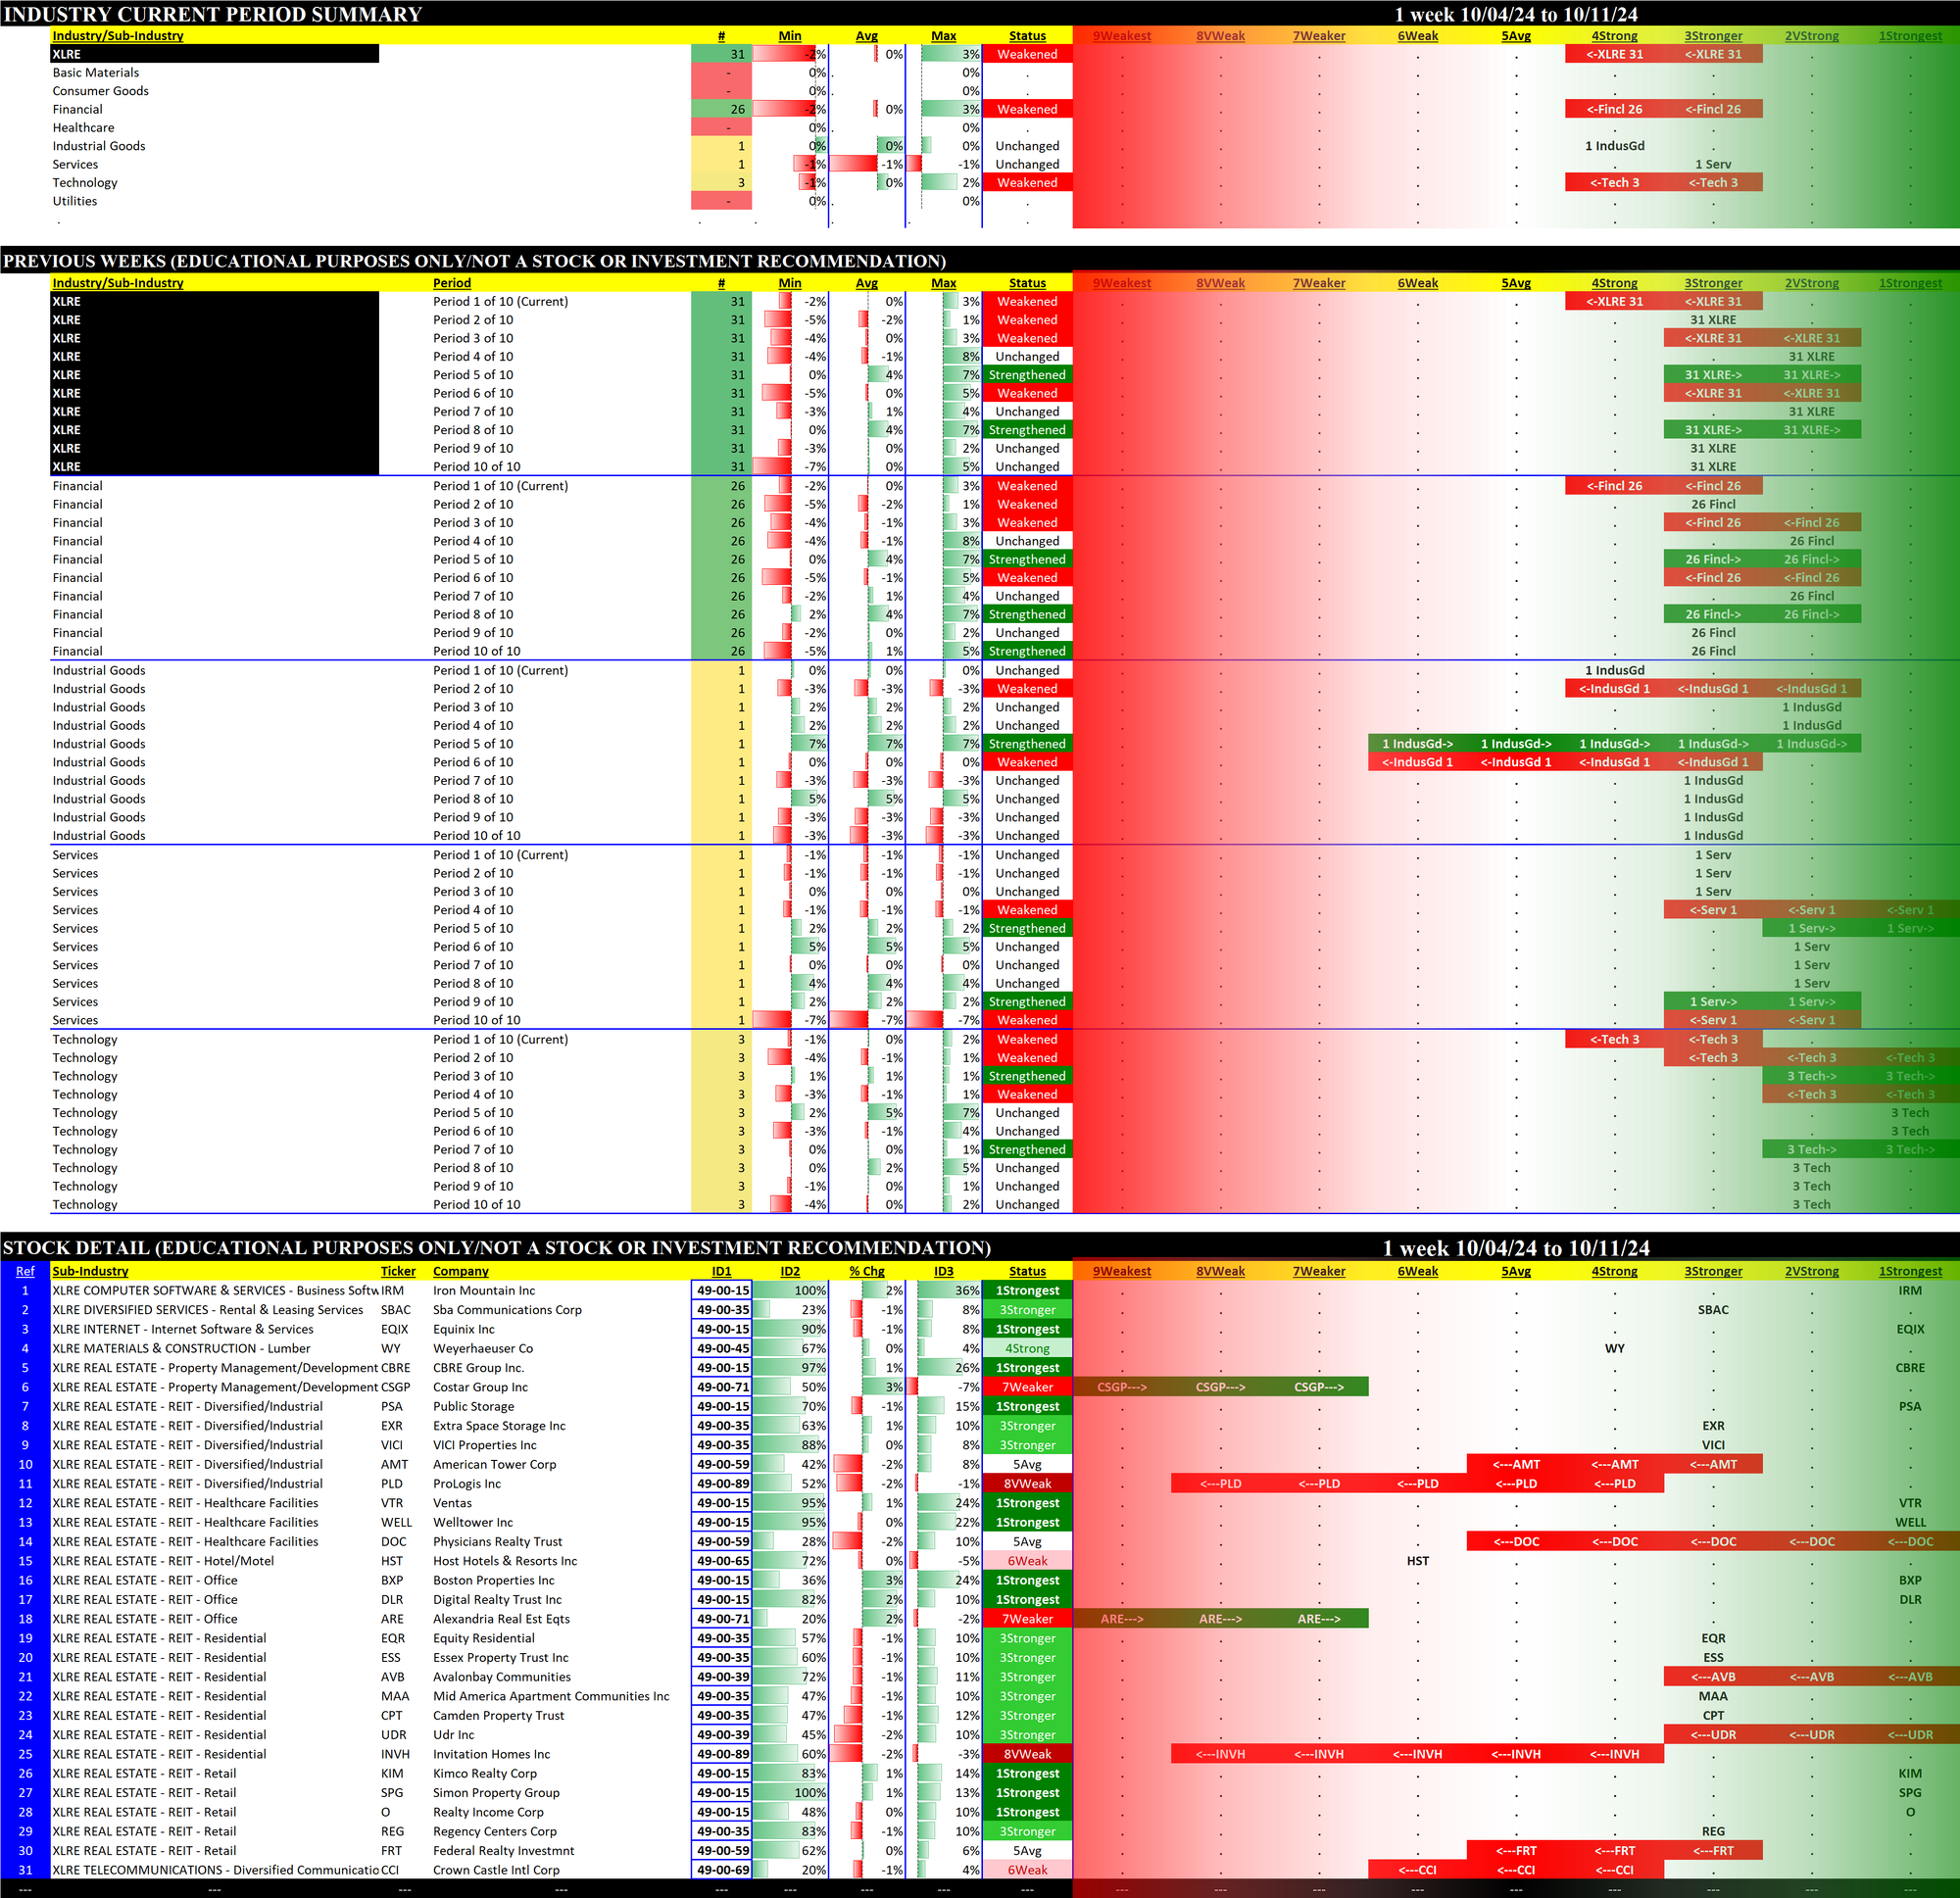
2.8 XLRE Real Estate
2.9 XLU Utilities
2.10 XLV Healthcare
2.11 XLY Consumer - Stock Detail (download)
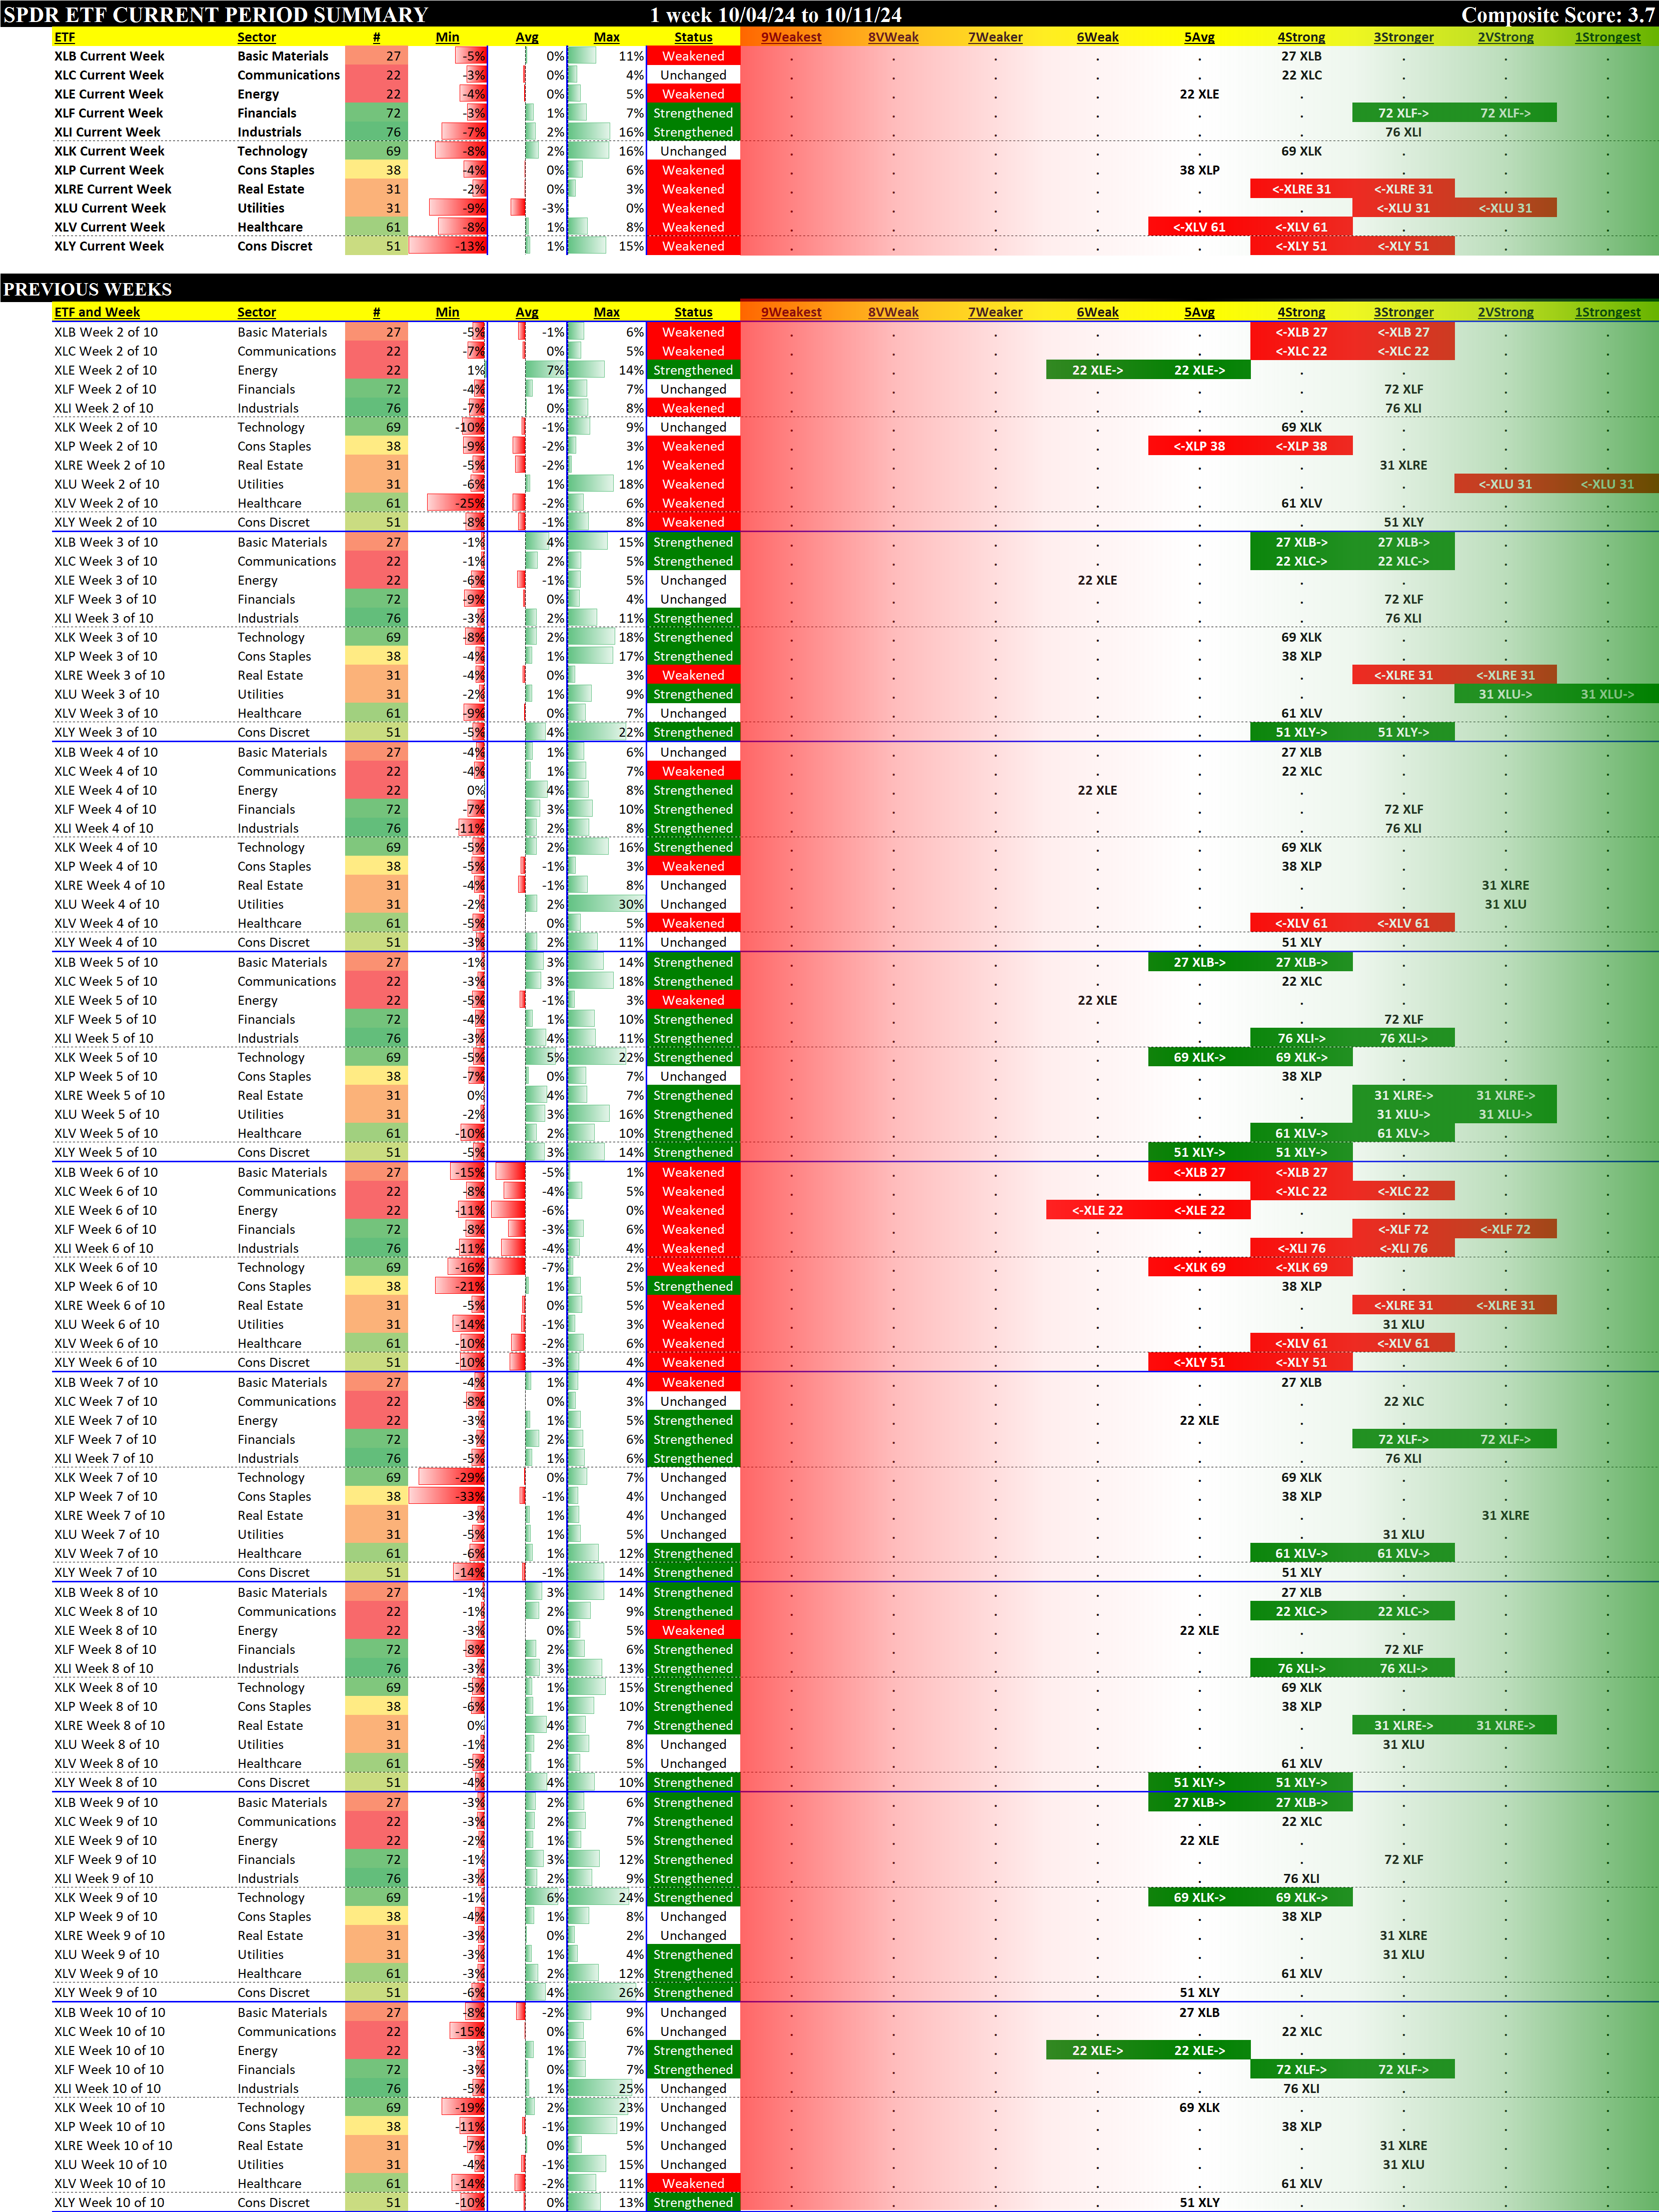
1. ETFs Summary
1.1 Current Overview
The following graphs reflect the composition of each of the ETFs based on their underlying stock strength ratings which range from 1Strongest to 9Weakest. Since I only care about the strongest and weakest in each sector, stocks rated from 2VeryStrong through 8VeryWeak are categorized as "Ignore."
- Top row: Basic Materials, Energy, and Industrials
- Second row: interest rate-sensitive ETFs Financials, Real Estate, and Utilities
- Third row: Technology and Telecommunications
- Bottom row: Consumer Staples, Consumer Discretionary, and Healthcare
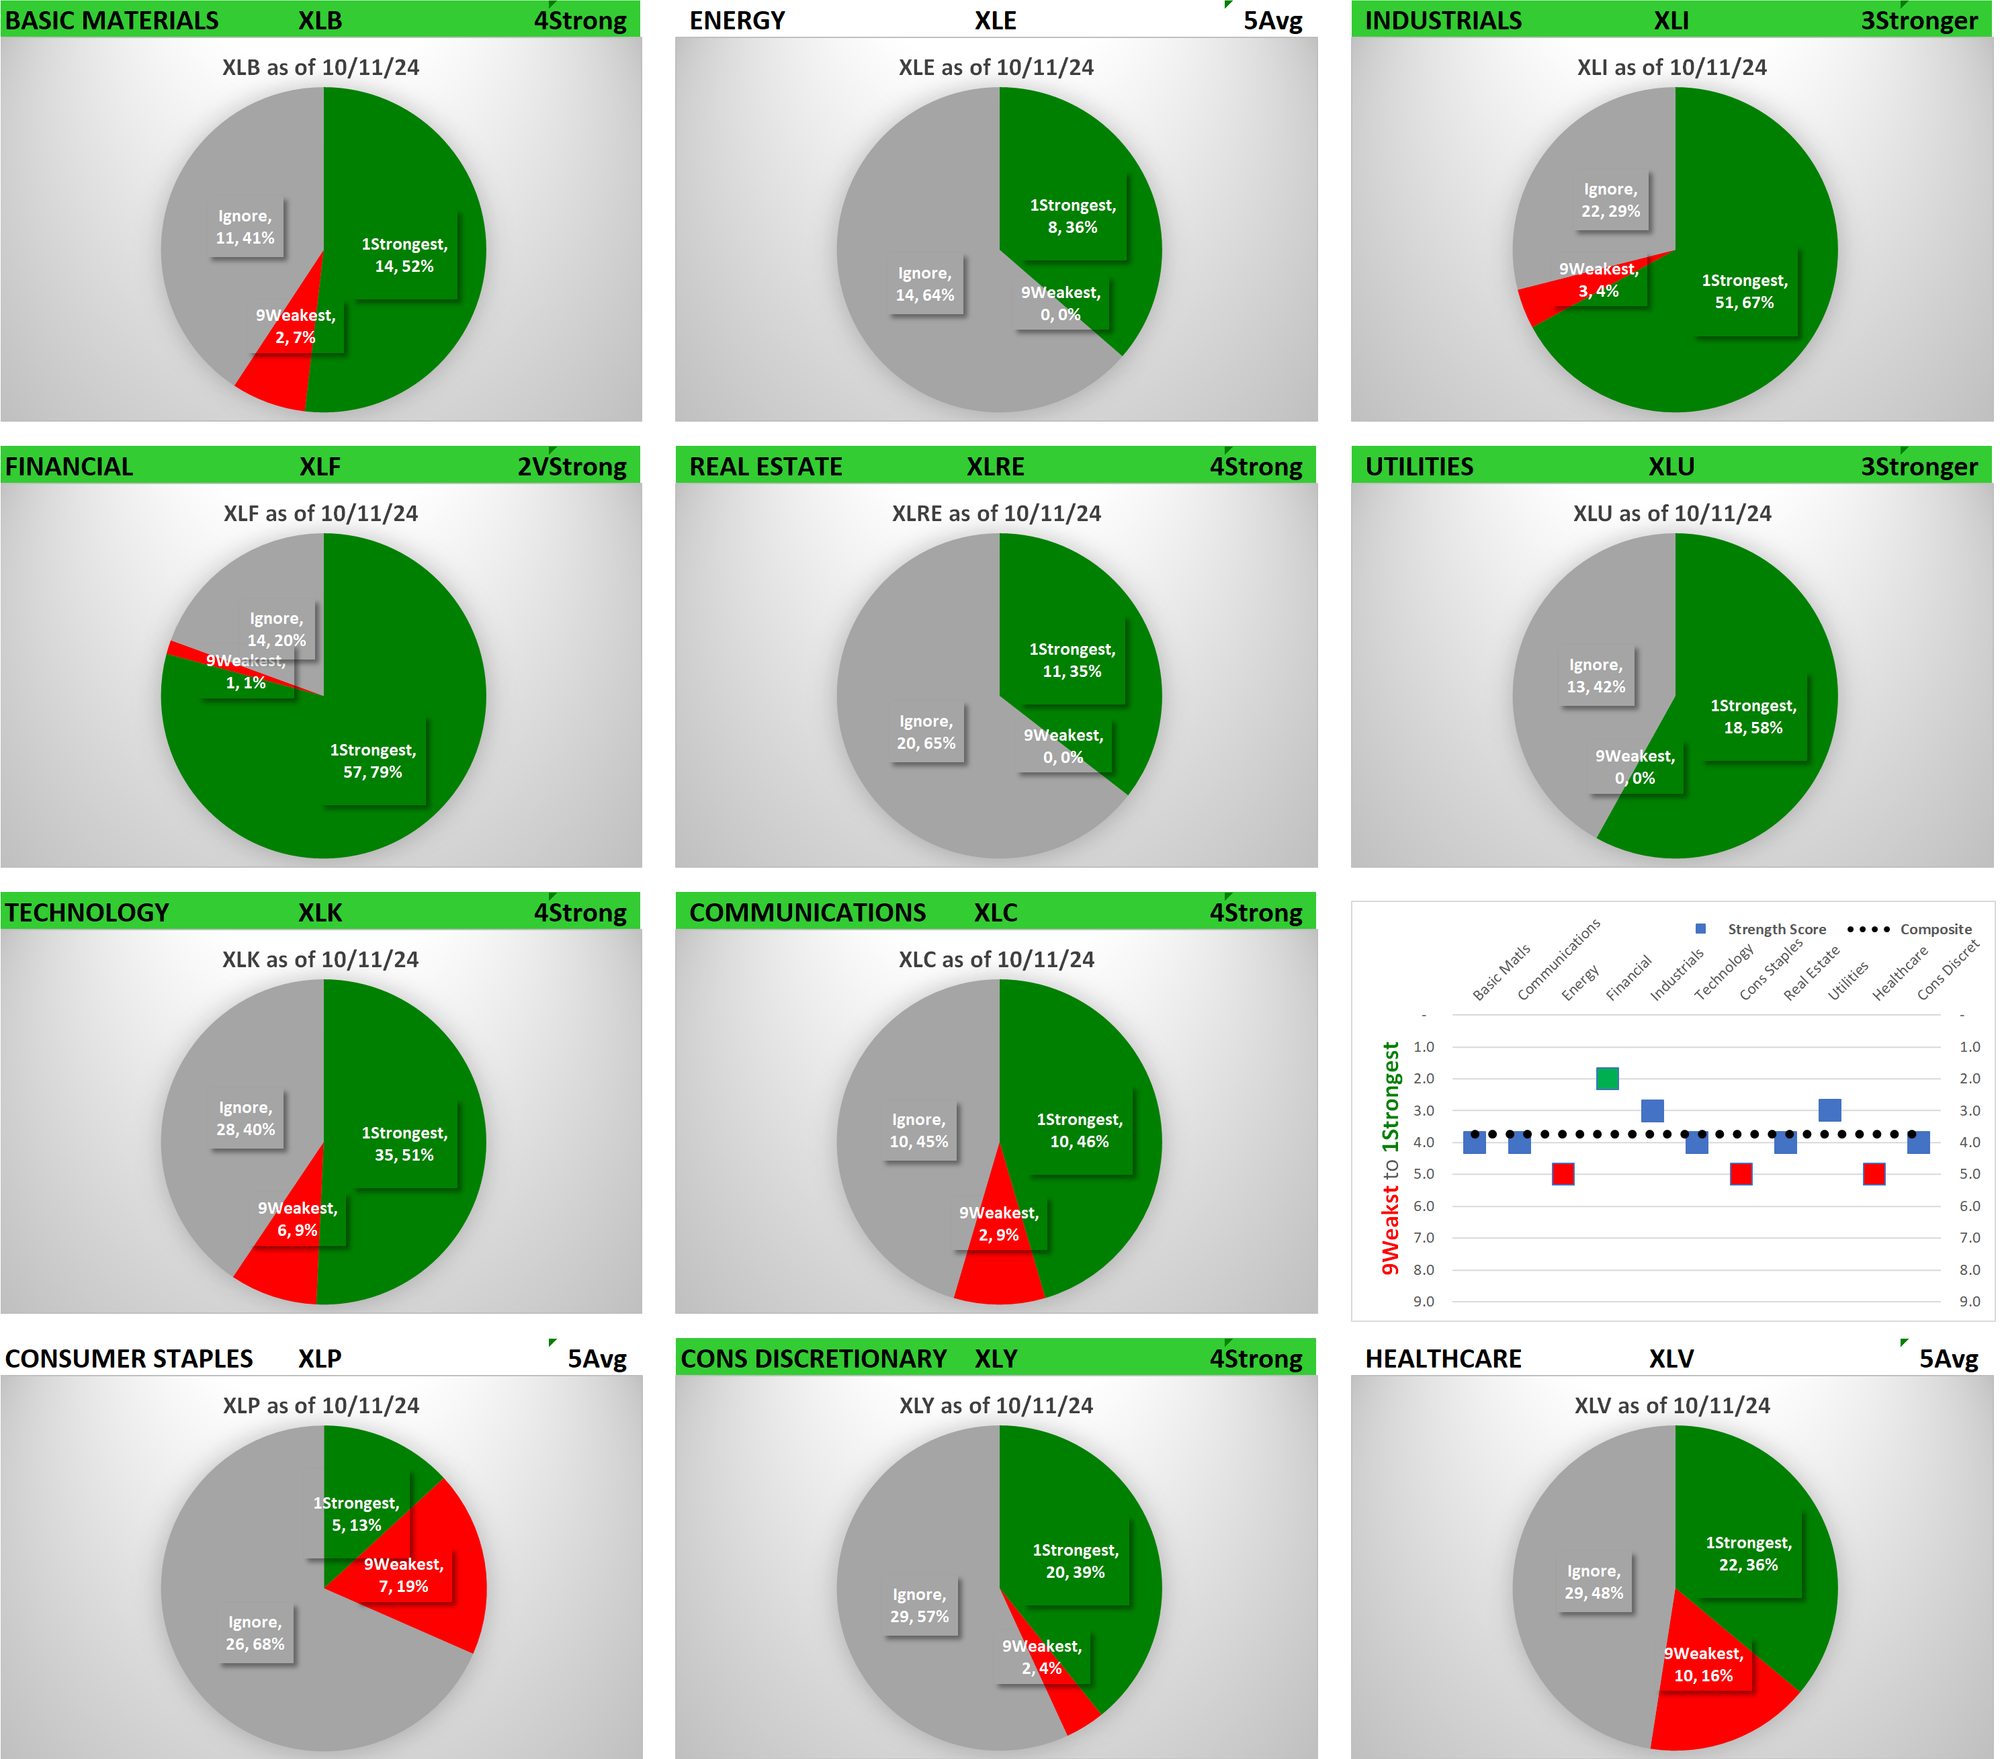
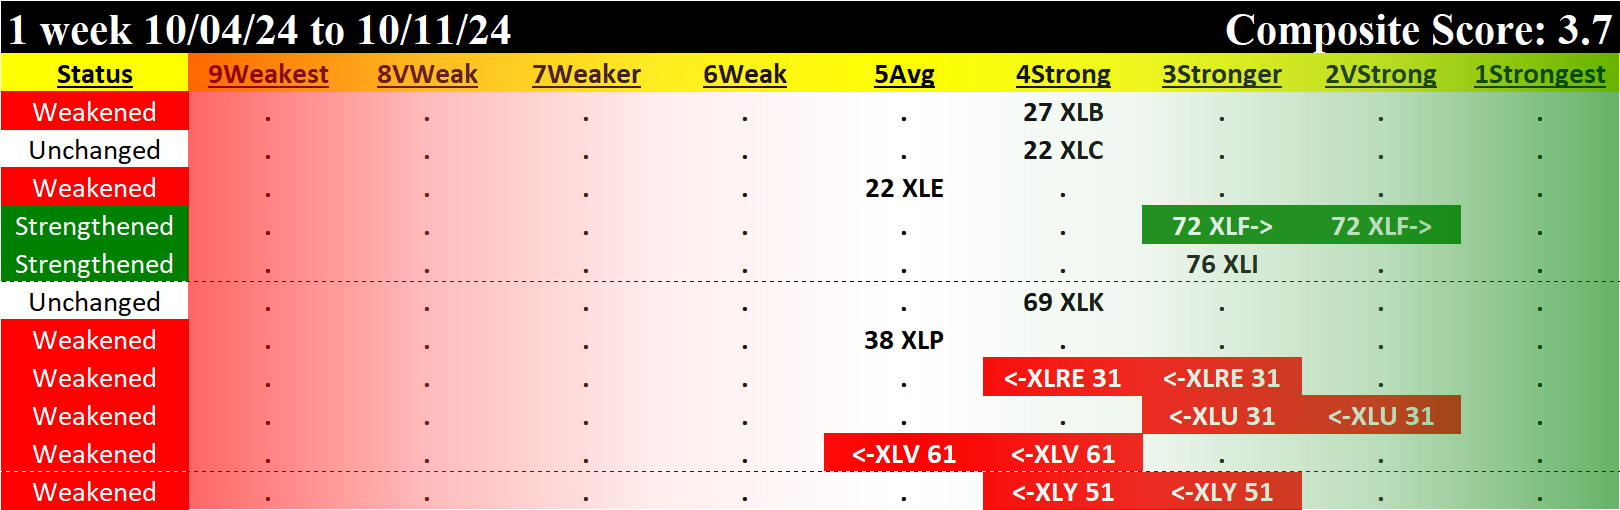
The headers for each graphic are color-coded. This week, there are 8 of 11 ETFs with a 4Stronger or better strength rating and each has a green heading. There are 3 of 11 ETFs with a 5Average rating.
ETFs Stronger than the 3.7 Composite Score:
- XLF/Financial (Strengthened)
- XLI/Industrials (Strengthened)
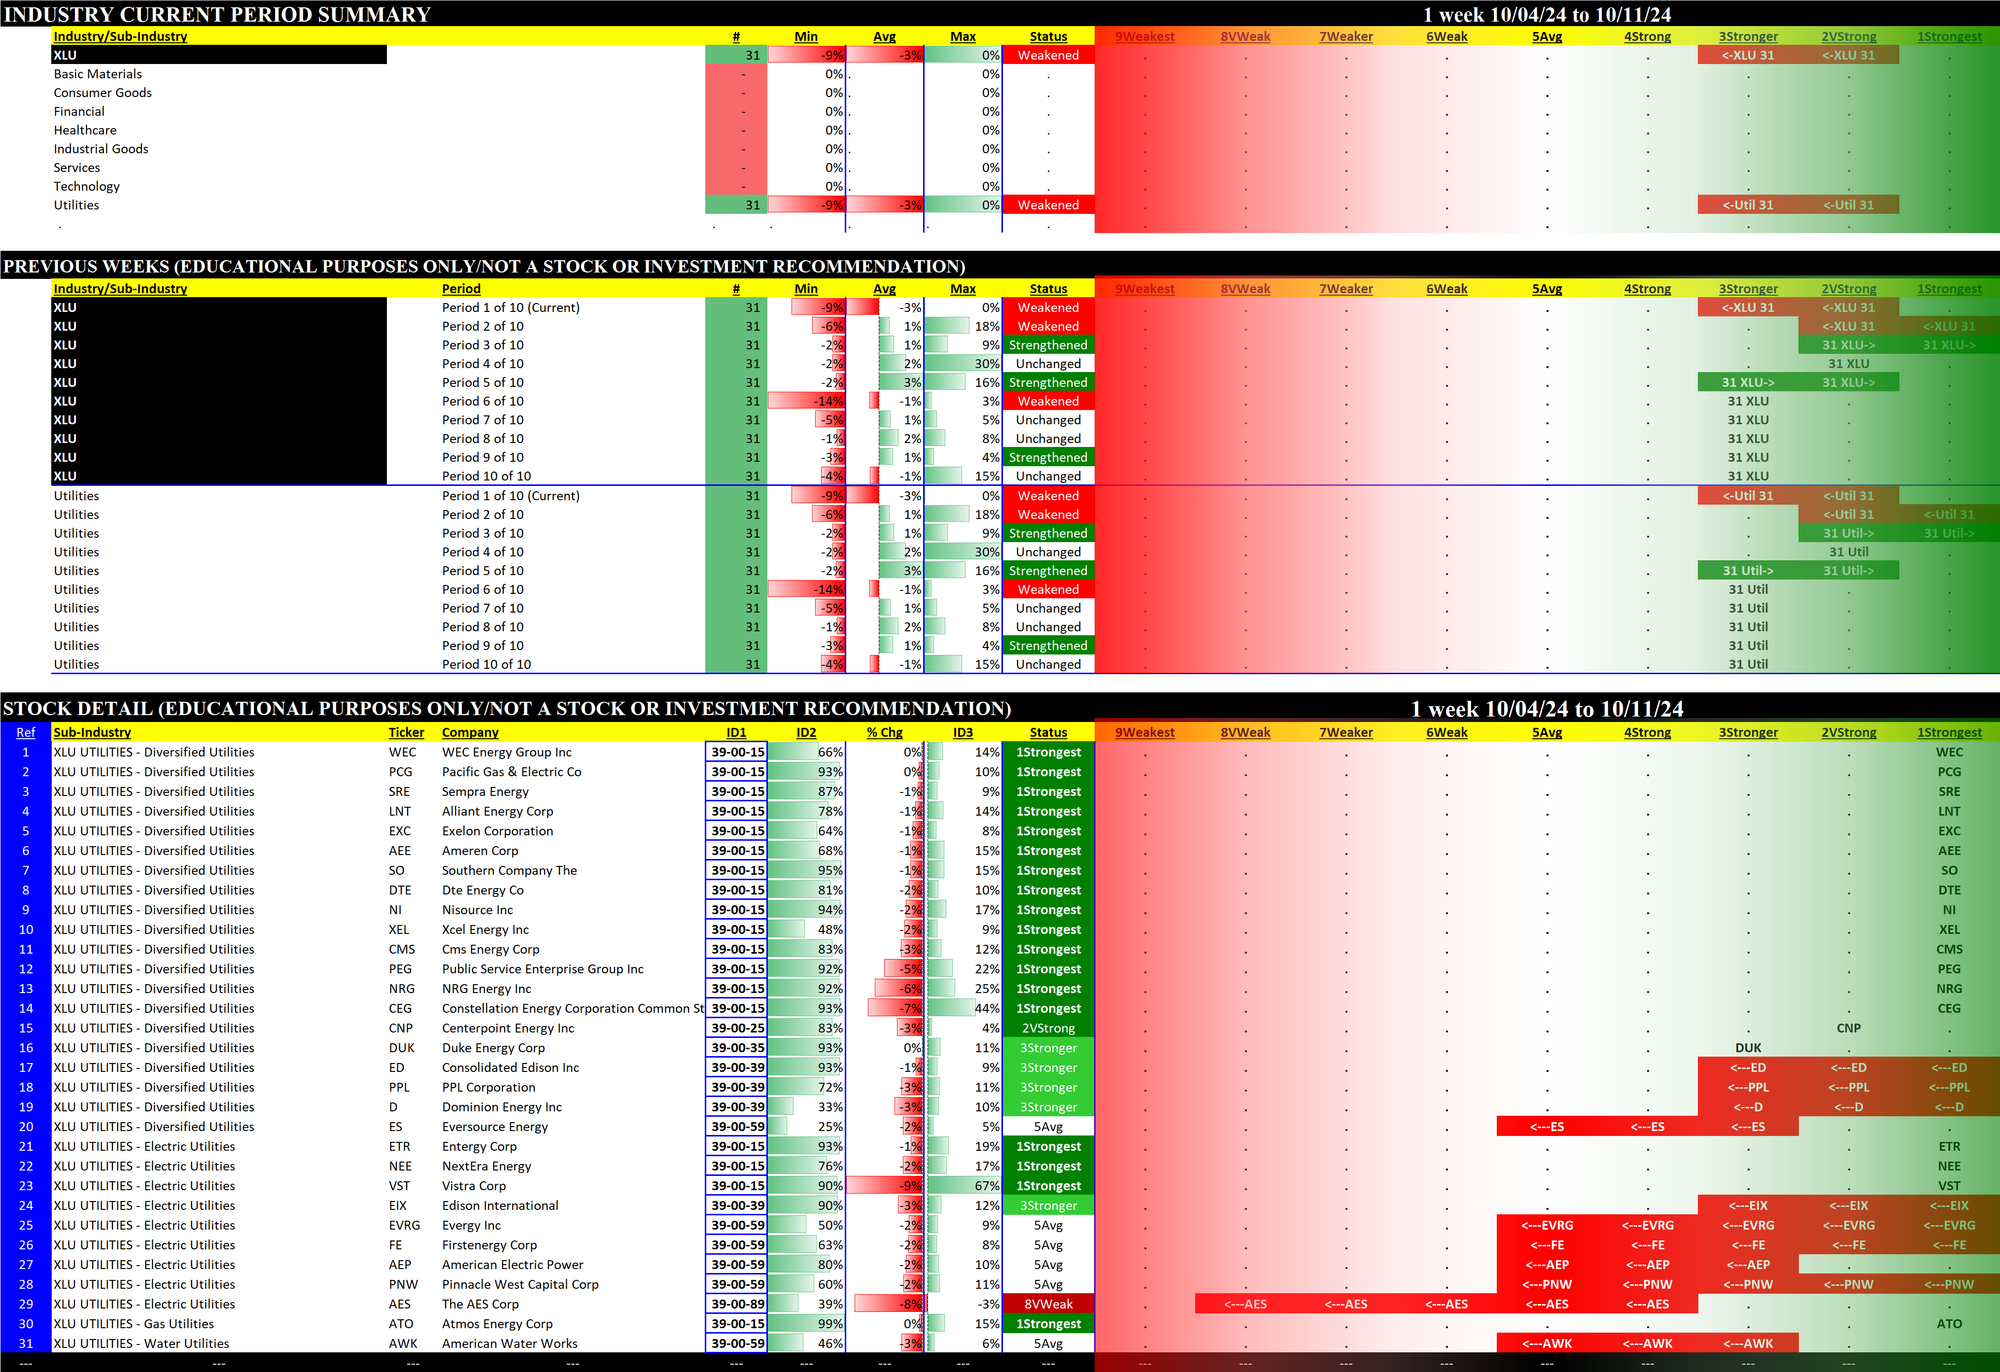
- XLU/Utilities (Weakened)
ETFs Weaker than the 3.7 Composite Score:
- XLB/Basic Materials (Weakened)
- XLC/Communications (Unchanged)
- XLE/Energy (Weakened)
- XLK/Technology (Unchanged)
- XLP/Consumer Staples (Weakened)
- XLRE/Real Estate (Weakened)
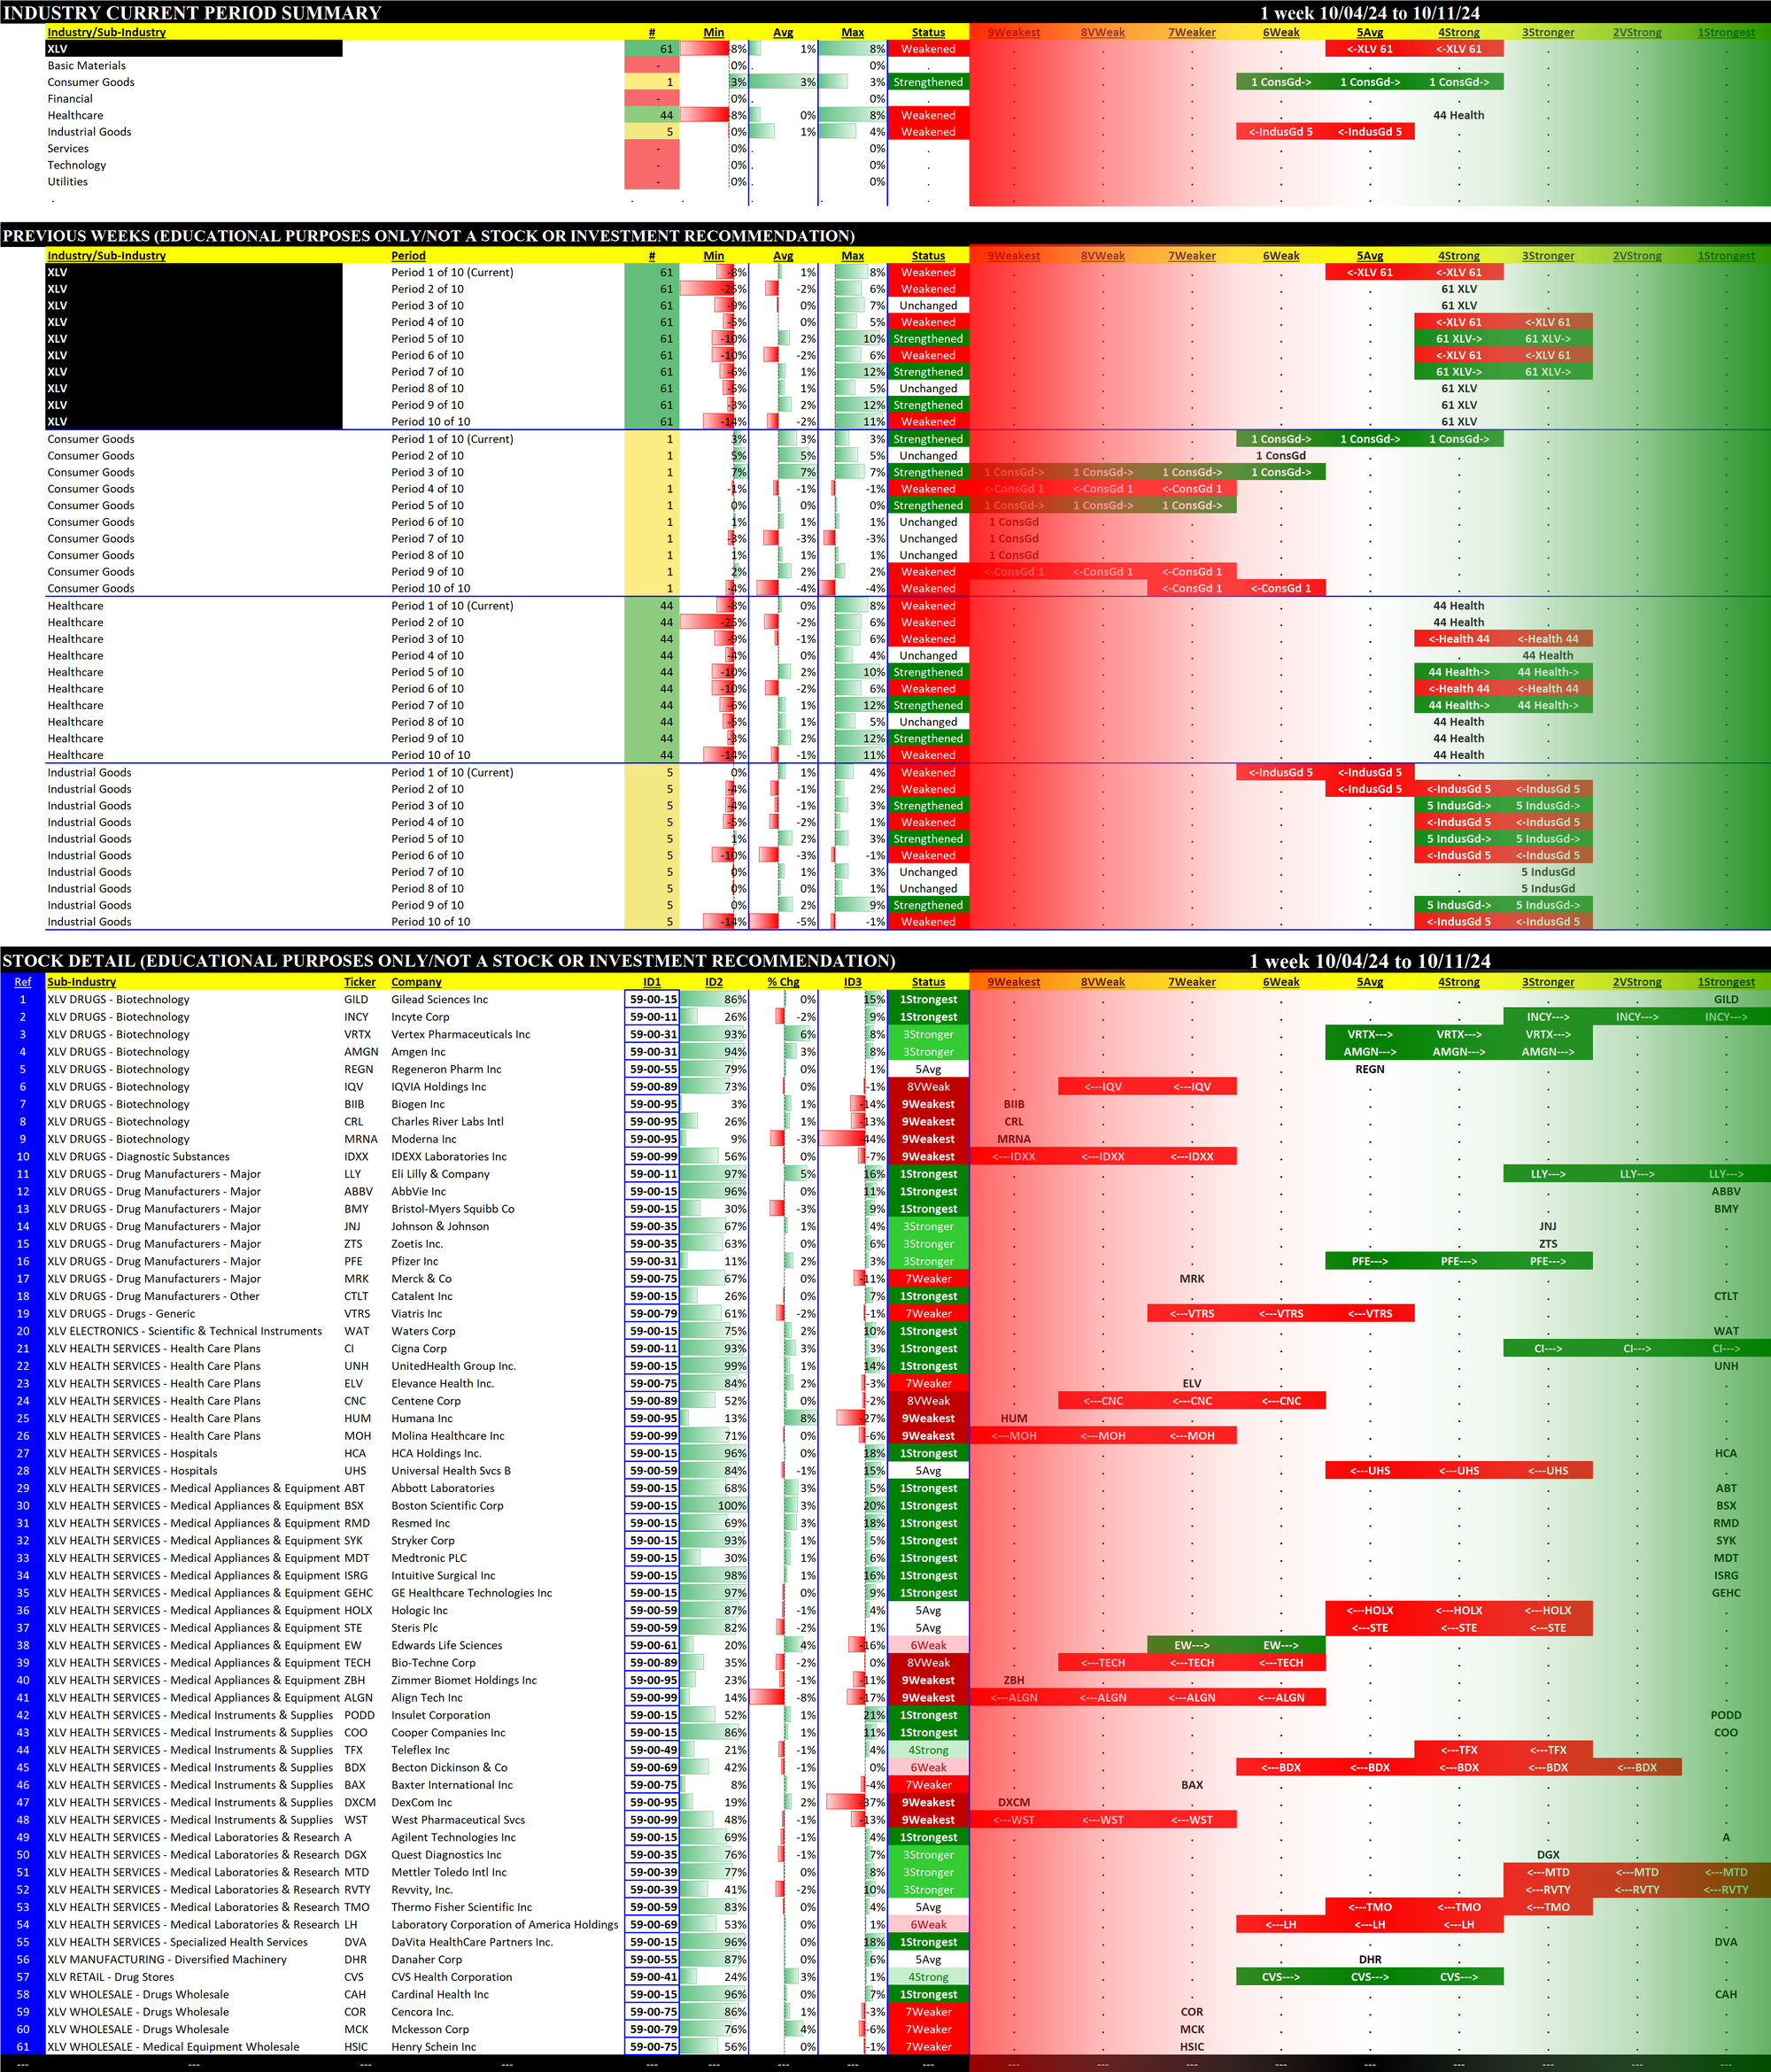
- XLV/Healthcare (Weakened)
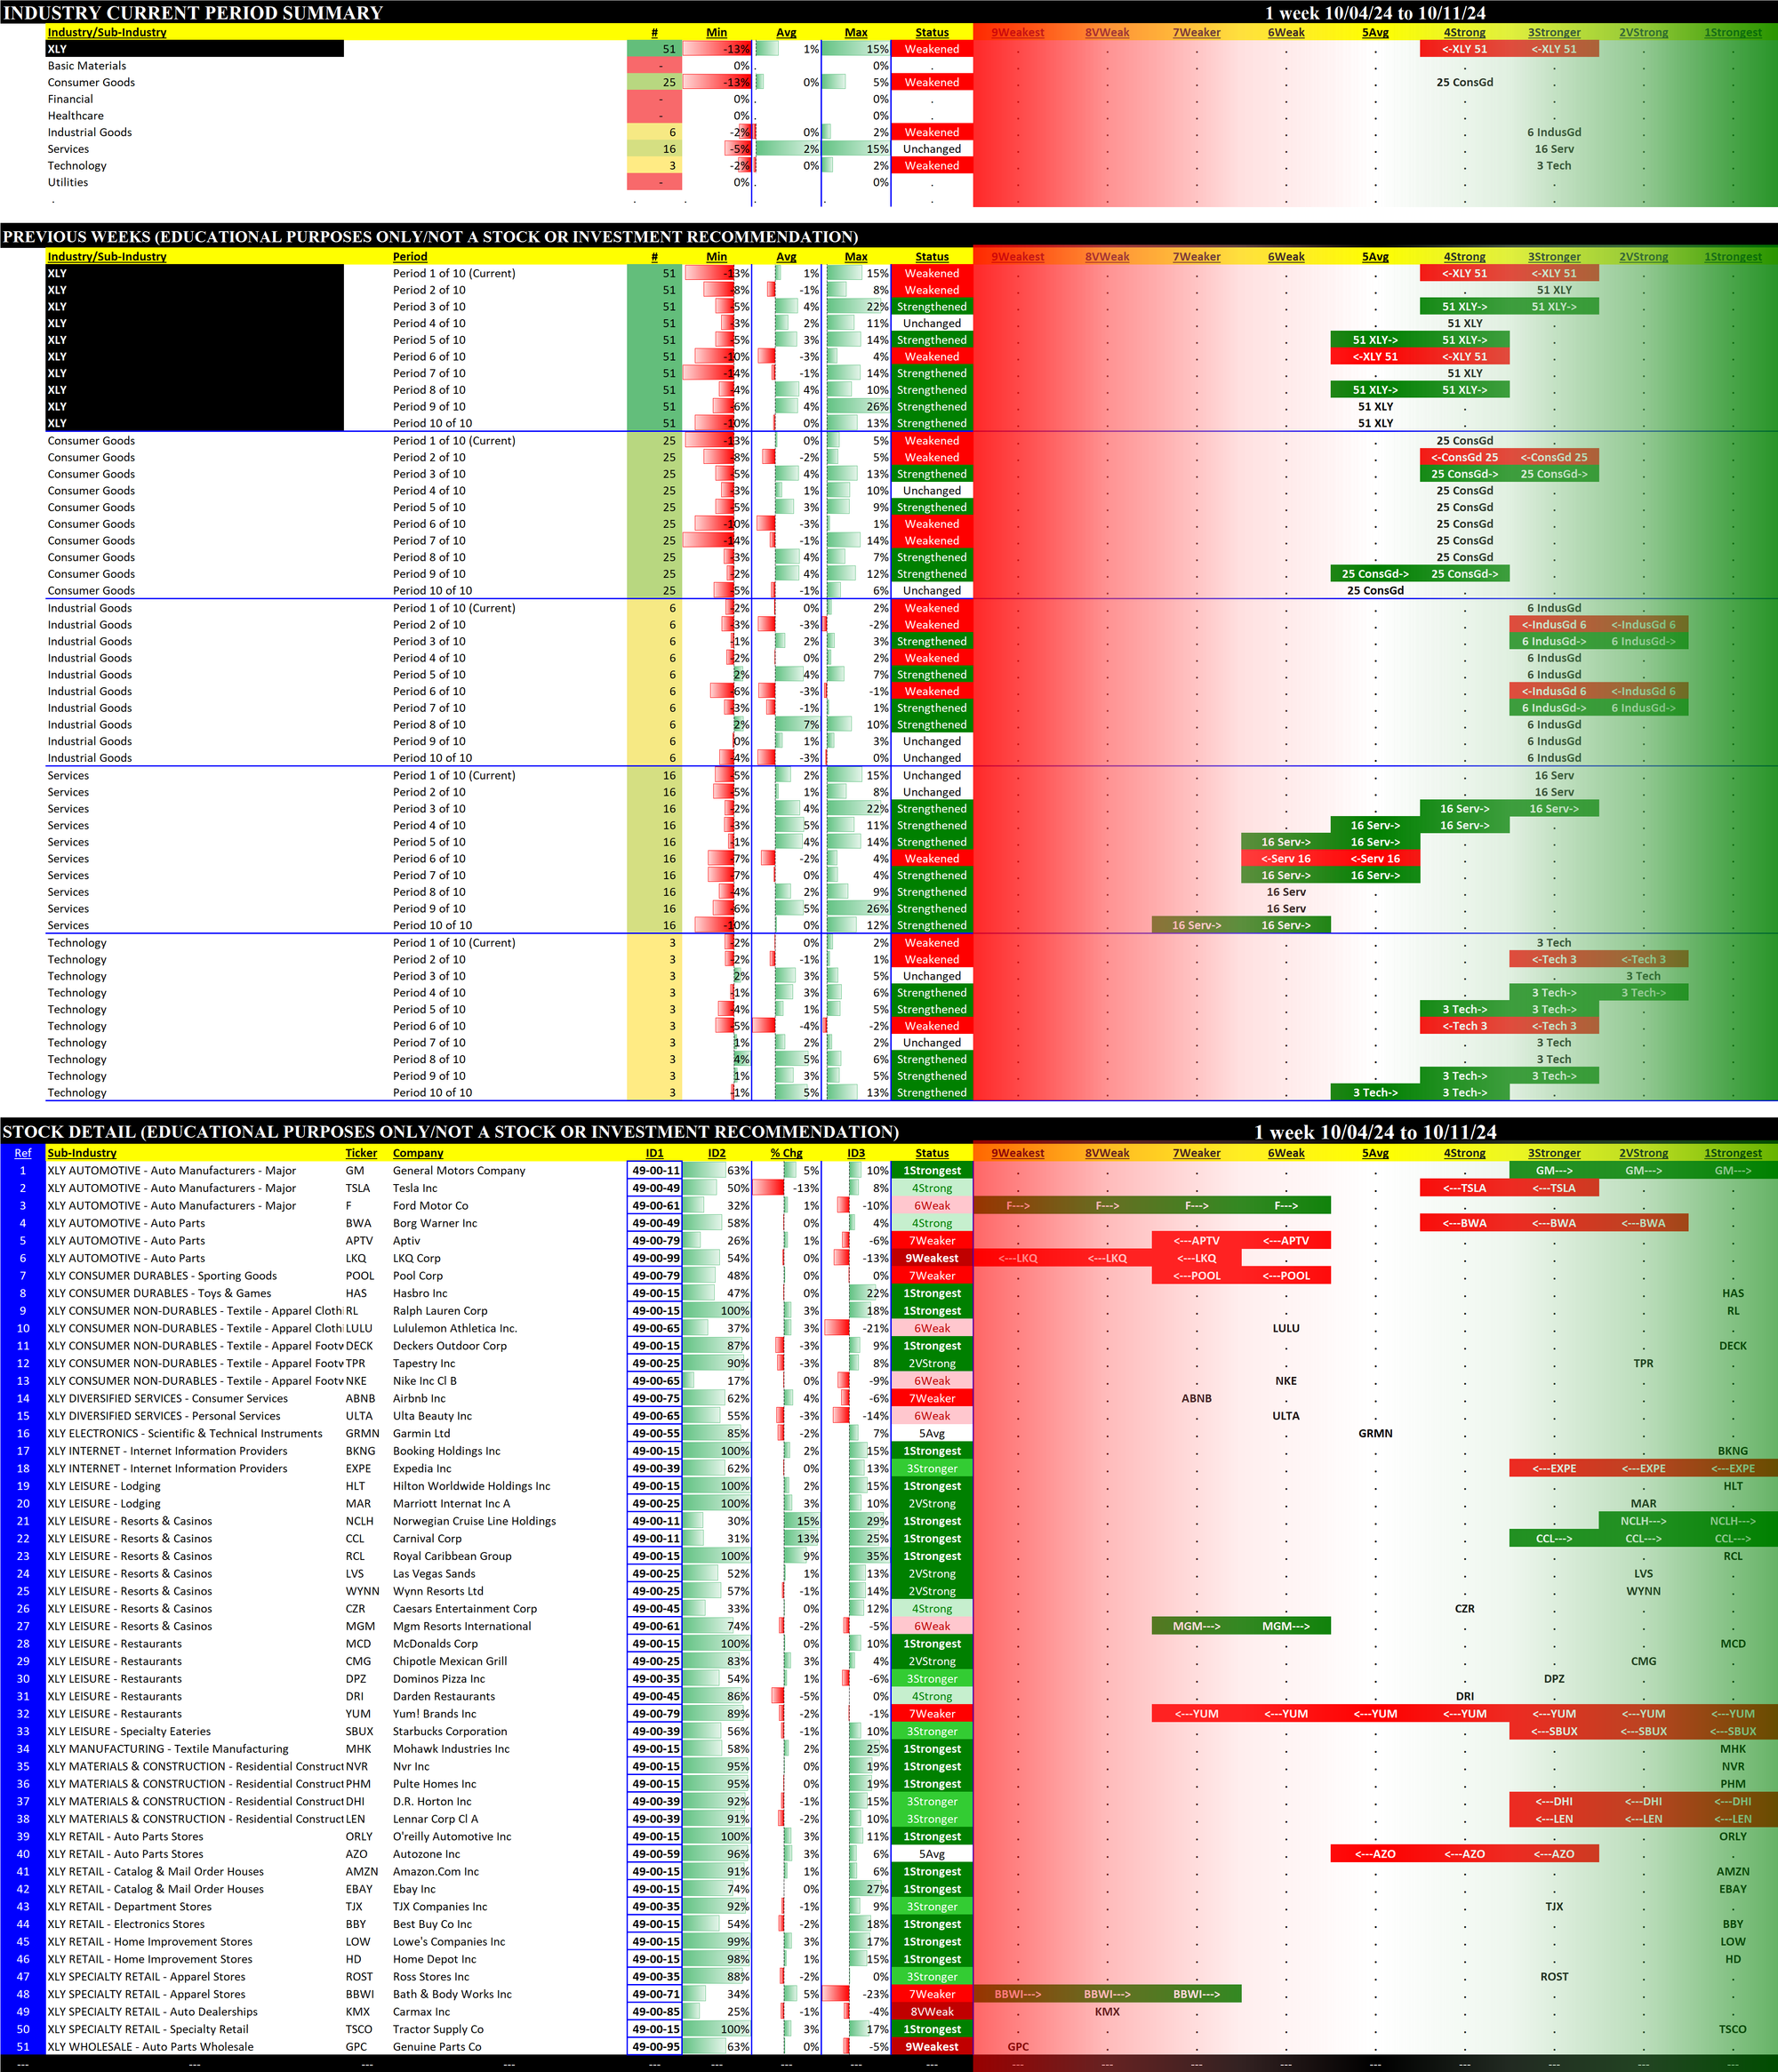
- XLY/Consumer Discretionary (Weakened)
1.2 Historical Summaries
Below are 10-week historical strength rating summaries of the ETFs, sorted first by ETF and then by Week. The graphics make it easy to compare strengthening and weakening between ETFs over the most recent 10 weeks.
Sorted by ETF
This graphic shows the past 10 weeks strengthening and weakening segregated by ETF.
Note that the strength rating for XLU/Utilities fell for the second time in 2 weeks. XLV/Healthcare fell to its lowest strength level over the past 10 weeks (5Average) and is tied with XLE/Energy and XLP/Consumer Staples as the weakest ETFs.
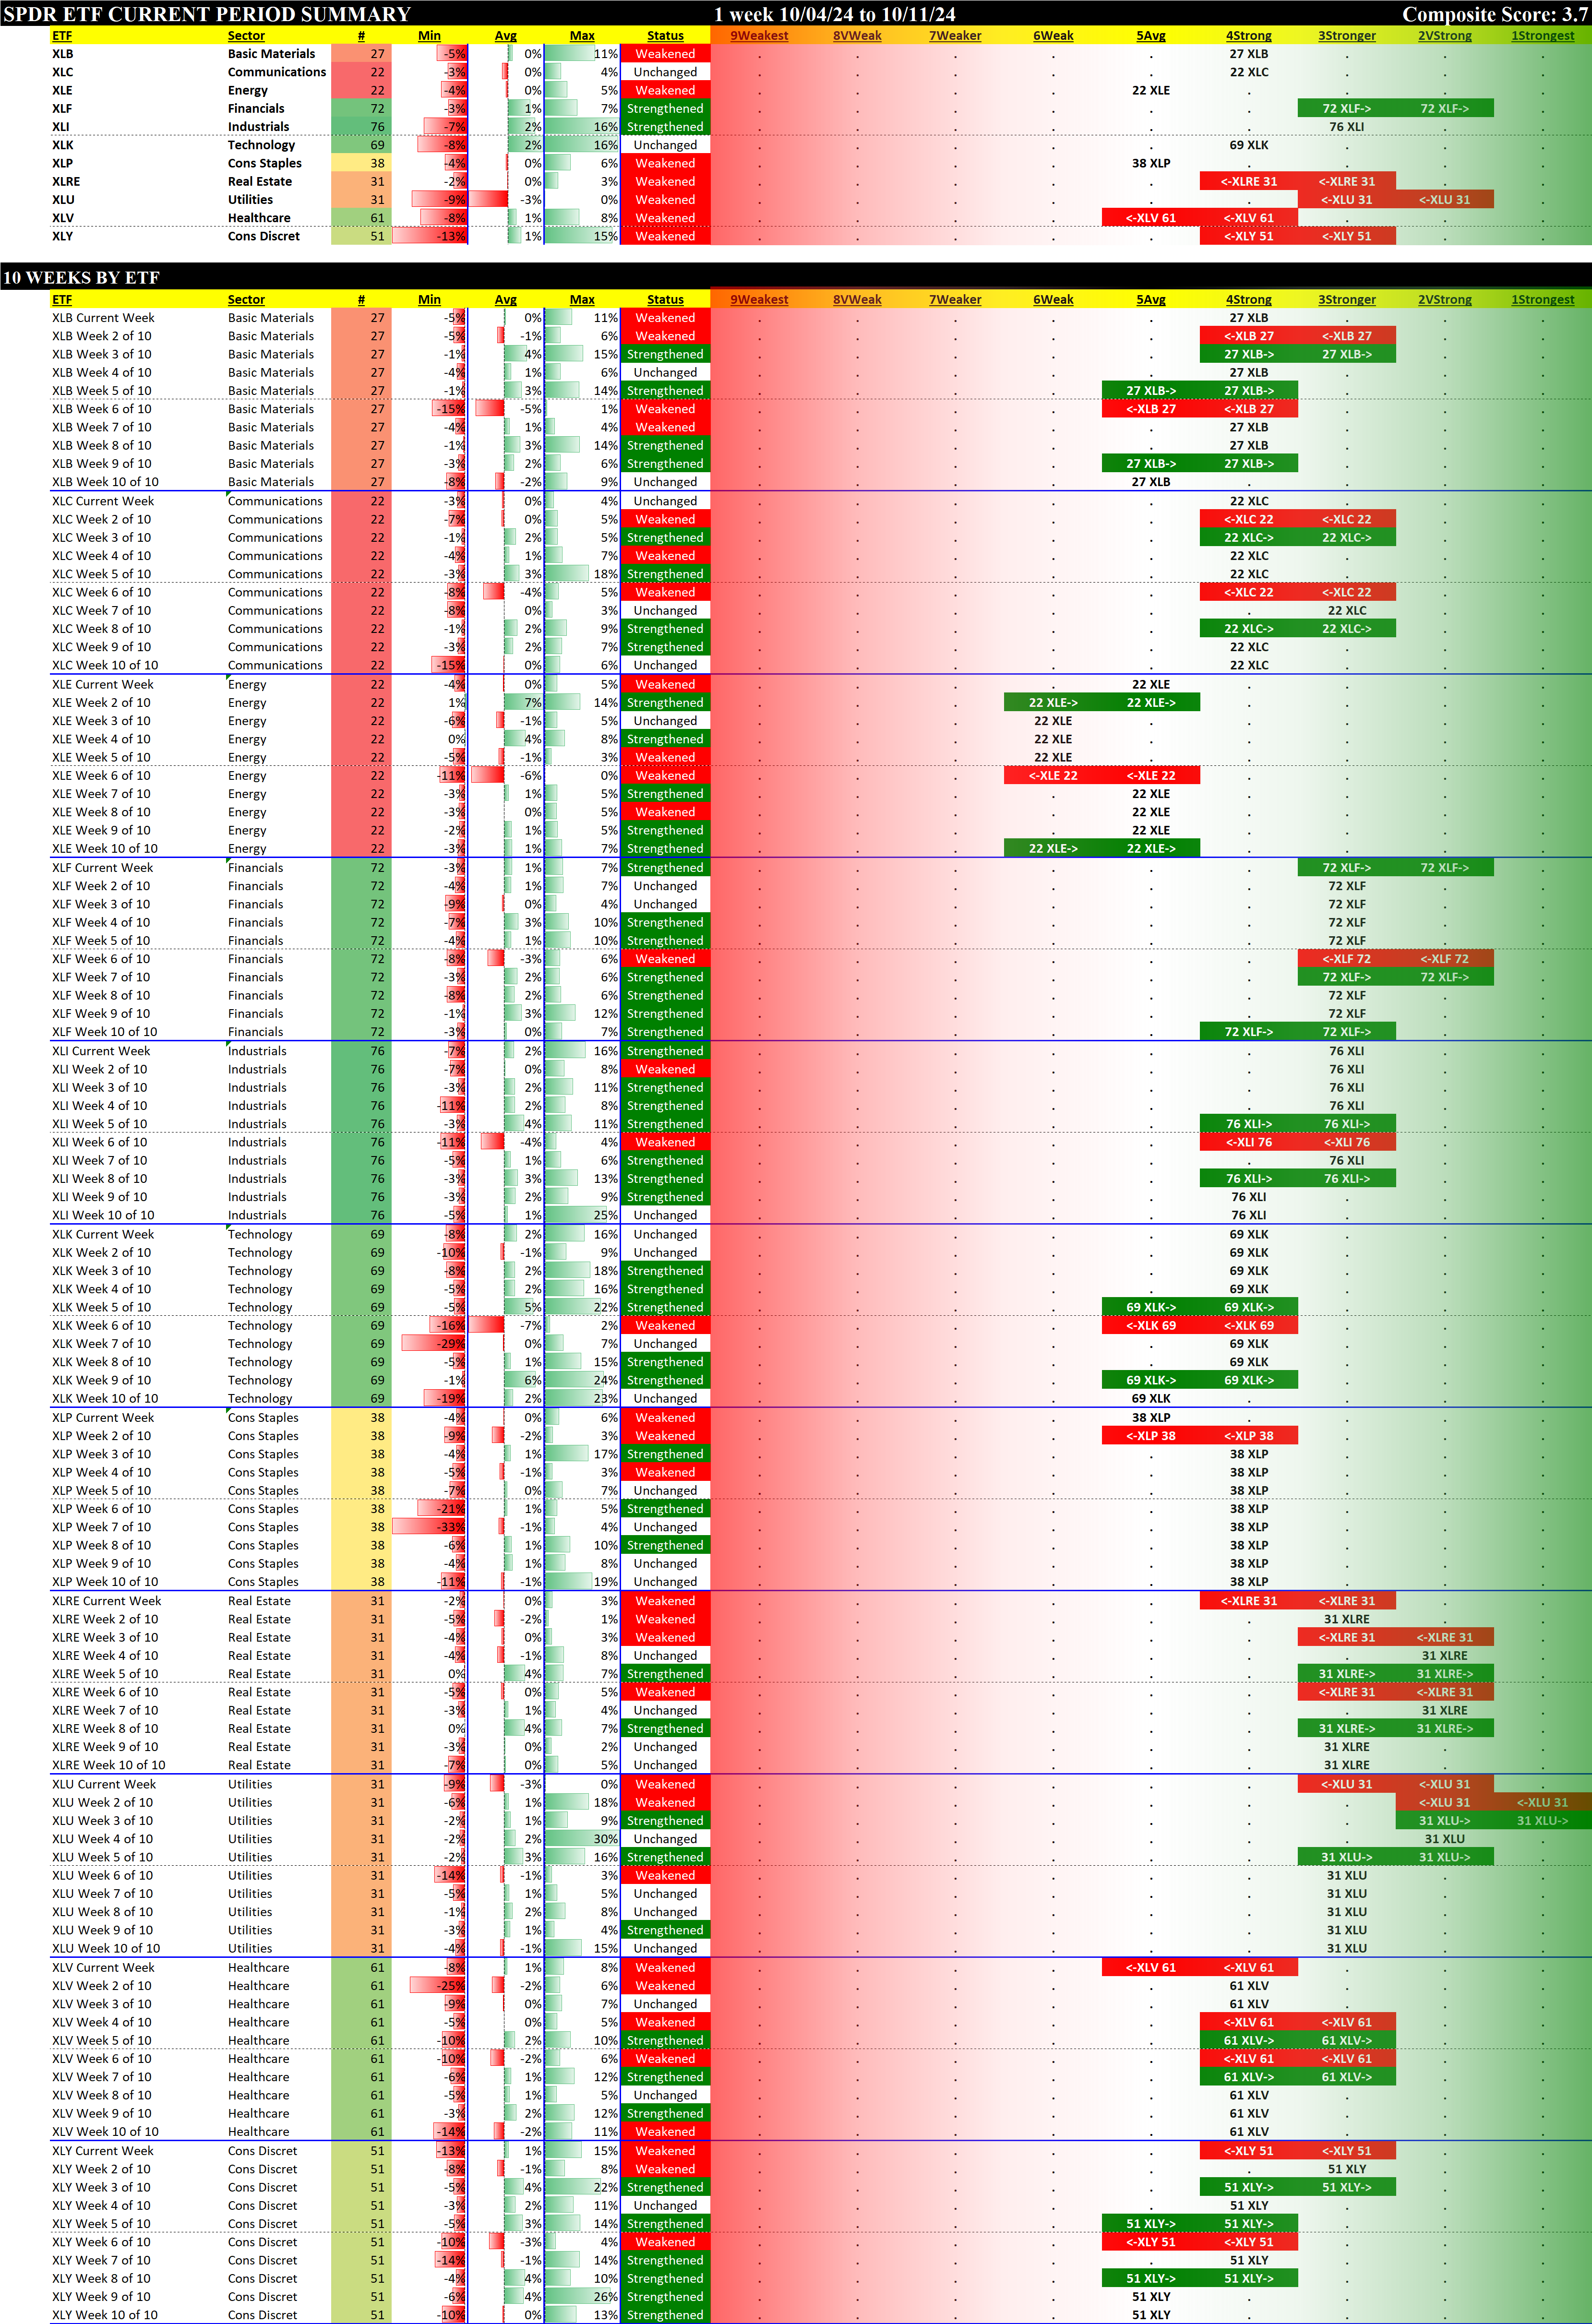
Sorted by Week:
This graphic shows the past 10 weeks strengthening and weakening segregated by week.
Acknowledging that the major indexes are at/near all time highs, it is important to note the weakness in the two most recent weeks. I make no predictions, but it would seem evident that the market index strength is driven by the largest market cap stocks and underneath the surface the "market" may be weakening. Week 10 was the week ending Friday, August 9.
2. ETFs Detail
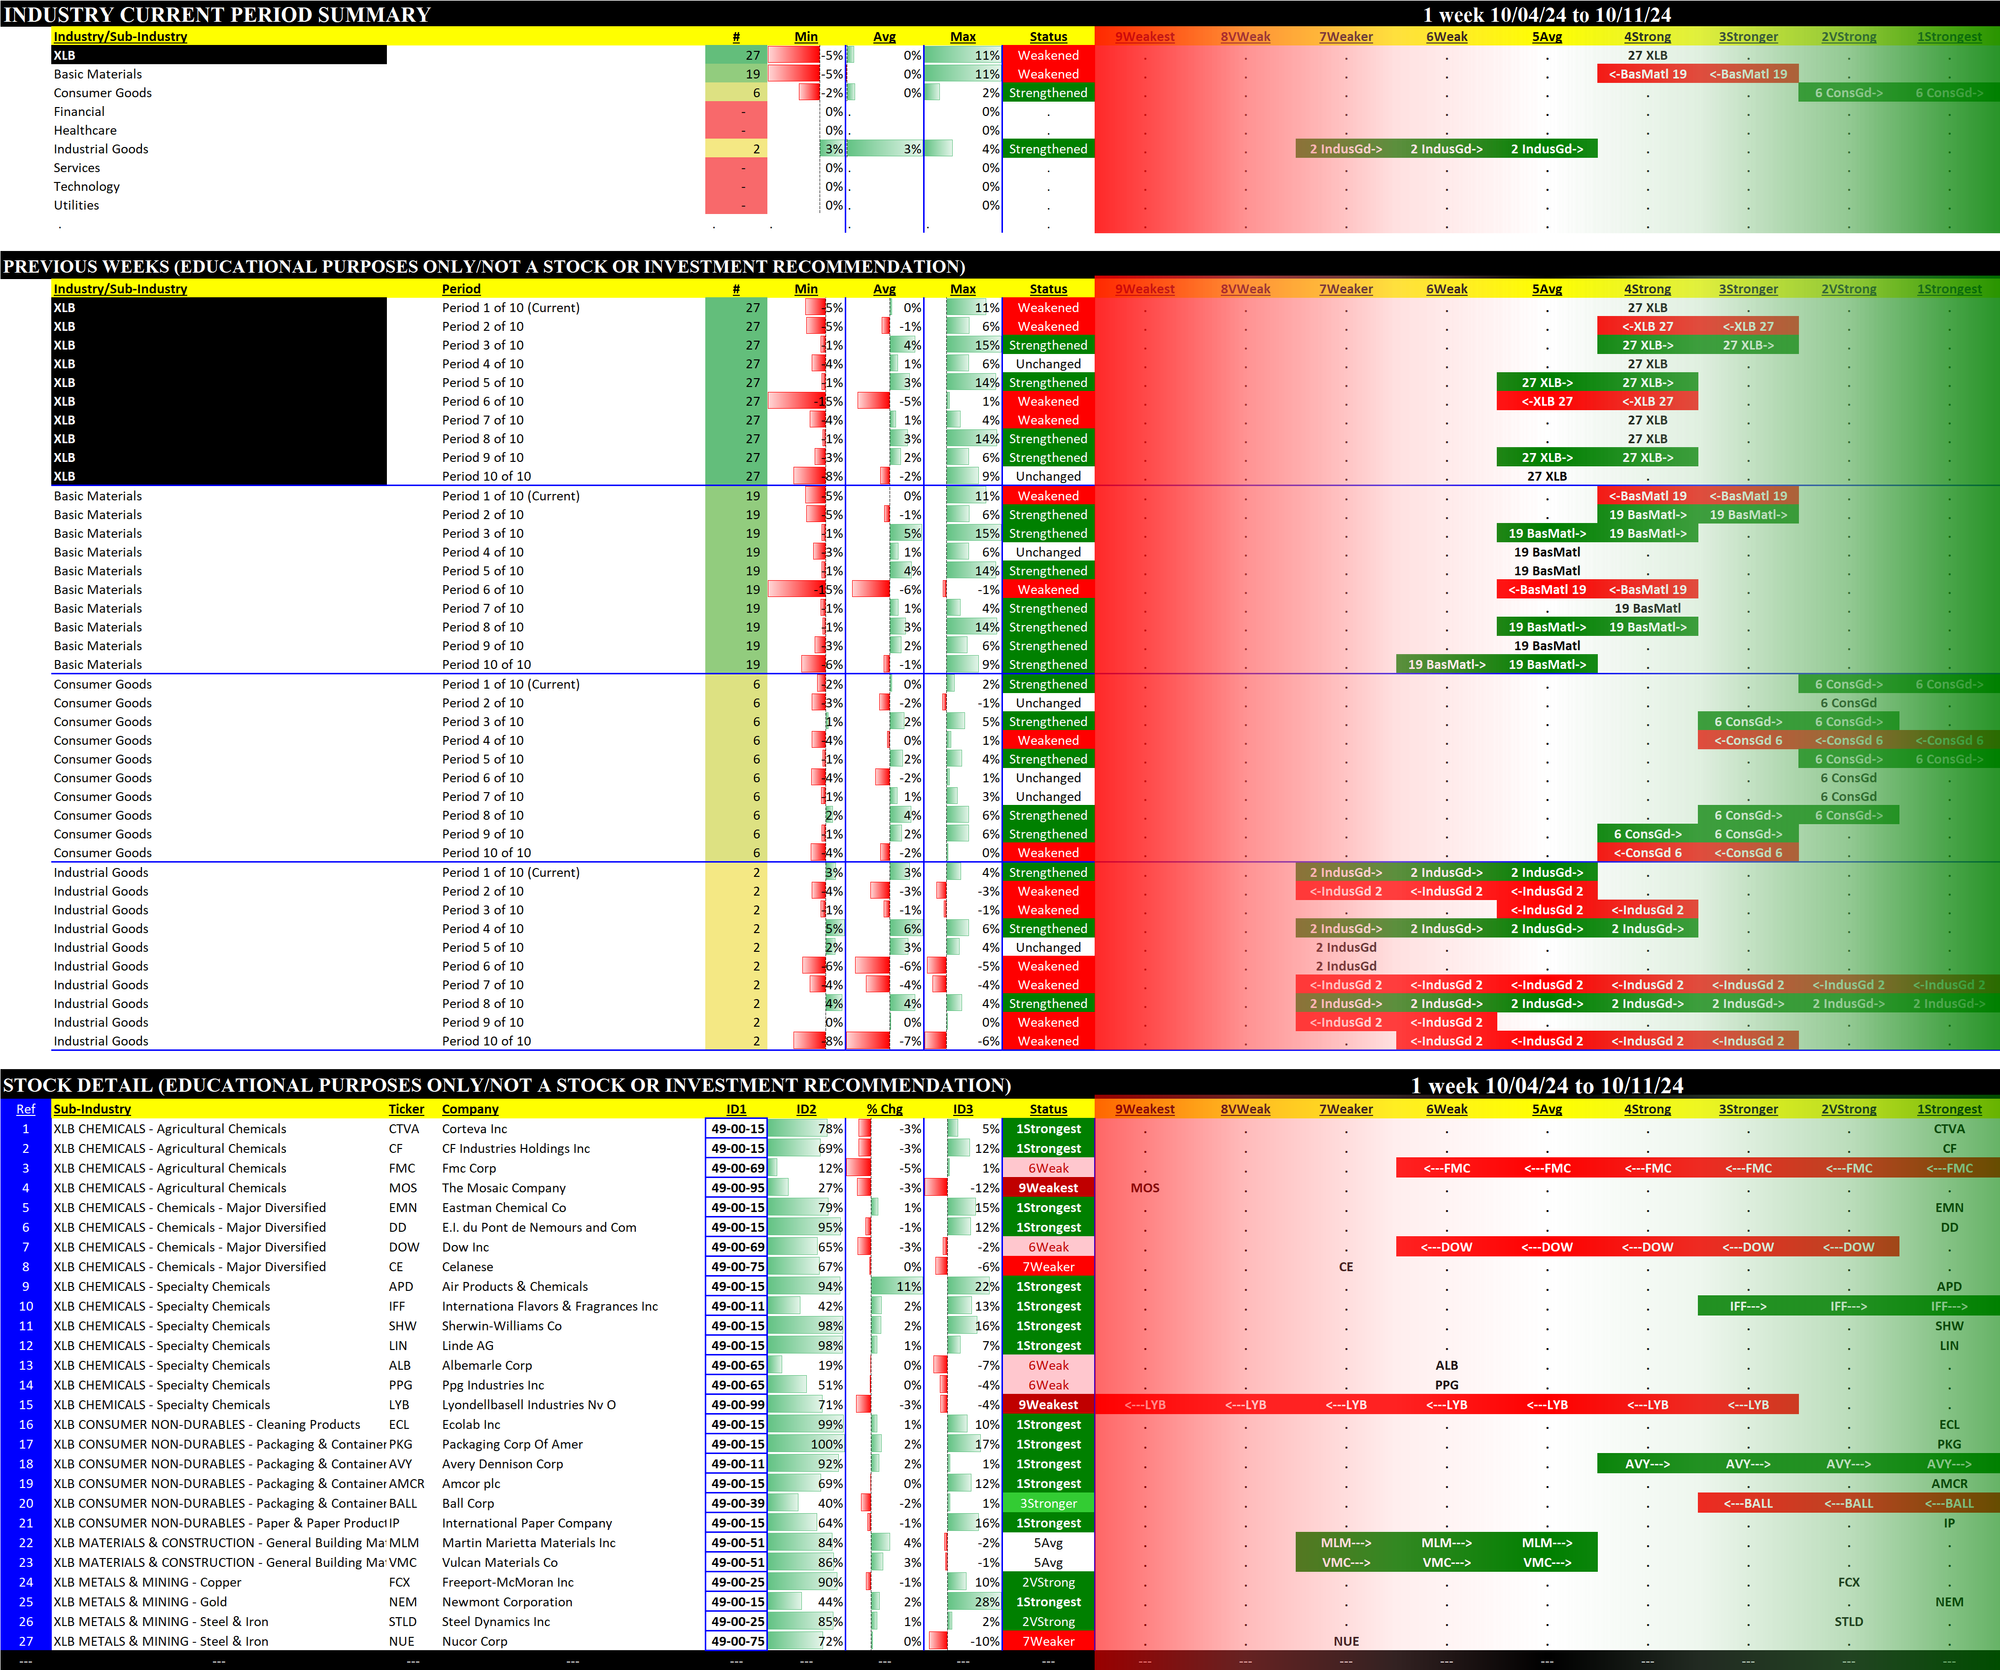
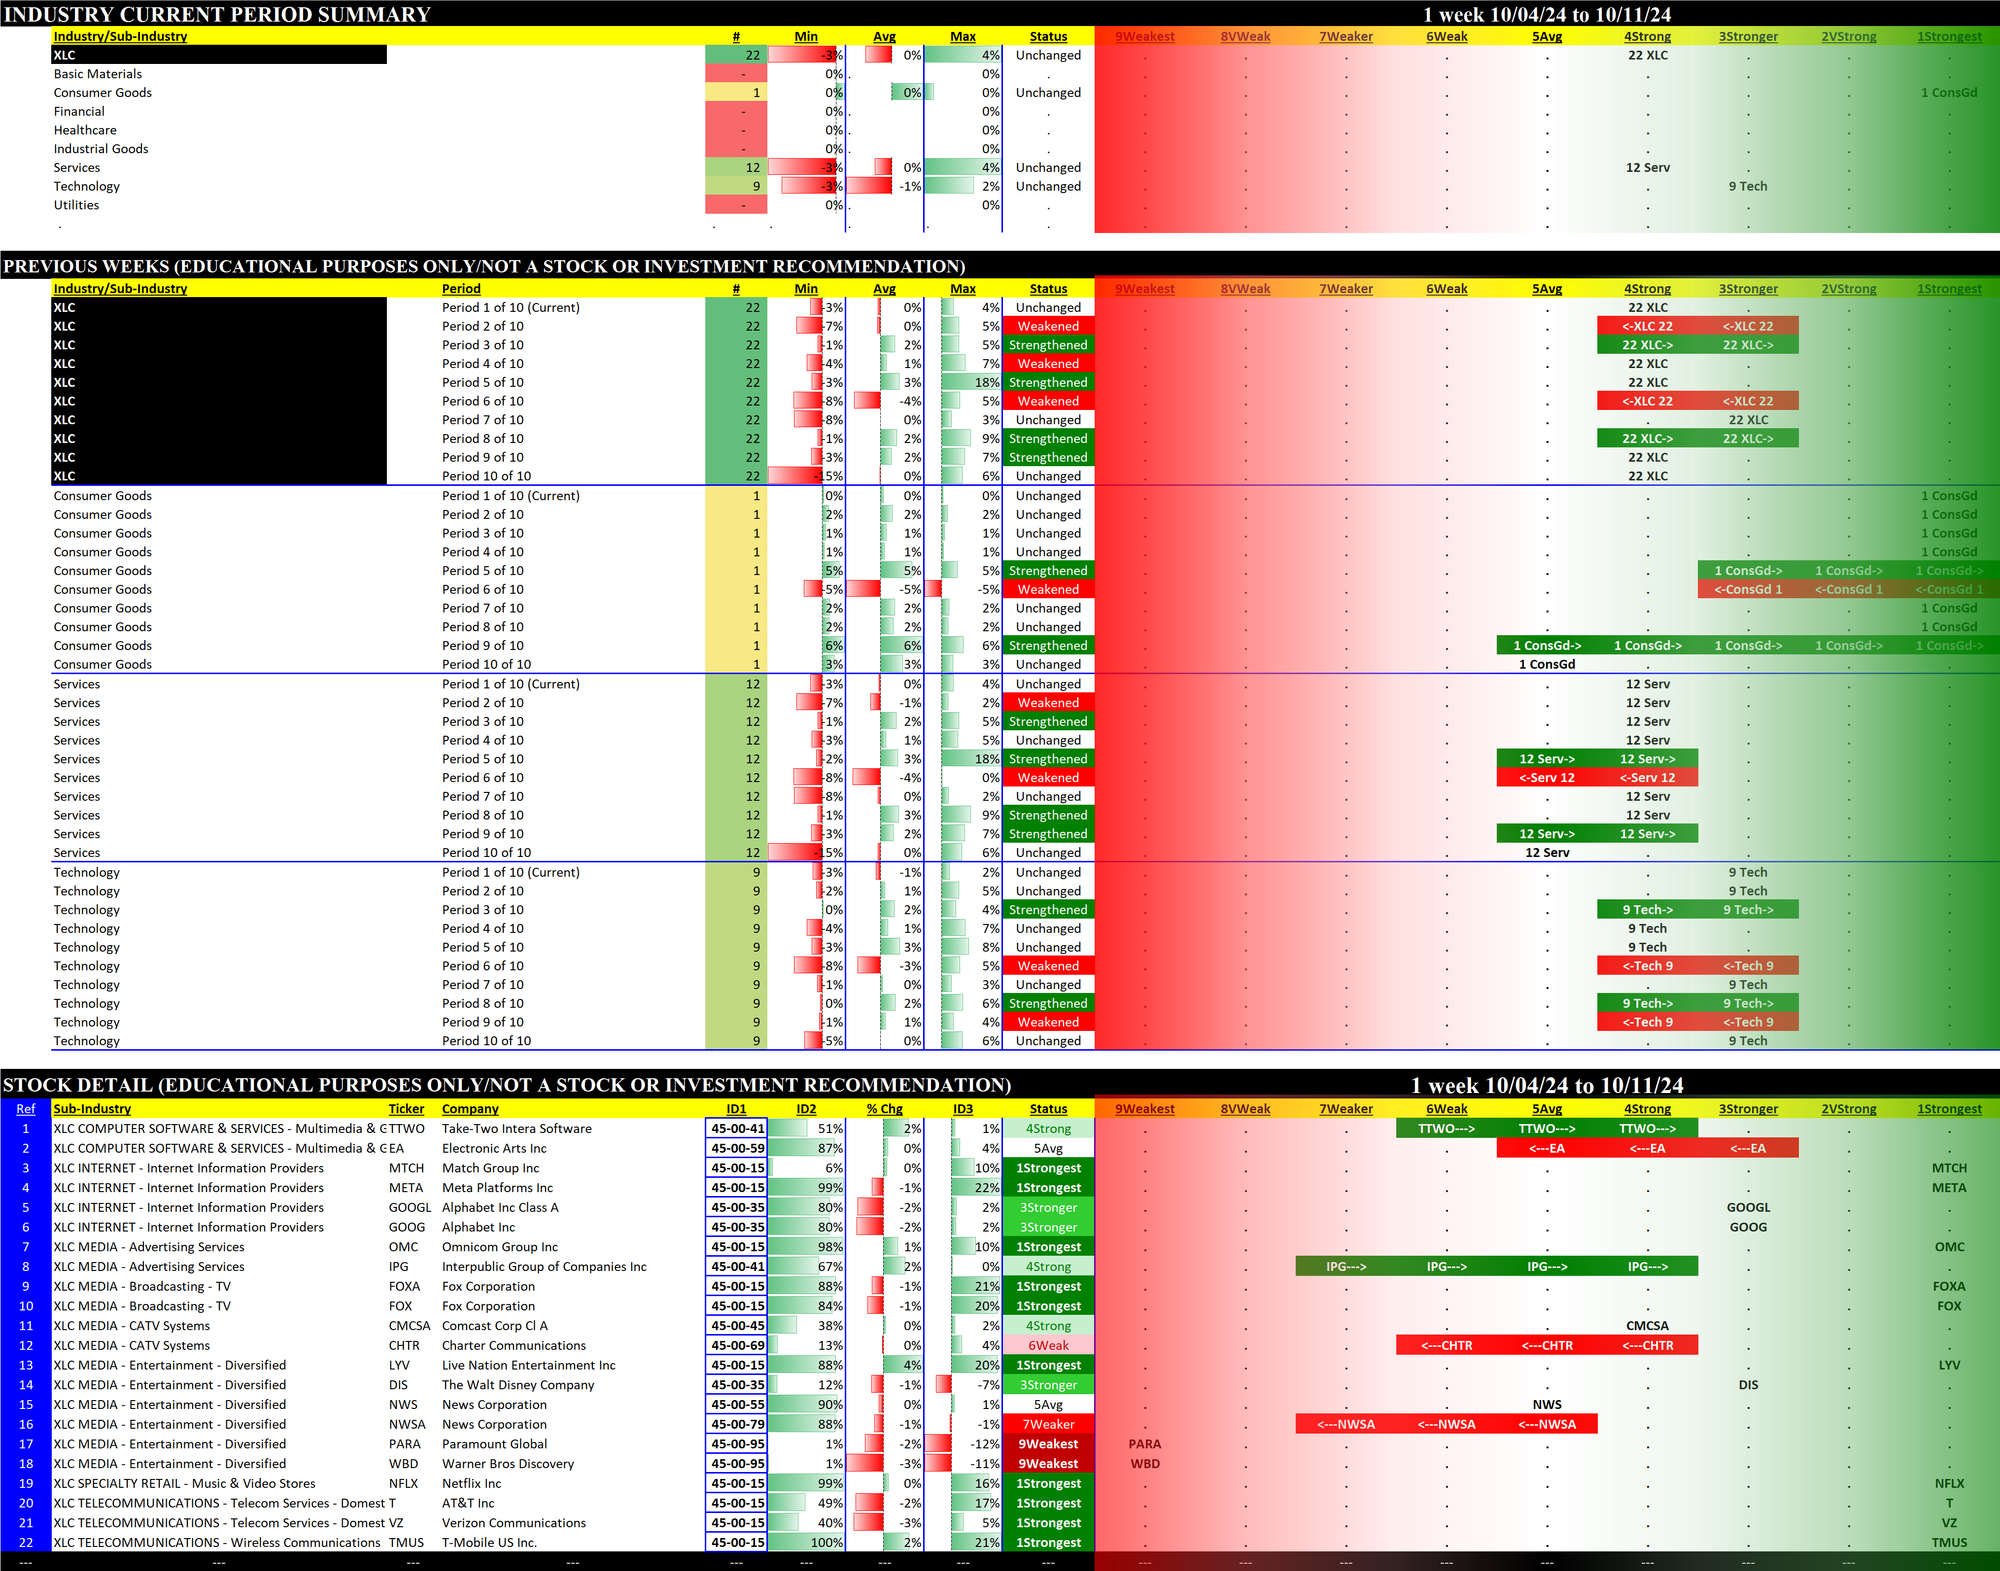
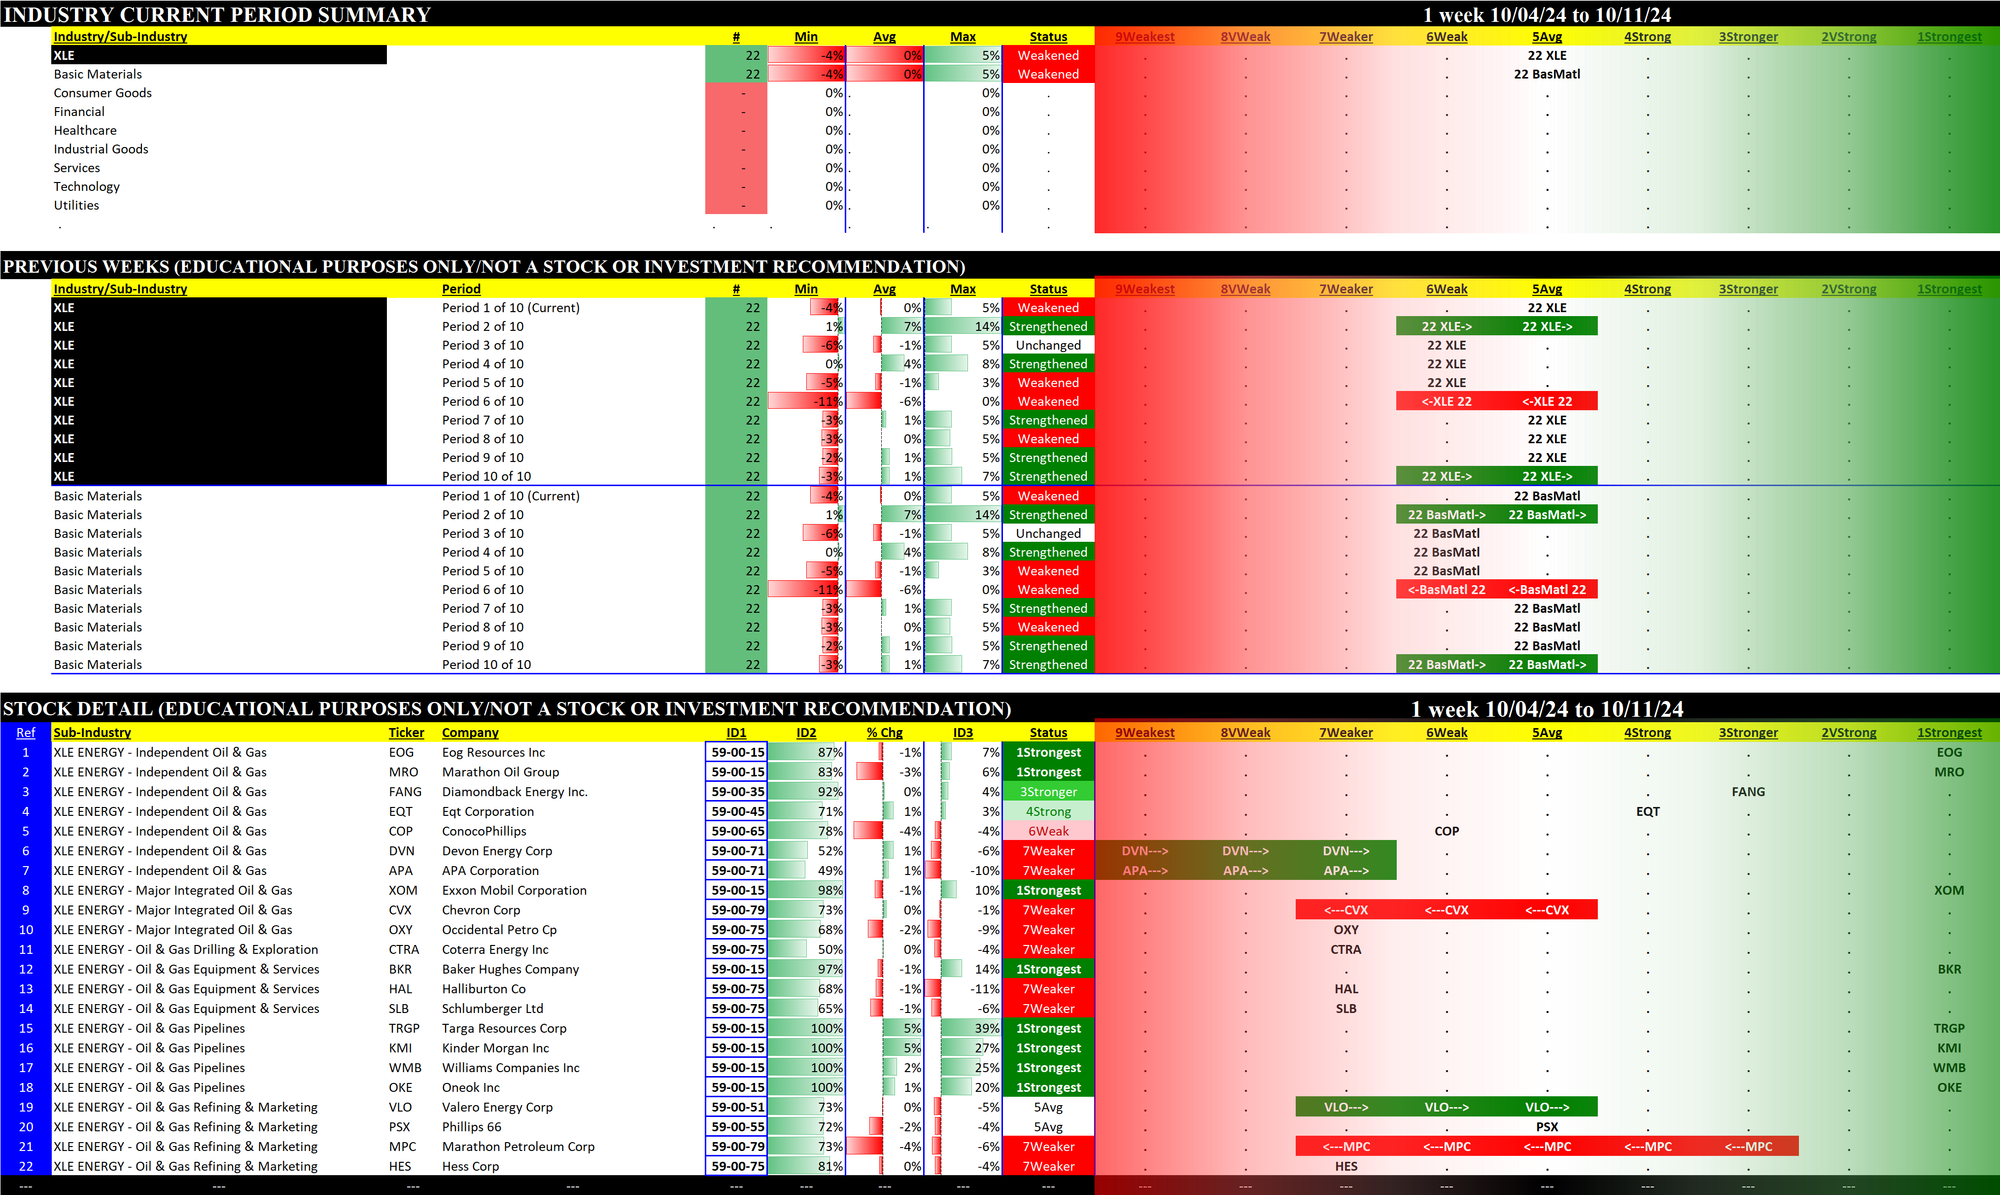
Details for each of the 11 ETFs are provided below. Comments:
- The top section shows the strength rating of the sectors comprising each ETF, based on the eight original Stock Market Organizer classifications and NOT the 11 ETF classifications. For example, the XLB Basic Materials ETF consists of 19 Basic Materials stocks, 6 Consumer Goods stocks, and 2 Industrial Goods stocks.
- The middle section shows the previous 10 weeks' strengthening and weakening of the relevant sectors. For example, since the XLB has Basic Materials, Consumer Goods, and Industrial Goods stocks, these three sectors are shown in the middle section of the XLB detail. The XLF (Financial) has Financial, Services, and Tech stocks.
- The bottom section shows strengthening/weakening for the underlying ETF components stocks, and includes the listing of their Stock Market Organizer industries and sub-industries. These stocks are listed in order based on Sub-industry then strongest to weakest comparative stock strength rating. The Basic Materials XLB ETF includes both Newmont Corporation/NEM in the Gold sub-industry within the Metals & Mining industry and Dow Inc./DOW in the Specialty Chemicals sub-industry within the Chemicals industry.
In these bottom sections, one can visually see the strength/strengthening and weakness/weakening of the component stocks in each ETF.
2.1 The Materials Select Sector SPDR Fund (XLB)
Includes securities of companies from the following industries: chemicals; metals and mining; paper and forest products; containers and packaging; and construction materials.
2.2 The Communication Services Select Sector SPDR ETF Fund (XLC)
Includes companies that have been identified as Communication Services companies by the GICS®, including securities of companies from the following industries: diversified telecommunication services; wireless telecommunication services; media; entertainment; and interactive media & services.
2.3 The Energy Select Sector SPDR Fund (XLE)
Includes companies that have been identified as Energy companies by the GICS®, including securities of companies from the following industries: oil, gas and consumable fuels; and energy equipment and services.
2.4 The Financial Select Sector SPDR Fund (XLF)
Includes companies that have been identified as Financial companies by the Global Industry Classification Standard, including securities of companies from the following industries: financial services; insurance; banks; capital markets; mortgage real estate investment trusts; and consumer finance.
2.5 The Industrial Select Sector SPDR Fund (XLI)
Includes companies that have been identified as Industrial companies by the Global Industry Classification Standard, including securities of companies from the following industries: aerospace and defense; industrial conglomerates; marine transportation.
2.6 The Technology Select Sector SPDR Fund (XLK)
2.7 The Consumer Staples Select Sector SPDR Fund (XLP)
Includes companies that have been identified as Consumer Staples companies by the GICS®.
2.8 The Real Estate Select Sector SPDR Fund (XLRE)
Includes companies that have been identified as Real Estate companies by the Global Industry Classification Standard (GICS®).
2.9 The Utilities Select Sector SPDR Fund (XLU)
Includes securities of companies from the following industries: electric utilities; water utilities; multi-utilities; independent power and renewable electricity producers; and gas utilities.
2.10 The Health Care Select Sector SPDR Fund (XLV)
Includes companies from the following industries: pharmaceuticals; health care equipment & supplies; health care providers & services; biotechnology; life sciences tools & services; and health care technology.
2.11 The Consumer Discretionary Select Sector SPDR Fund (XLY)
Includes companies that have been identified as Consumer Discretionary companies by the Global Industry Classification Standard (GICS®).
3. Stock Detail
The downloadable PDF below lists all component stocks in order of first Strongest to Weakest ETF and second Strongest to Weakest Stock. The difference between this report and the 11 ETF stock listings above is this report consolidates all component stocks whereas the above listings are segregated by ETF.
Download the following Excel file if you are interested in sorting results yourself.