SMO Exclusive: SPDR Sector ETFs Strength Report 2024-10-01
Key Stock Market Organizer Context
I subscribe to the top-down concept that market and sector forces exert upwards of 70% to 80% influence on the price action of individual stocks. Therefore I seek to align stock, sector, and market direction - I want to 1) stack strength by going long strong stocks in strong sectors in rising markets and 2) stack weakness by going short weak stocks in weak sectors in declining markets.
To do so objectively and consistently I have created a repeatable process that includes these two analyses:
- MARKET Strength/Weakness: This analysis shows how I objectively measure market strength. This drives my current big picture "No New Longs" or "No New Shorts" decision and offers reasonable, objective guidance for how early or late in this move is the market. The linked post, to the Market Strength Score from Friday, September 27, shows a +75% Positive score. This means No New Shorts (a negative score would mean No New Longs). The +75% is on a scale of -100% to +100%, reflecting that the current market is nearing the later stages of a rally. This does not mean imminent rally failure. It is merely a comparative reflection, compared to past readings, of whether this strength reading is early-, mid-, or late-stage.
- SECTOR Strength/Weakness: The analysis below shows how I objectively compare sector strength. This drives where I look for long and short candidates.
Today's Market Context
Key Headlines
- "Dow ends lower as S&P 500, Nasdaq suffer worst day in nearly a month after Iran launches missile attack on Israel" and "... Oil prices end higher, but off session highs." (Marketwatch)
- "East and Gulf coast ports strike, with ILA longshoremen walking off job from New England to Texas, stranding billions in trade." (CNBC)
Key Current Readings
SP500: 5,709
Nasdaq: 17,910
Nasdaq 100: 19,773
Russell 2000: 2,197
10Y Treasury: 3.7%
2YT: 3.6%
Oil (WTI Crude): $71
Bitcoin: $61,795
Gold: $2,682
VIX: 19.26
(CNBC)
Sector ETF Analysis Contents
The following Stock Market Organizer strengthening/weakening analysis looks at the 10 SPDR ETFs and their underlying component stocks for the week ending 2024-10-01, as follows:
- ETFs Summary
1.1 Current Overview
1.2 Historical Summaries - ETFs Detail
2.1 XLB Basic Materials
2.2 XLE Energy
2.3 XLF Financials
2.4 XLI Industrials
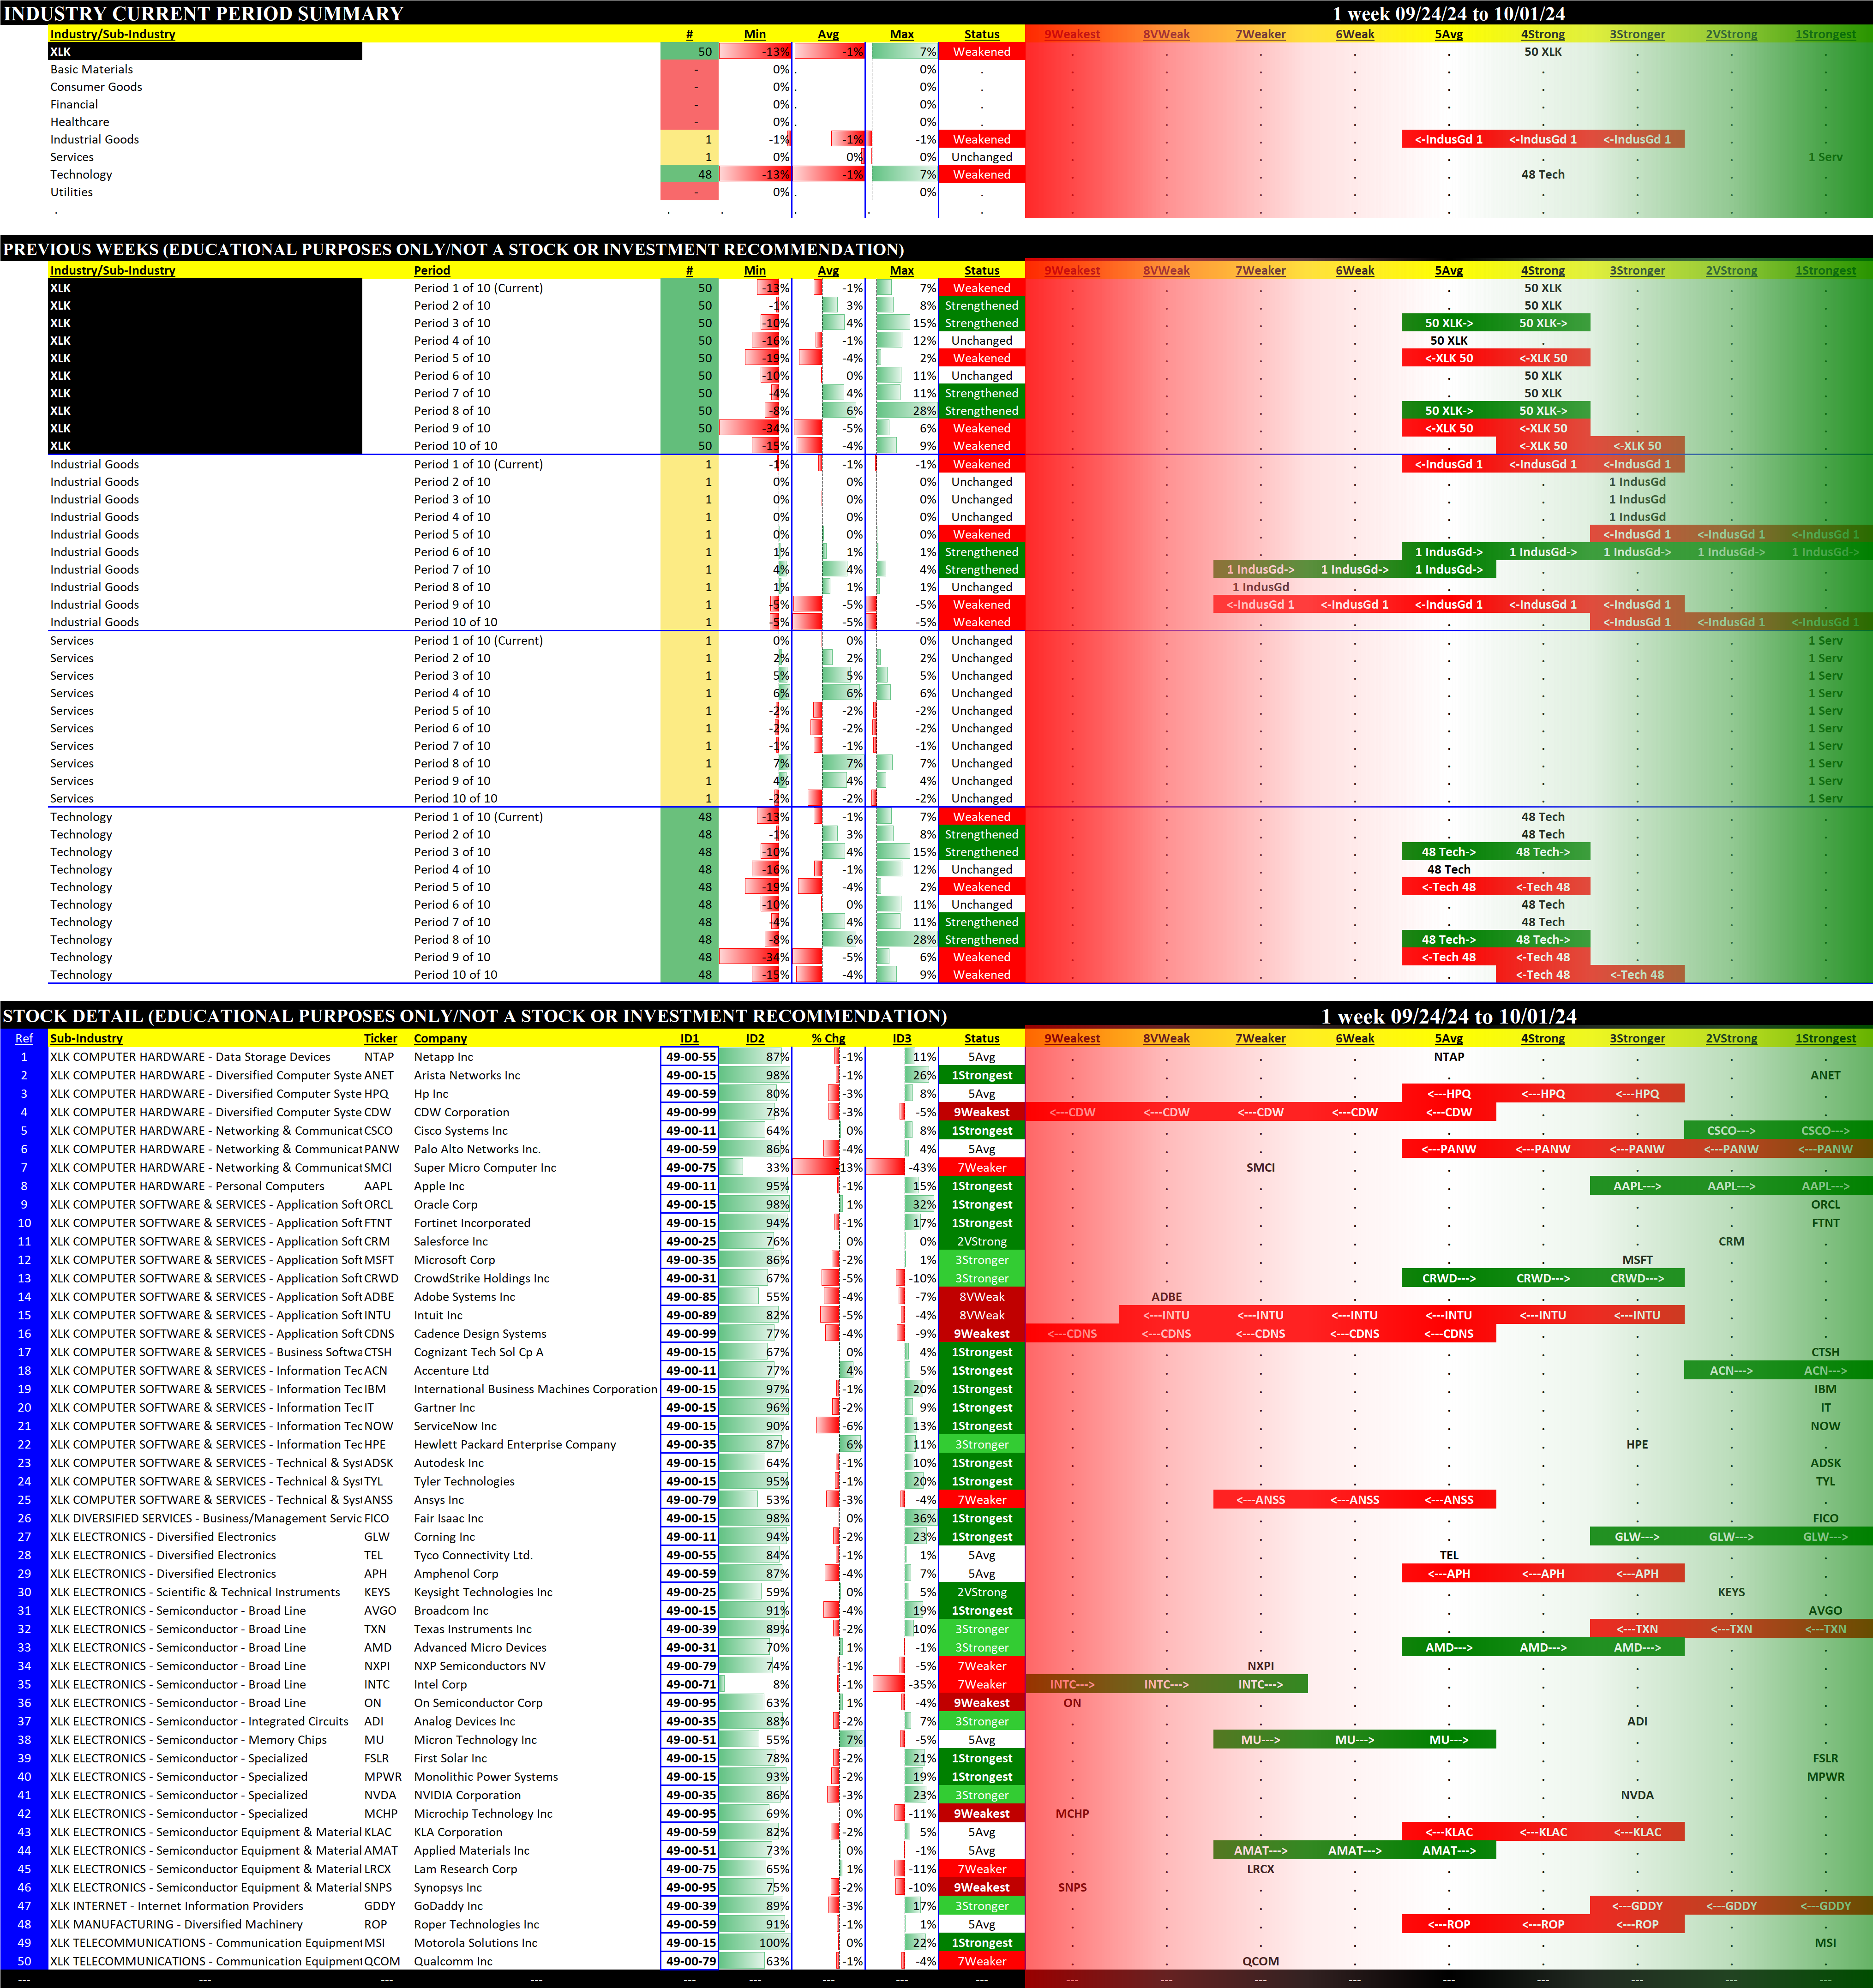
2.5 XLK Technology
2.6 XLRE Real Estate
2.7 XLU Utilities
2.8 XLV Healthcare
2.9 XLY Consumer
2.10 XTL Telecommunications - Stock Detail (download)
1. ETFs Summary
1.1 Current Overview
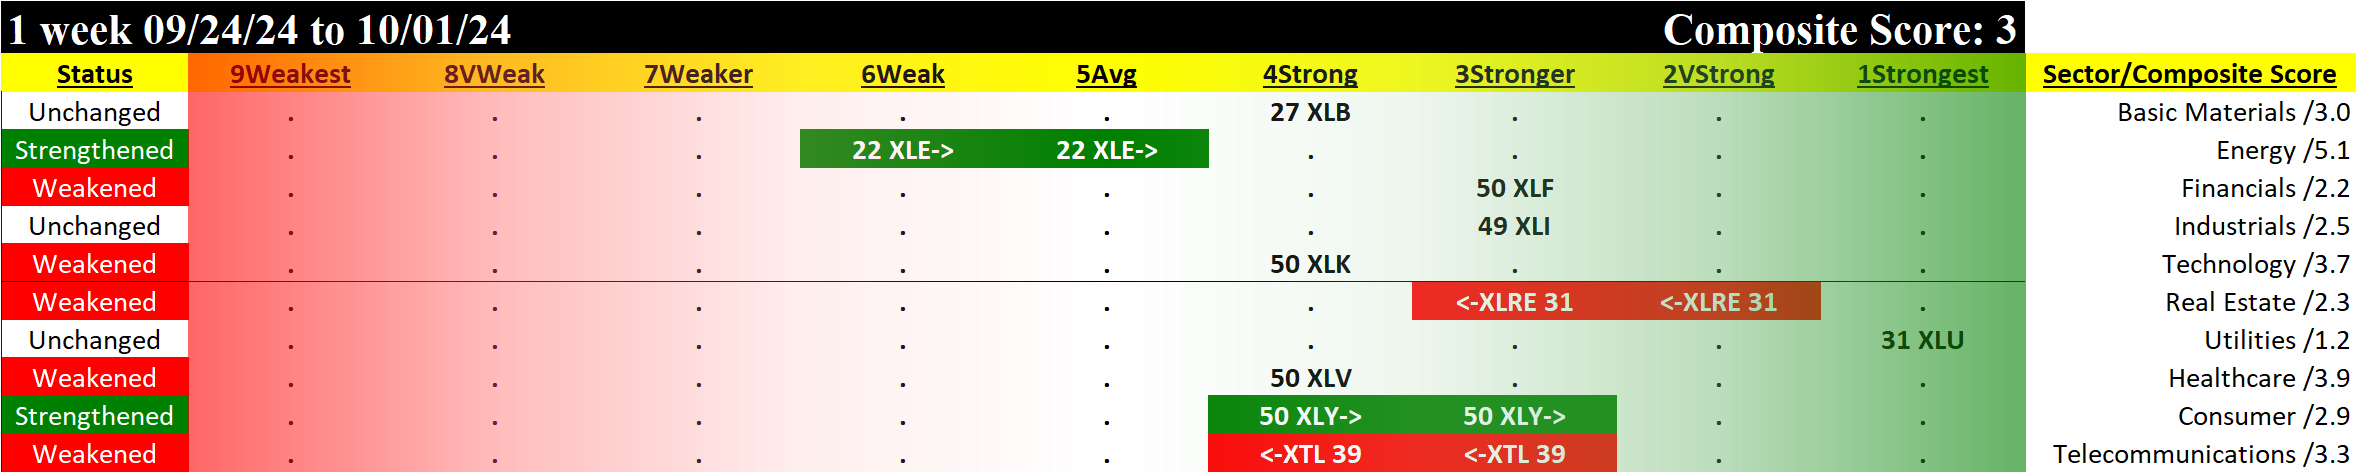
The following graphs reflect the composition of each of the ETFs based on their underlying stock strength ratings which range from 1Strongest to 9Weakest. Since I only care about the strongest and weakest in each sector, stocks rated from 2VeryStrong through 8VeryWeak are categorized as "Ignore."
- Top row: Basic Materials, Energy, and Industrials
- Second row: interest rate-sensitive ETFs Financials, Real Estate, and Utilities
- Third row: Technology and Telecommunications
- Bottom row: Consumer and Healthcare
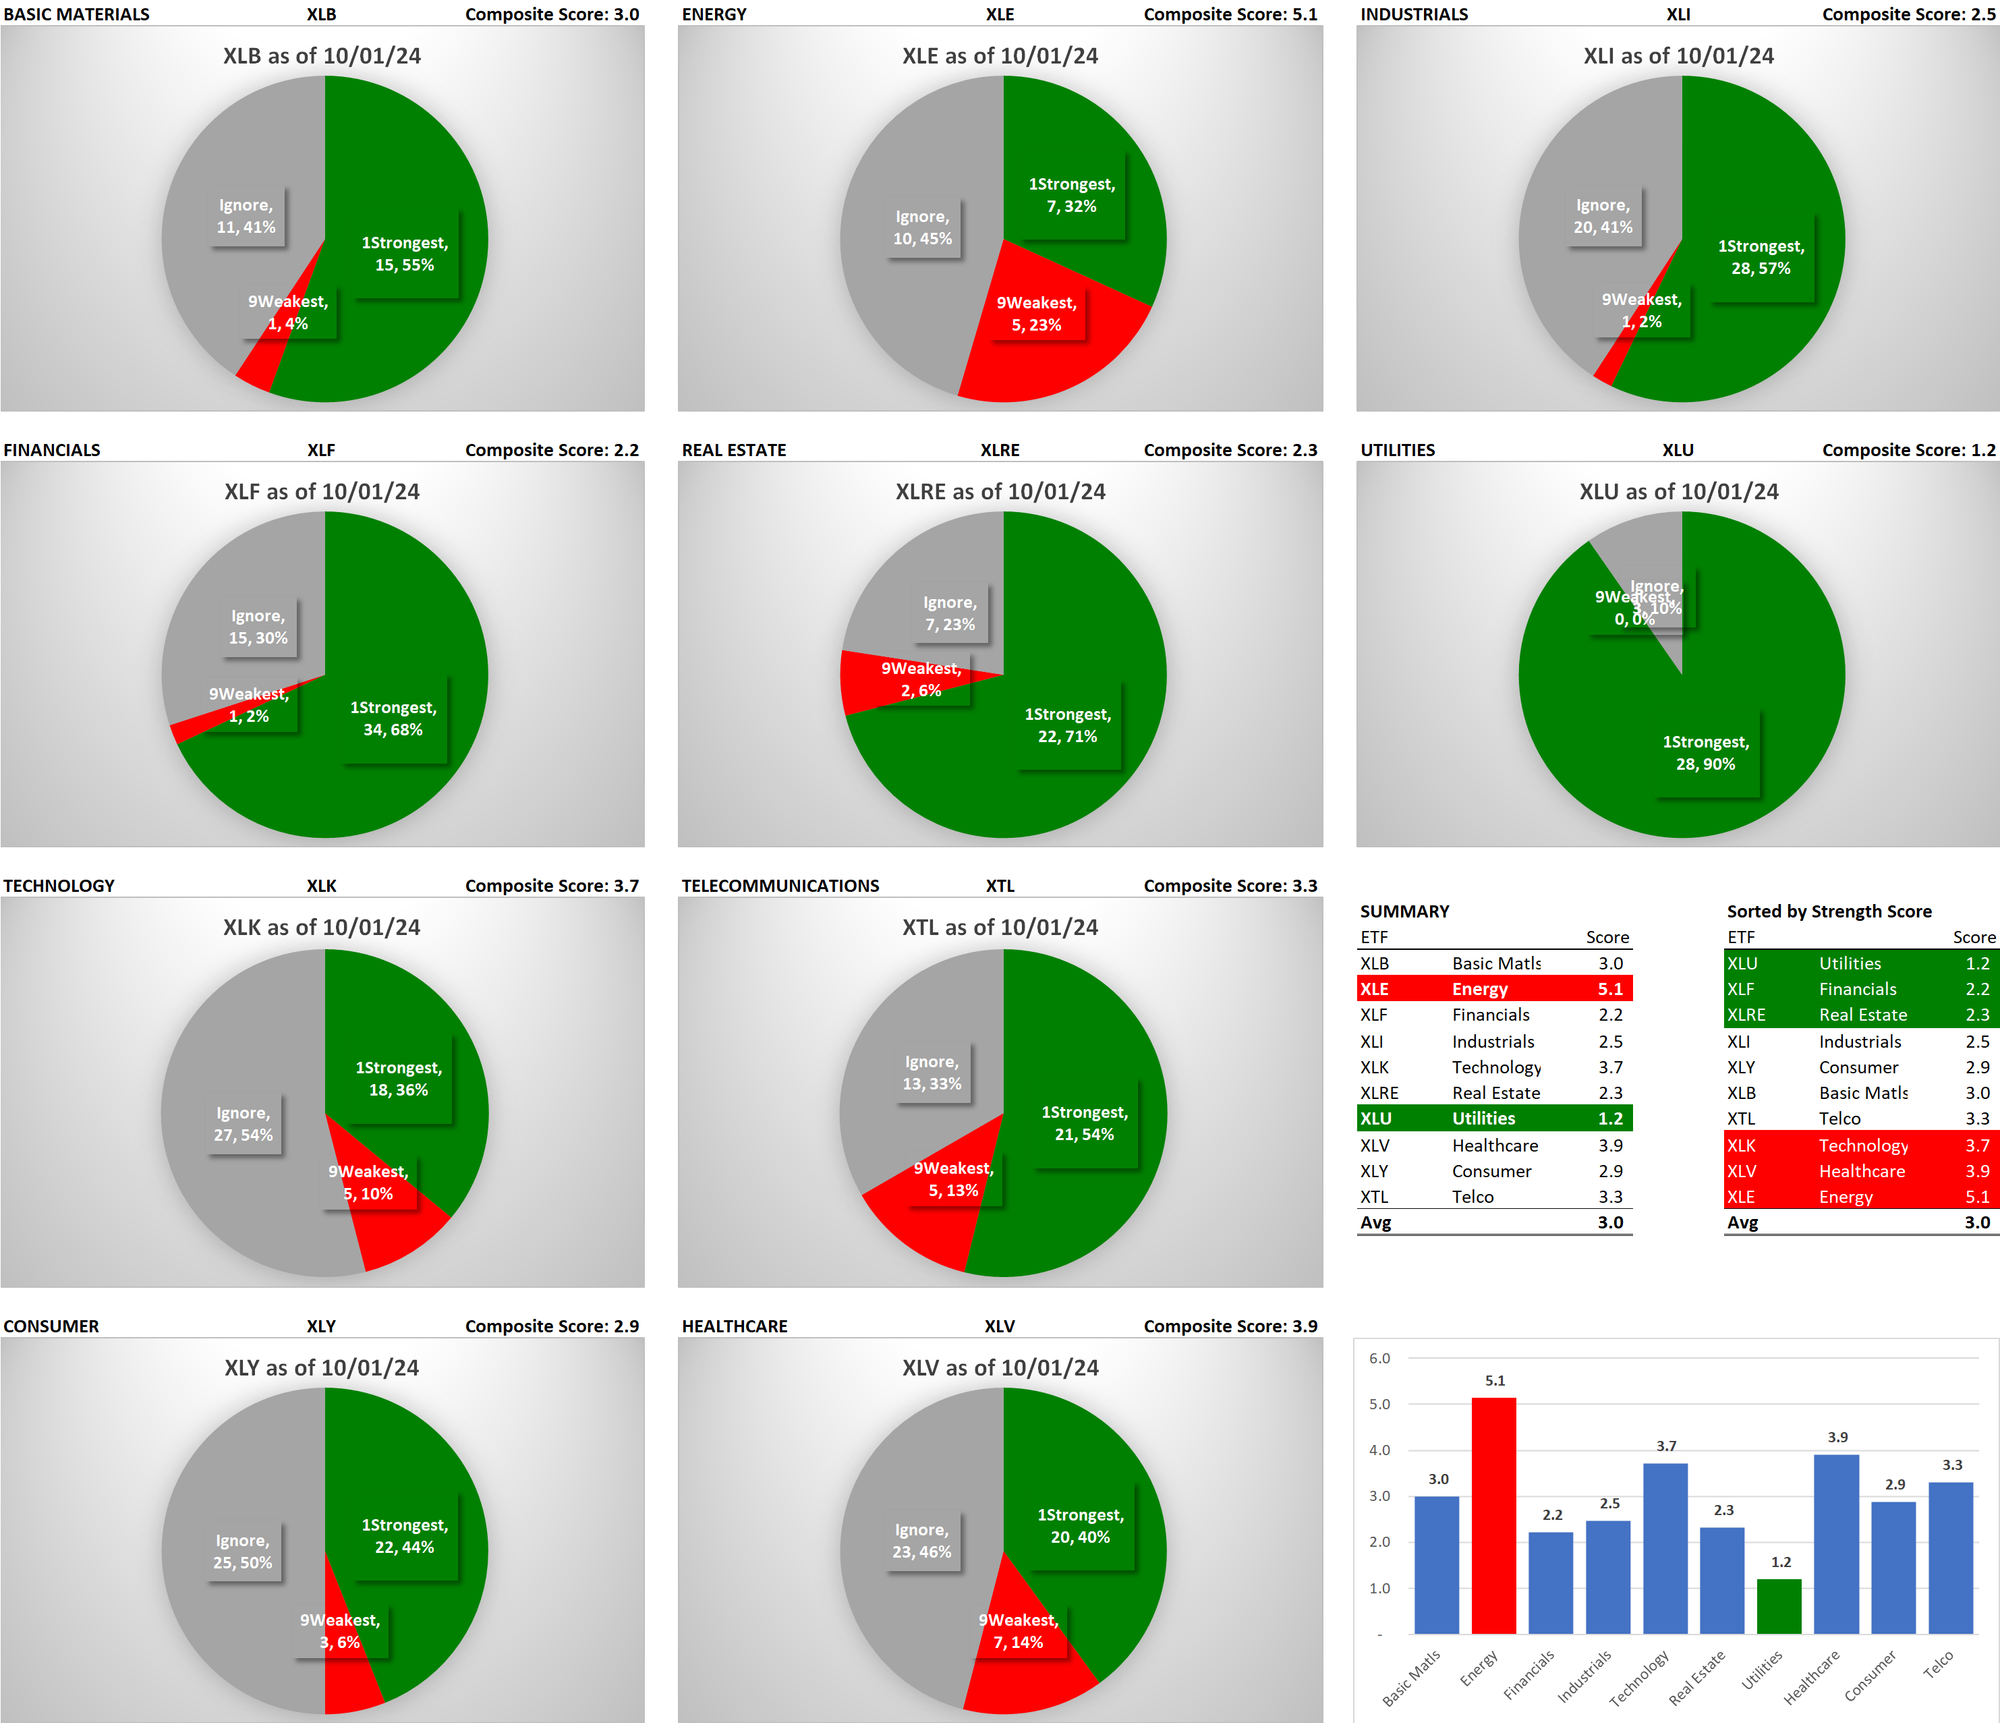
The strongest ETF XLU/Utilities has no stocks rated 9Weakest while the weakest ETF XLE/Energy has the highest proportion of stocks rated 9Weakest.
ETFs Stronger than the 3.0 Composite Score:
- Utilities (Unchanged)
- Financials (Weakened)
- Real Estate (Weakened)
- Industrials (Unchanged)
- Consumer (Weakened)
ETFs Weaker than the 3.0 Composite Score:
- Energy (Strengthened)
- Healthcare (Strengthened)
- Technology (Weakened)
- Telecommunications (Weakened)
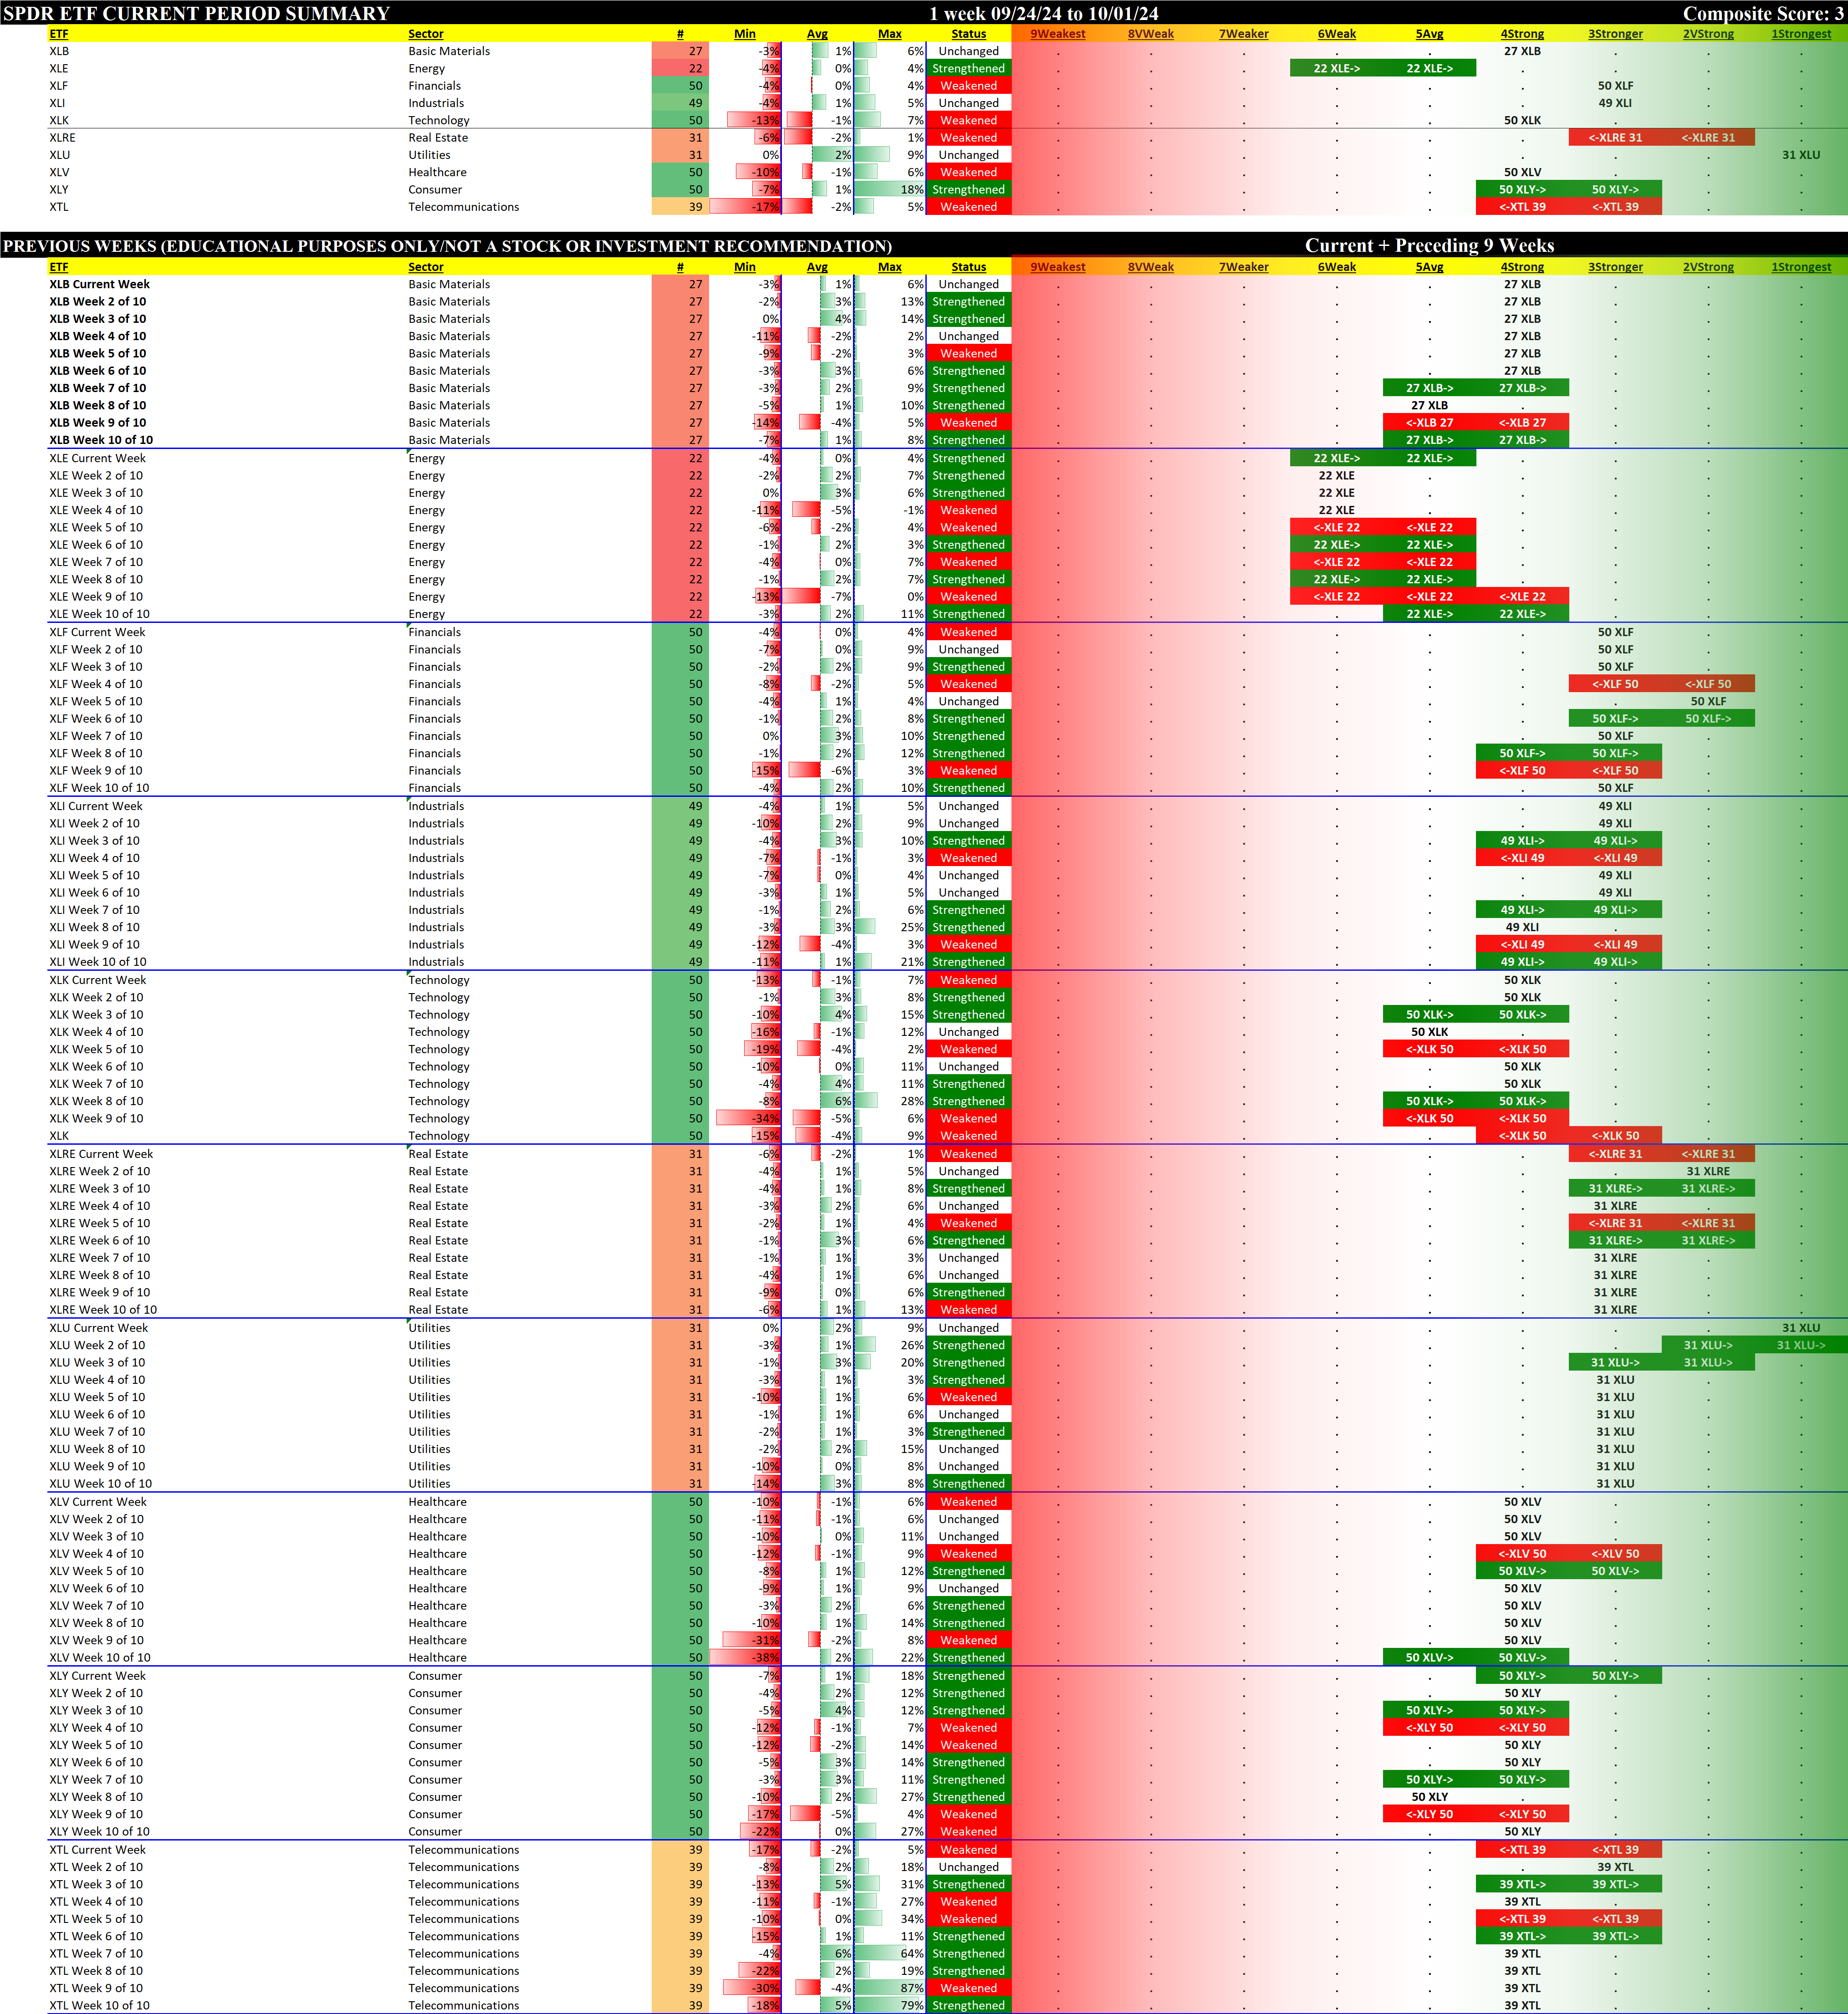
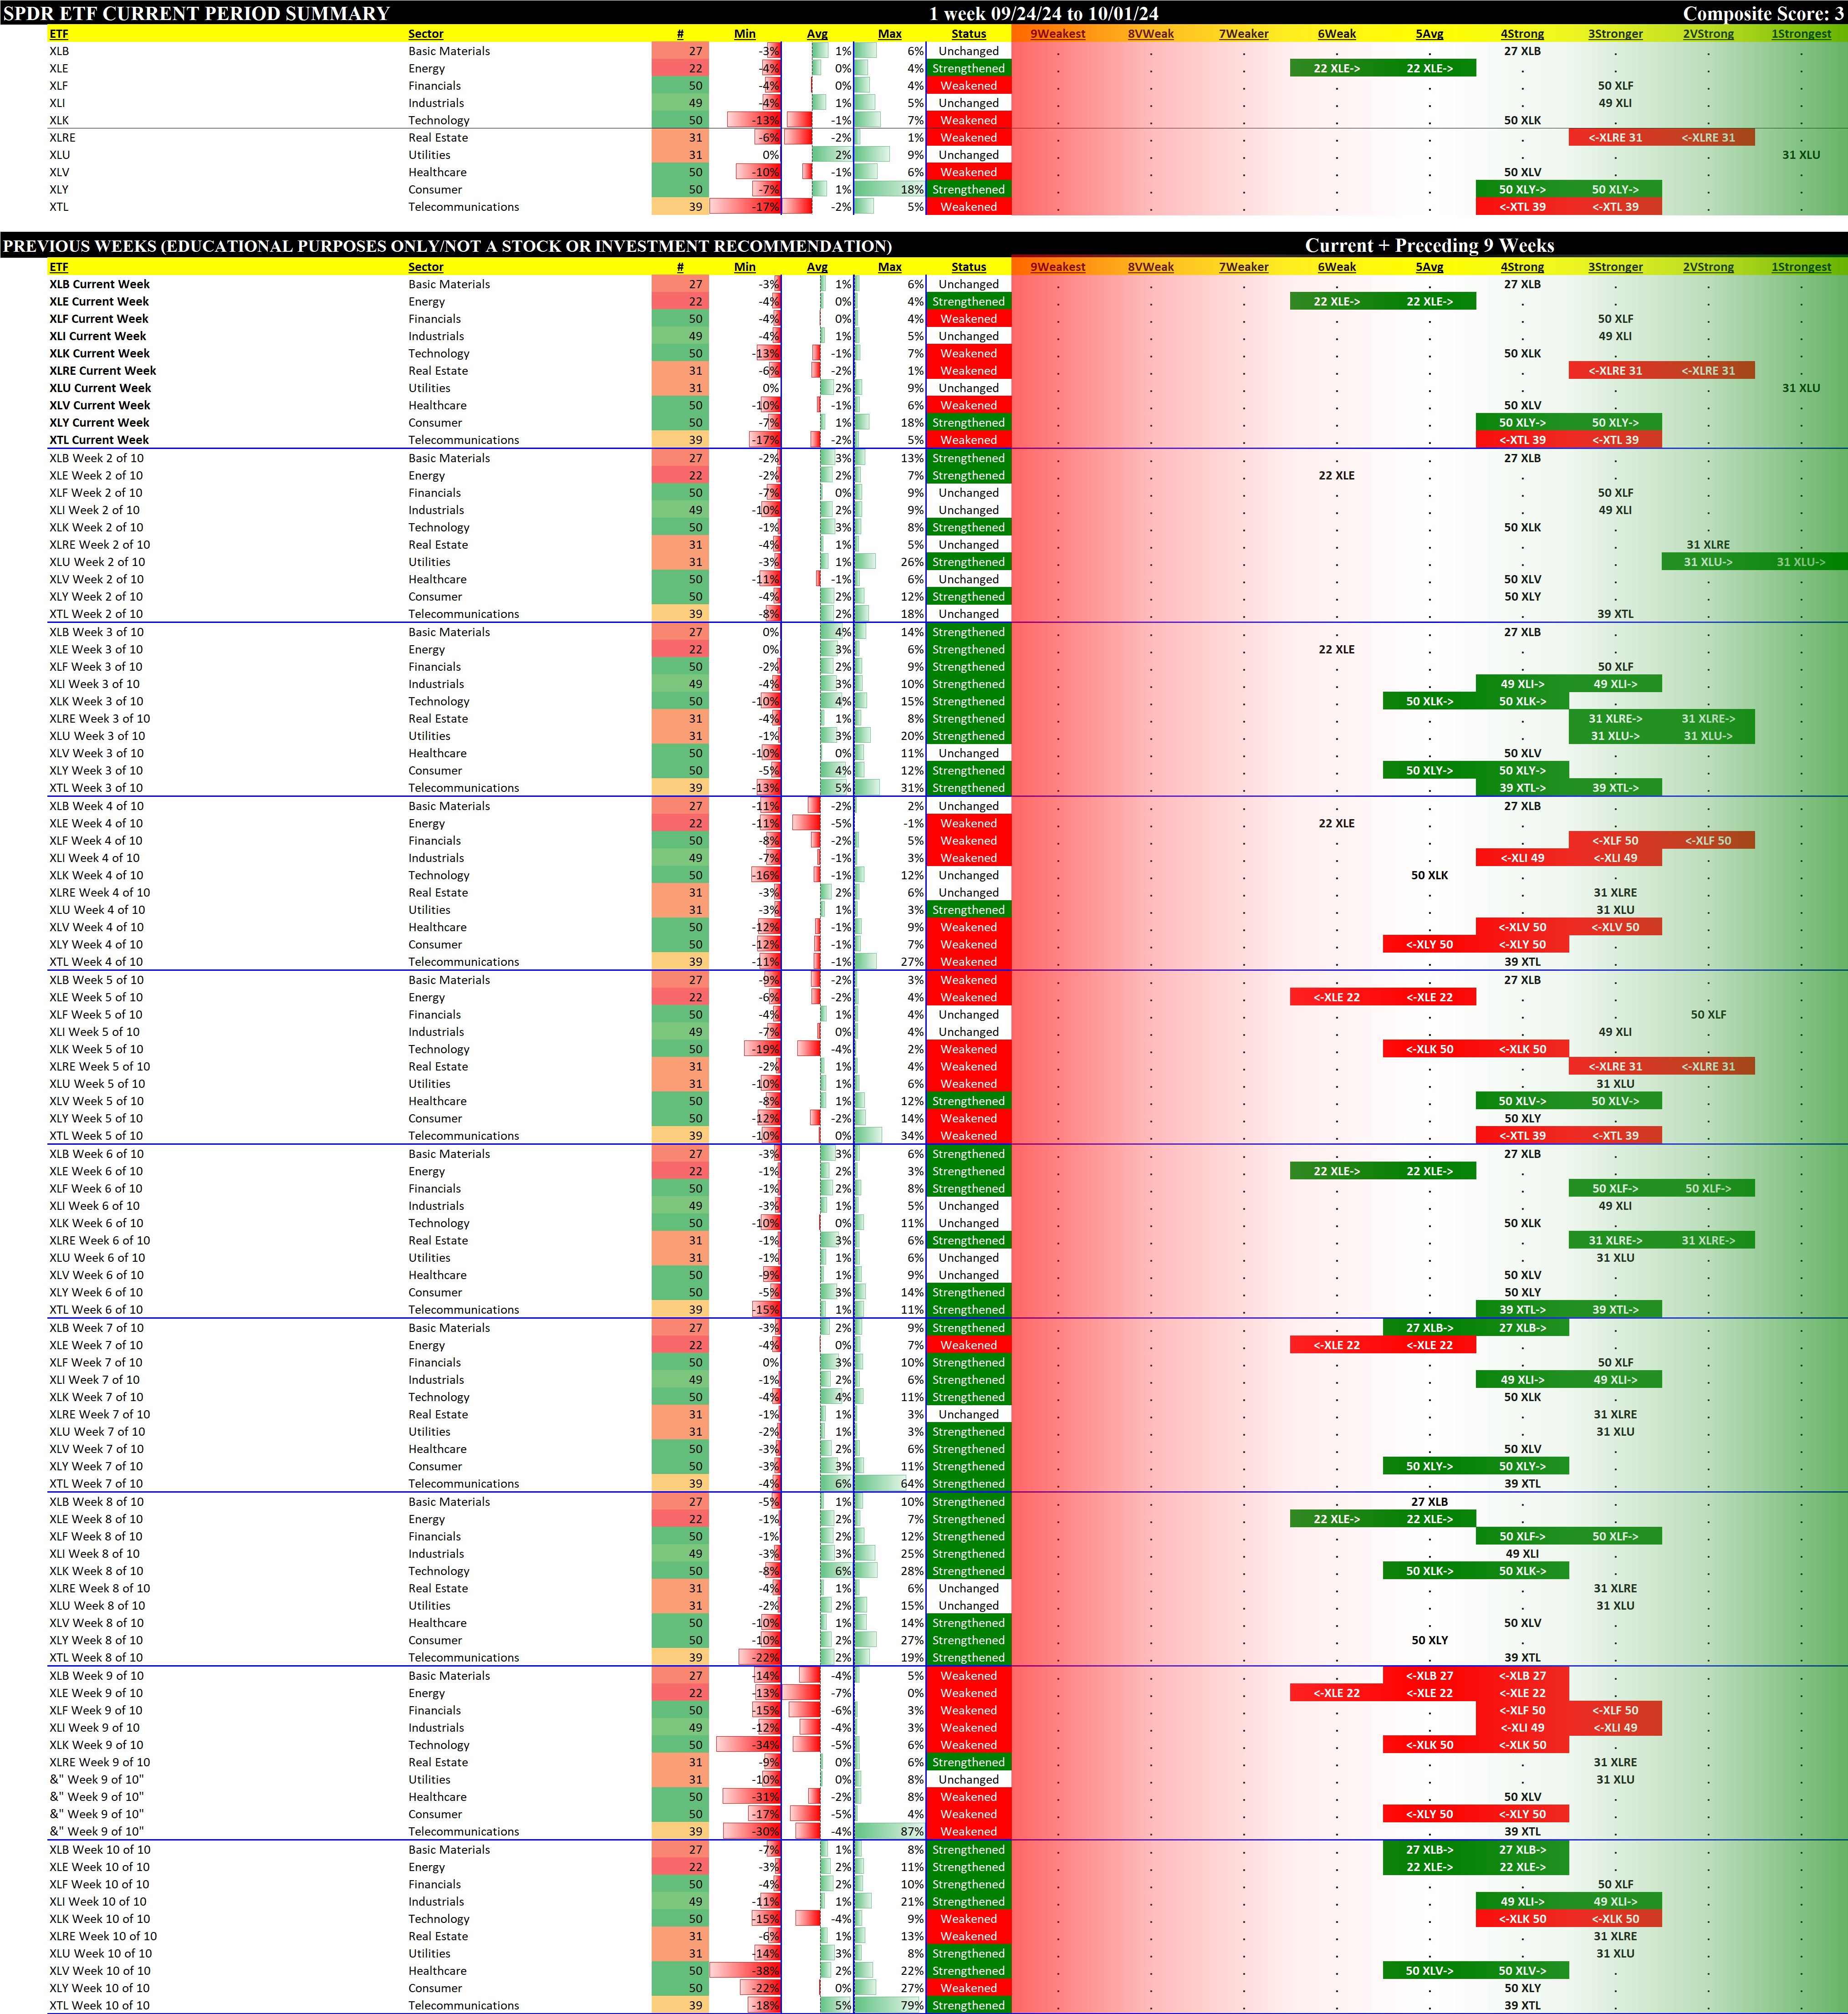
1.2 Historical Summaries
Below are 10-week historical strength rating summaries of the ETFs, sorted by ETF and by Week.
2. ETFs Detail
Details for each of the 10 ETFs are provided below. Comments:
- The top section shows the strength rating of the sectors comprising each ETF, based on the eight original Stock Market Organizer classifications and NOT the 10 ETF classifications. For example, the XLB Basic Materials ETF consists of 19 Basic Materials stocks, 6 Consumer Goods stocks, and 2 Industrial Goods stocks.
- The middle section shows the previous 10 weeks' strengthening and weakening of the relevant sectors. For example, since the XLB has Basic Materials, Consumer Goods, and Industrial Goods stocks, these three sectors are shown in the middle section of the XLB detail. The XLF (Financials) has Financial, Services, and Tech stocks.
- The bottom section shows strengthening/weakening for the underlying ETF components stocks, and includes the listing of their Stock Market Organizer industries and sub-industries. These stocks are listed in order based on Sub-industry then strongest to weakest comparative stock strength rating. The Basic Materials XLB ETF includes both Newmont Corporation/NEM in the Gold sub-industry within the Metals & Mining industry and Dow Inc./DOW in the Specialty Chemicals sub-industry within the Chemicals industry.
In these bottom sections, one can visually see the strength/strengthening and weakness/weakening of the component stocks in each ETF.
2.1 The Materials Select Sector SPDR Fund (XLB)
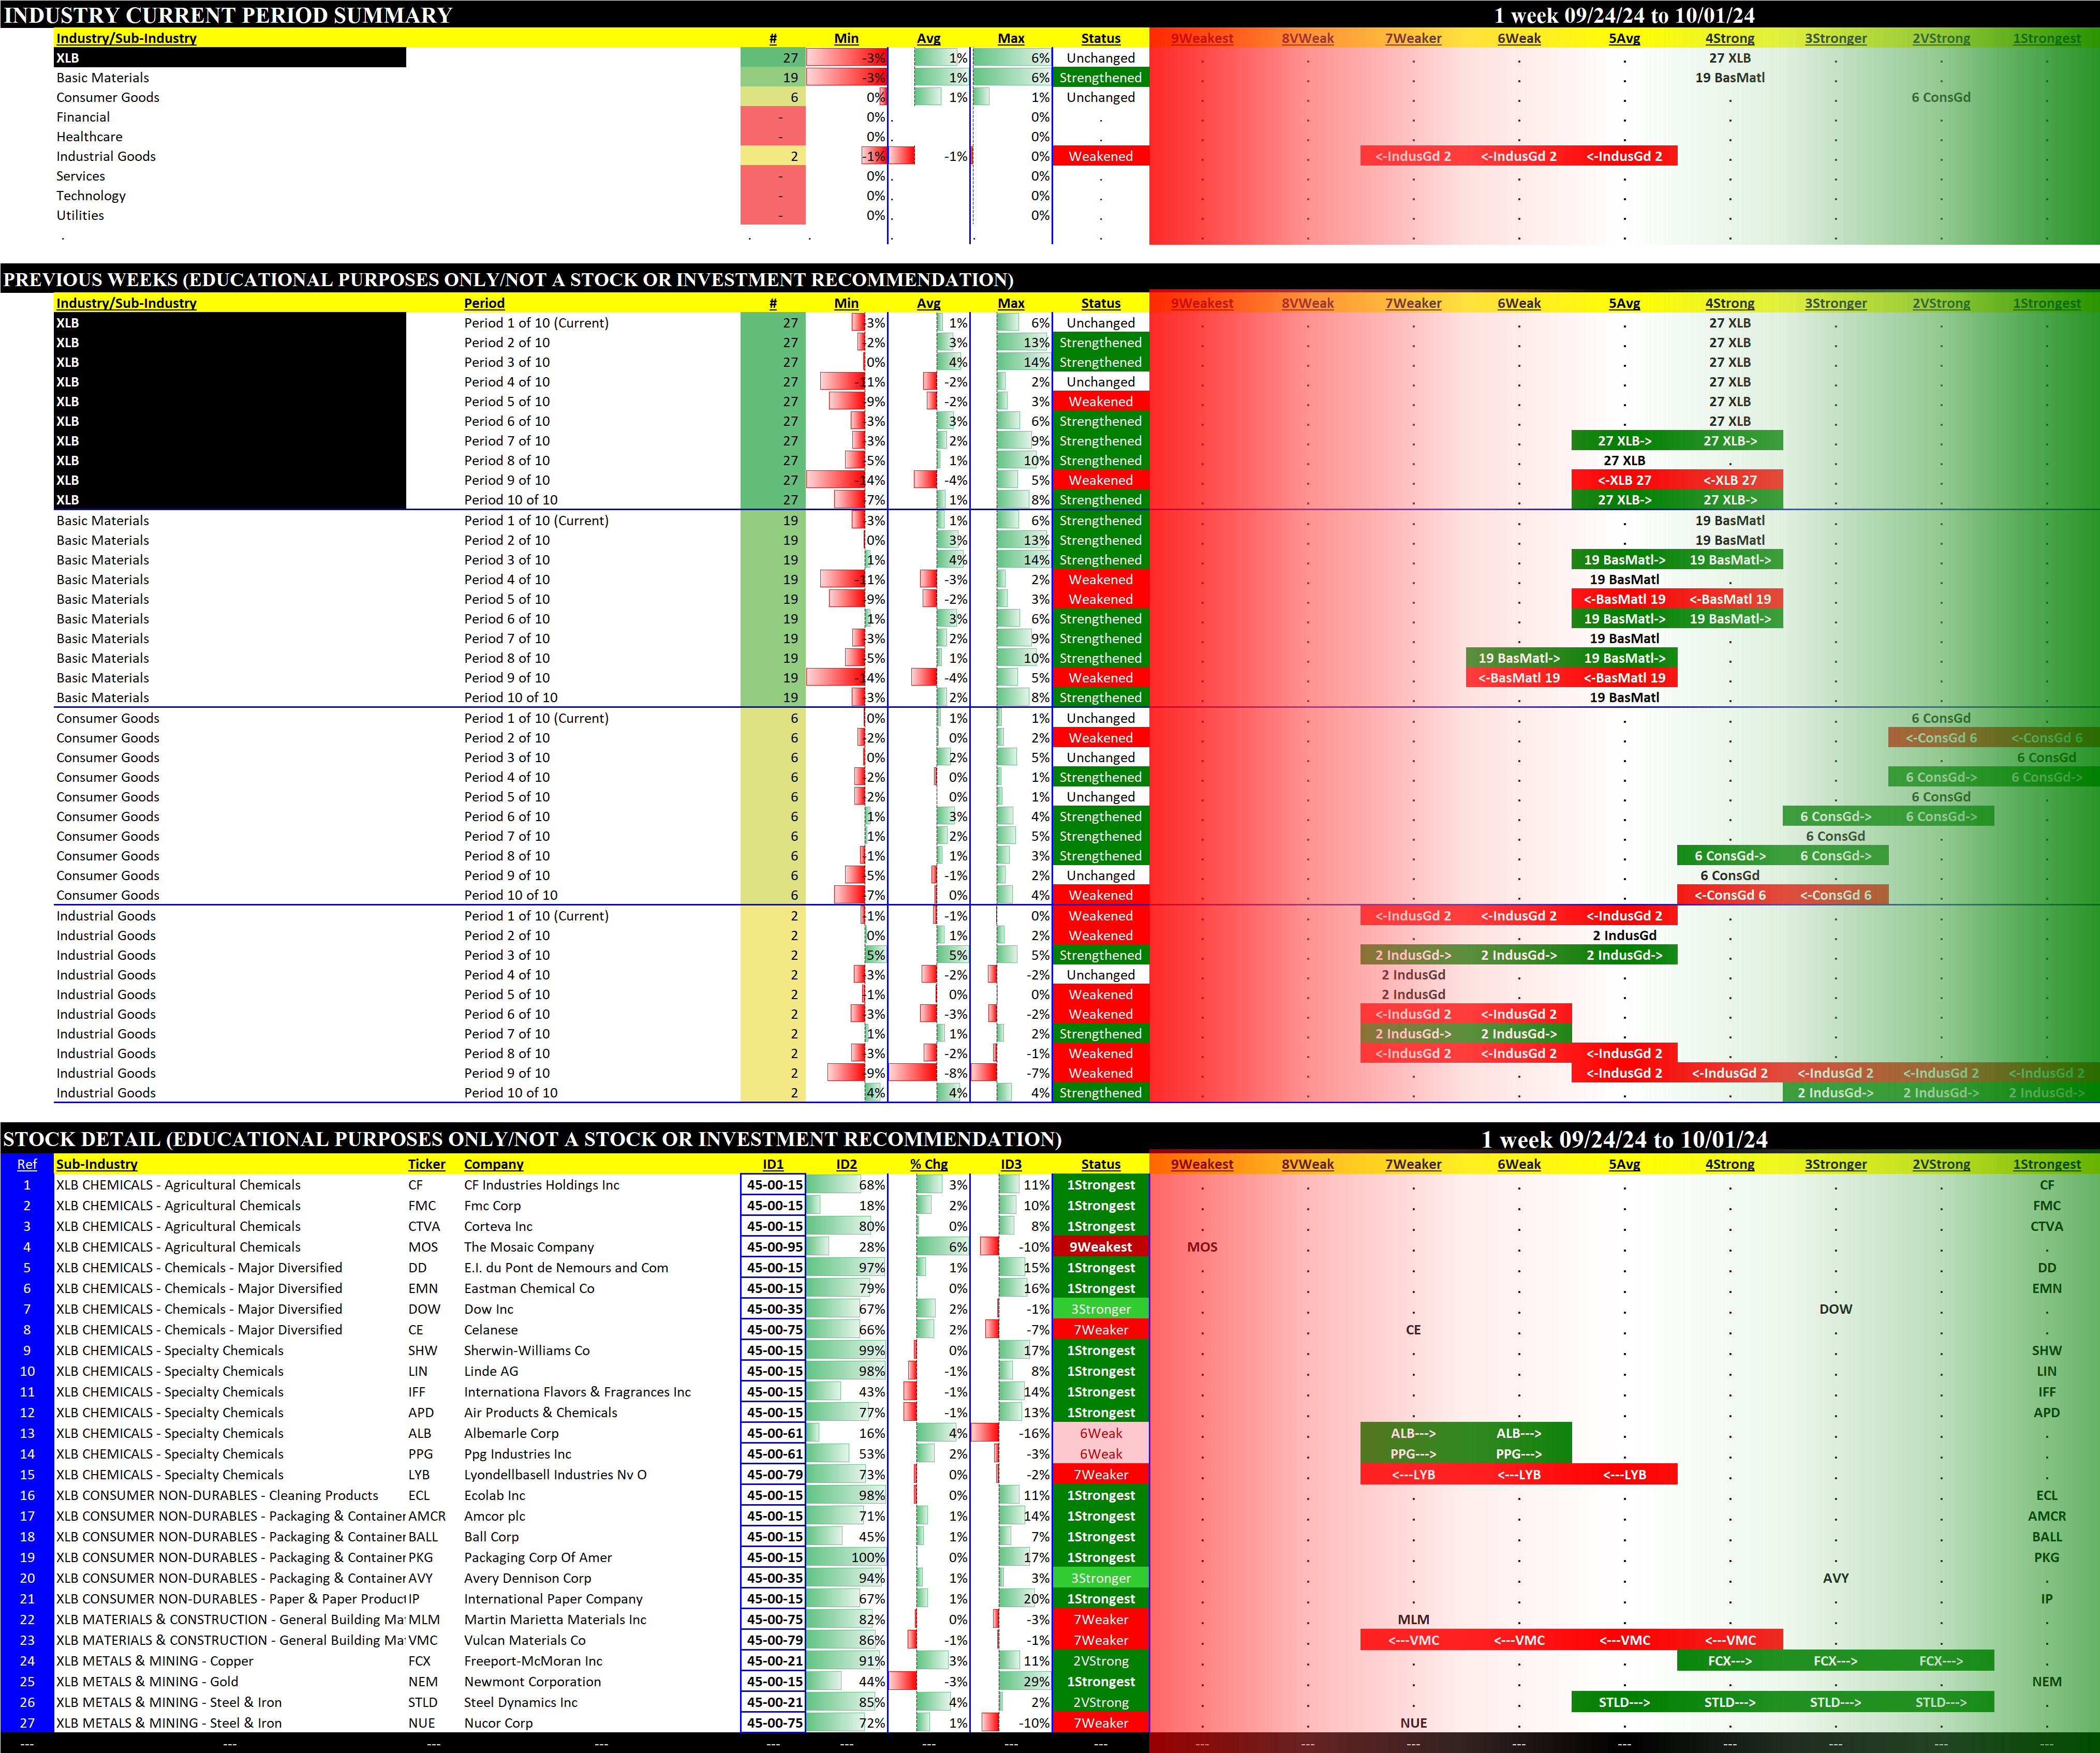
The index includes securities of companies from the following industries: chemicals; metals and mining; paper and forest products; containers and packaging; and construction materials.
2.2 The Energy Select Sector SPDR Fund (XLE)
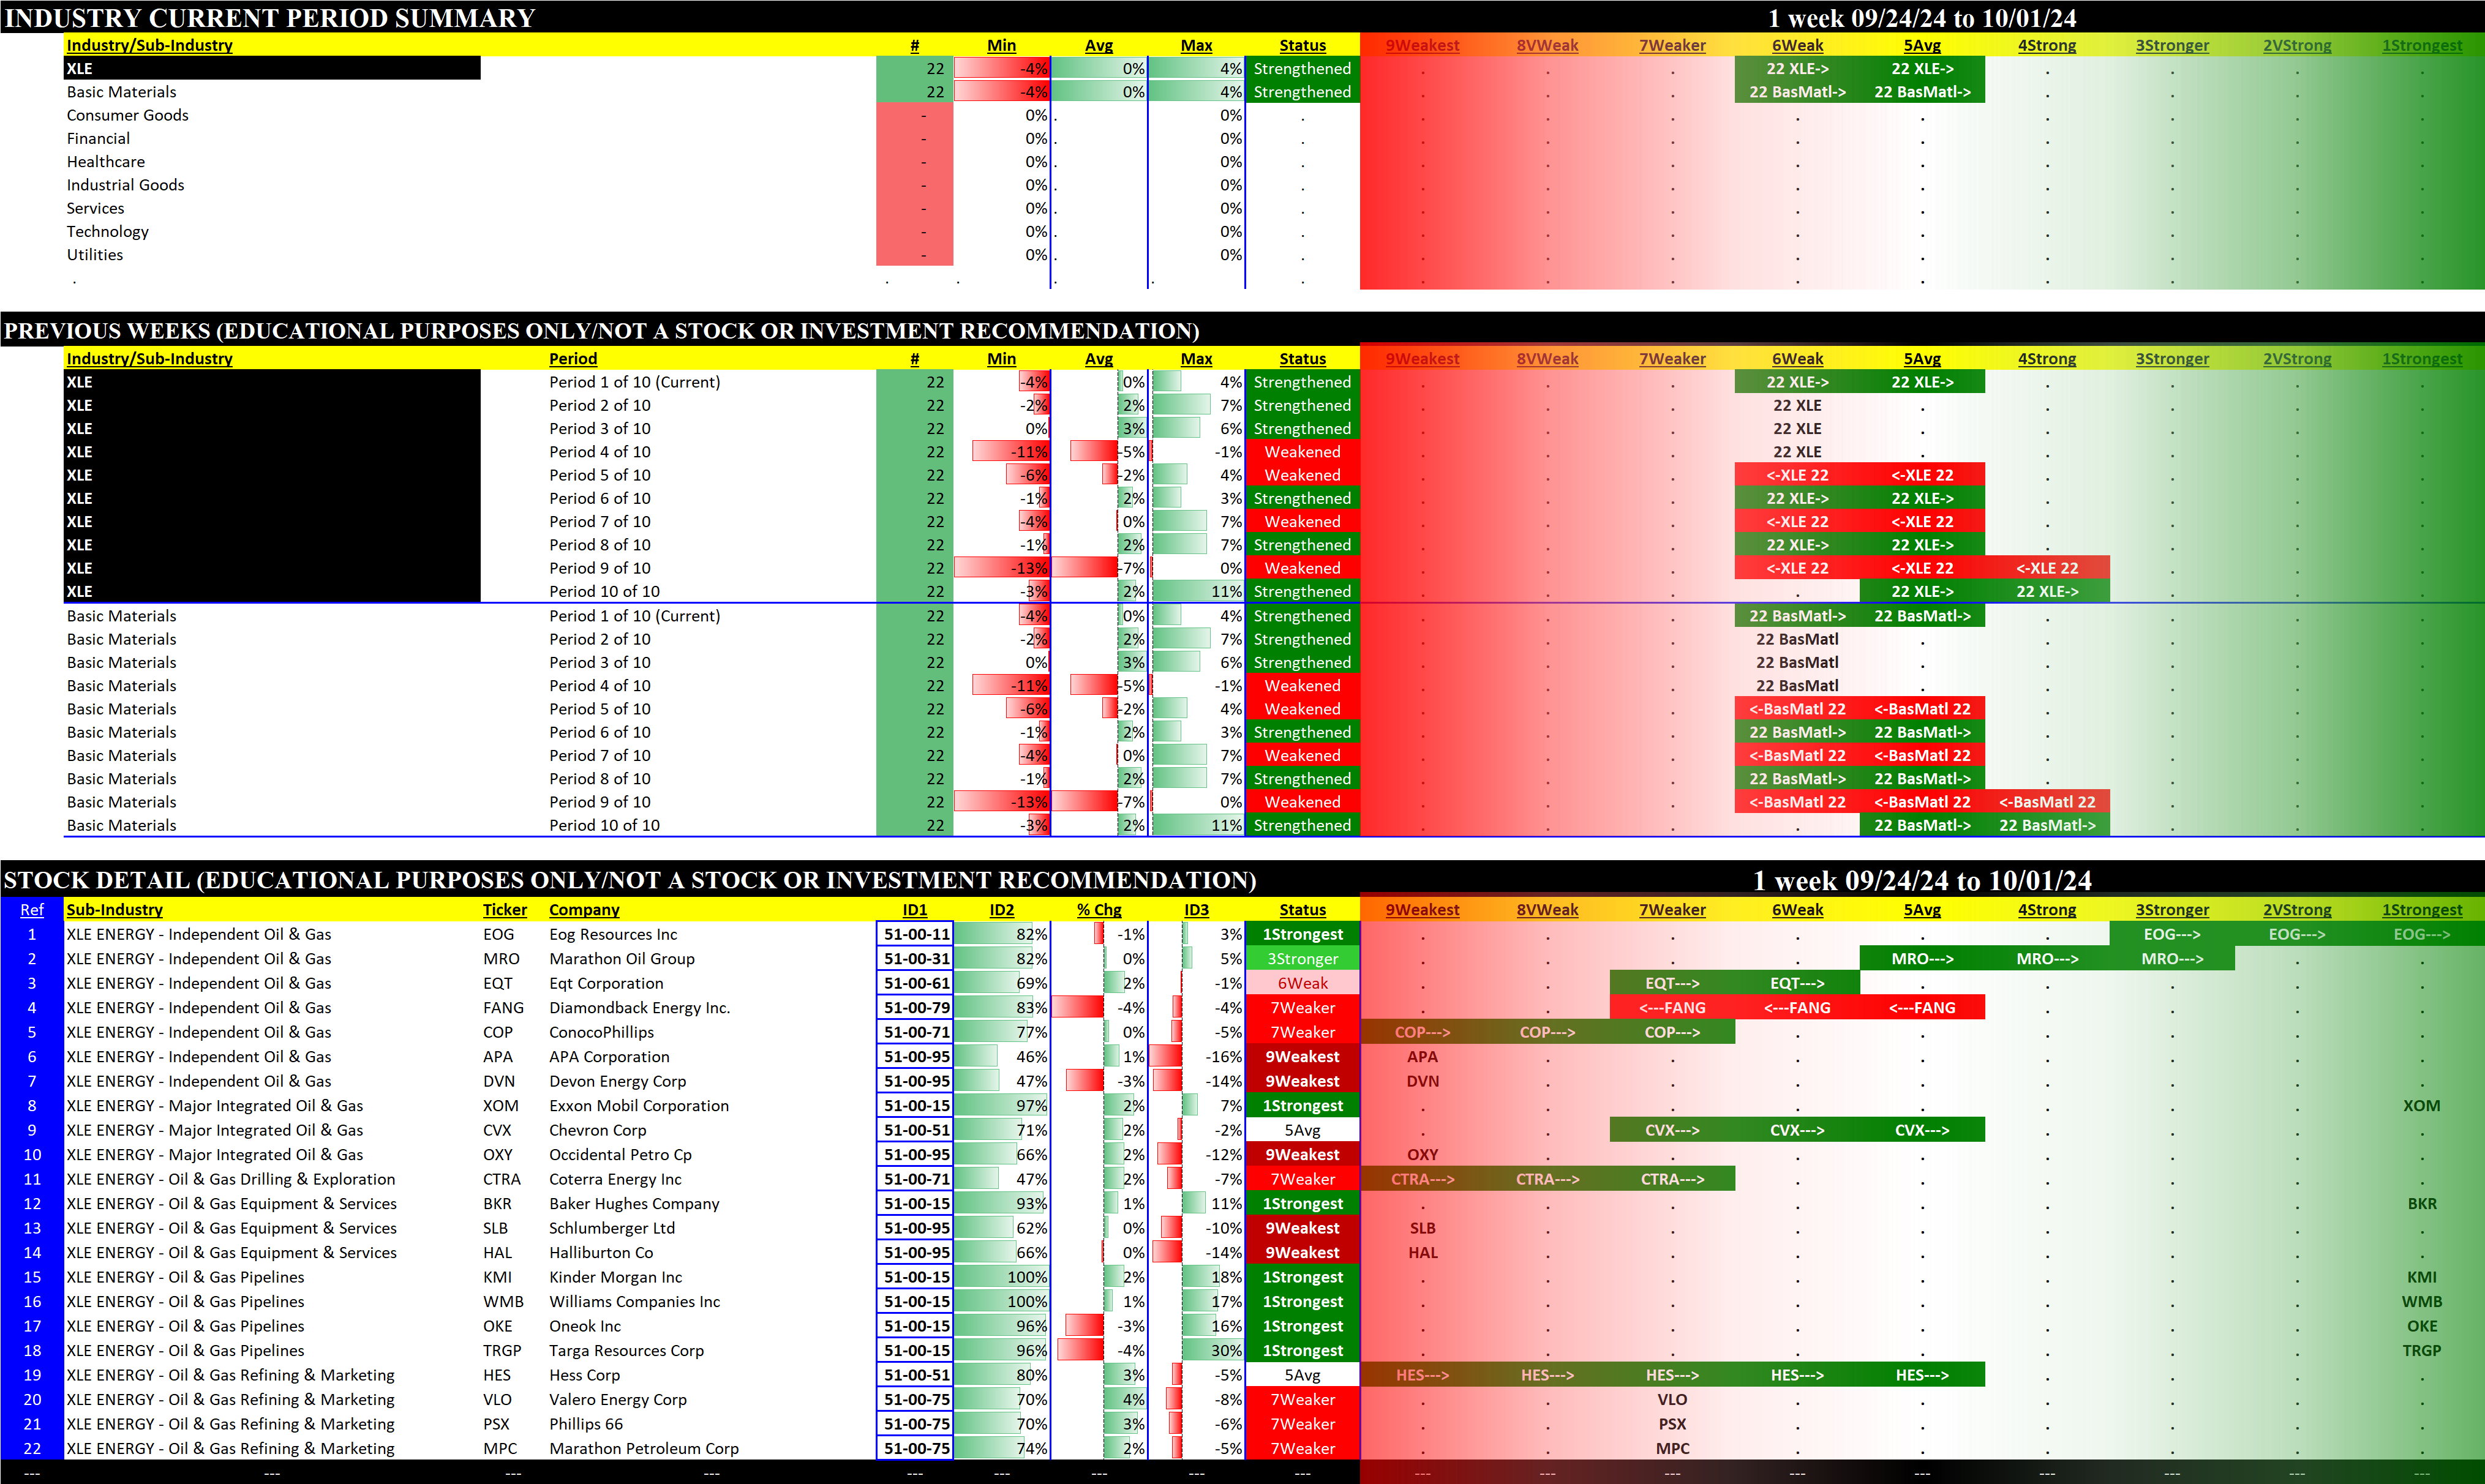
The index includes companies that have been identified as Energy companies by the GICS®, including securities of companies from the following industries: oil, gas and consumable fuels; and energy equipment and services.
2.3 The Financial Select Sector SPDR Fund (XLF)
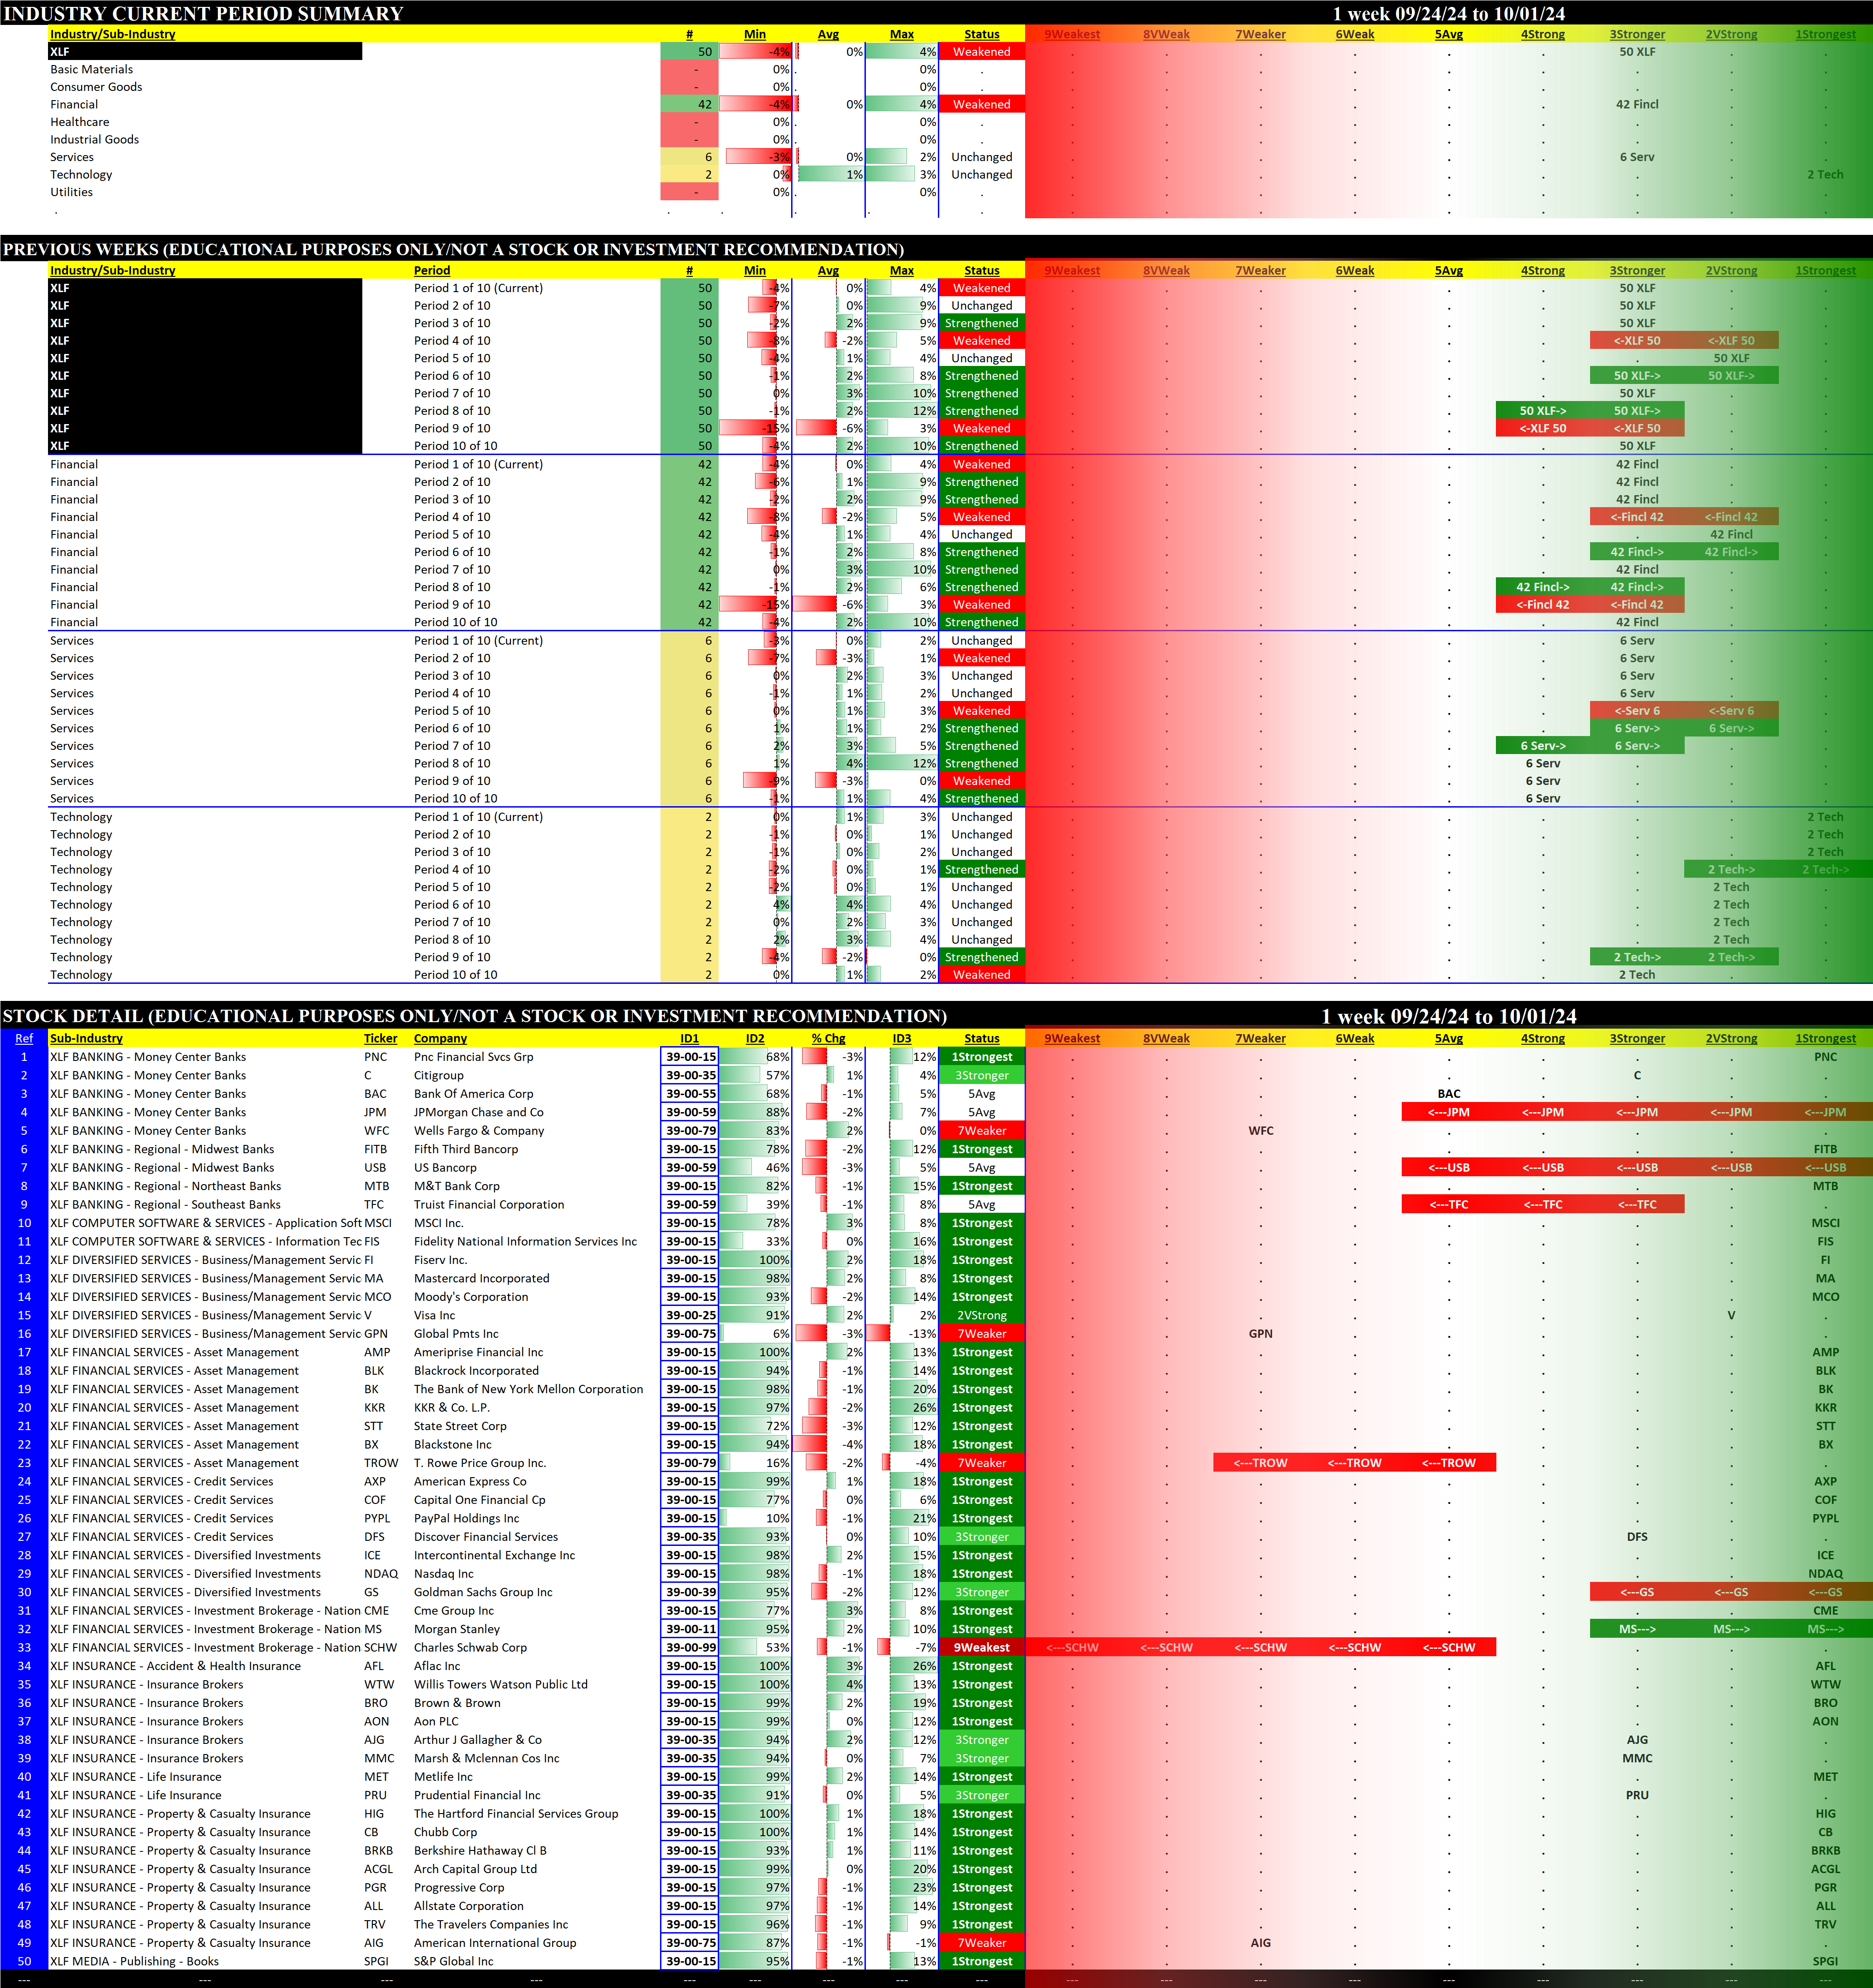
The index includes companies that have been identified as Financial companies by the Global Industry Classification Standard, including securities of companies from the following industries: financial services; insurance; banks; capital markets; mortgage real estate investment trusts; and consumer finance.
2.4 The Industrial Select Sector SPDR Fund (XLI)
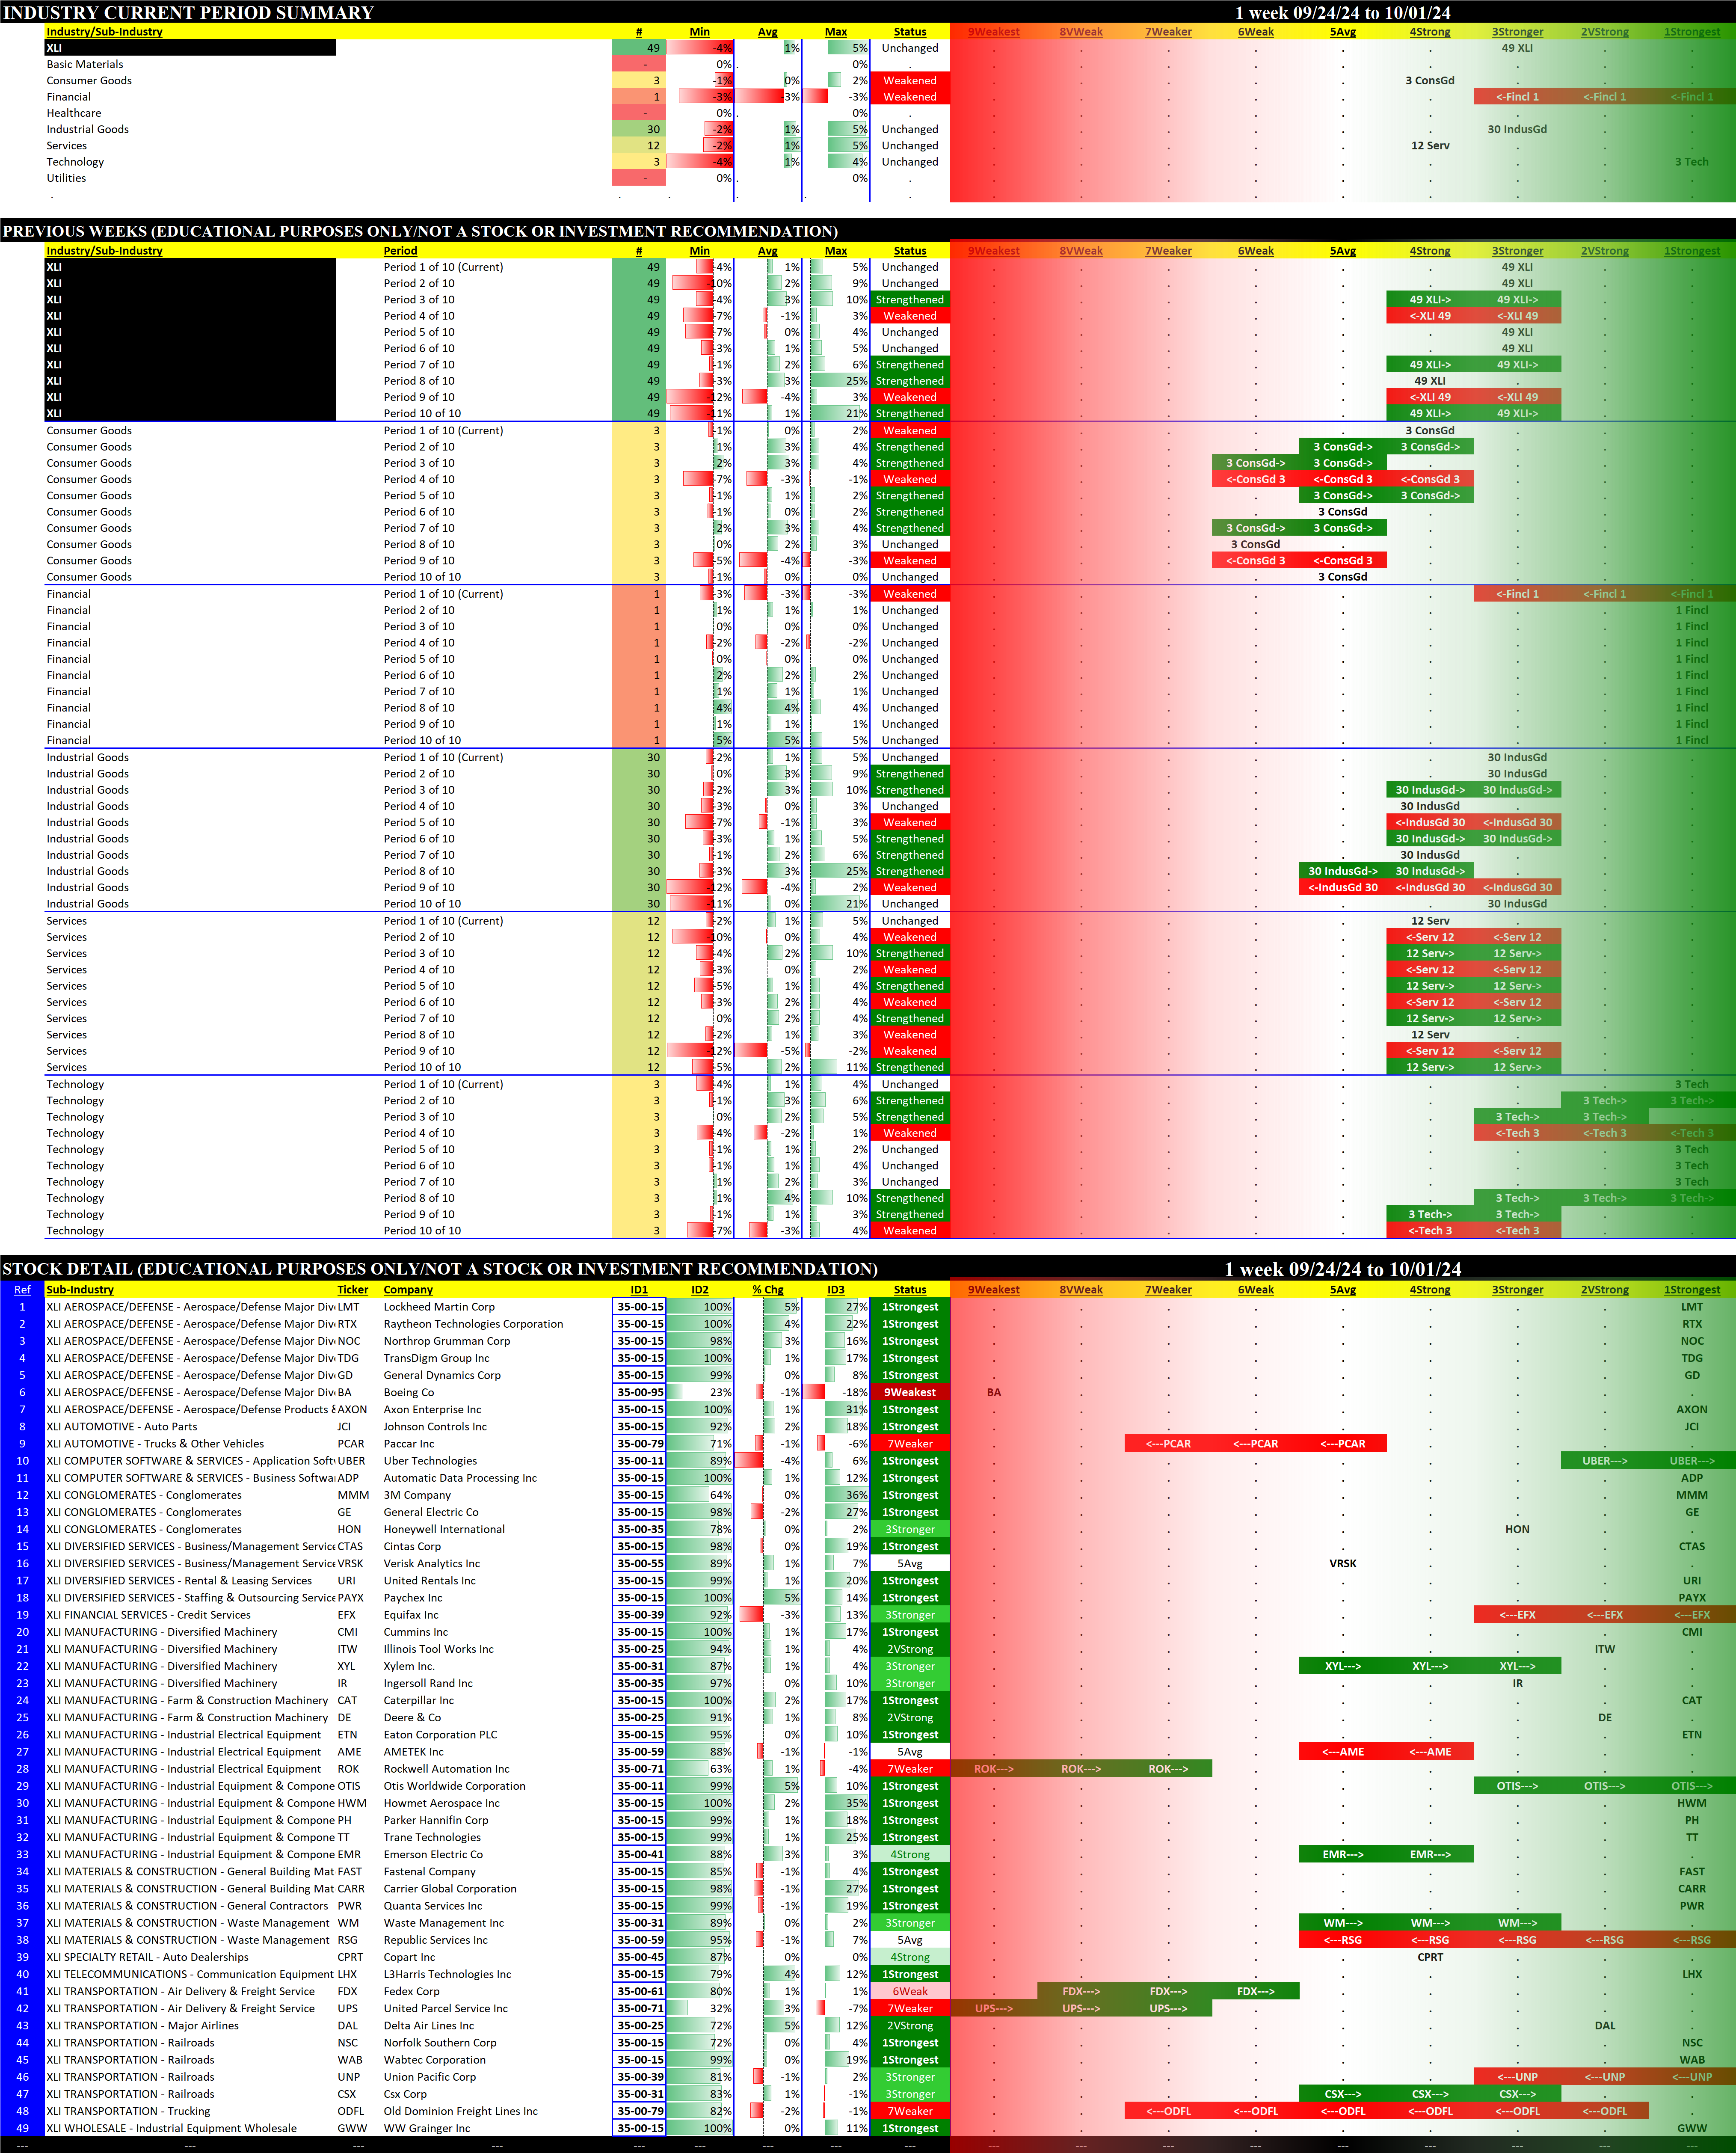
The index includes companies that have been identified as Industrial companies by the Global Industry Classification Standard, including securities of companies from the following industries: aerospace and defense; industrial conglomerates; marine transportation.
2.5 The Technology Select Sector SPDR Fund (XLK)
2.6 The Real Estate Select Sector SPDR Fund (XLRE)
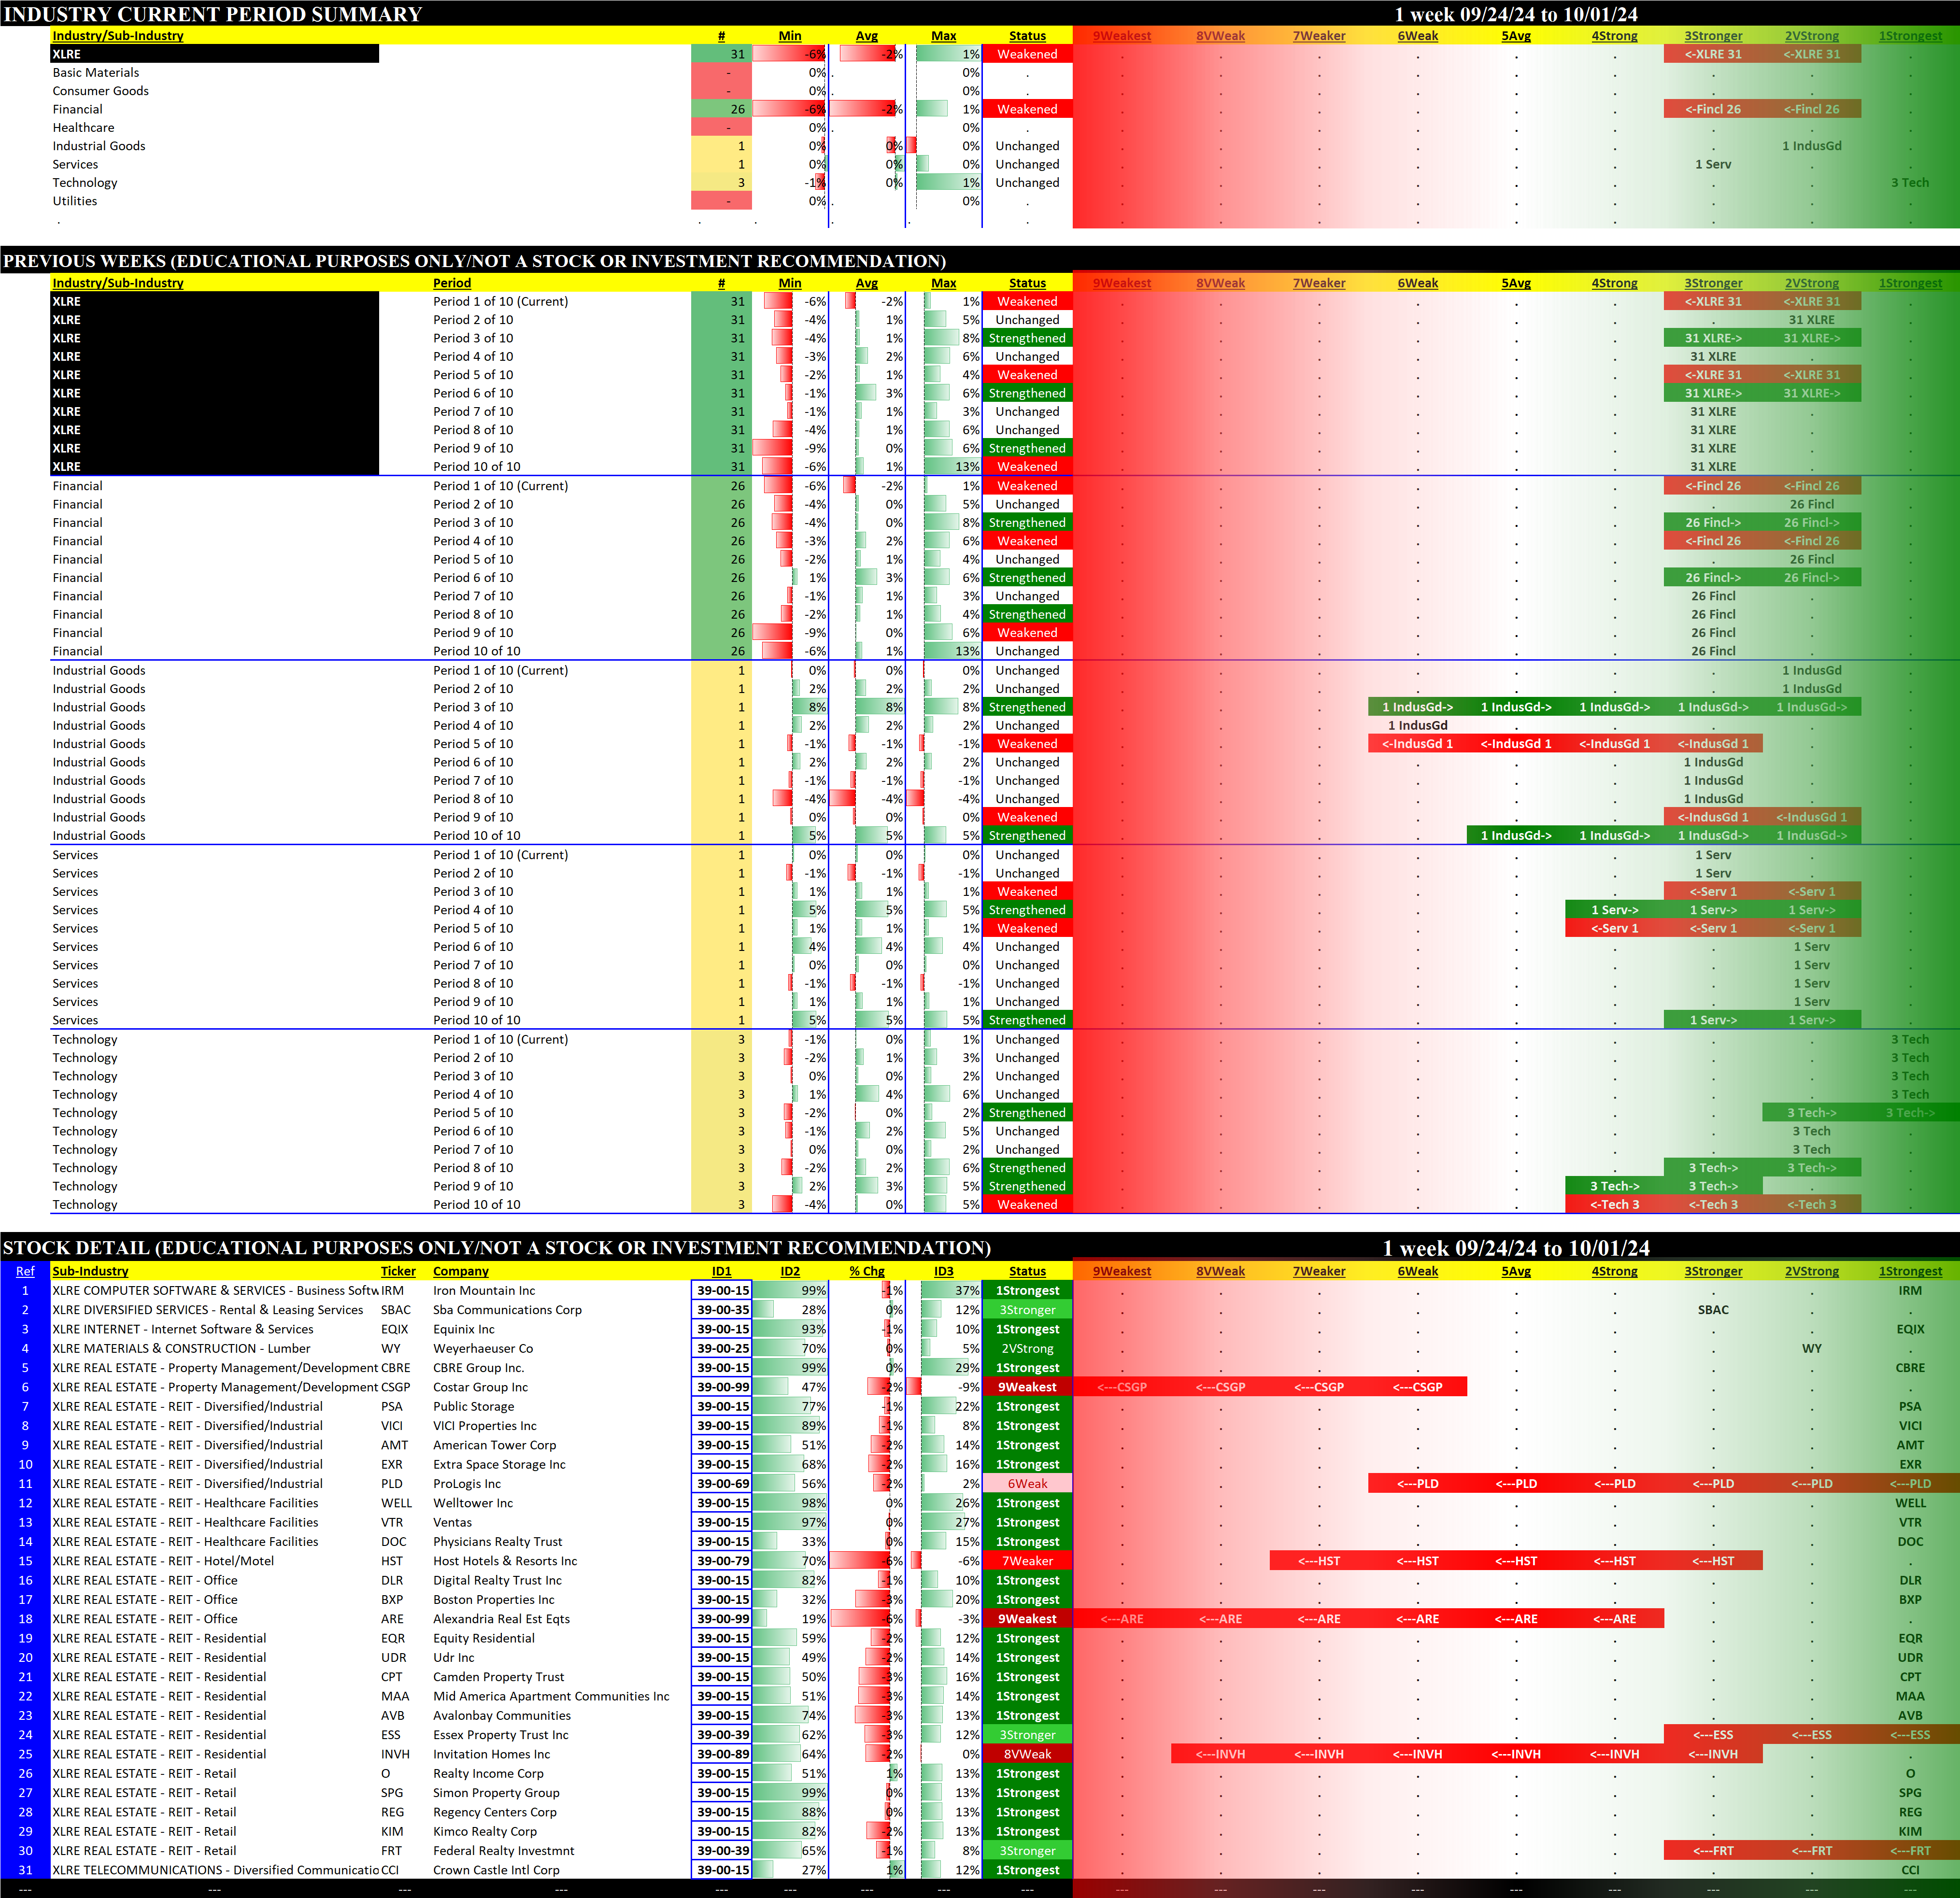
The index includes companies that have been identified as Real Estate companies by the Global Industry Classification Standard (GICS®).
2.7 The Utilities Select Sector SPDR Fund (XLU)
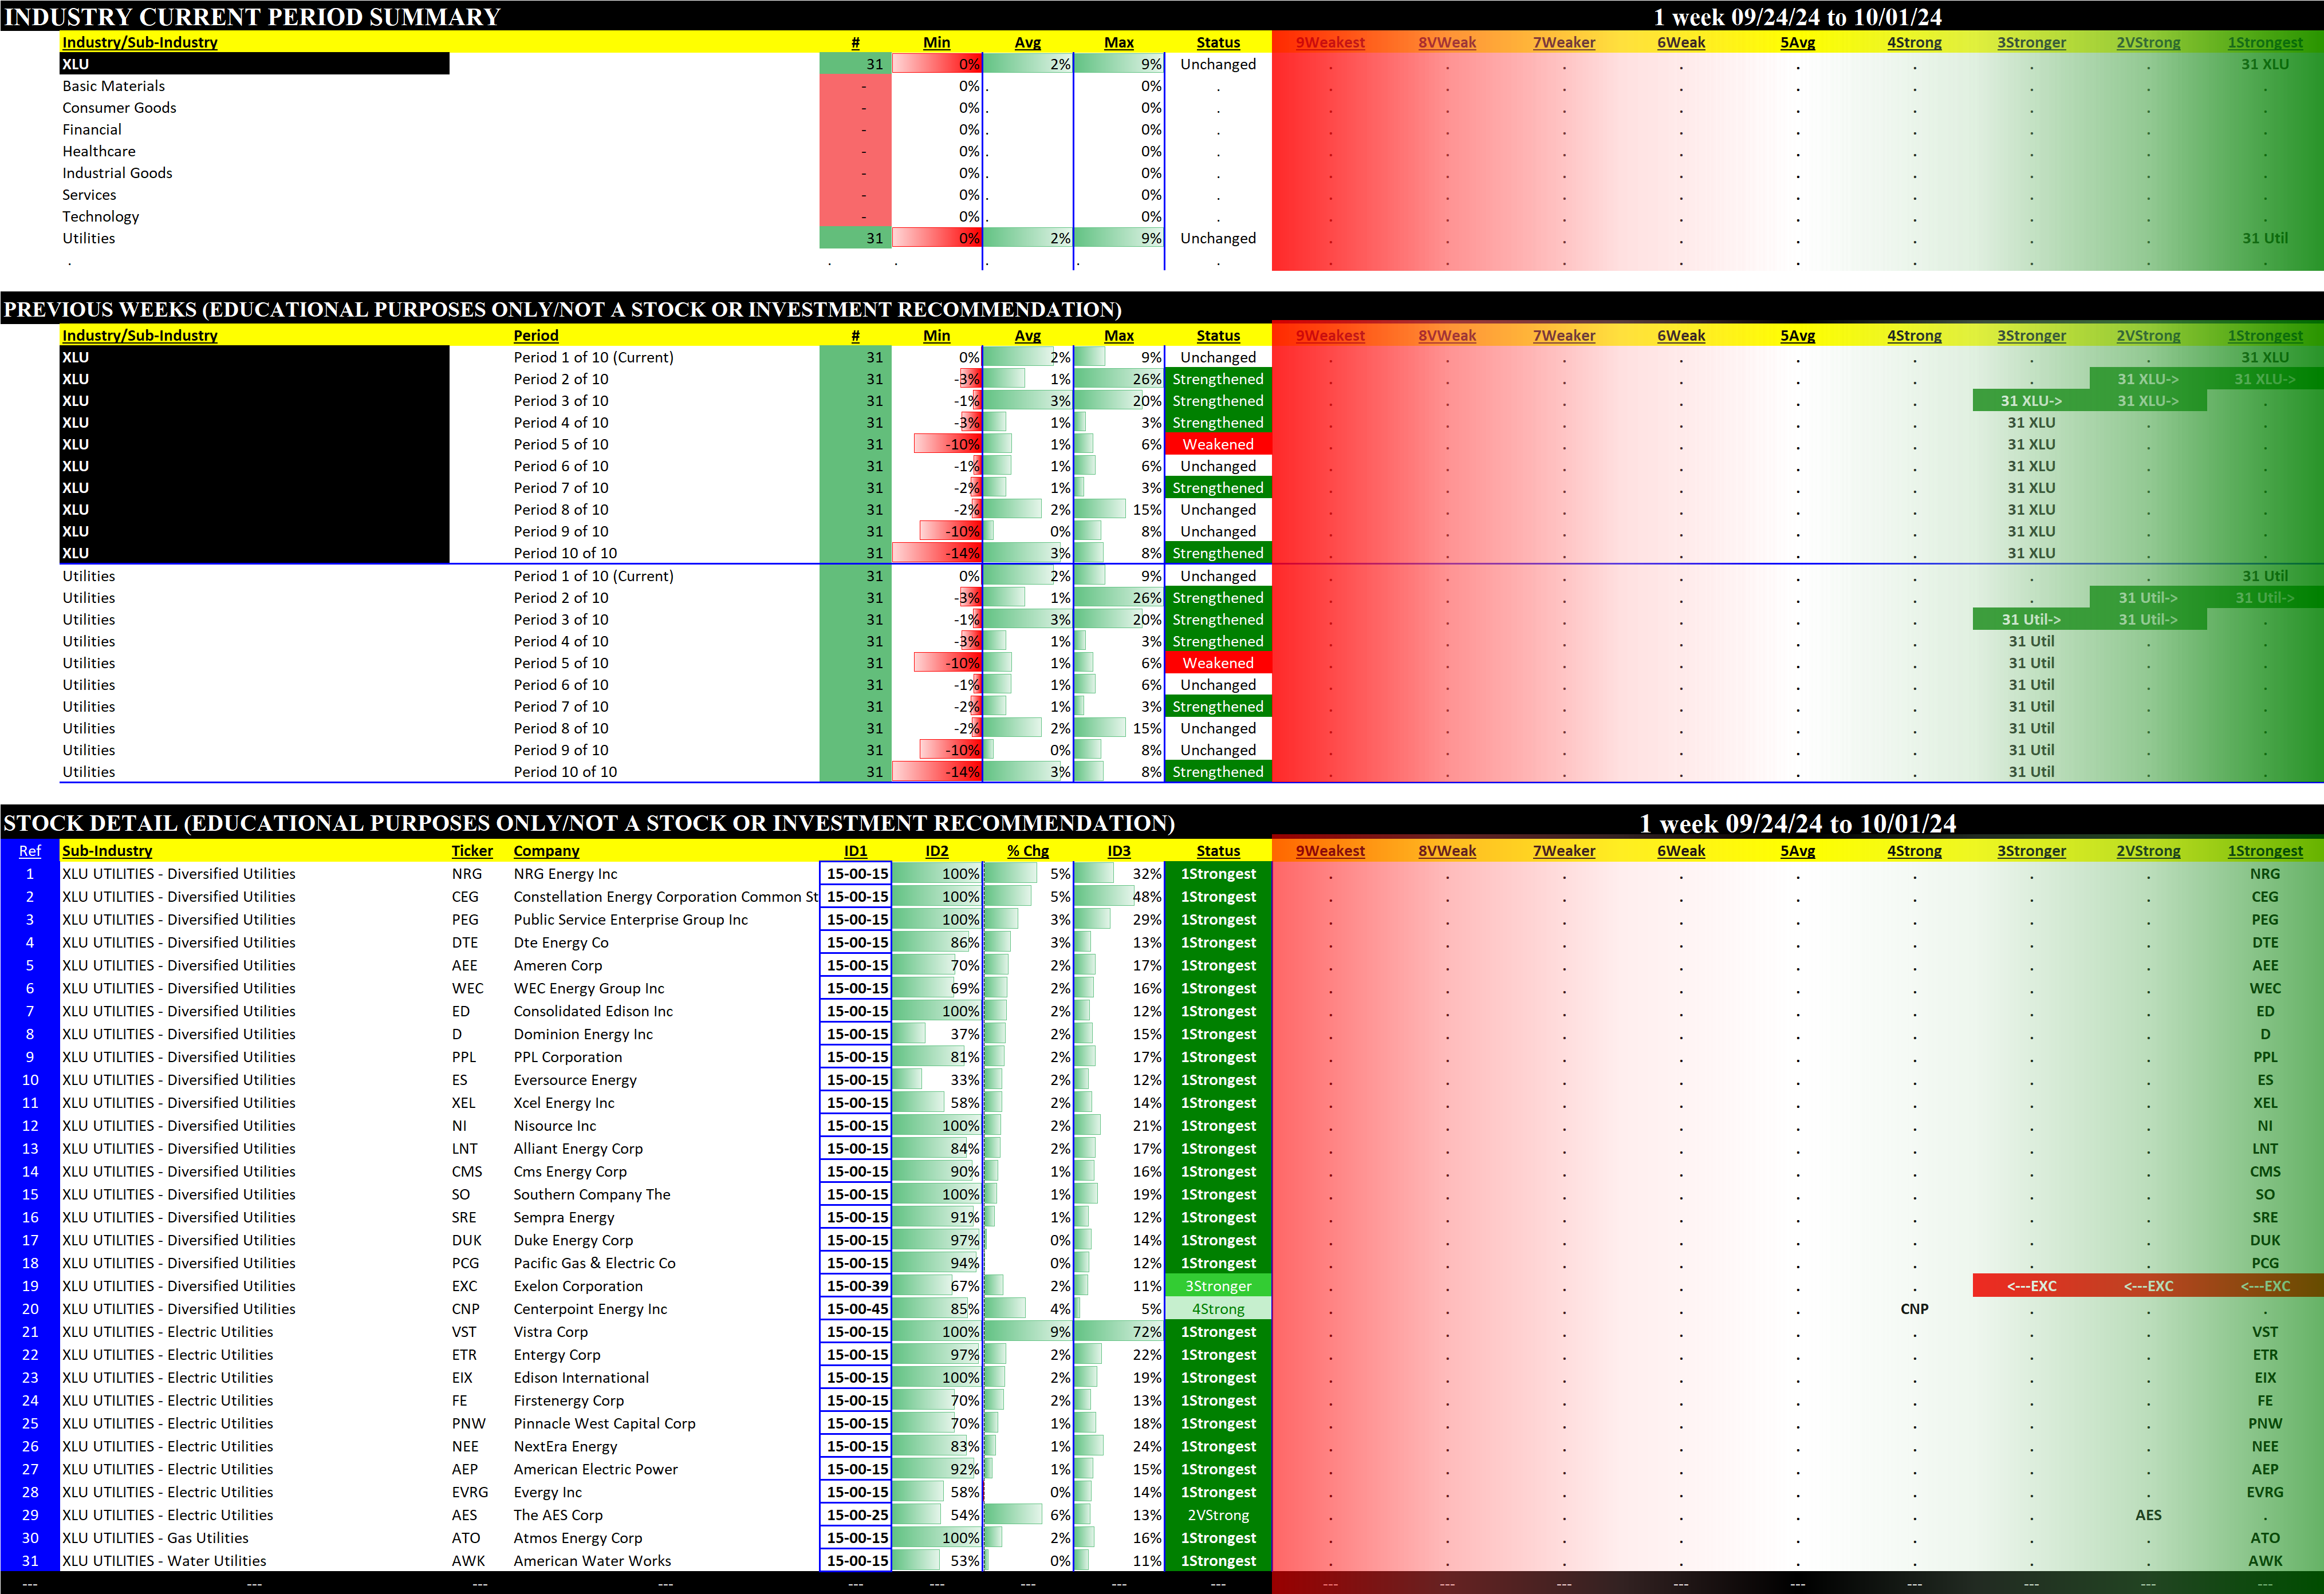
The index includes securities of companies from the following industries: electric utilities; water utilities; multi-utilities; independent power and renewable electricity producers; and gas utilities.
2.8 The Health Care Select Sector SPDR Fund (XLV)
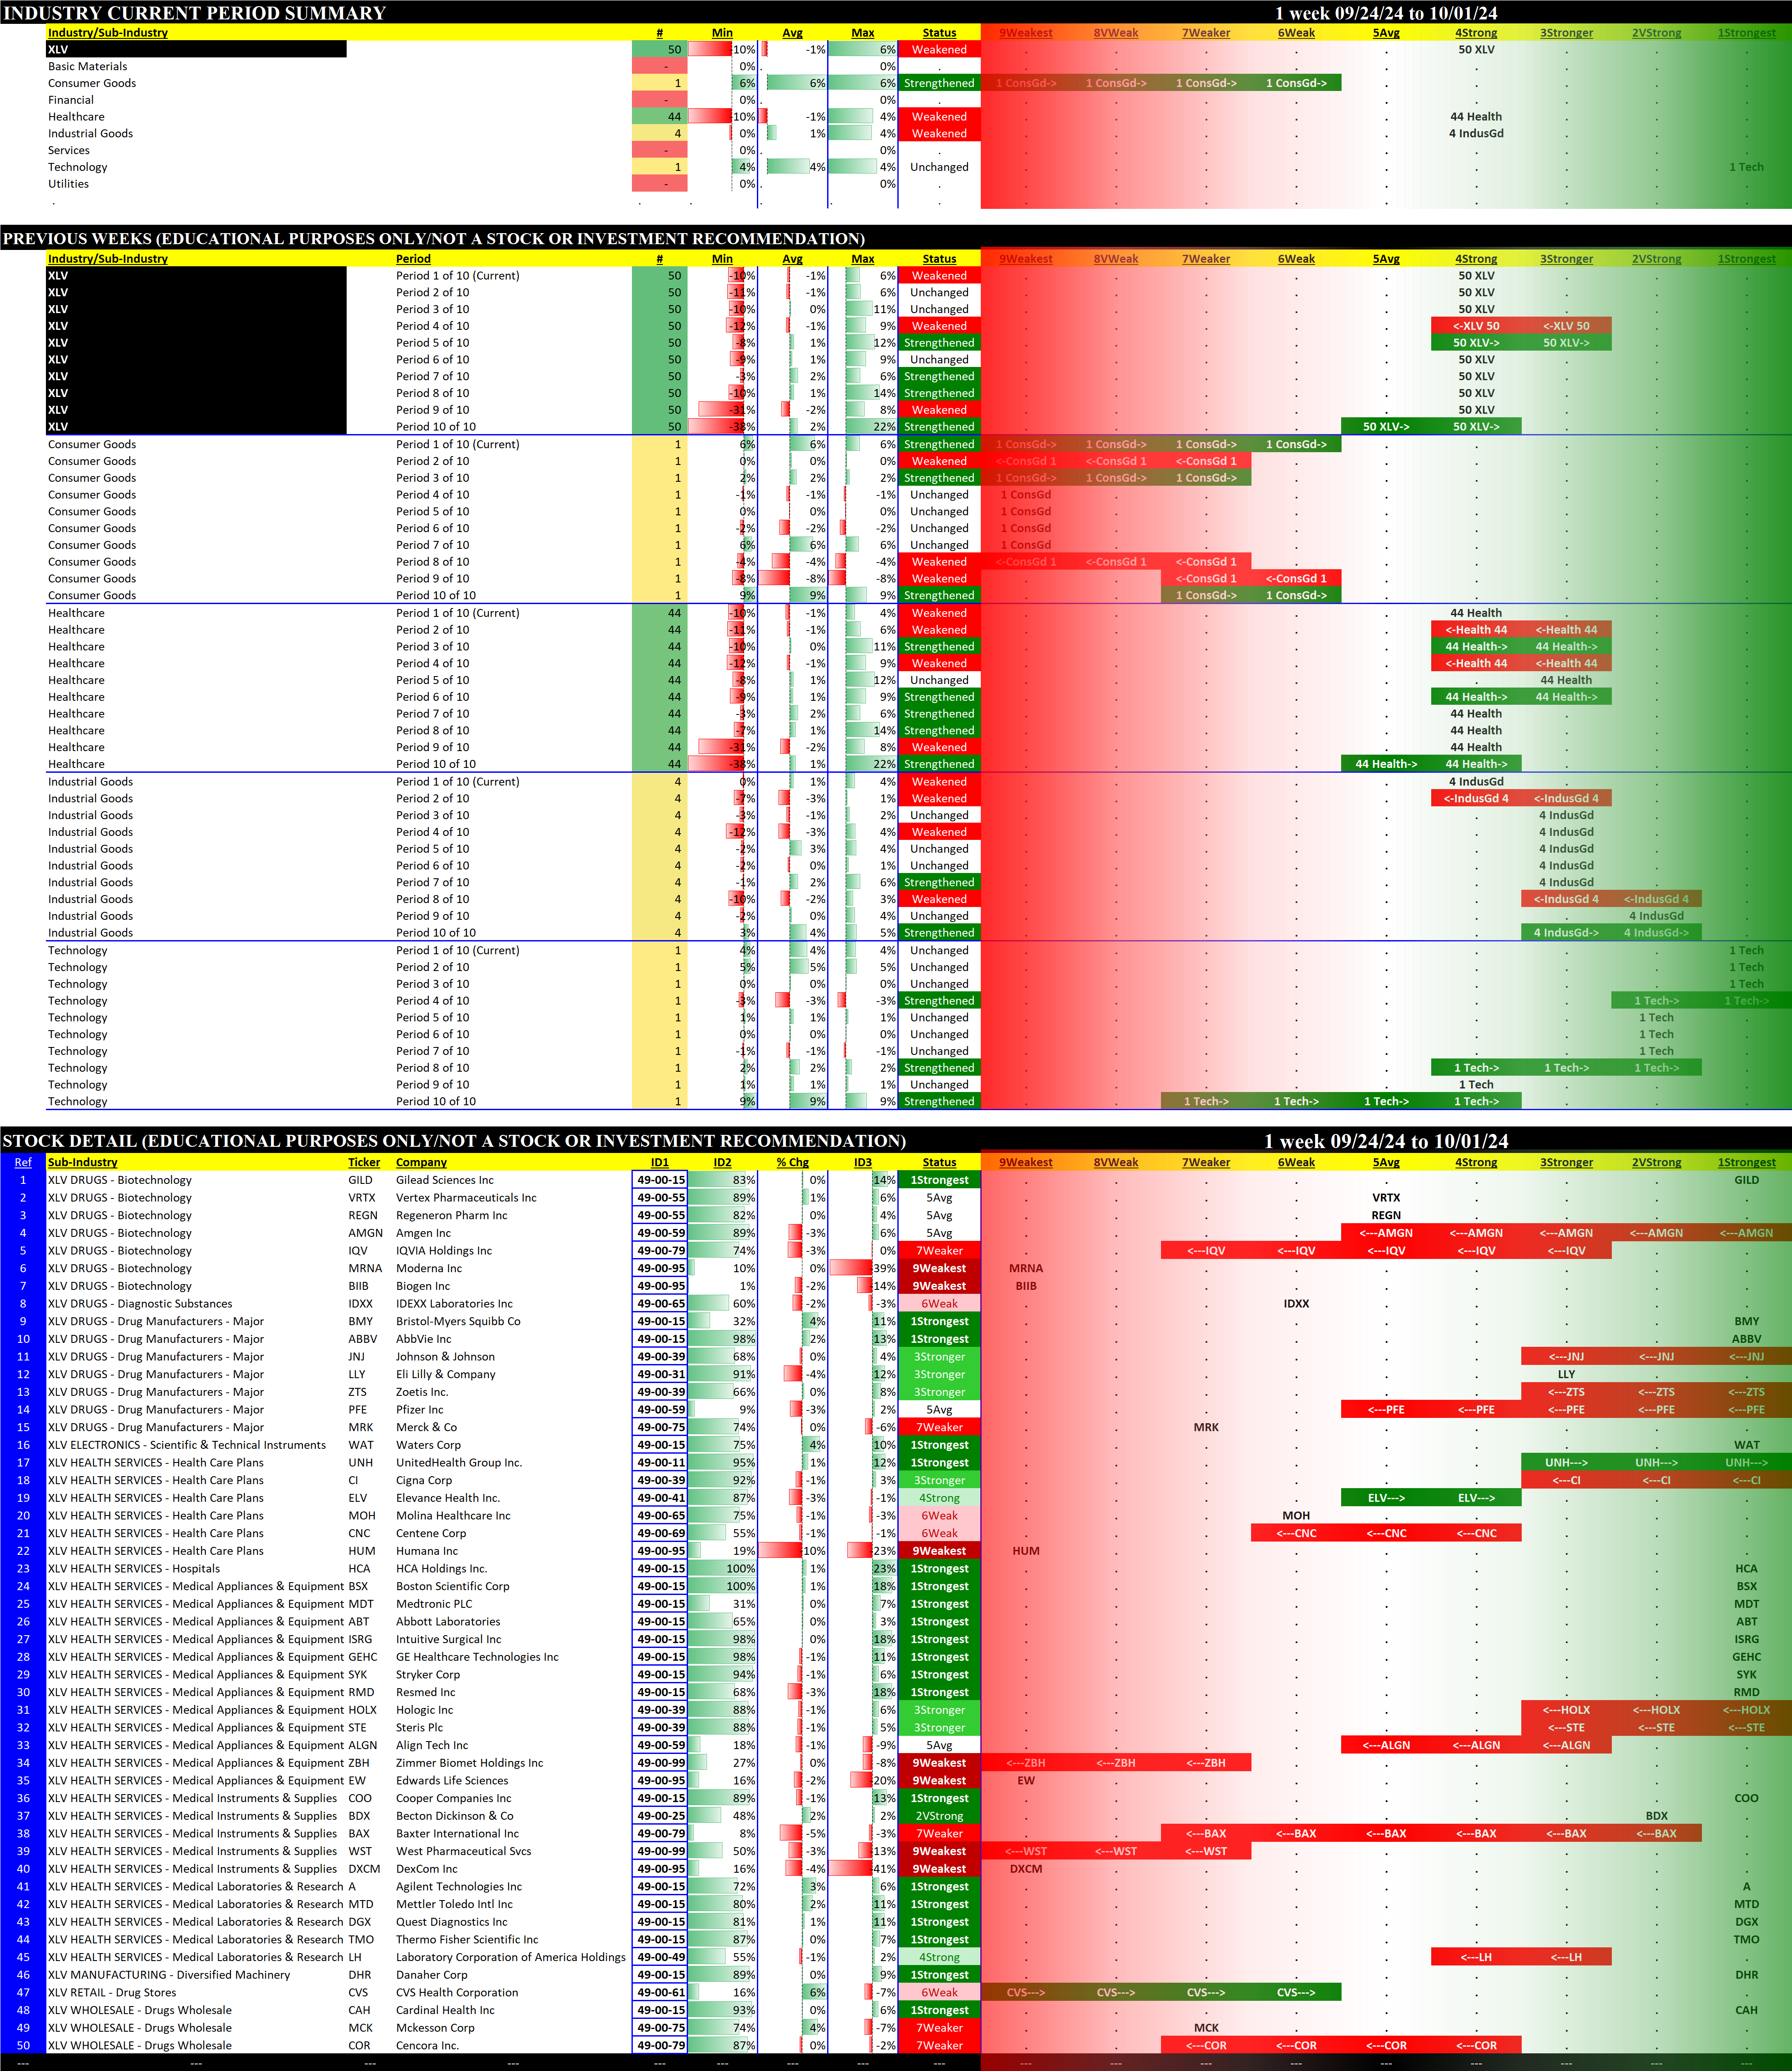
The index includes companies from the following industries: pharmaceuticals; health care equipment & supplies; health care providers & services; biotechnology; life sciences tools & services; and health care technology.
2.9 The Consumer Discretionary Select Sector SPDR Fund (XLY)
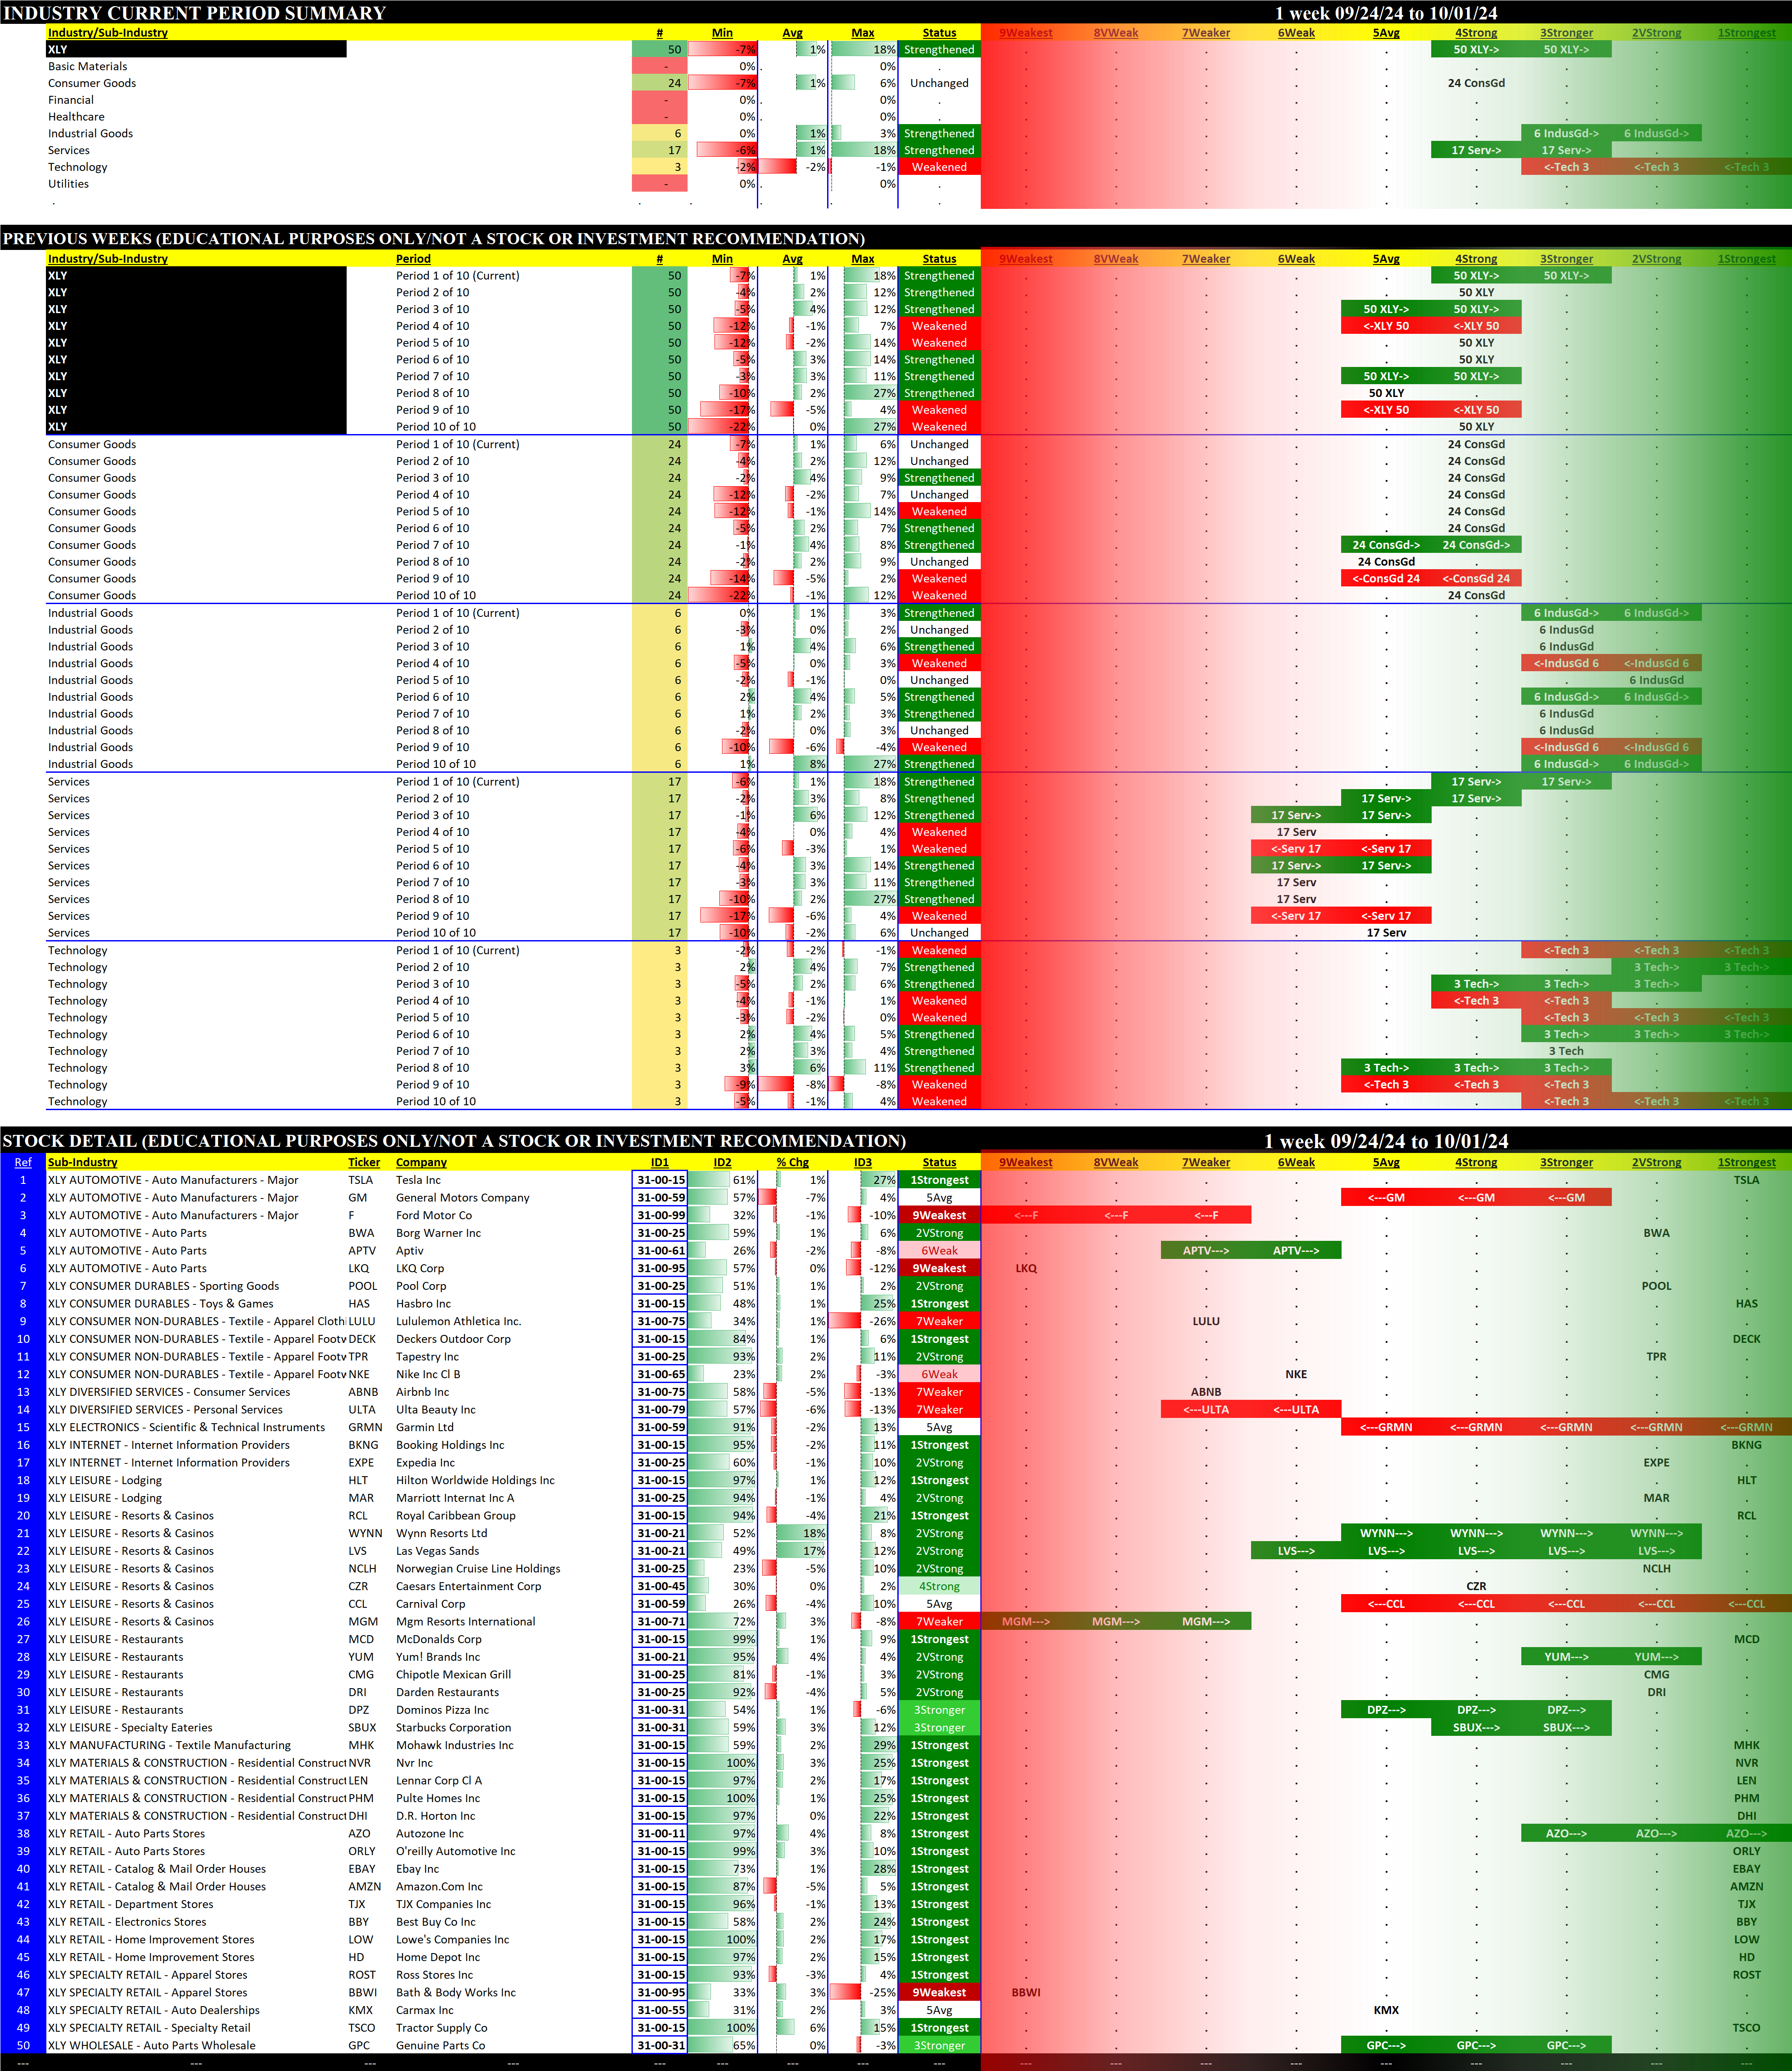
The index includes companies that have been identified as Consumer Discretionary companies by the Global Industry Classification Standard (GICS®).
2.10 SPDR S&P Telecom ETF (XTL)
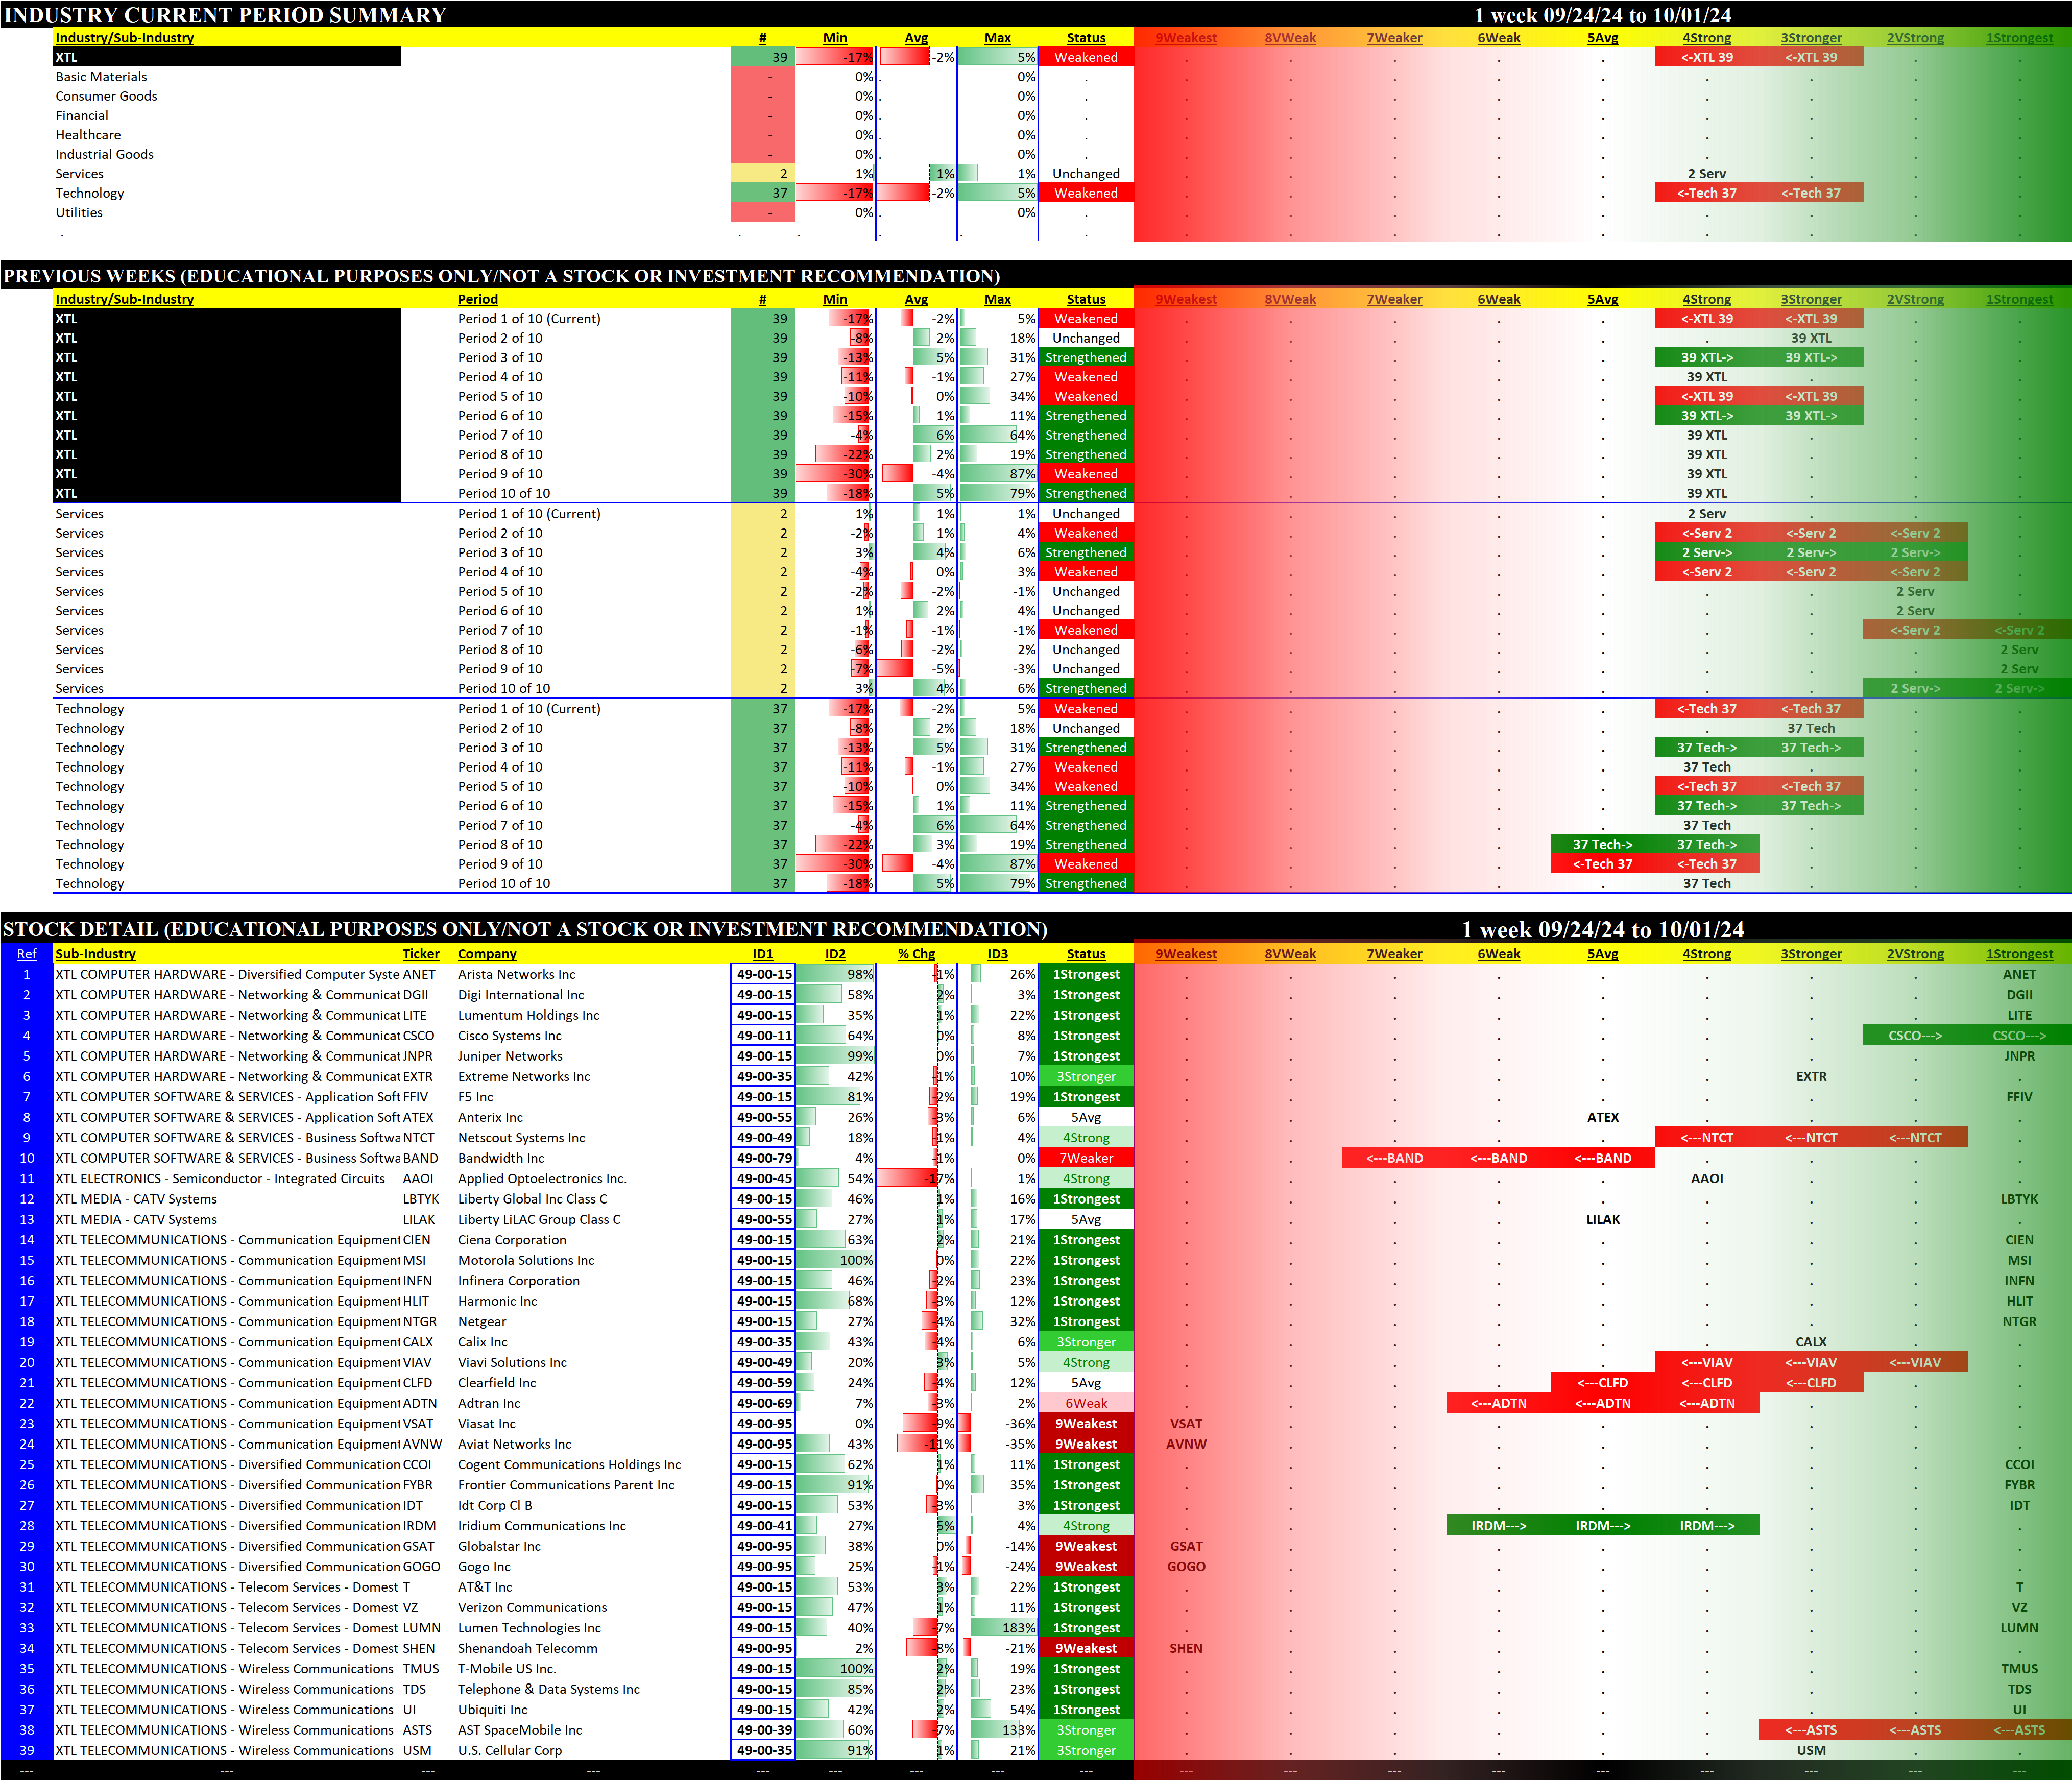
The index represents the telecommunications segment of the S&P Total Market Index ("S&P TMI").
3. Stock Detail
The downloadable report below lists all component stocks in order of first Strongest to Weakest ETF and second Strongest to Weakest Stock. The difference between this report and the 10 ETF stock listings above is this report consolidates all components stocks whereas the above listings are segregated by ETF.