SMO Exclusive: Market Strength Score 2022-10-12 (-93%) vs. 2023-12-29 (+85%)
Are we closer to a U.S. stock market bottom than a top? Perhaps a ridiculous question given the recent rally. Not ridiculous: an objective method to answer that question in any market environment.
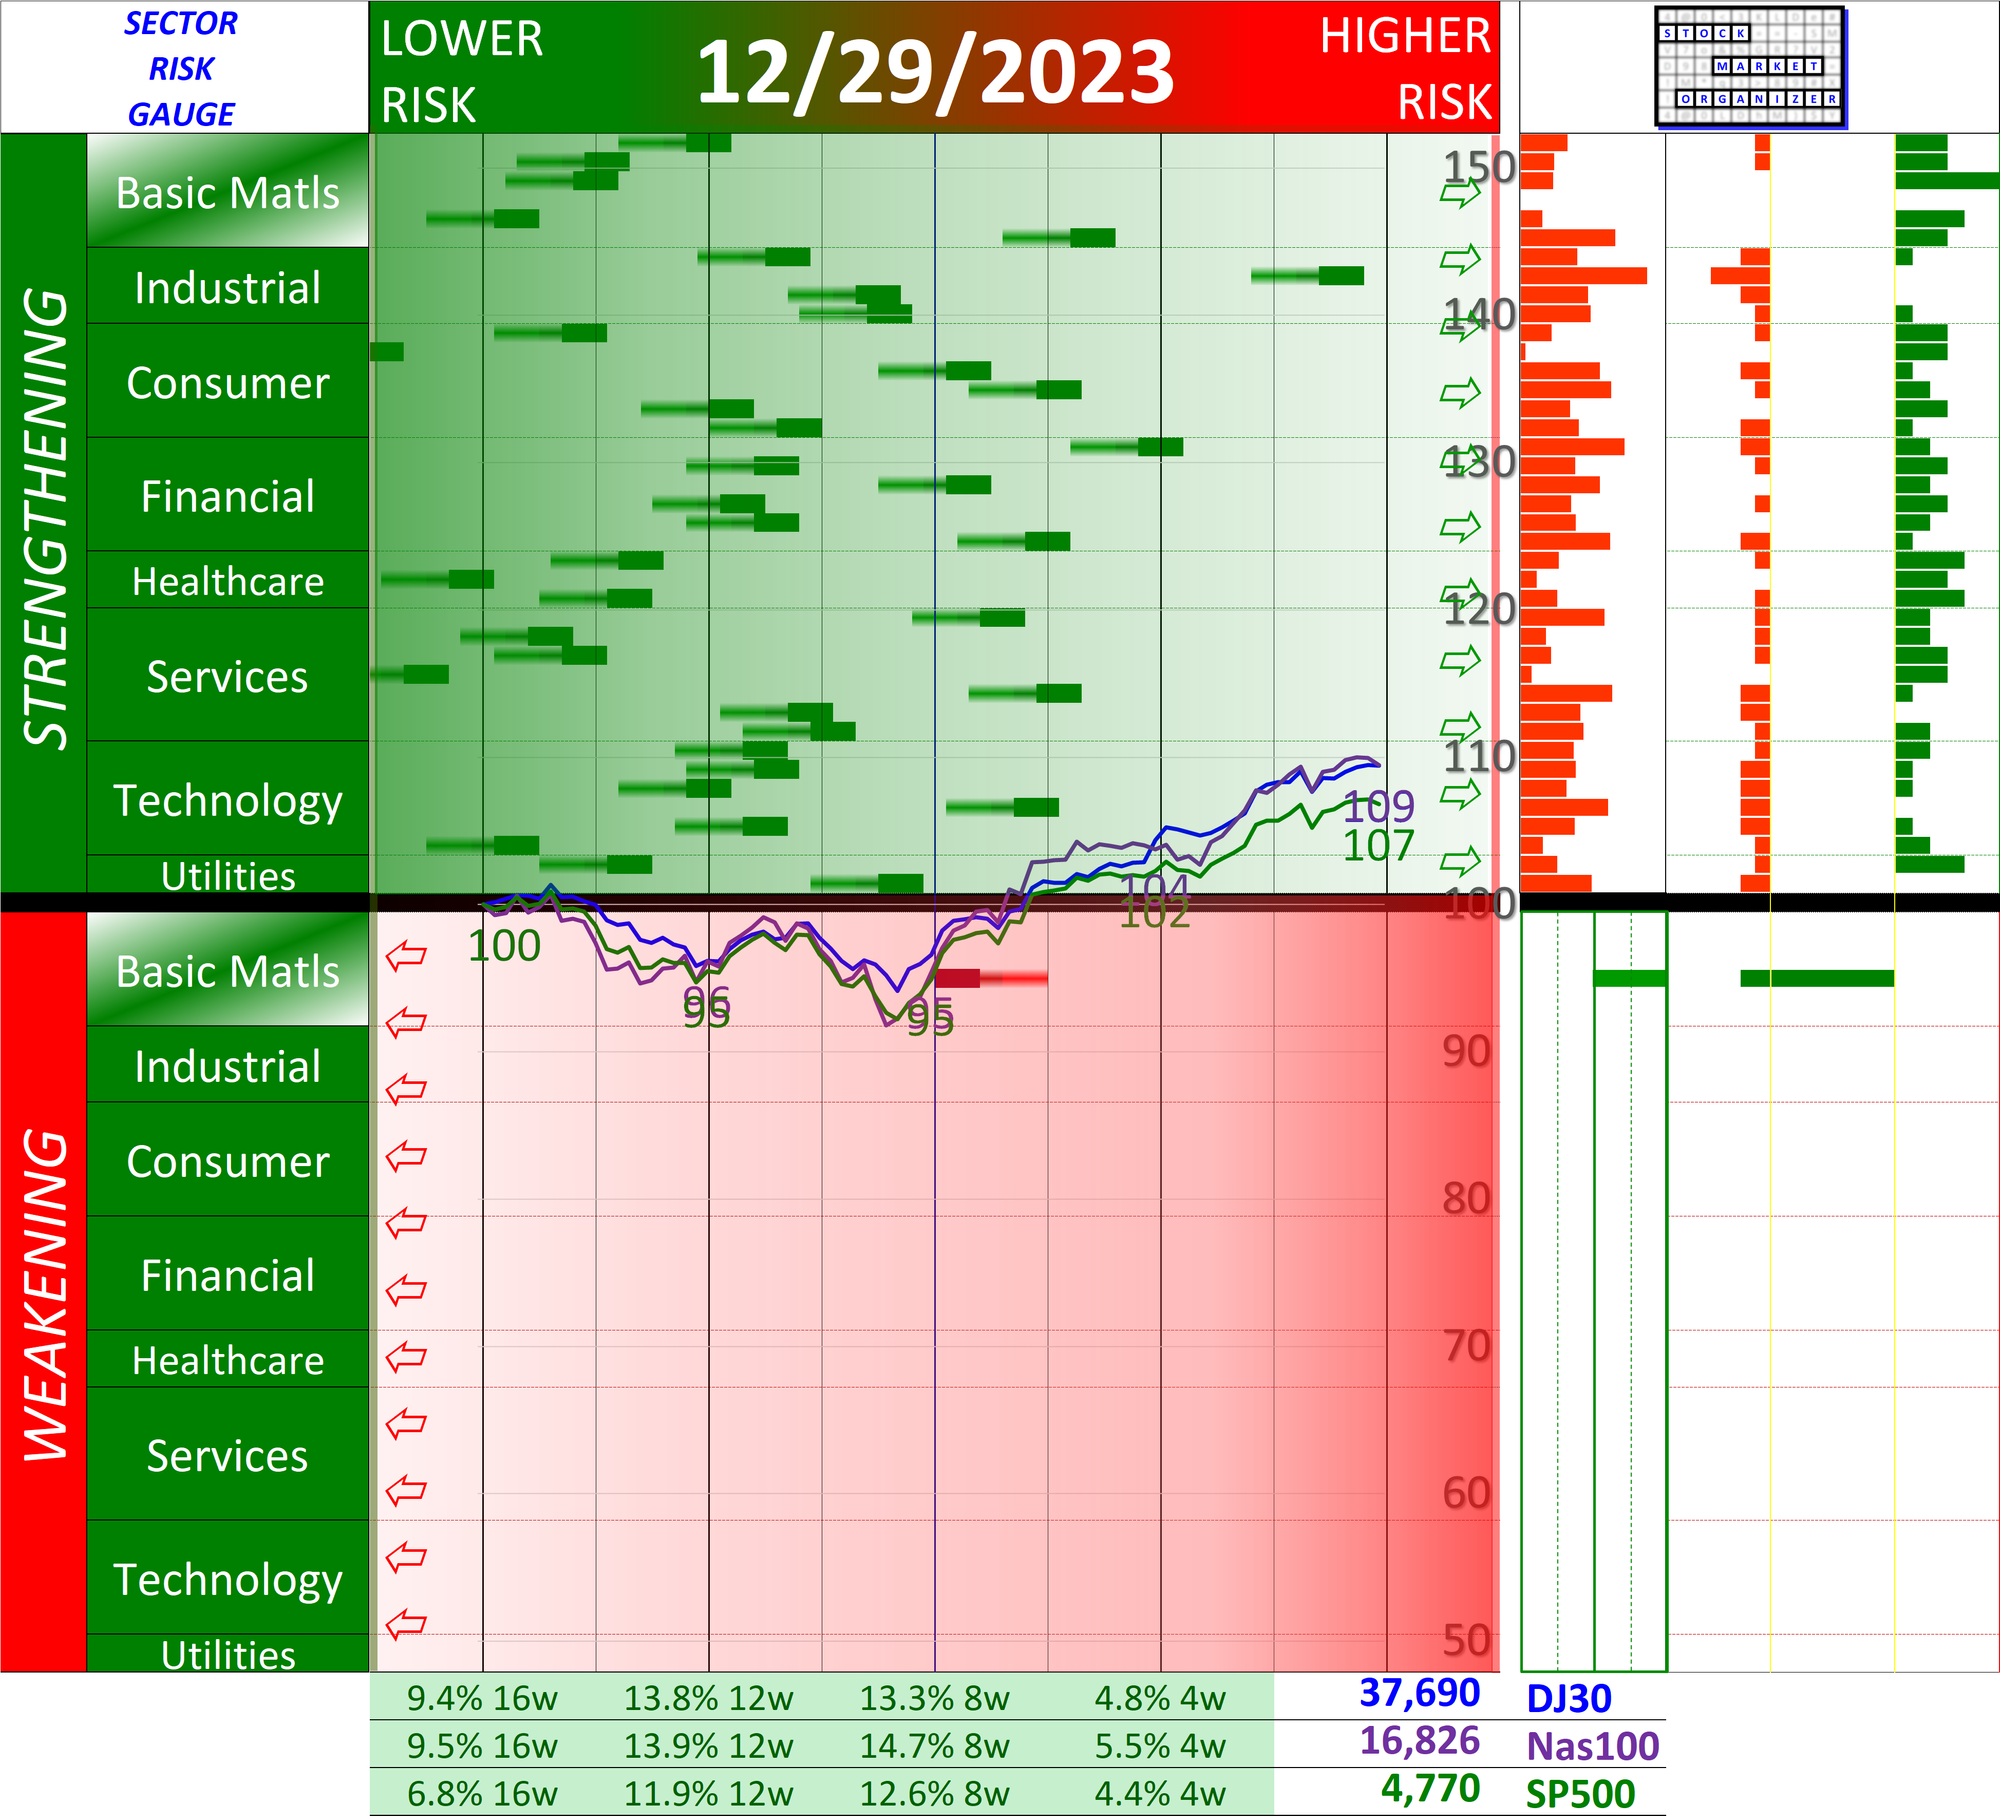
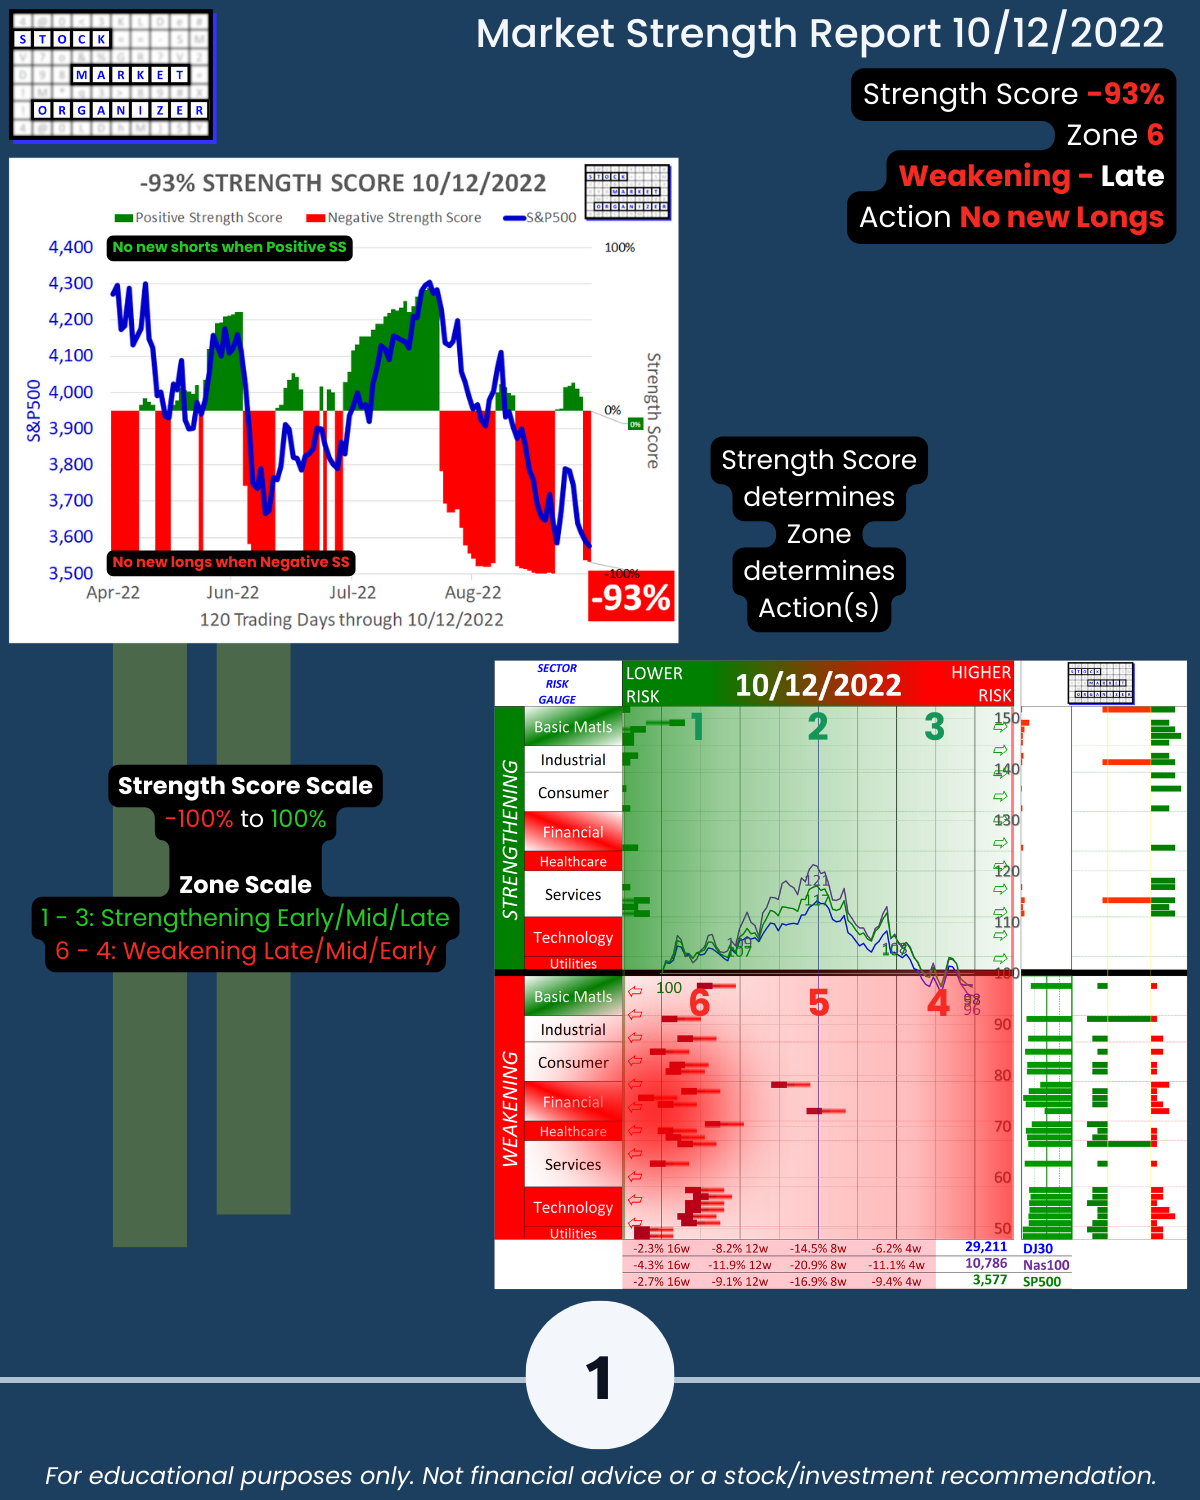
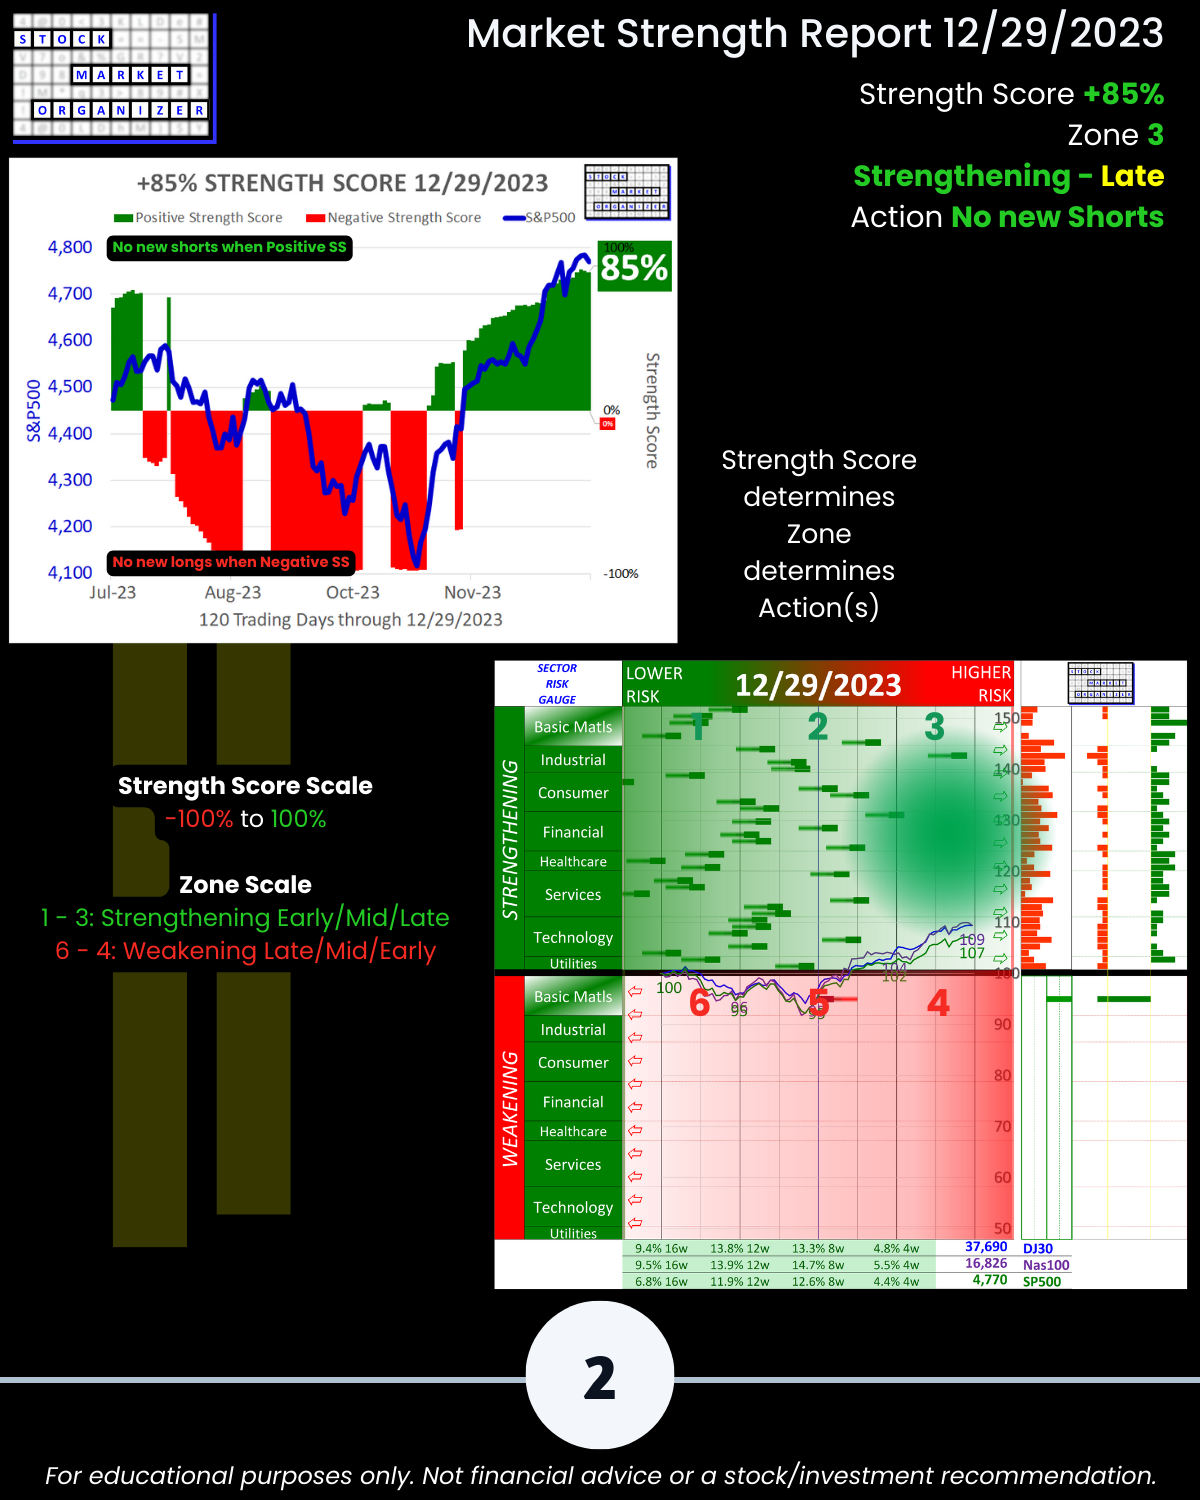
See below graphics showing the 10/12/22 -93% Market Strength Score (Zone 6, Weakening Late) and the 12/29/23 +85% score (Zone 3, Strengthening Late). (10/12/22 was the market low post Covid-recovery).
The October 12, 2022 reading provides context for the current reading.
Here's another relevant Strength Score post that illustrates the value of this analysis.
Current market status
🔹 Strength Score: +85% (scale -100% to 100%)
🔹 Zone: 3, Strengthening – Late
🔹 Action(s): No new Shorts
There is never any telling how long the prevailing positive or negative strength score will last.
All it does is tell you what is. Never a why, or for how long.
That’s all it can do. But this is enough to
🔹 crush market confusion and emotion,
🔹 enforce discipline, and
🔹 prevent unforced errors.
From here, the rest is up to you.