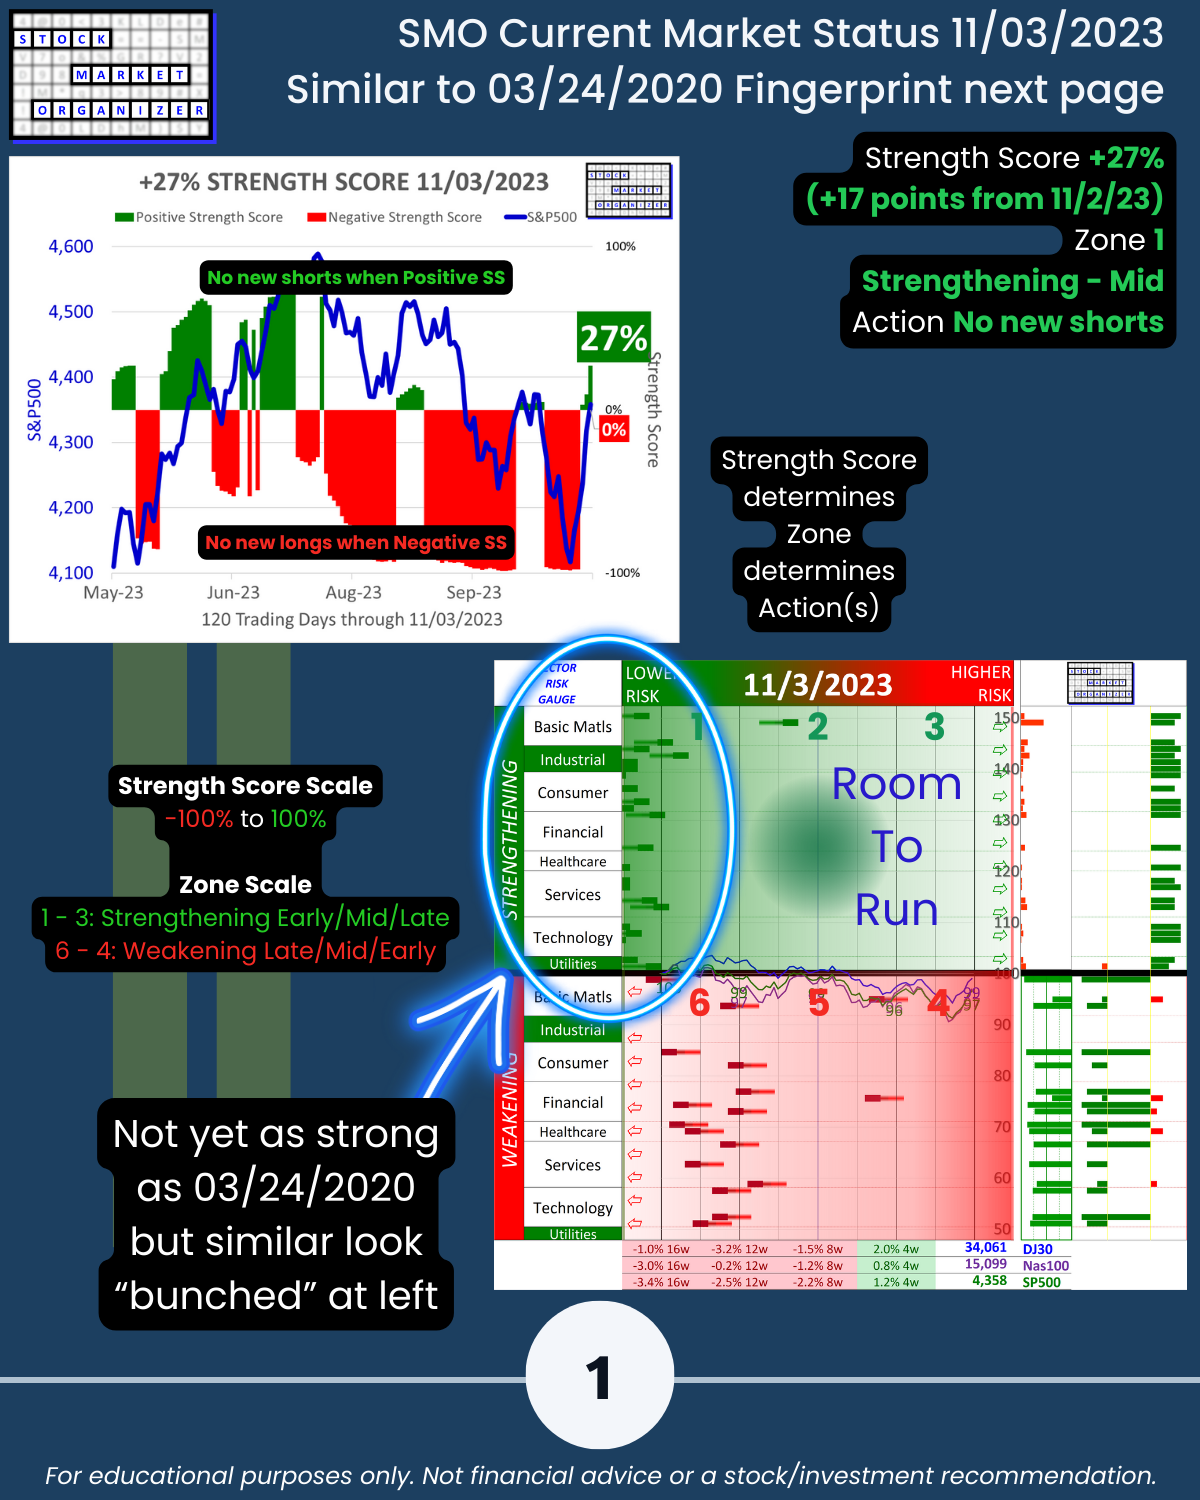
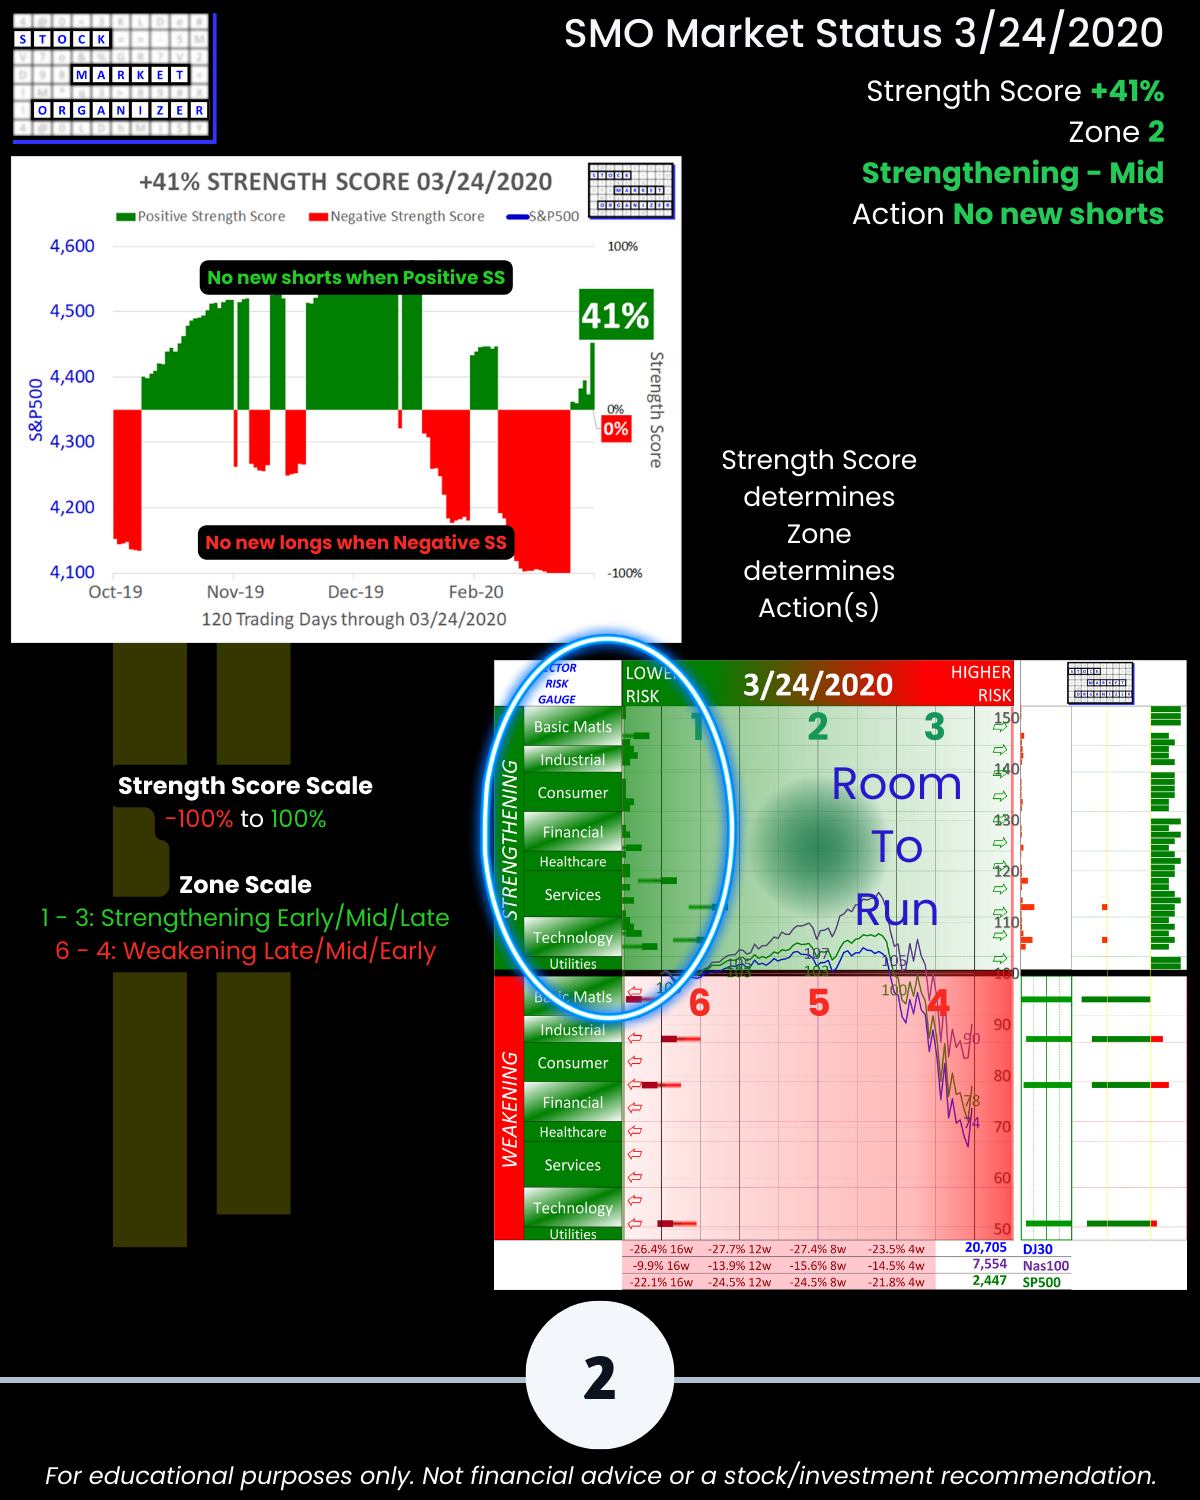
SMO Exclusive: Current Market Status Report 2023-11-03 (+27% Strength Score, Zone 2) fingerprint vs 2020-03-24
Does the 11/03/2023 market have the same “fingerprint” as 3/24/2020 – the first day after the COVID-shutdown 3/23/2020 bottom? It objectively does. This does not guarantee a rally now similar to what happened then, but the objective observer acts based on what is and not what should be. Conditions are conditions, and the “why” does not matter. If/when one knows the “why” it is too late and is therefore meaningless.
Current Market Status
🔹 Strength Score: +27% (on a scale of -100% to 100%) – a one-day increase of 17 points from 11/2/23
🔹 Zone: 2, Strengthening - Mid
🔹 Action(s): No new shorts
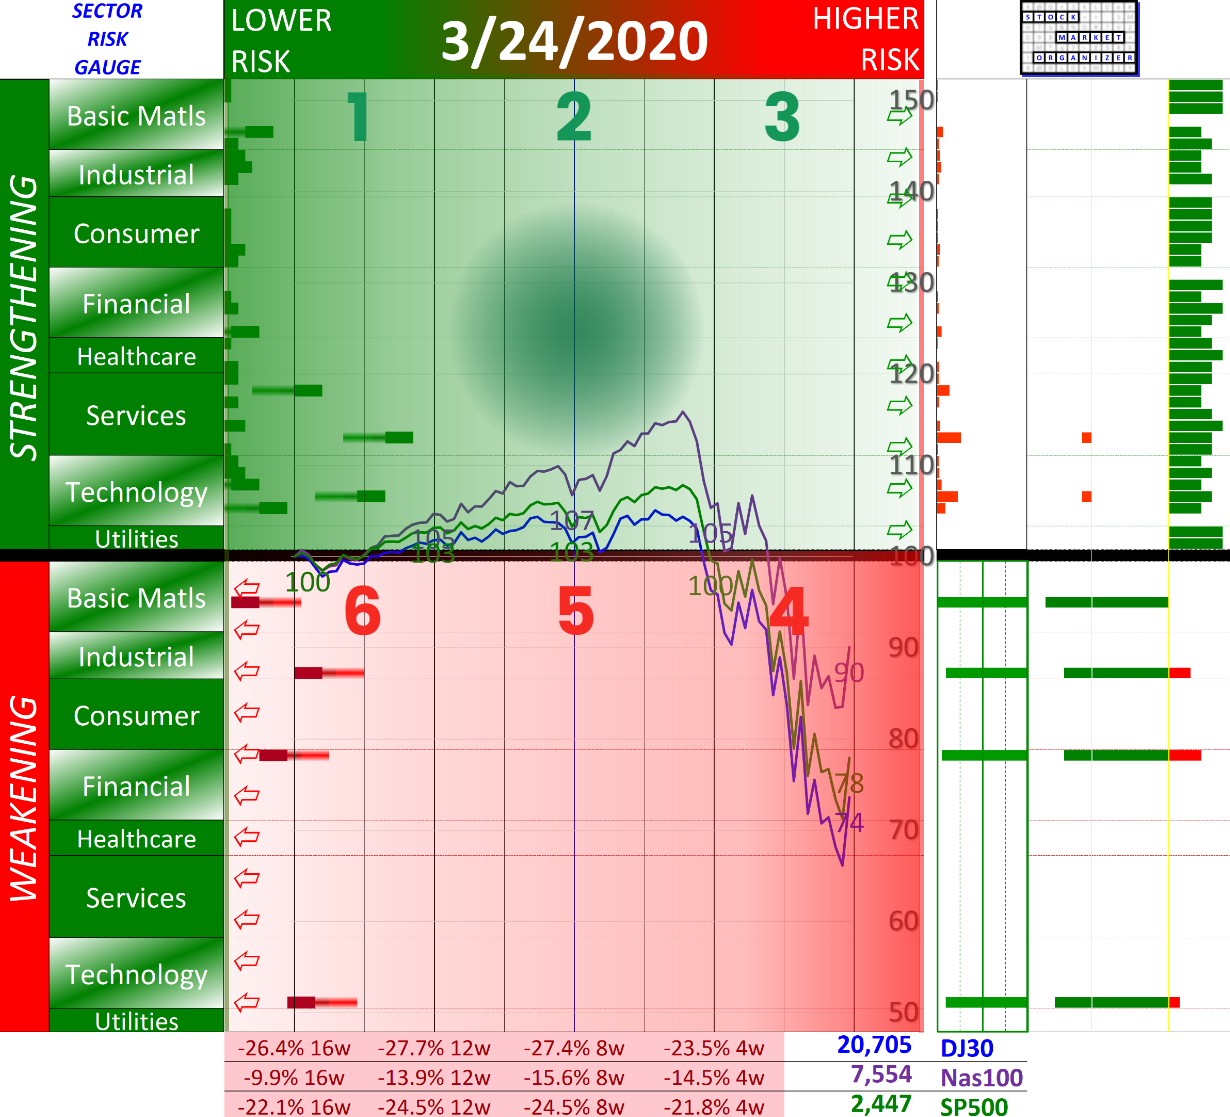
Sector Risk Gauge 11/03/2023
Sector Risk Gauge 3/24/2020
The Journey of a Thousand Miles...
The first step in a multi-week rally is one up week. The first step to 10%+ returns is a 1% return.
Moves of meaning last. Obviously this could fail as early as tomorrow or soon thereafter but the 11/3/23 Sector Risk Gauge “fingerprint” shows the possibility that there could be plenty more to come should the individual sector markers continue to move rightward, reflecting continued strength, from their current far-leftward positions.
There is never any guarantee that a first step forward/up will lead to more – but measuring such steps is key to awareness and then practical action.