SMO Exclusive: 2024-12-20 SP500 5Average (Weakened Rating), NDX 5Average (Weakened Rating)
Background
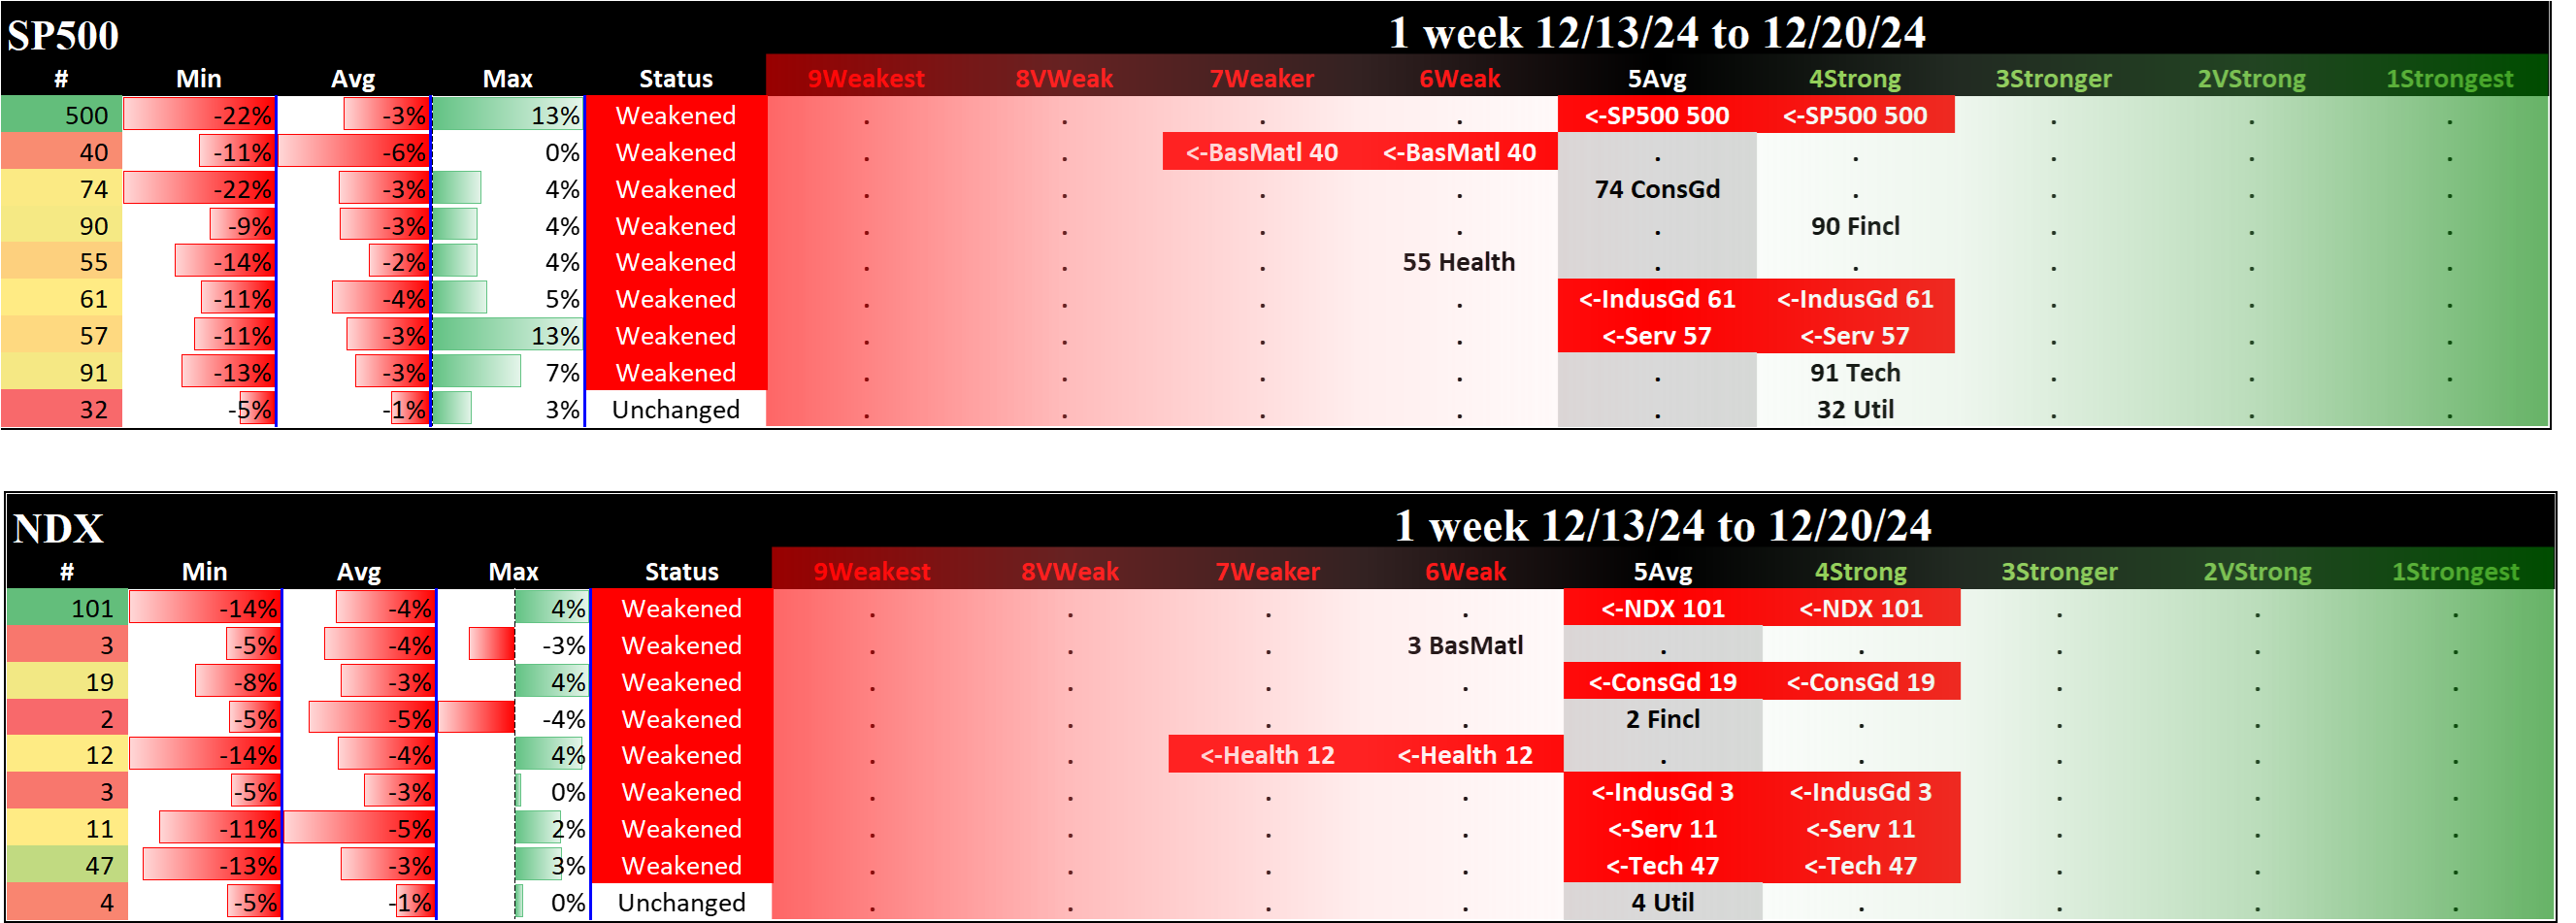
This analysis provides a Stock Market Organizer summary view of the S&P 500 and Nasdaq 100 for the week ended Friday, 12/20/24. This means this is a stock-by-stock strength analysis of the component stocks for each index, aggregated upward in level to the sector and index levels.
This purposely excludes the Dow Industrials. This analysis is more impactful the more the stocks analyzed. In turn, I pay minimal attention to the strength scores calculated for the NDX sectors, except for Technology which has 47 stocks.
What do the Pies say?
The two indexes were even more negative last week then the prior week which was also mostly negative.
The S&P 500 has a 0.95:1 and the NDX a 1.1:1 ratio of stocks rated 1Strongest to 9Weakest. These are dramatic drops from last week when both indexes were above 2:1. All stocks in each index rated 1Strongest or 9Weakest are listed in the sections below providing detail for each index.
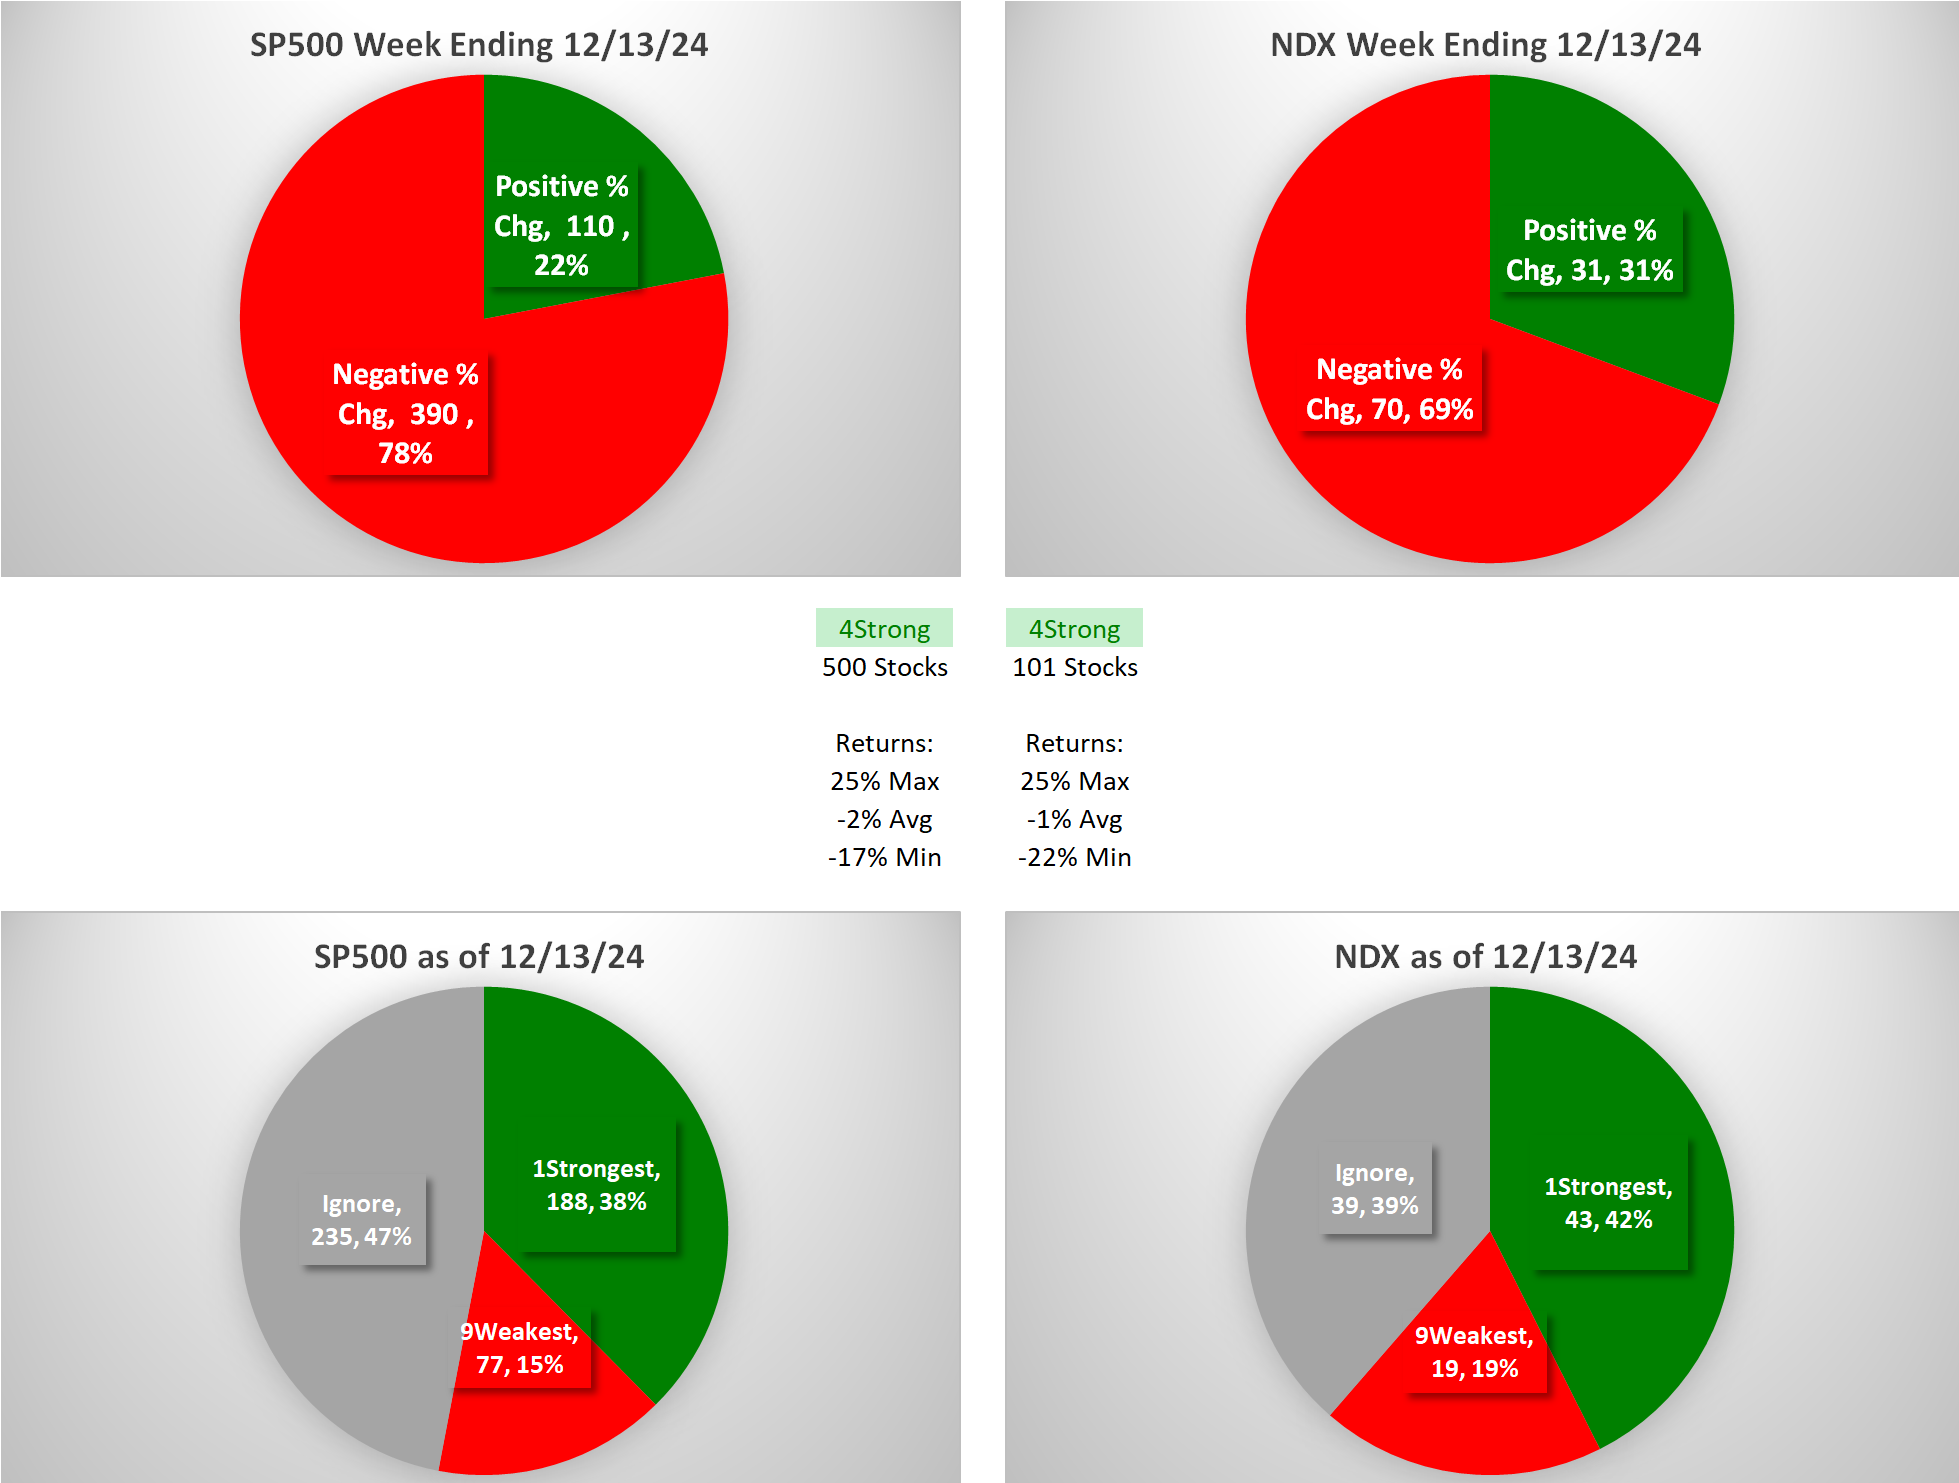
There was clearly deterioration versus last week in both positive and negative stocks and for stocks rated 1Strongest vs. 9Weakest.
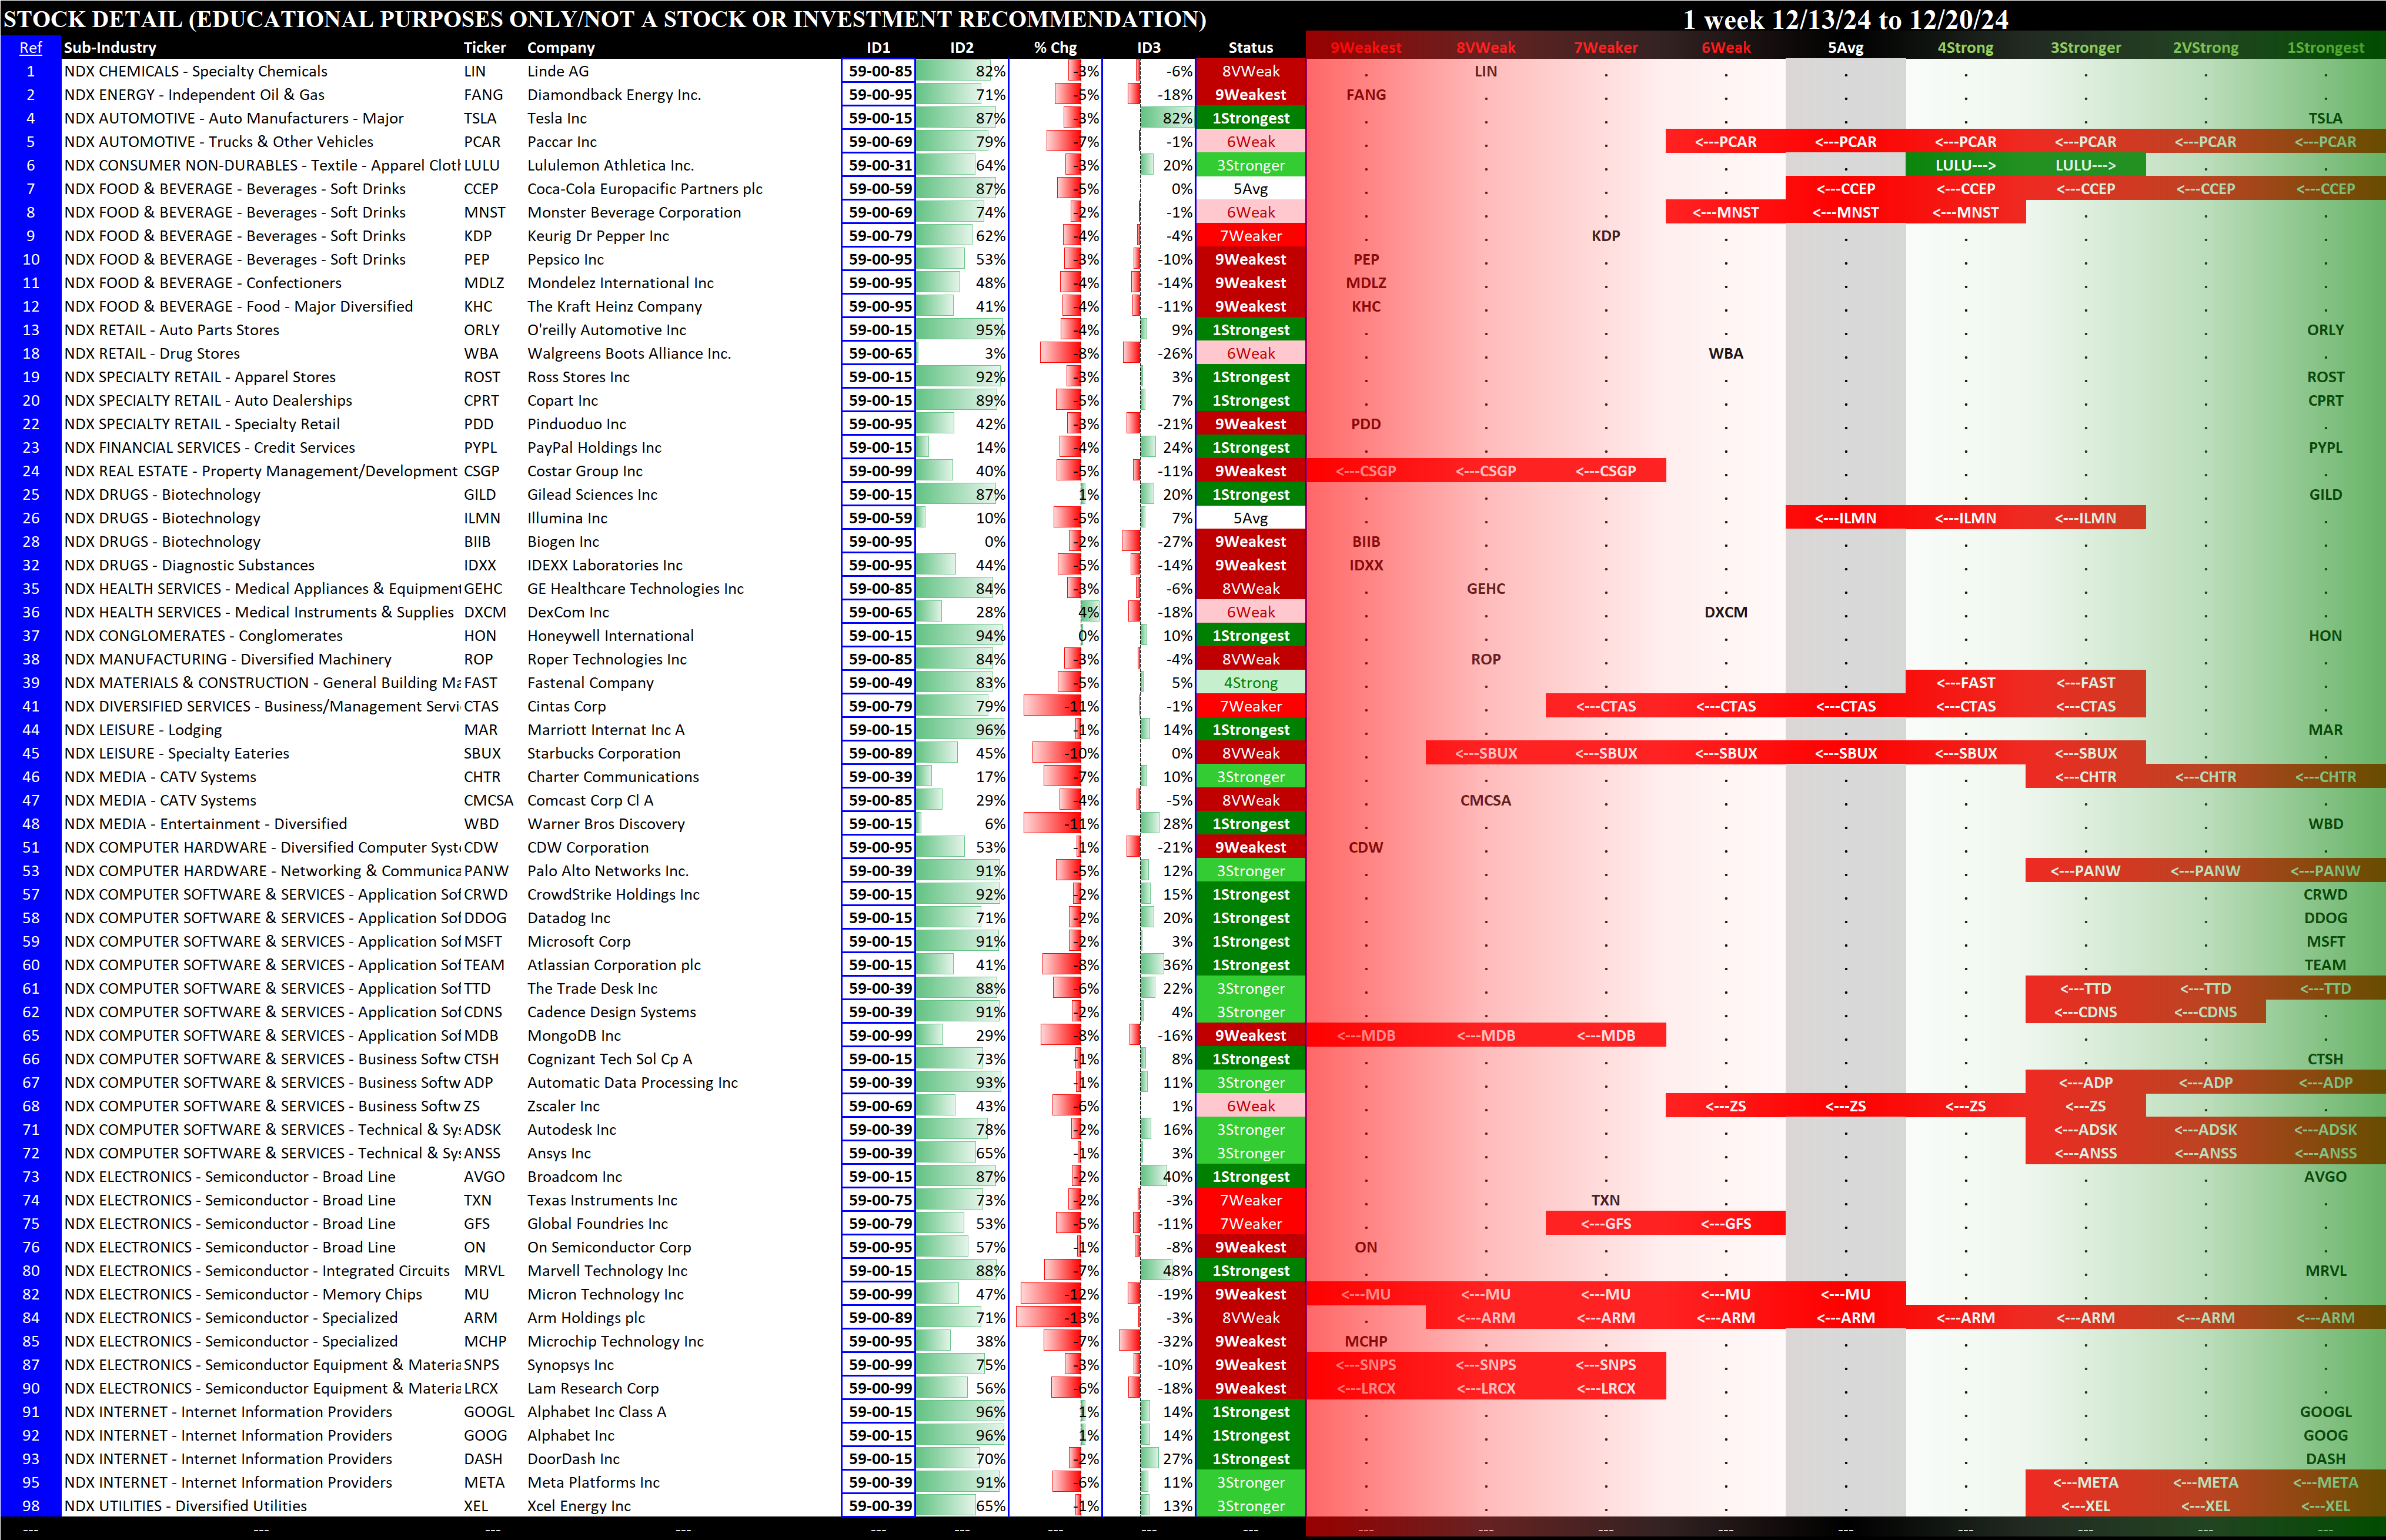
S&P 500 Detail: Component Sectors and 1Strongest / 9Weakest Stocks
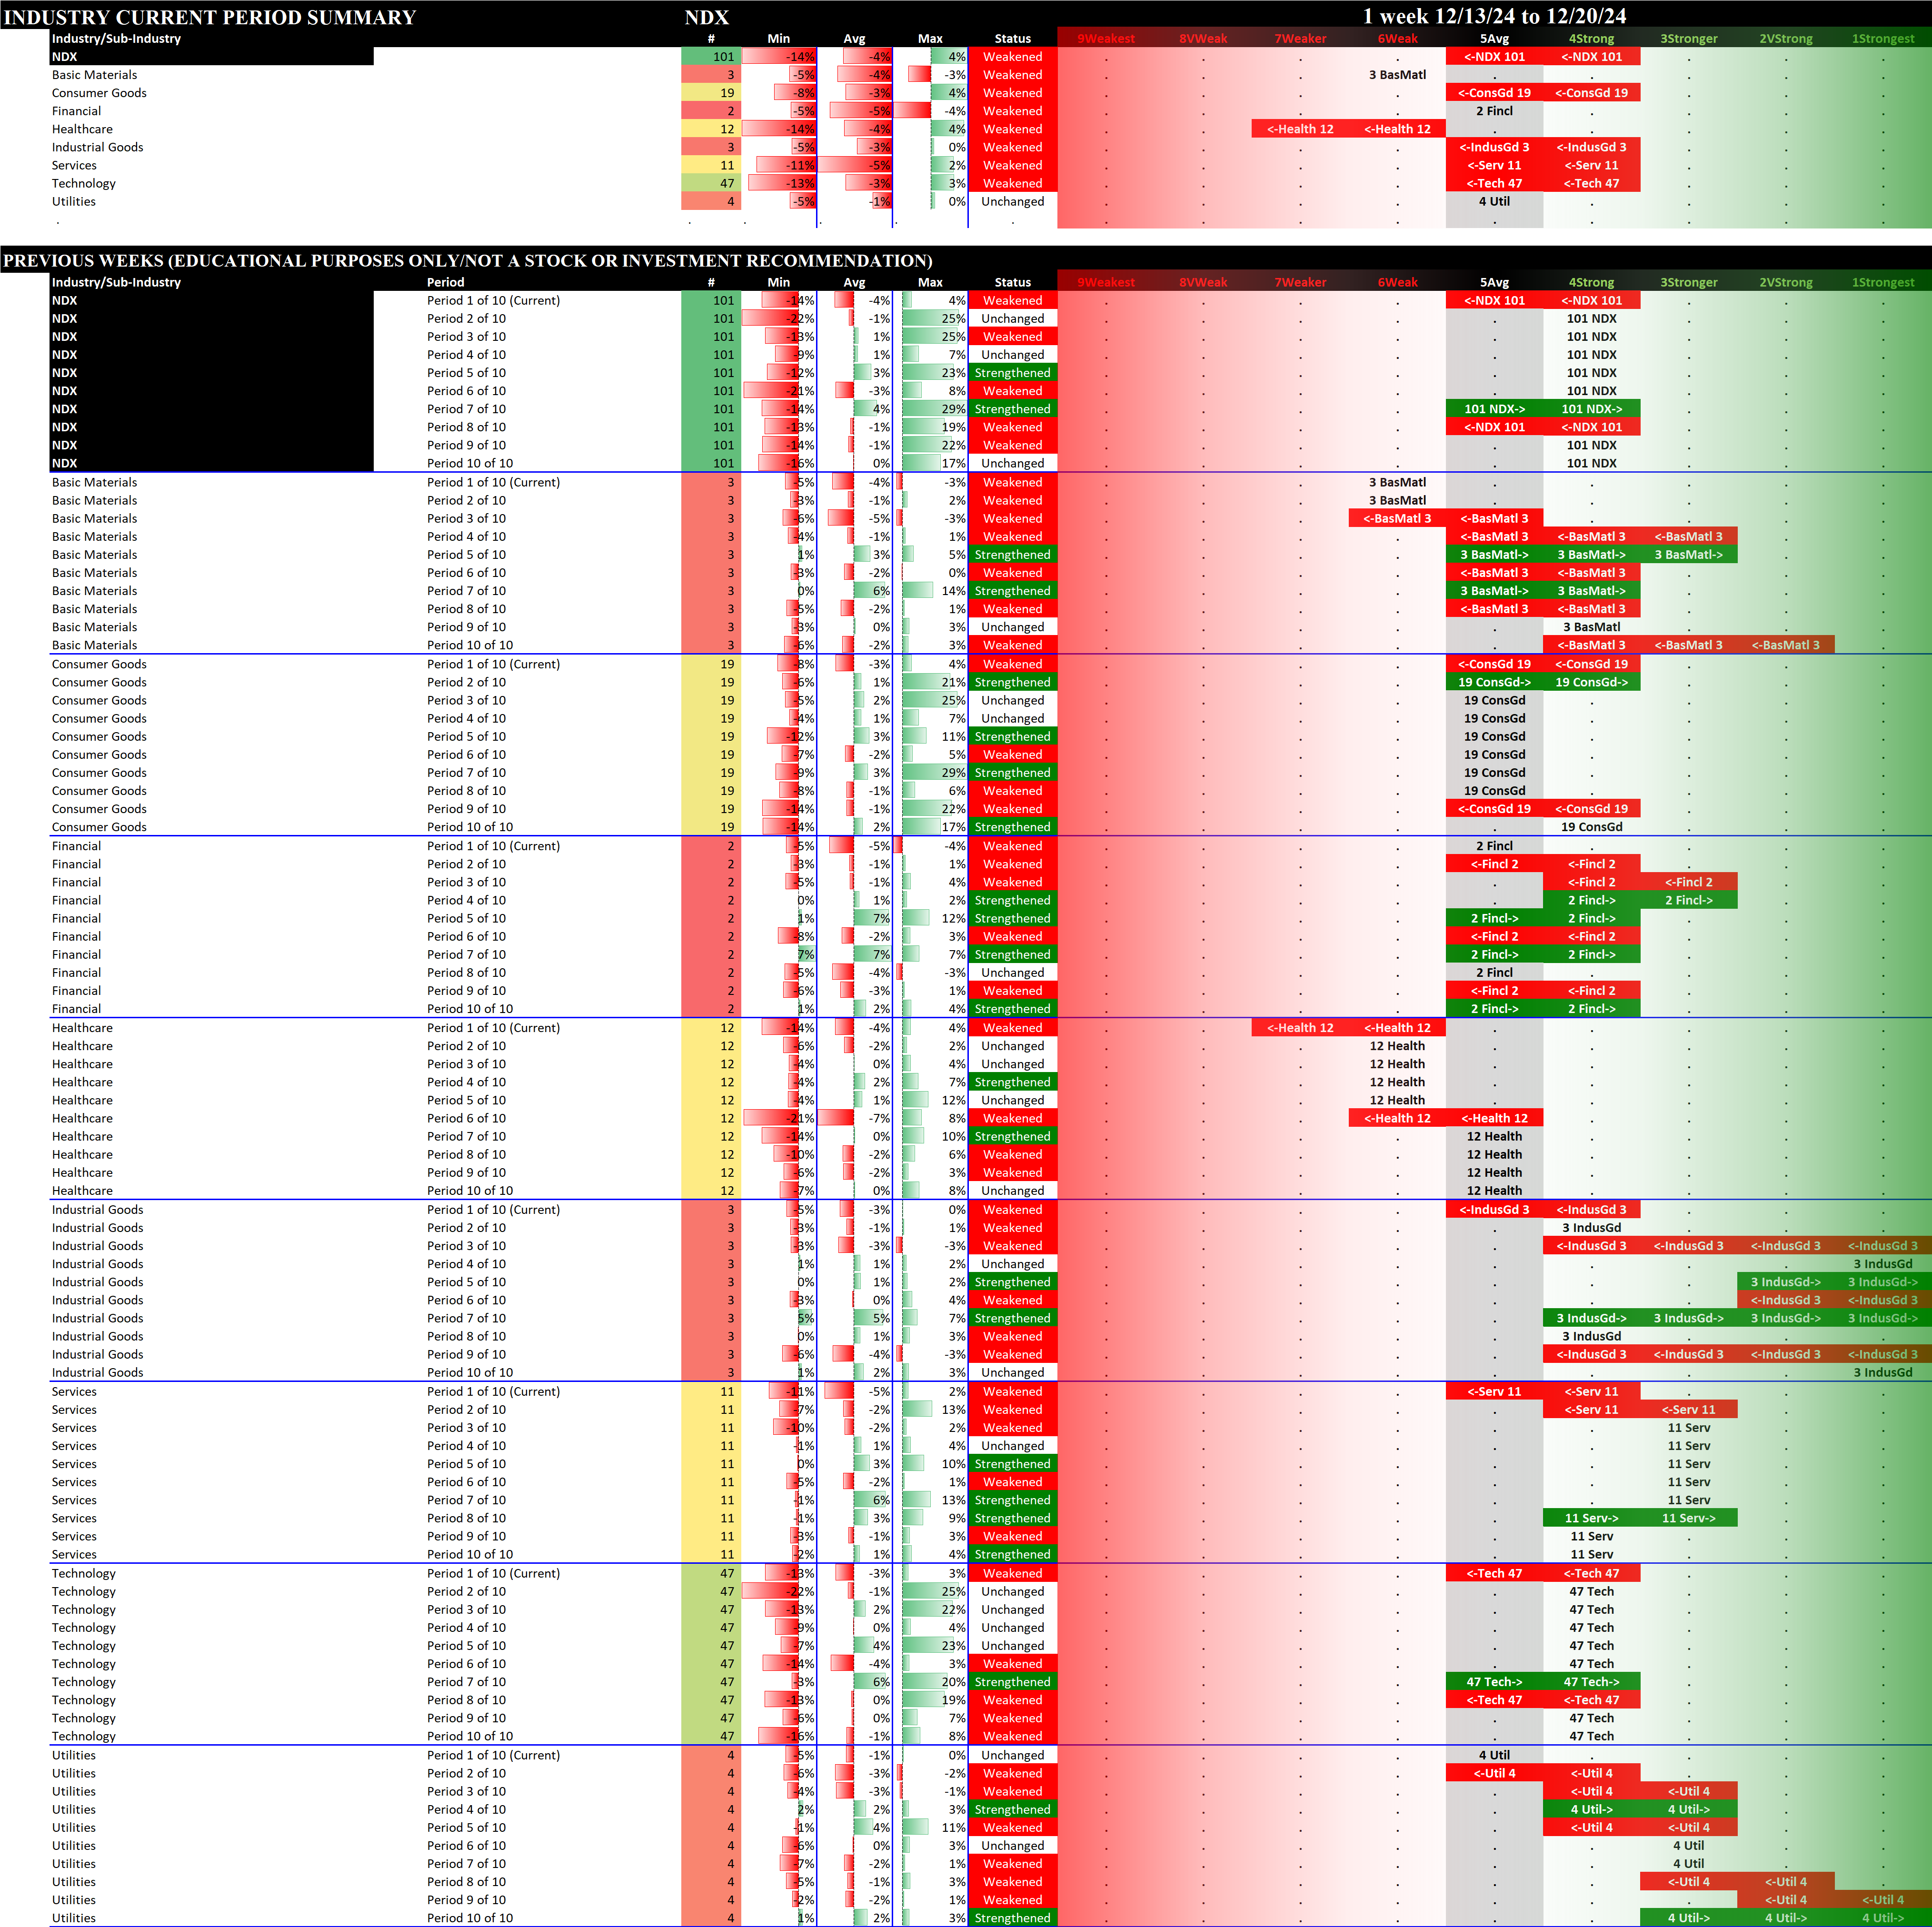
Nasdaq 100: Component Sectors and 1Strongest / 9Weakest Stocks