The Sector Risk Gauge and the "it's time in the market" claim - what bottoms look like (three questions and two graphics)
This post with the three questions and two graphics below is for those who enjoy parroting the claim "it's time in the market not market timing."
Question 1: excluding dividends what was the market return from March 2000 through March 2013? Answer: 0%. Yes - I cherry picked the start date. That doesn't negate the point. And it doesn't reflect that there were two massive declines during this 13-year period that would have sorely tested the most patient of LTB&Hers.
Question 2: since "past performance is not a guarantee of future results," isn't it disingenuous to point to the past performance of a generally rising market to "prove" that "it's time in the market not market timing"? Answer: you know the answer.
Question 3: if the falling interest rate environment of the past four decades is over, should one expect the same market returns enjoyed during that period? Answer: again, you know the answer.
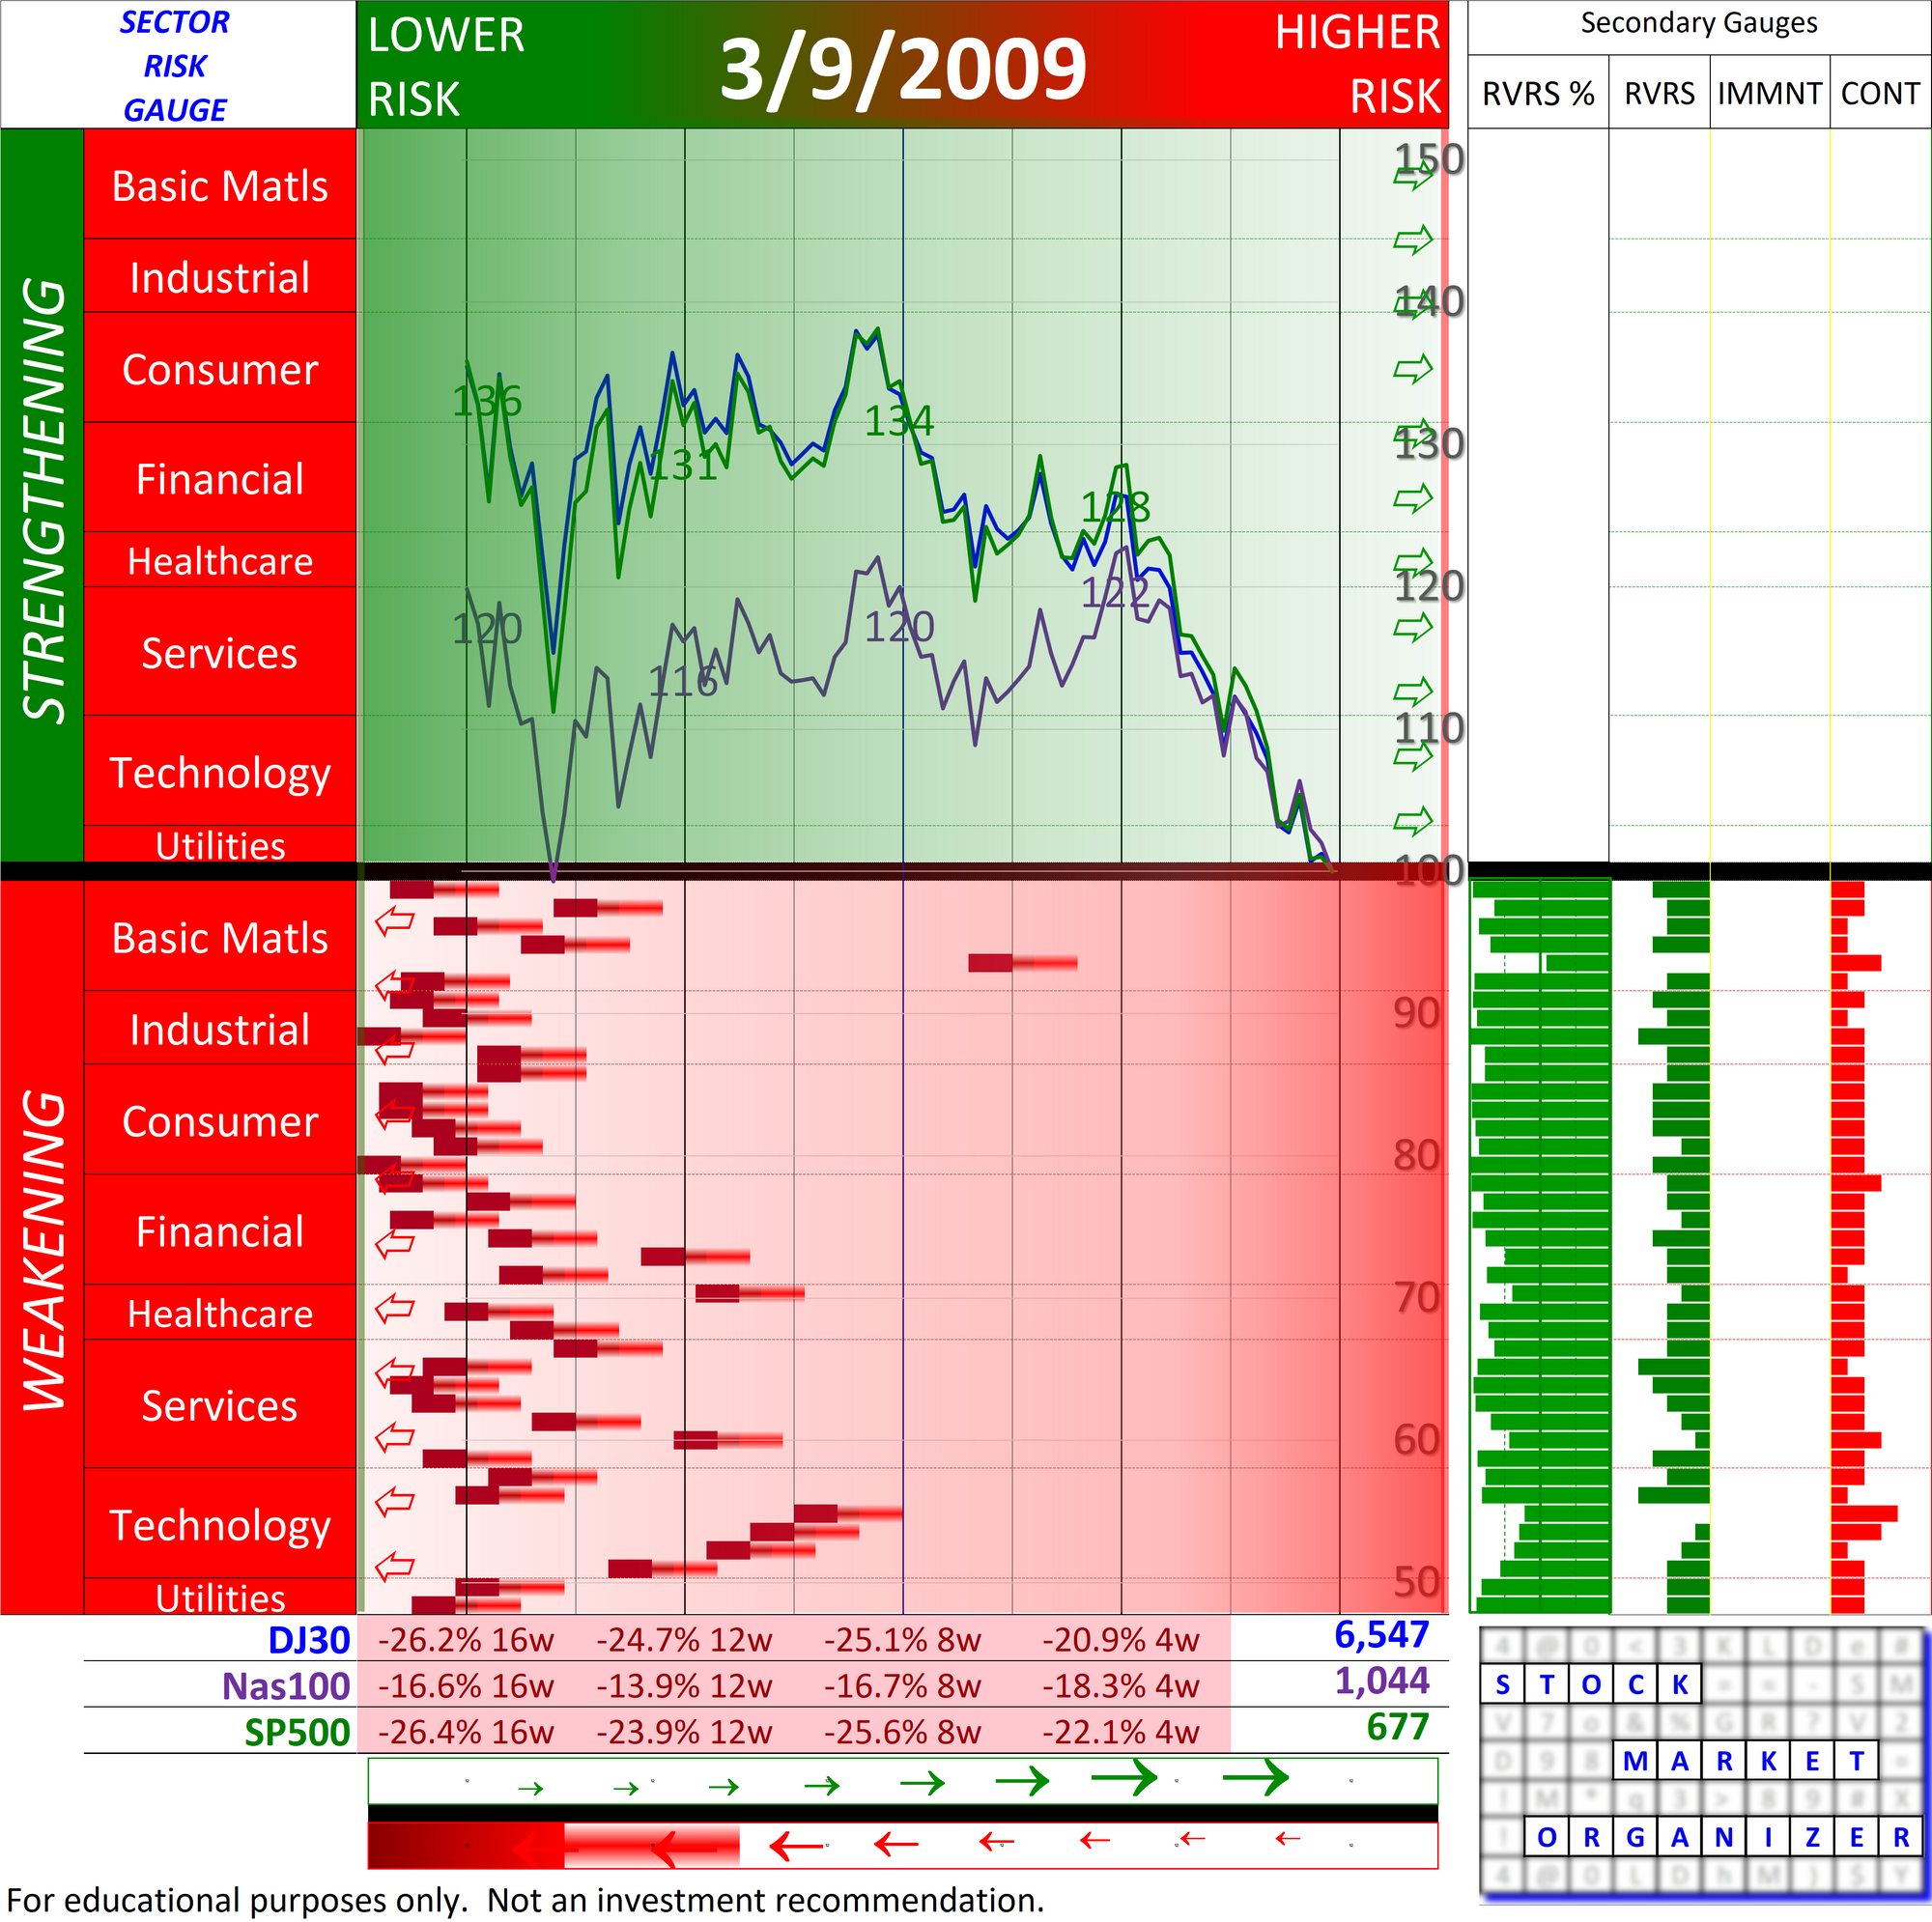
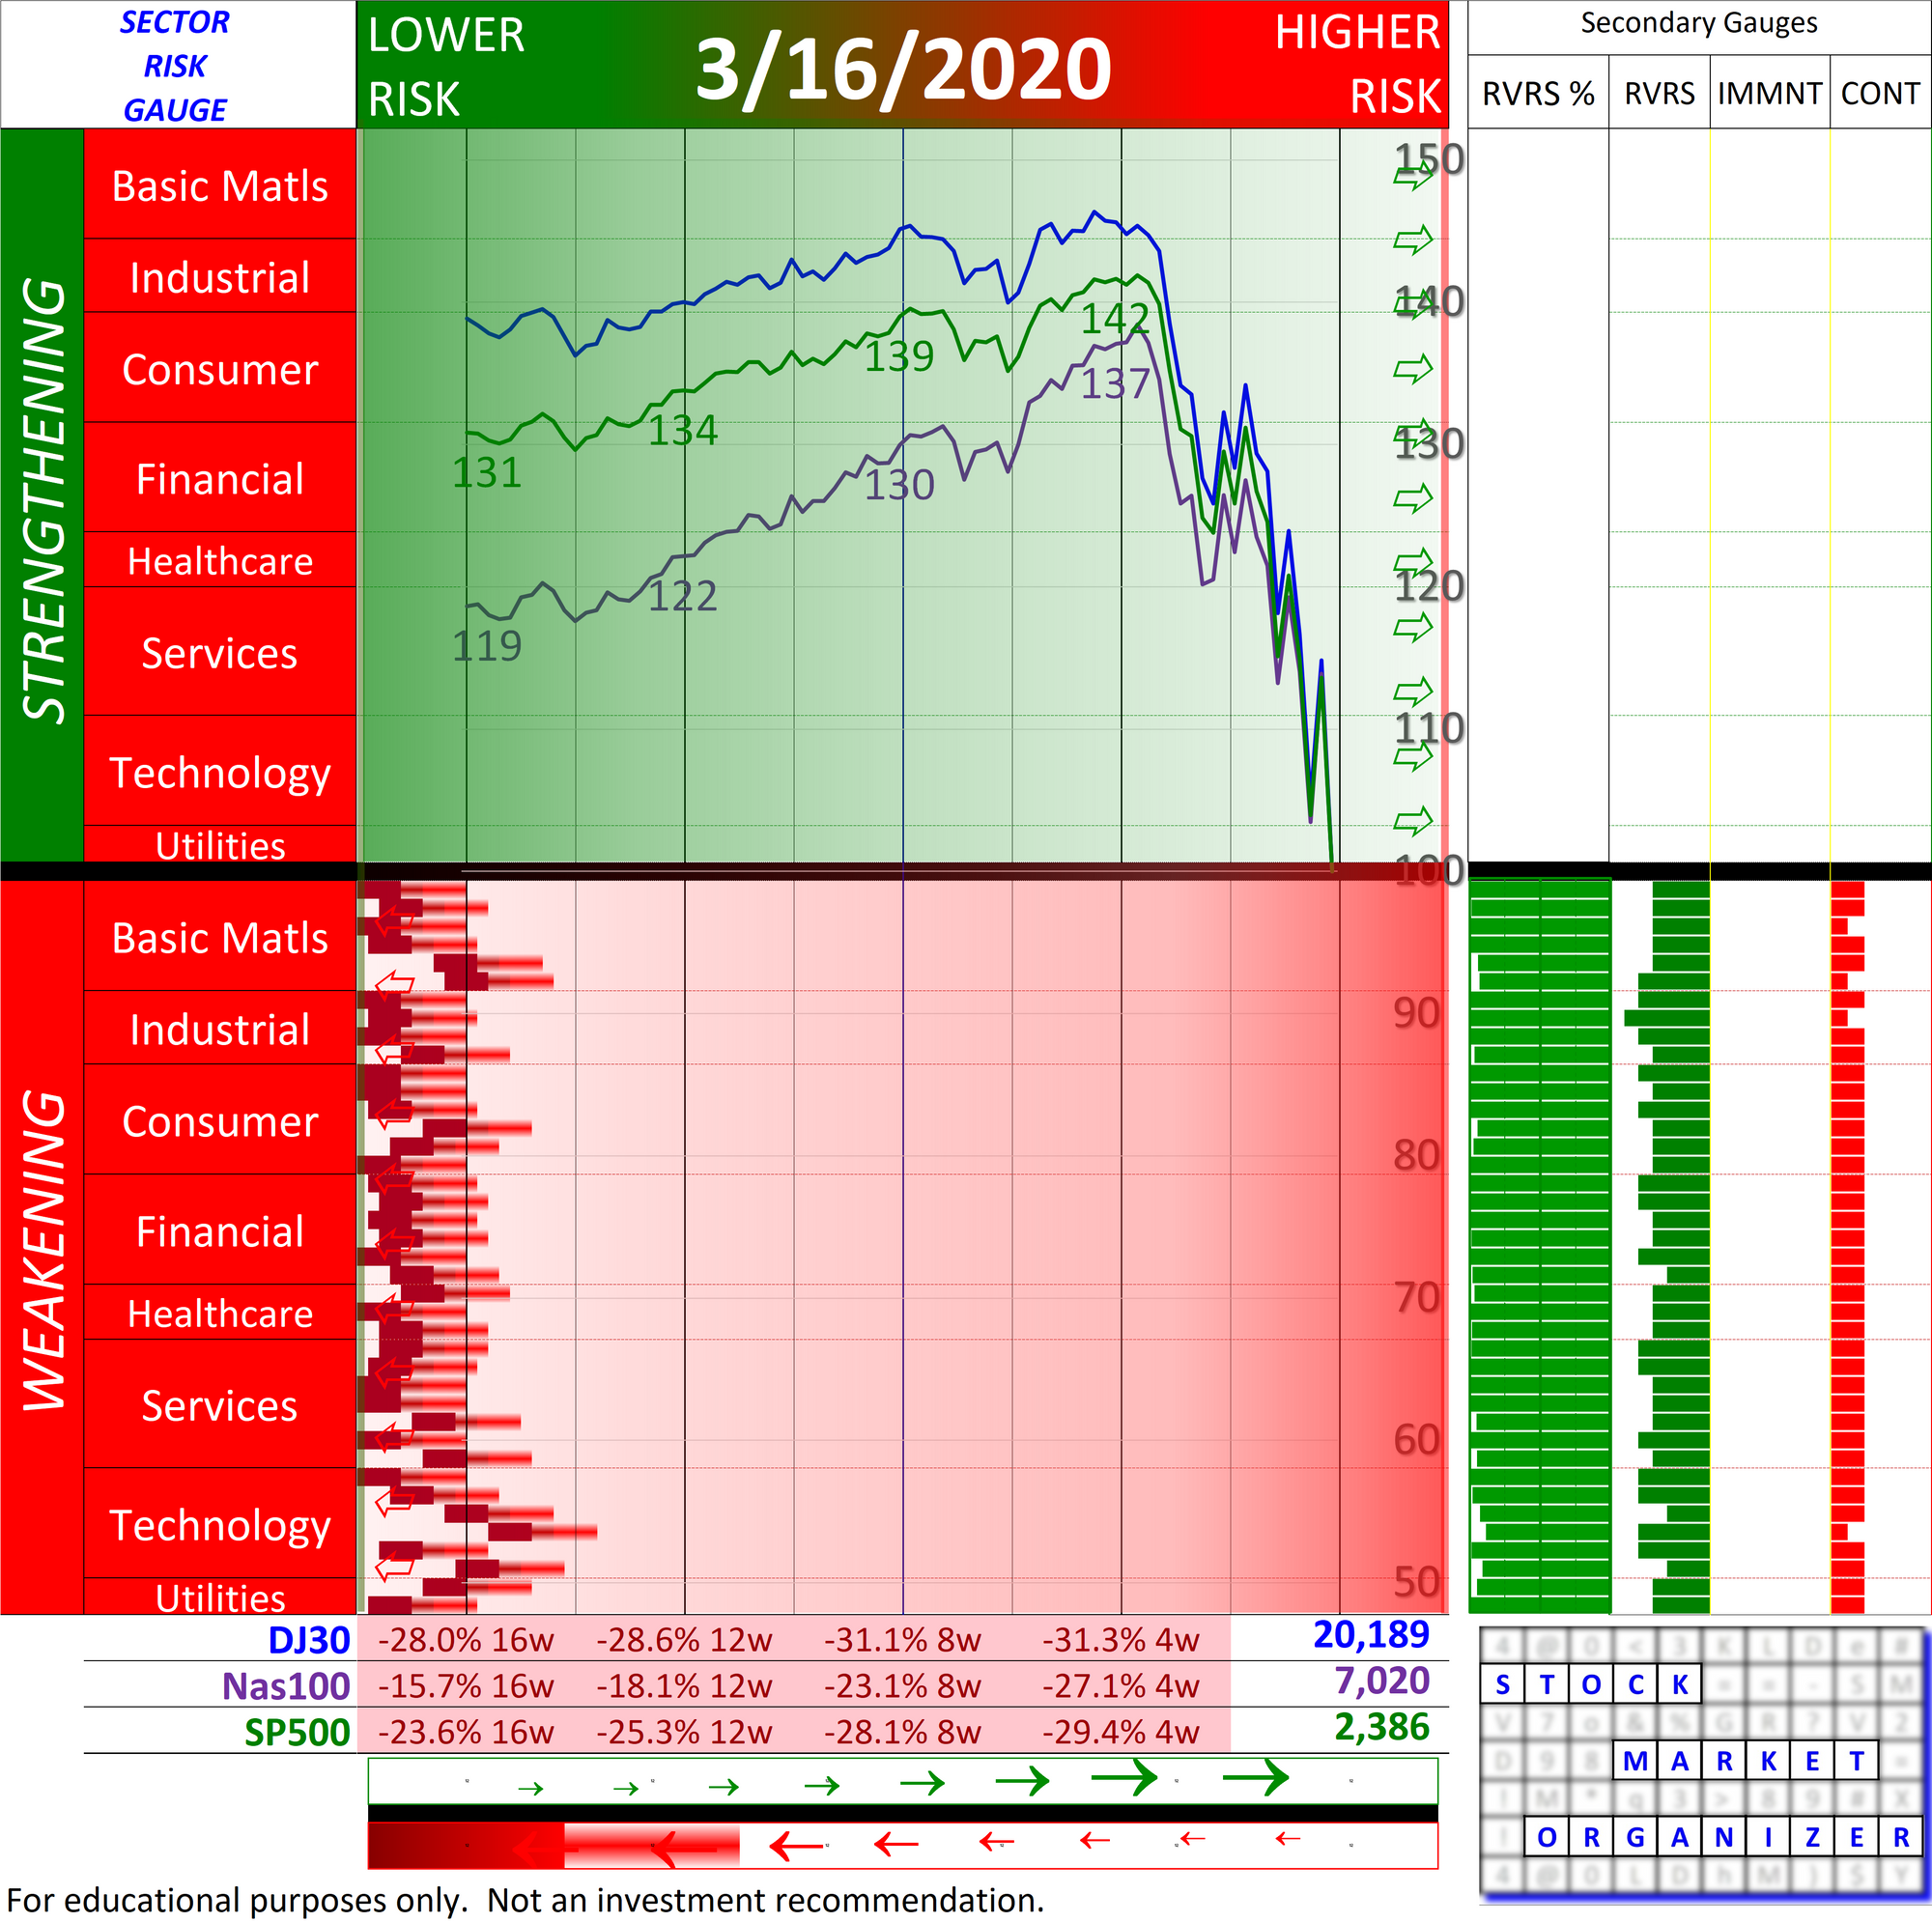
About the Sector Risk Gauge at Important Bottoms
This is what this gauge looked like 3/16/20 (this was a lower reading than 3/23/20):
And 3/9/2009: