Sector Risk Gauge 2023-03-10 - where are we right now?
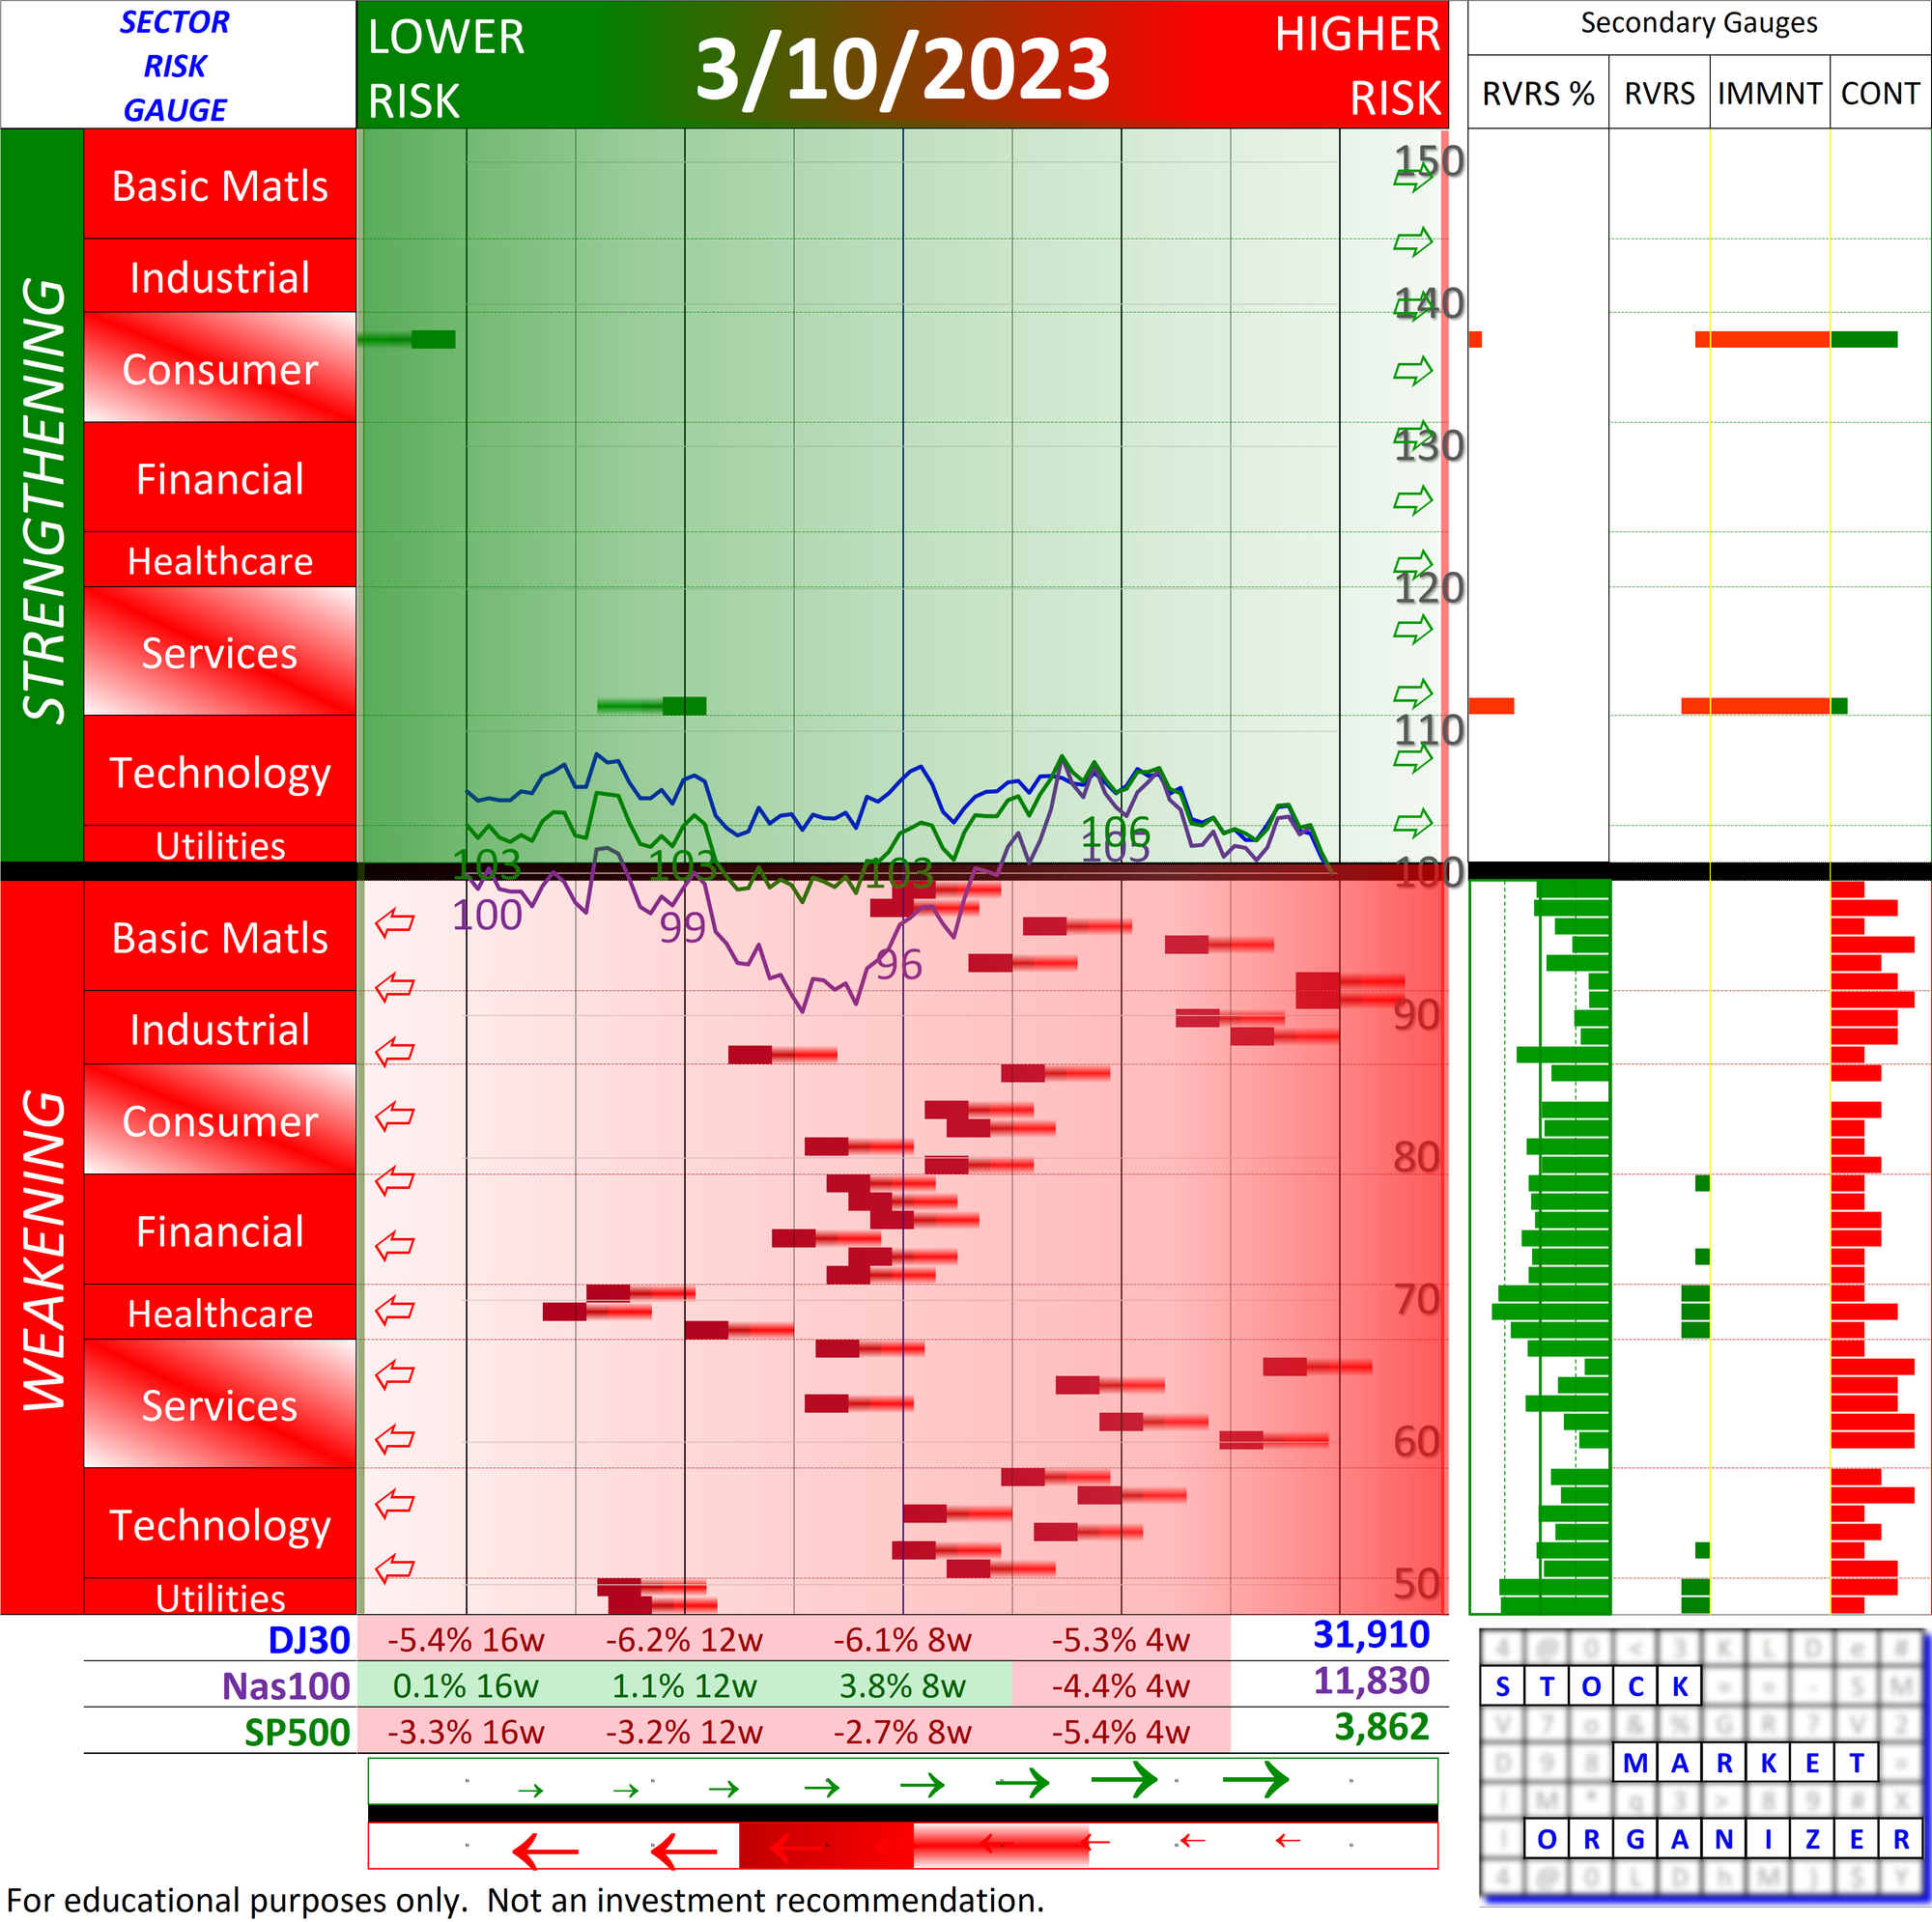
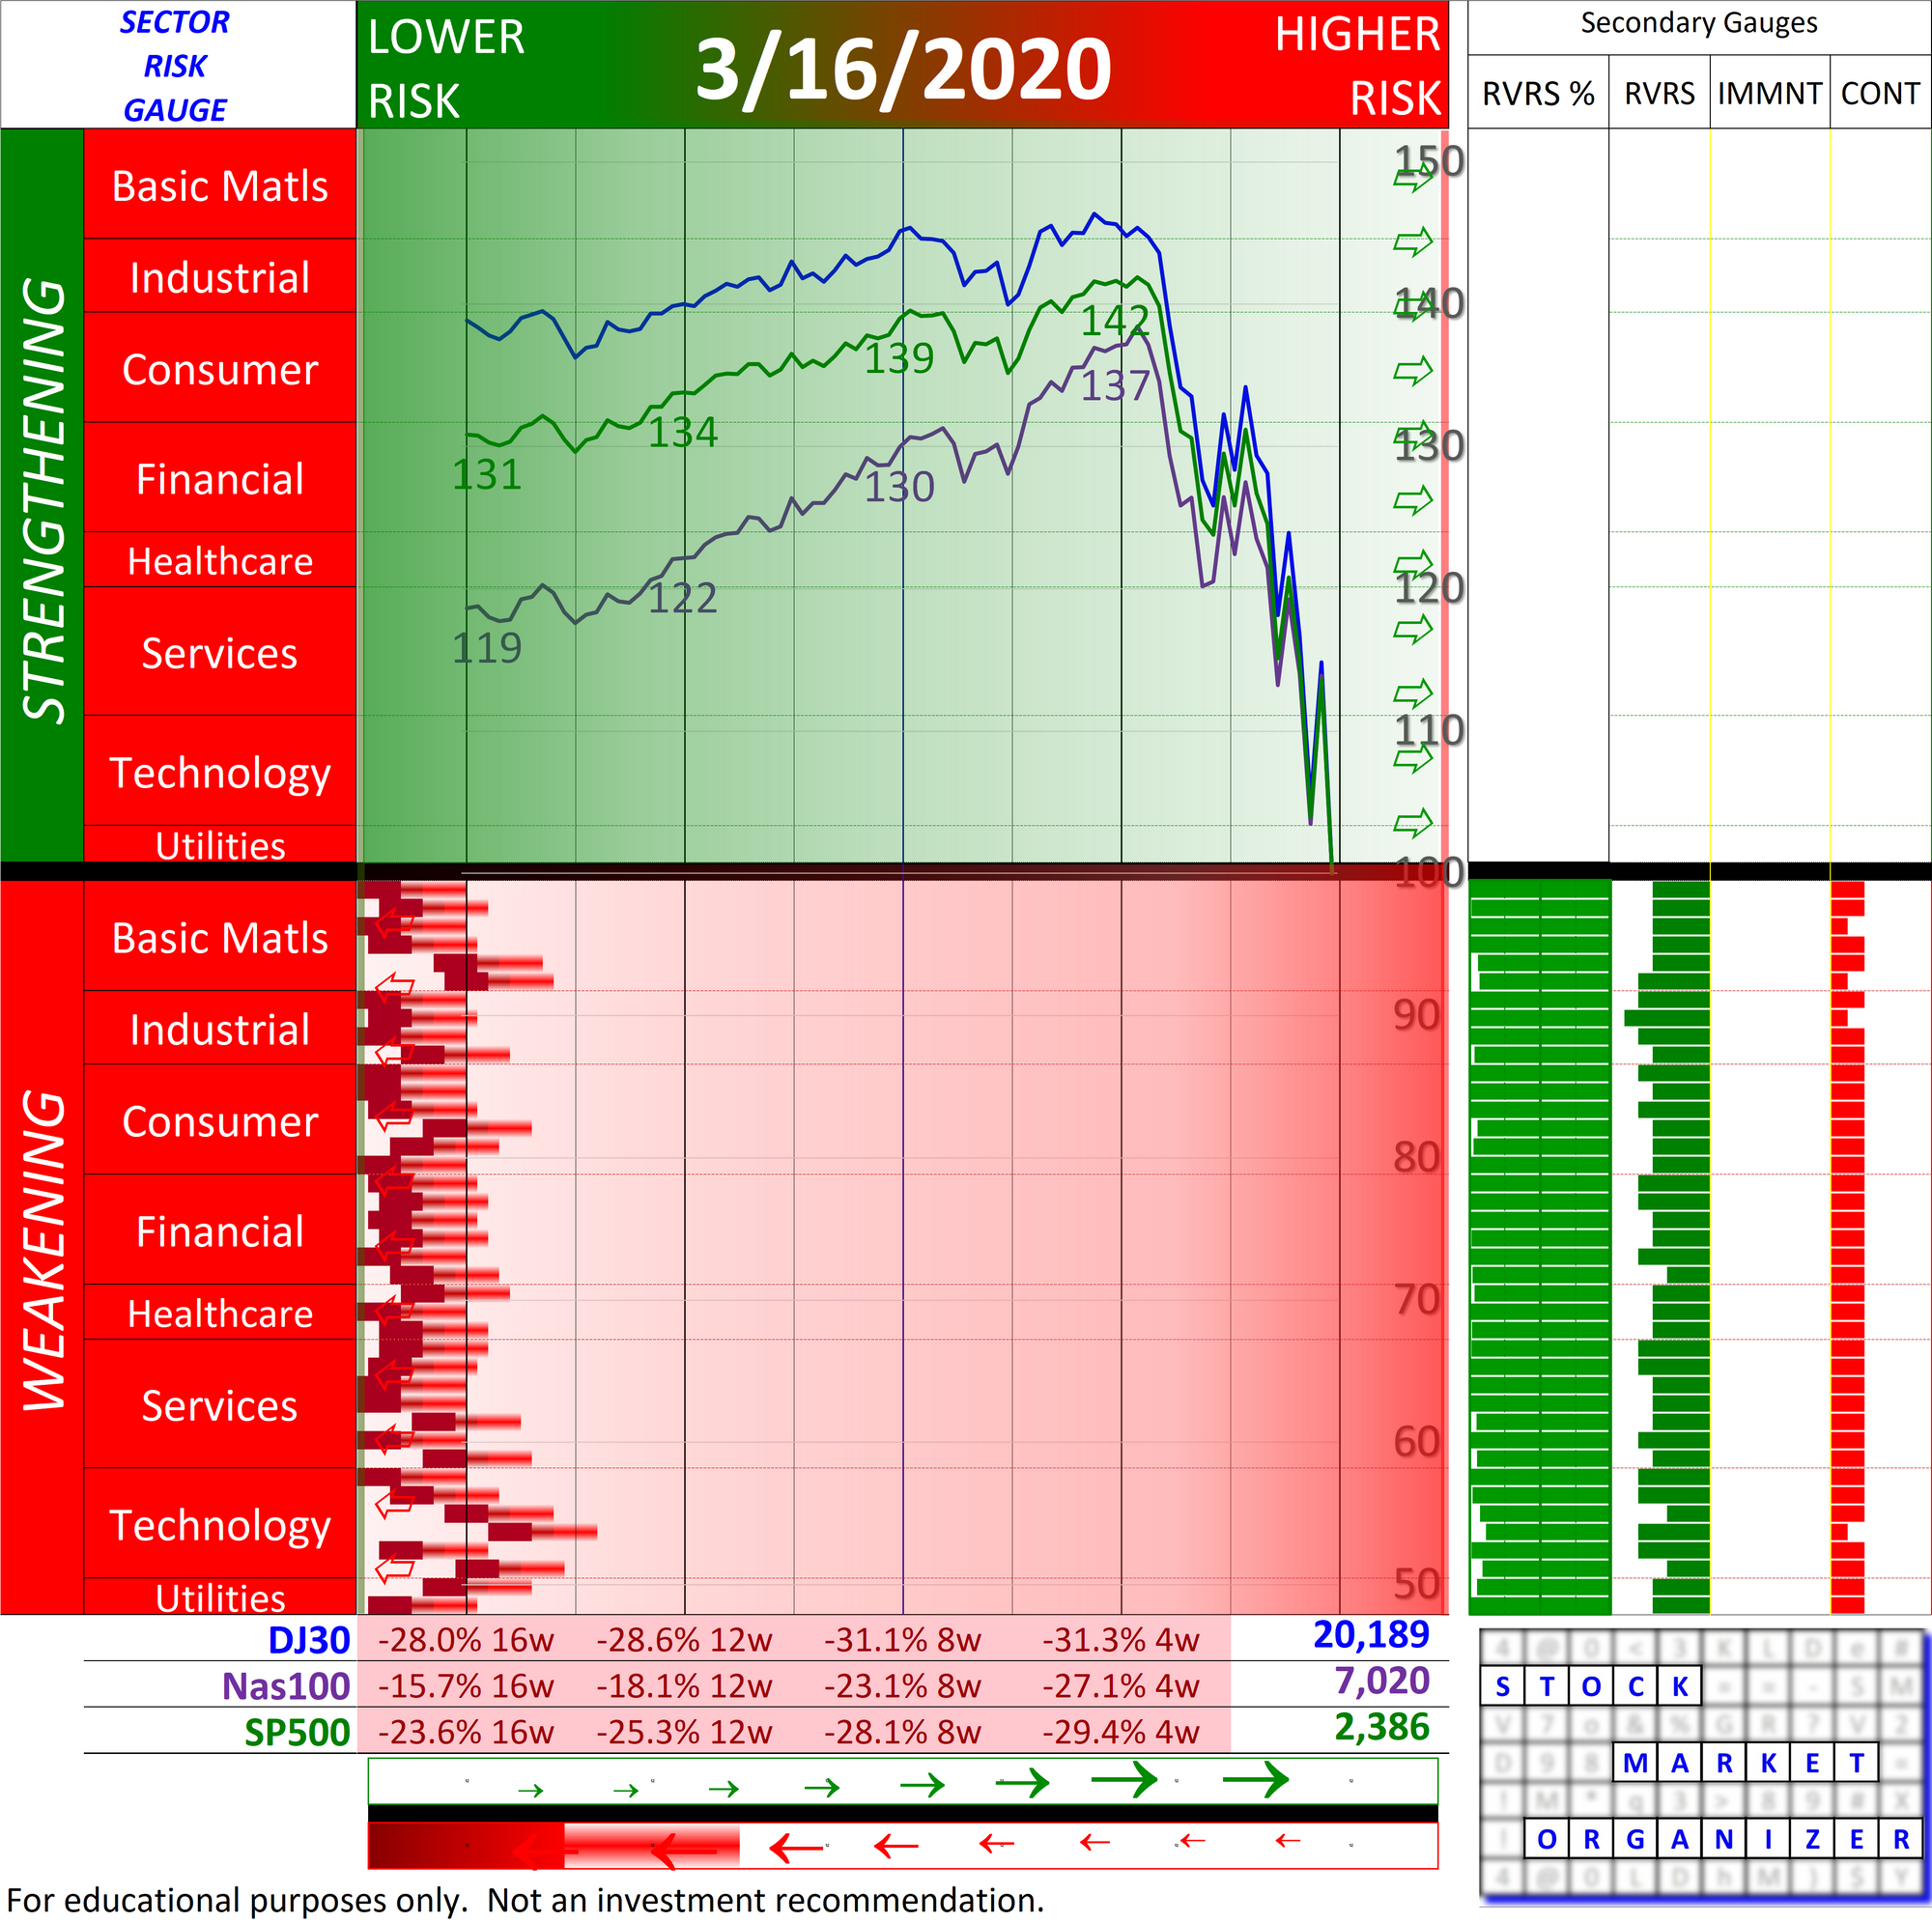
In Stock Market Organizer Sector Risk Gauge terms, what would a bottom look like? One example:
Q. And this is...? (A. A market risk summary)
This tells you where there are supportive market currents (green bars) and not (red bars). An industry is either strengthening or weakening. Farther left is lower risk and a better time to buy - it's the land of old weakening industries and new strengthening industries.
Risk is lower when the graph looks more like what it did 3/16/20. Interestingly, at such times the market weakness will have created for many stocks the value investor's greatly-desired larger Margin of Safety.
Though it does not have to be so complicated, note that at market bottoms volatility can be an absolute you-know-what. Likely your position sizes will automatically become smaller, assuming you are sizing (as you should) based on the then-current volatility of the stock(s) you are buying.
Q. And you care because...? (A. It's like a price chart on steroids, or a surf report)
A standard S&P 500 chart is a essentially a summary of this same information. Unfortunately, these charts hide critical detail as to where there is strengthening and weakening in the market. The Sector Risk Gauge's express purpose is to reveal this strengthening and weakening detail, objectively, consistently, and in a repeatable manner.
Buying a stock in a declining industry and sub-industry can be a formula for disaster. Better to wait until at least the sub-industry has begun rising. Otherwise you risk industry and sub-industry forces dragging down your position.
The Sector Risk Gauge is like having a surf report. Like the worst surfers, the best surfers can do nothing with a flat ocean. (Or worse, a stormy one.) There is nothing to gain and much to lose forcing issues in unfavorable conditions. Much better than can a static price chart, the Sector Risk Gauge can tell you when and where in the market conditions are better.
When conditions are bad, fuggedaboutit. Save your emotional and actual capital for when conditions are conducive to better returns.
However you do it (and the Sector Risk Gauge is one such way), actively seek to determine when those conditions exist.