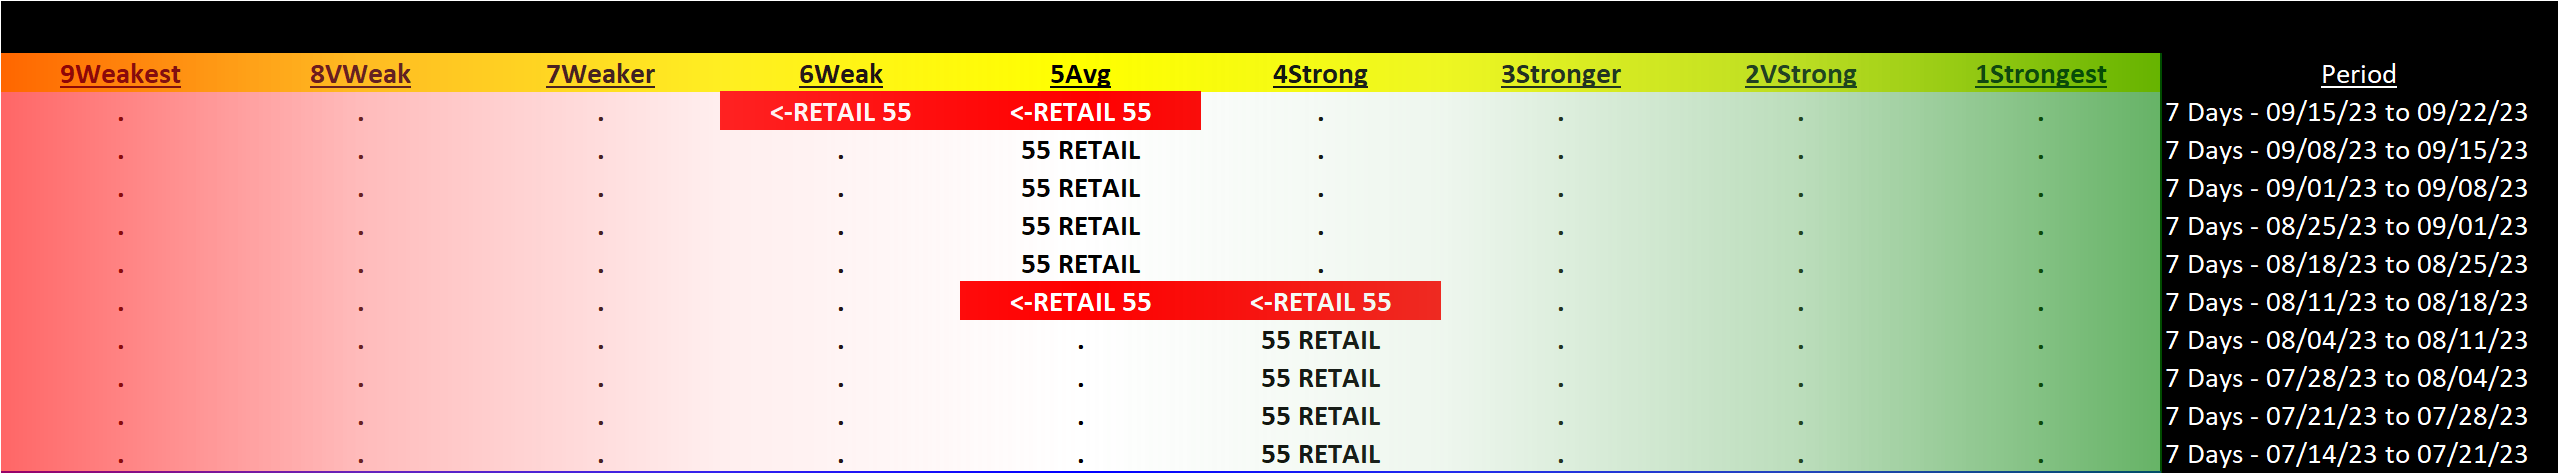
Retail 2023-09-22: DOWN -1 to WEAK strength rating (6th strongest of 9 levels), previous move was also DOWN
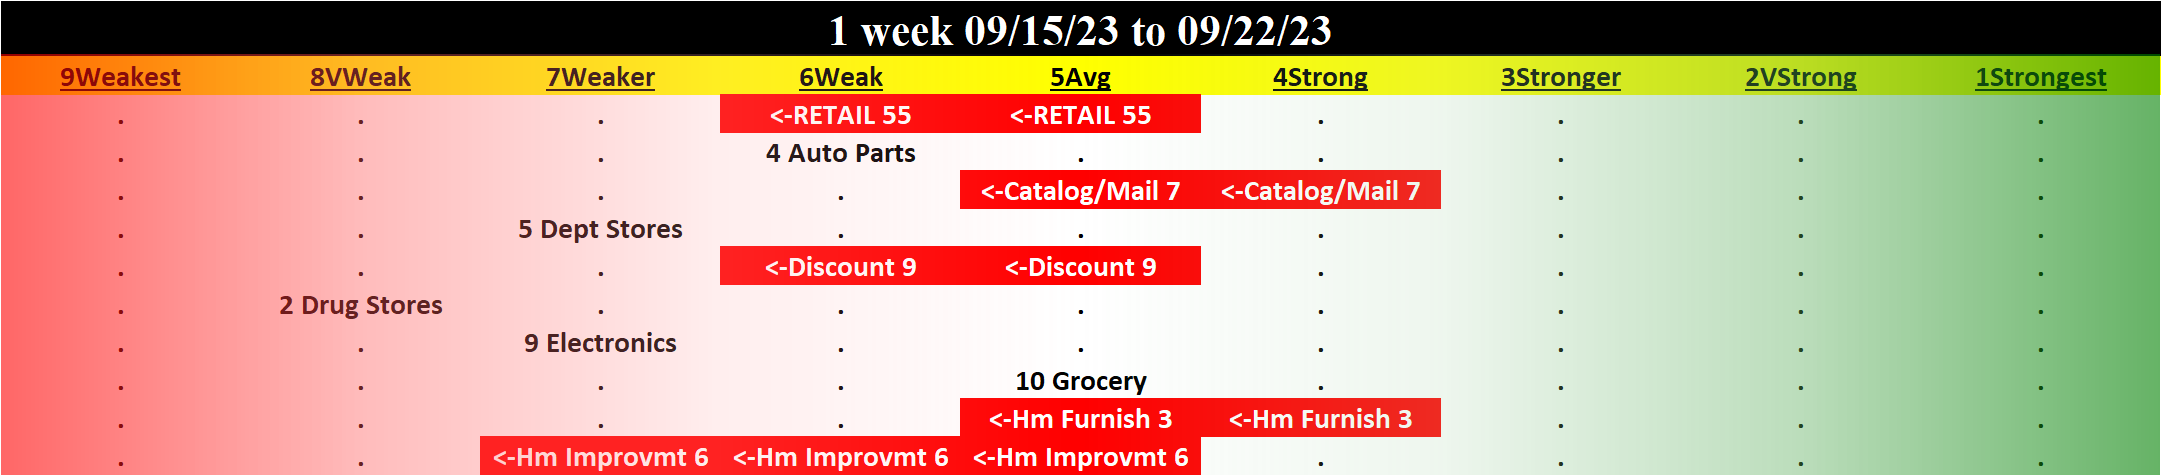
TABLE OF CONTENTS
- INDUSTRY OVERVIEW
1A. Performance
1B. Background - SUB-INDUSTRIES AND STOCKS DETAIL
2A. Sub-Industries Overview
2B. Sub-Industries 10-Week Strengthening Analysis
2C. Stocks 1 Week Strongest and Weakest - STRENGTH BY LOOKBACK PERIOD (with Best/Worst stocks)
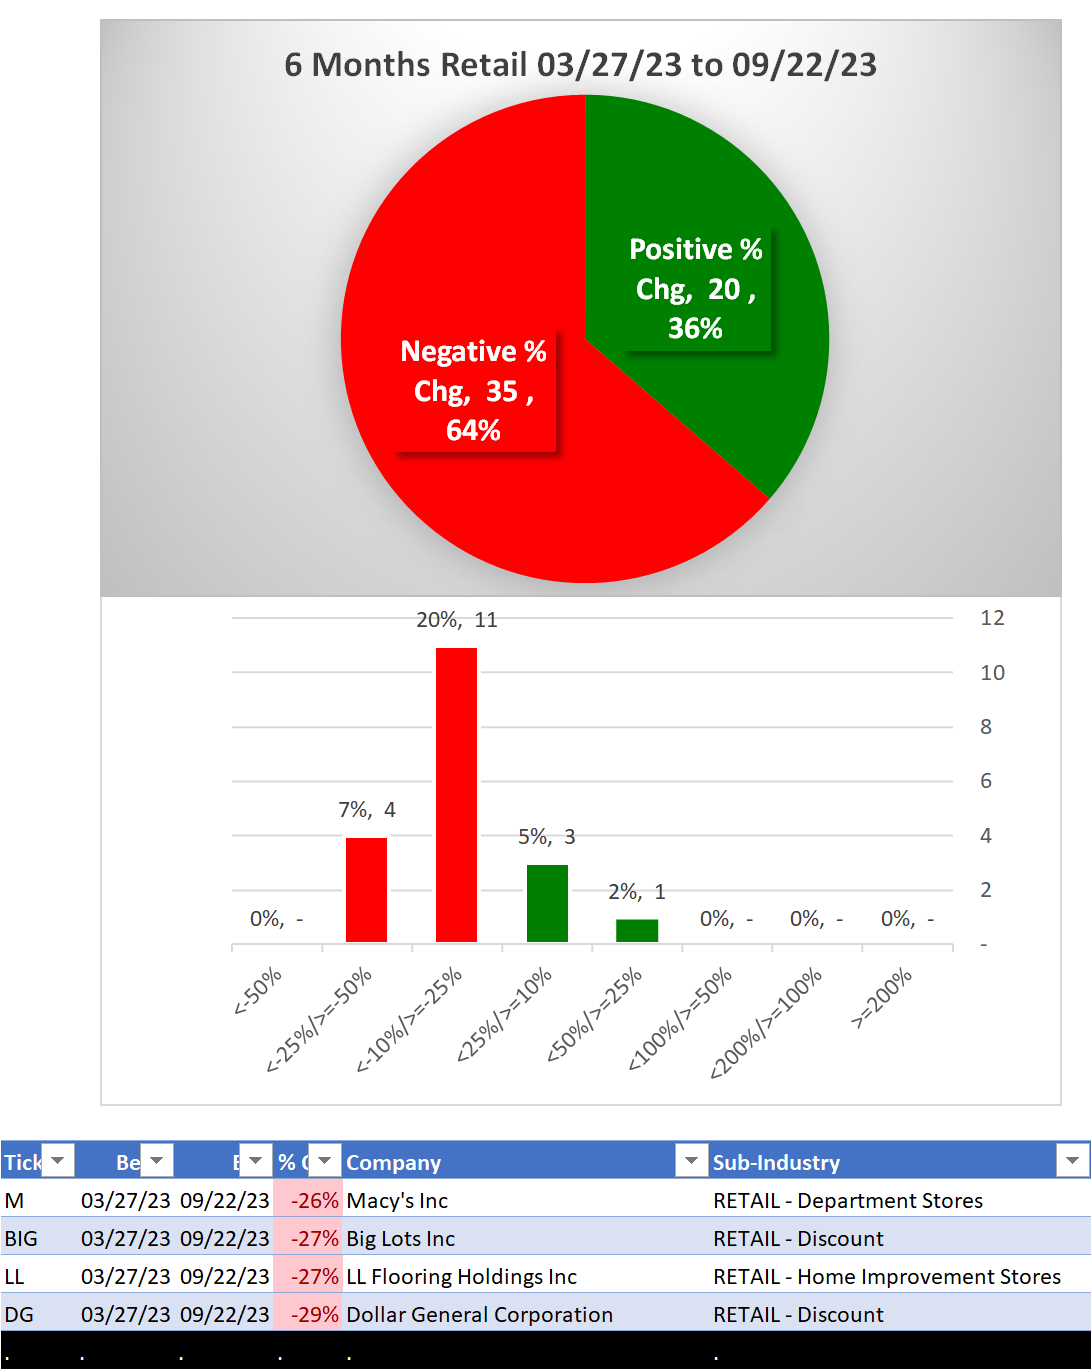
3A. Lookback 6 Months
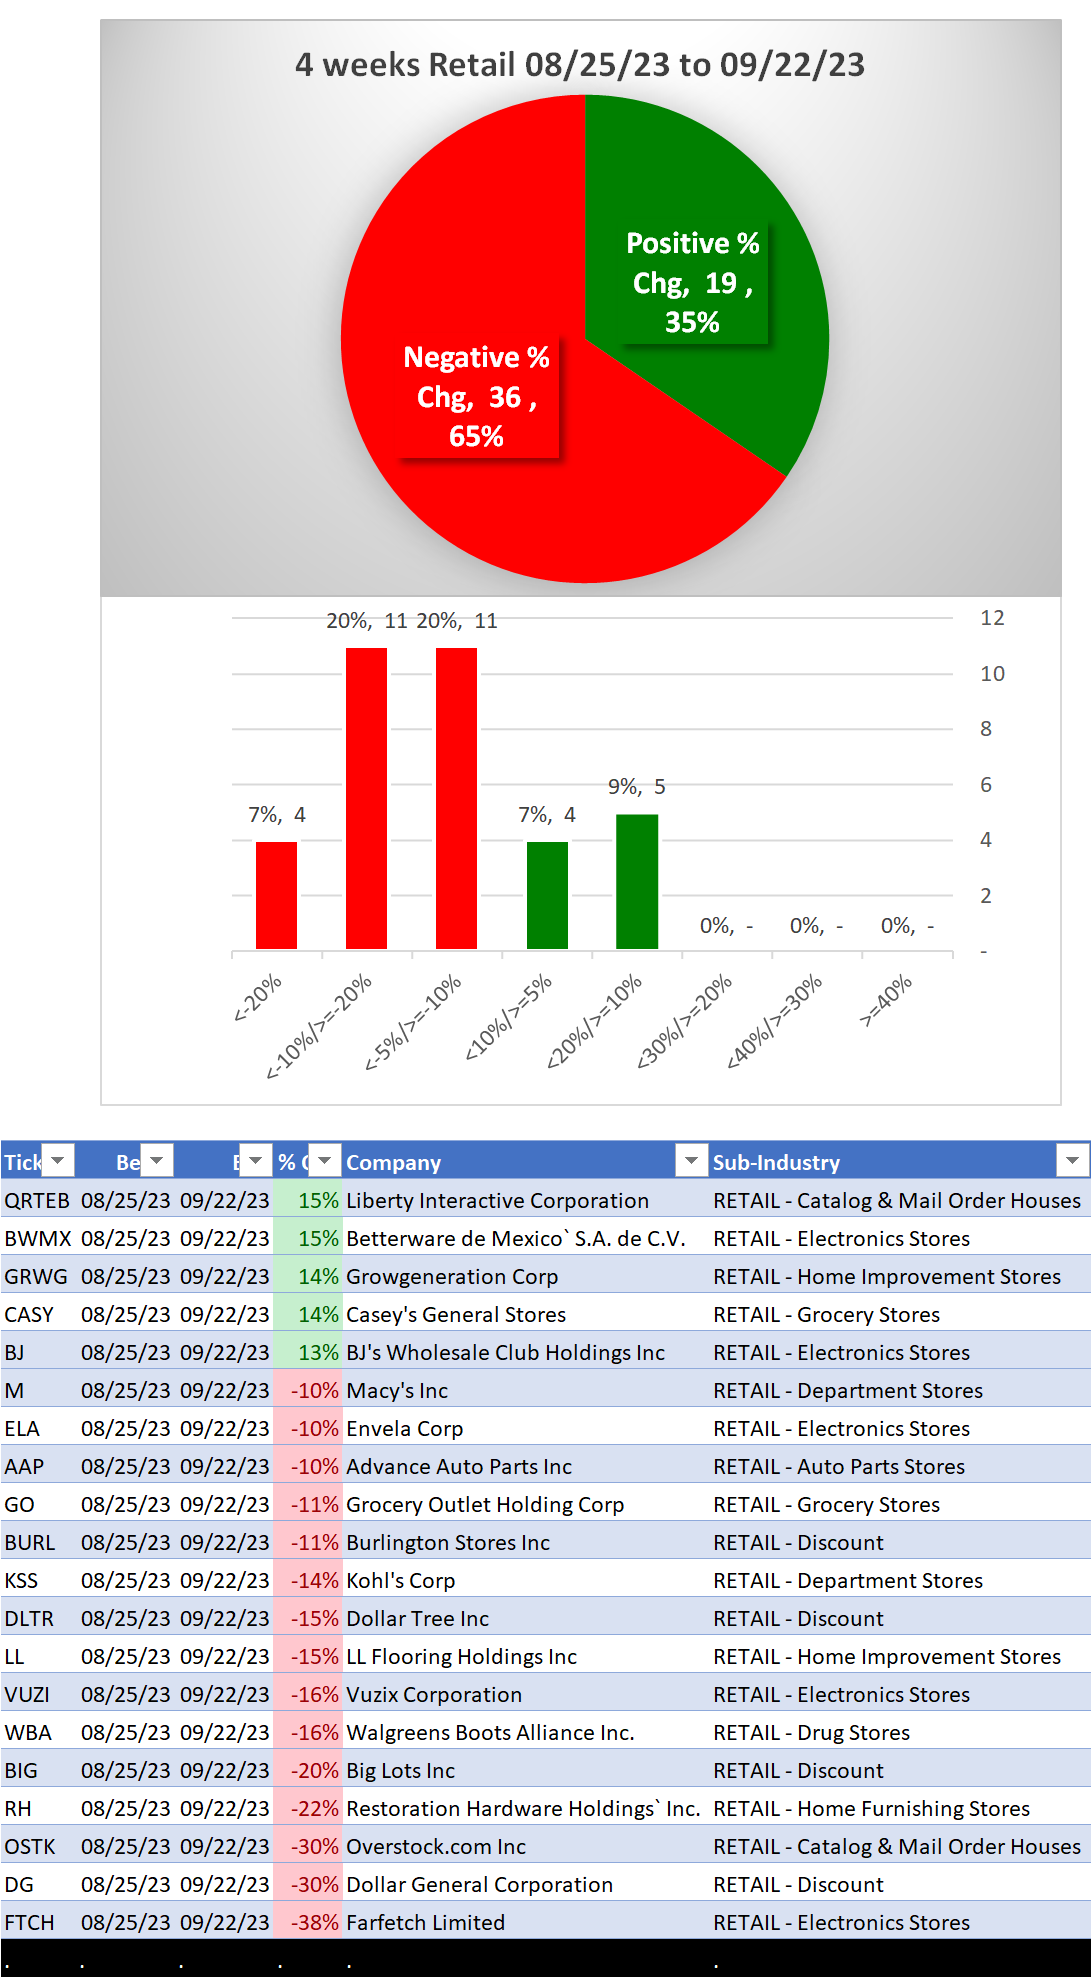
3B. Lookback 4 weeks
3C. Lookback 1 Week
1. INDUSTRY OVERVIEW
1A. Performance
Past 10 Weeks Strengthening/Weakening week-by-week, per the following chart:
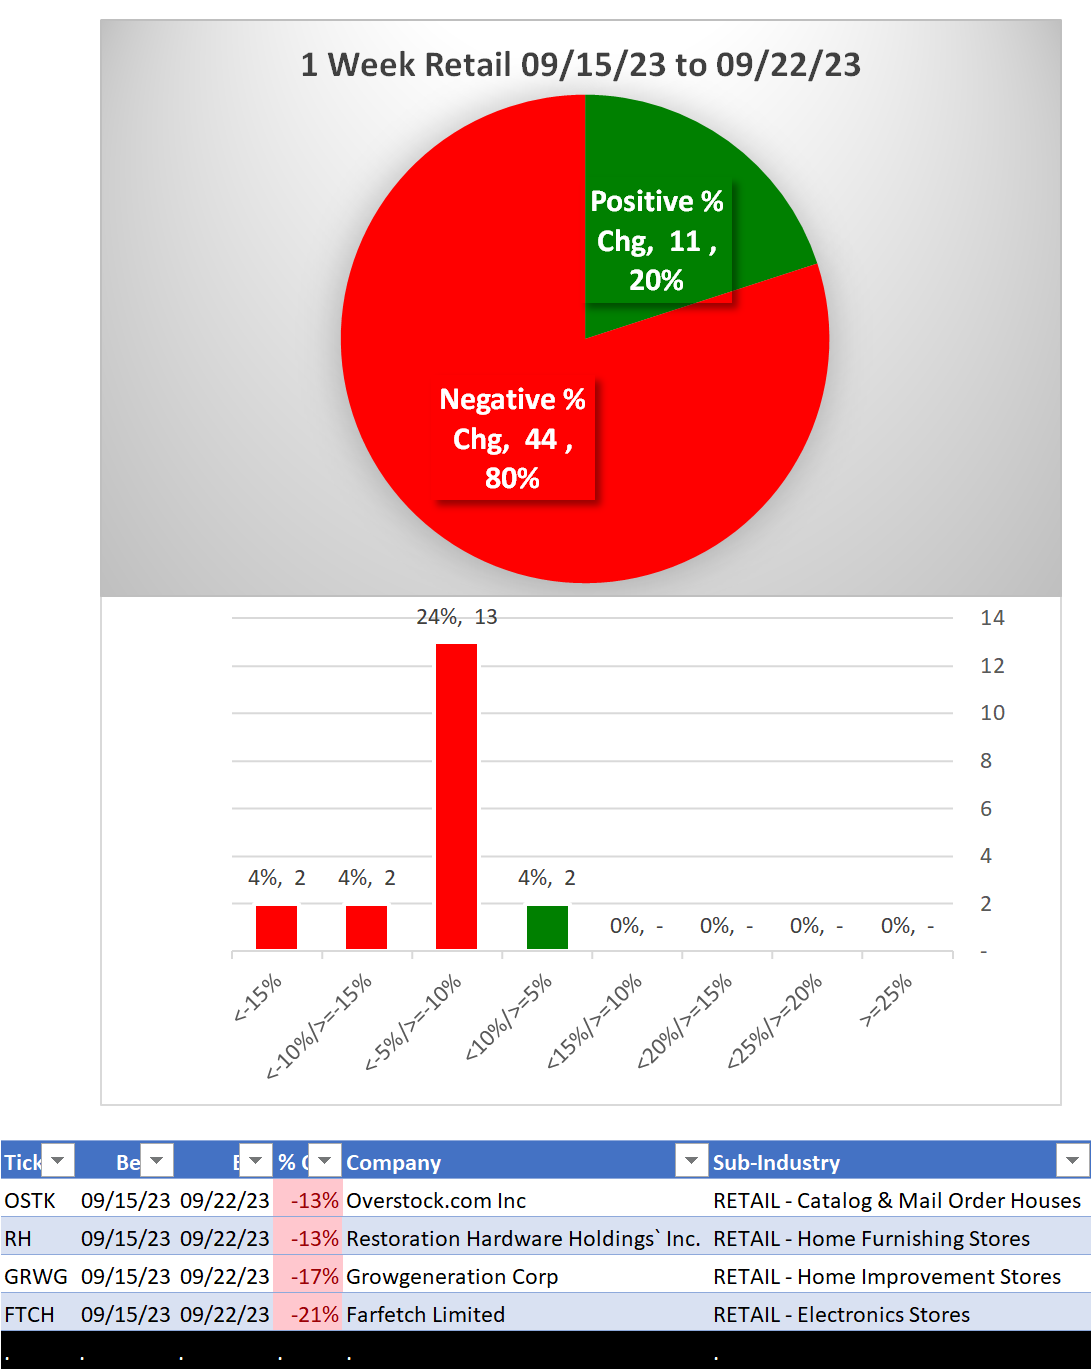
WEAKENING 1 Week vs. Mid- and Longer-Term // 1 week positive/negative stocks ratio is LOWER than both 4 weeks and 6 Months, per the following chart:
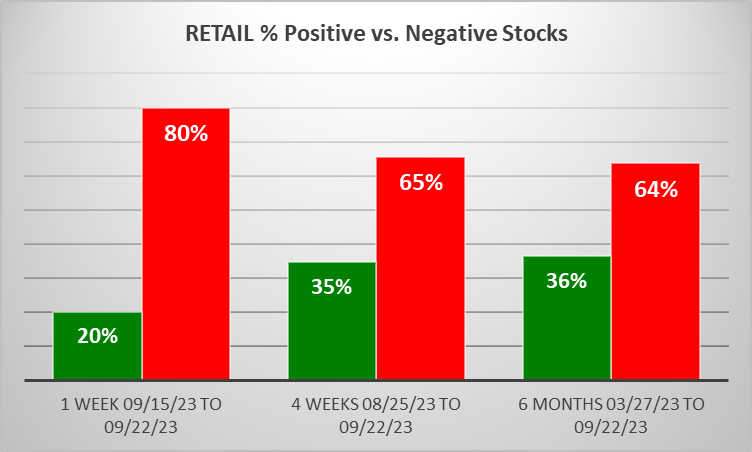
Comment:
- Weakest stocks are currently 42% of total.
1B. Background
Largest of 9 sub-industries (55 stocks, average 6):
- Grocery Stores (10 stocks)
- Discount (9 stocks)
- Electronics Stores (9 stocks)
- Catalog & Mail Order Houses (7 stocks)
Top 10 by Market Capitalization:
AMZN/Amazon.Com Inc, WMT/Walmart Inc, HD/Home Depot Inc, COST/Costco Wholesale Corp, LOW/Lowe's Companies Inc, TJX/TJX Companies Inc, CVS/CVS Health Corporation, MELI/MercadoLibre Inc, TGT/Target Corporation, ORLY/O'reilly Automotive Inc
2. SUB-INDUSTRIES AND STOCKS DETAIL
2A. Sub-Industries Overview
Strengthened: 0/9 sub-industries
Weakened: 4/9 sub-industries
STRONGEST at Average rating/5th strongest of 9 levels:
- Catalog & Mail Order Houses (7 stocks)
- Grocery Stores (10 stocks)
- Home Furnishing Stores (3 stocks)
WEAKEST at Very Weak rating/8th strongest of 9 levels:
- Drug Stores (2 stocks)
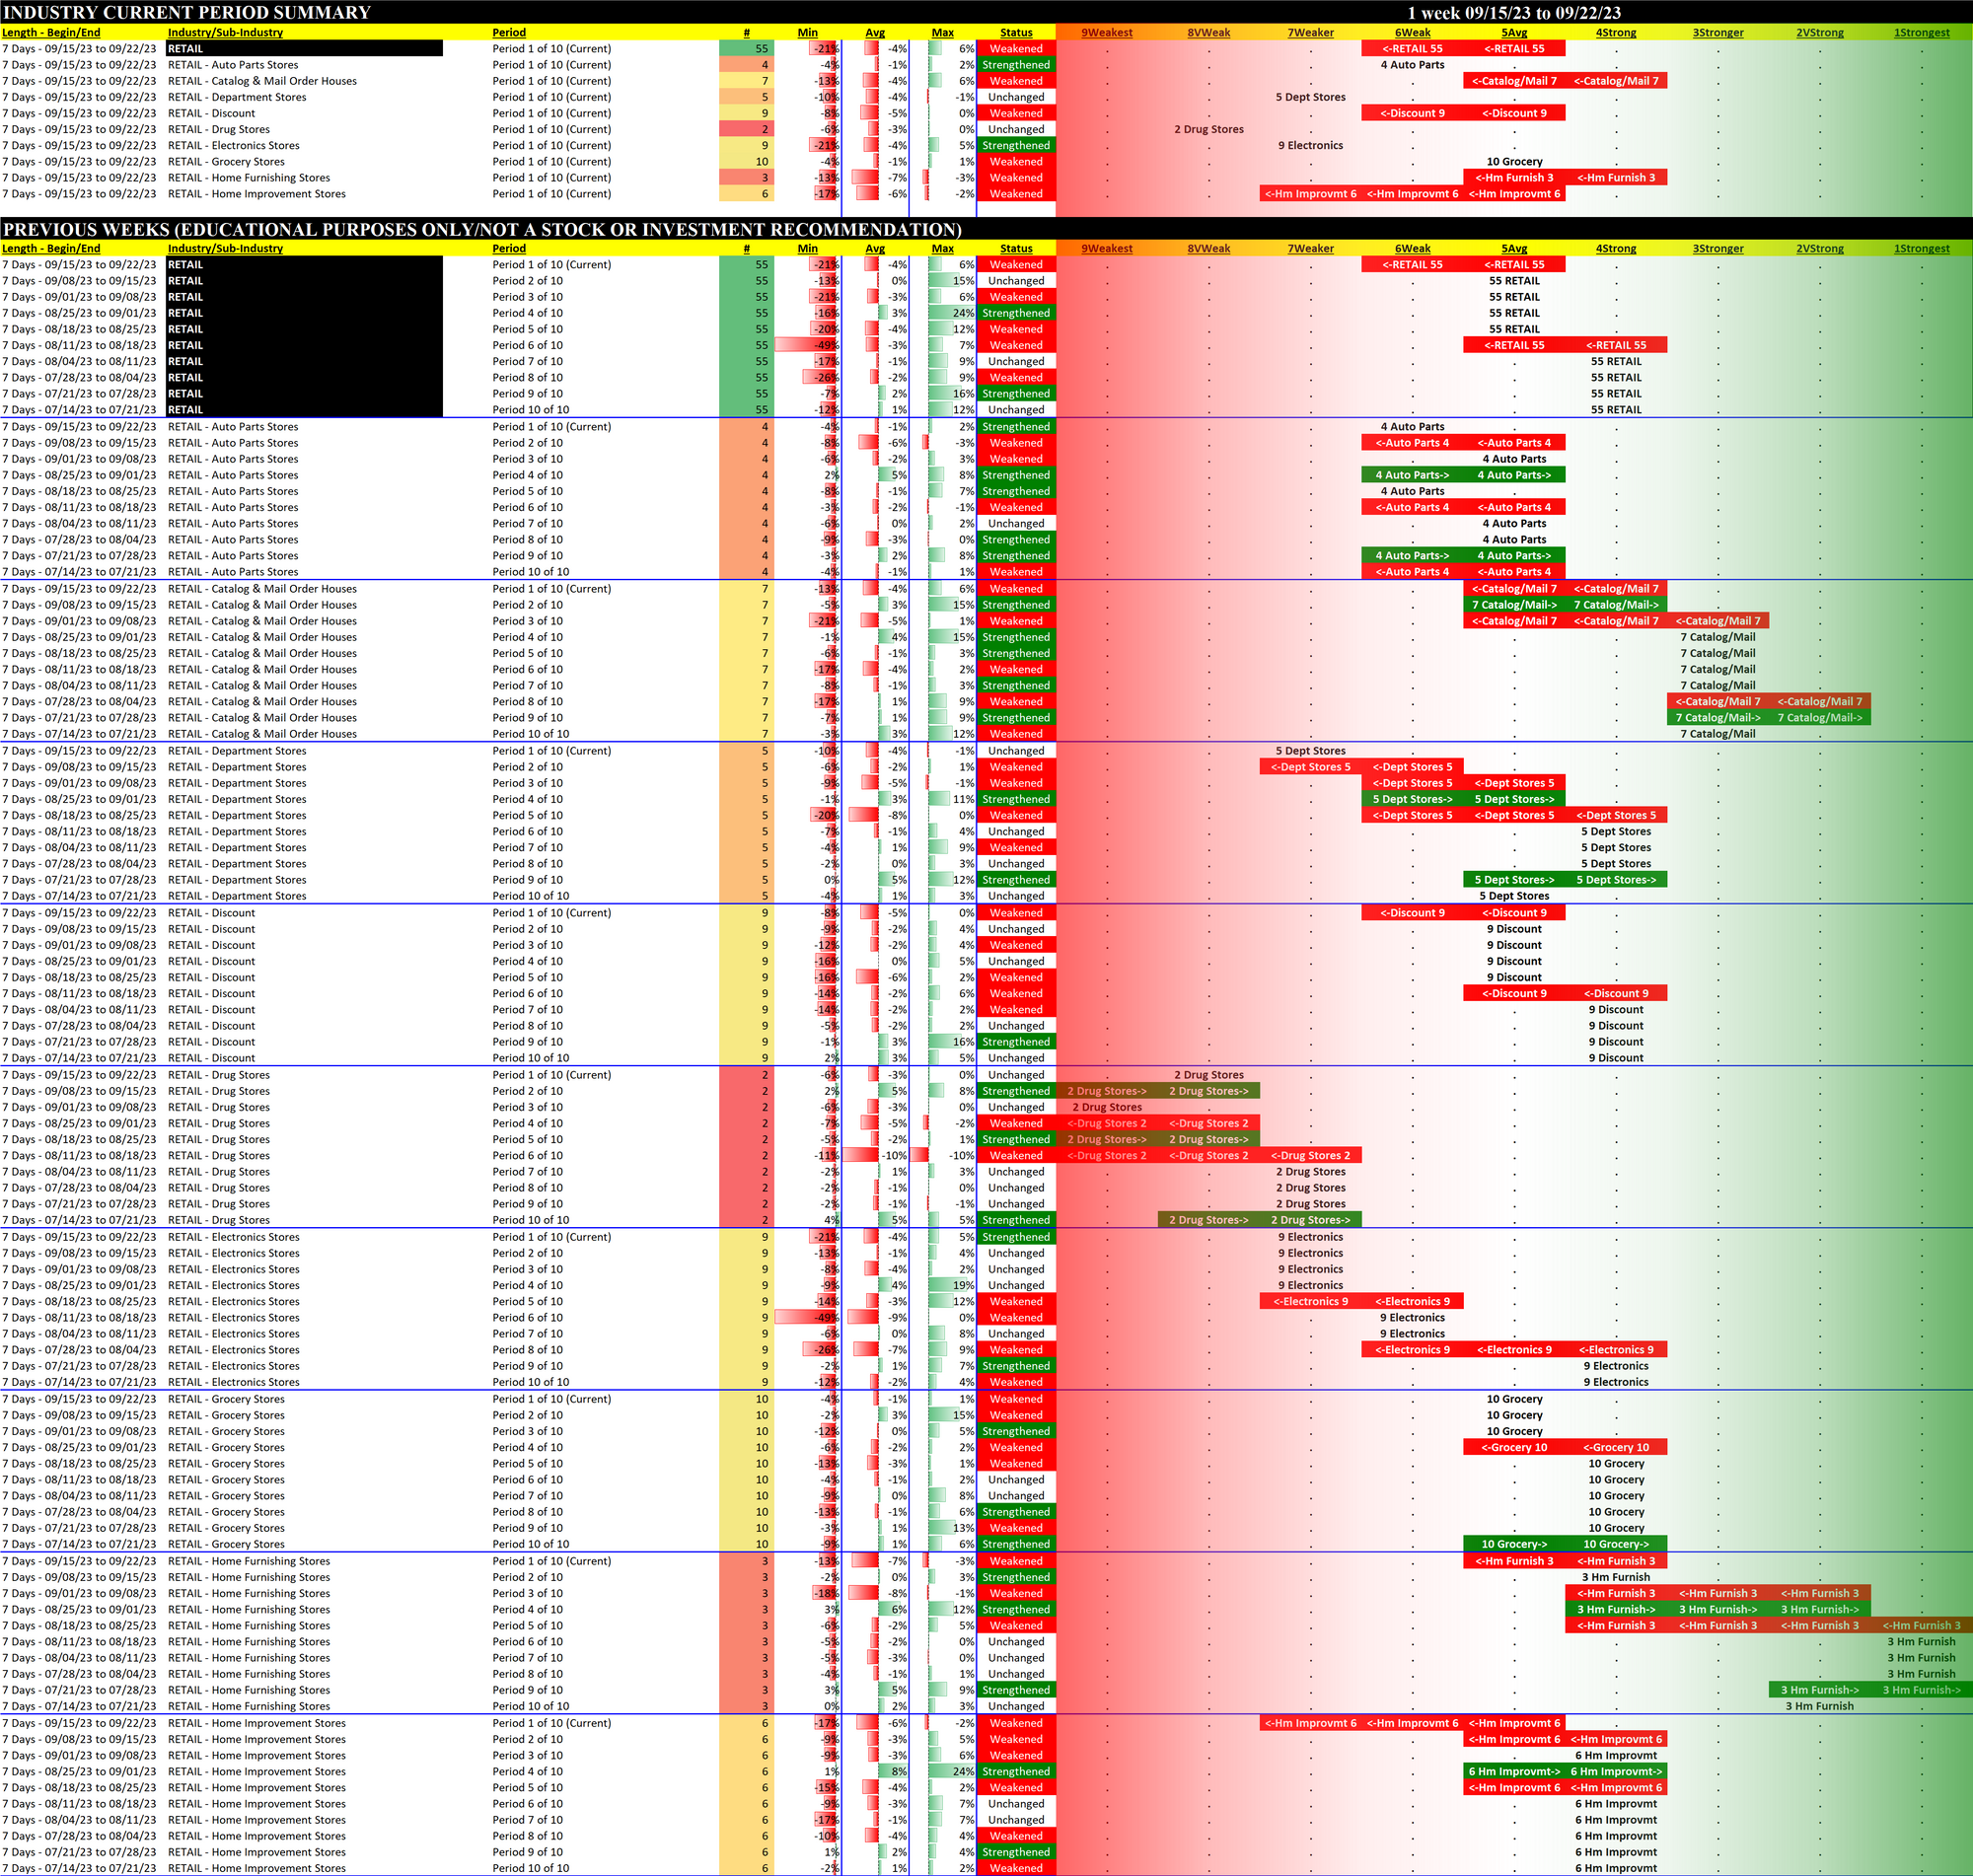
2B. Sub-Industries 10-Week Strengthening Analysis
What: recent week-by-week strength changes for the industry and each underlying sub-industry
Why: objective measurement of strengthening and weakening enabling comparison within and across industries and sub-industries
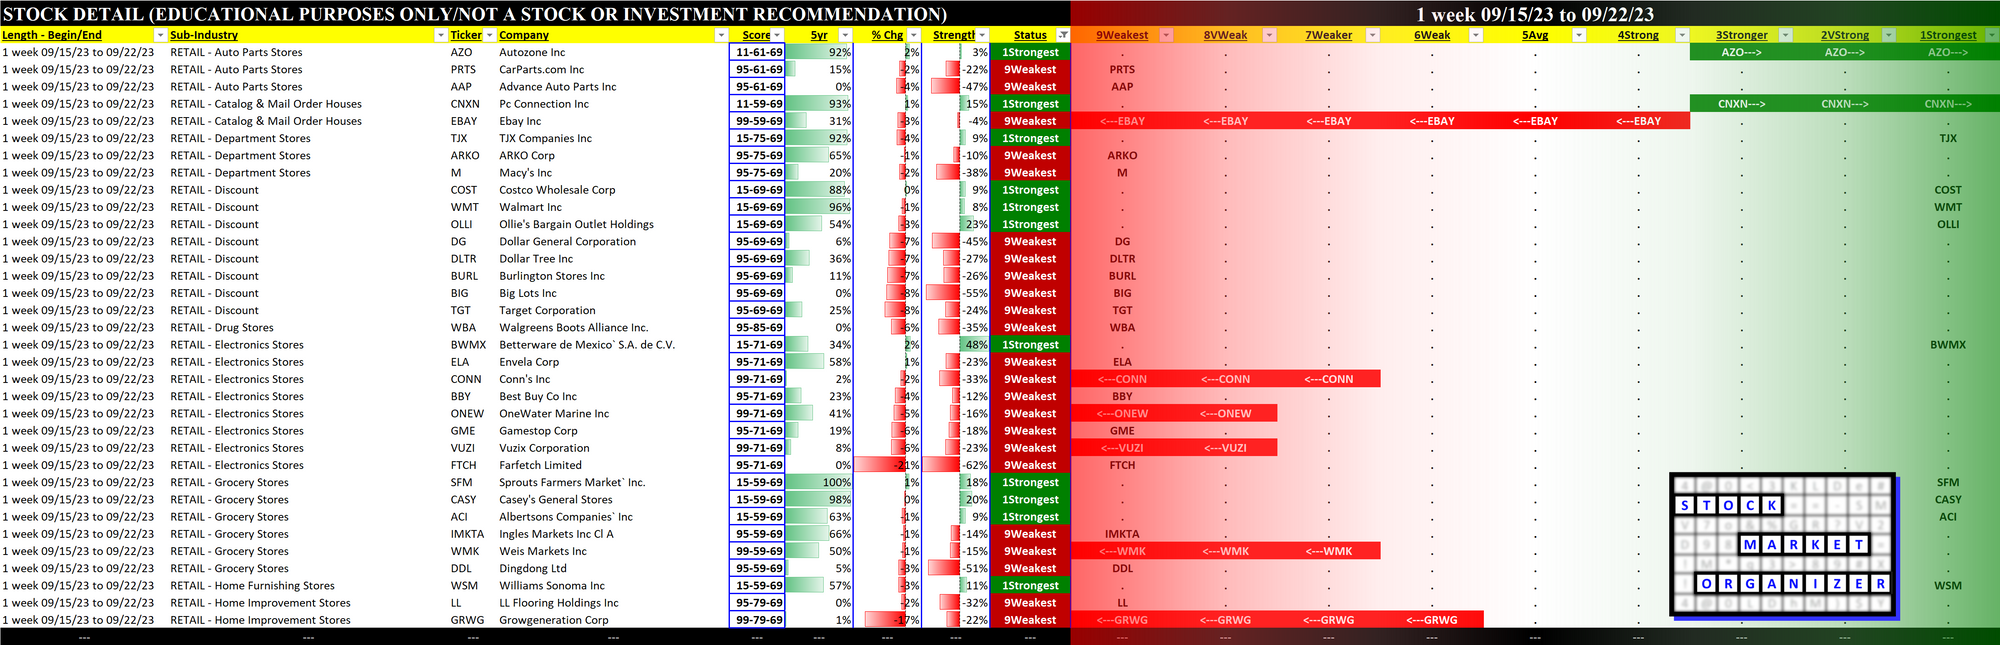
2C. Stocks 1 Week Strongest and Weakest
What: stocks currently rated Strongest/Weakest (highest/lowest of 9 strength ratings)
Why: most interesting stocks for available capital because
- the Strongest have the least amount of overhead supply to dampen breakouts while
- the Weakest may be prone to volatility, subject to big pops from bottom-fishing and short-covering BUT ALSO to bigger and faster falls.
(Not guaranteed and not a recommendation - weak stocks in weakening sub-industries may be better shorts than high-flyers.)
3. STRENGTH BY LOOKBACK PERIOD (with Best/Worst stocks)
3A. Lookback 6 Months
3B. Lookback 4 weeks
3C. Lookback 1 Week