Real Estate 2023-09-15: UP 1 to AVERAGE strength rating (5th strongest of 9 levels), previous move was DOWN
SUMMARY
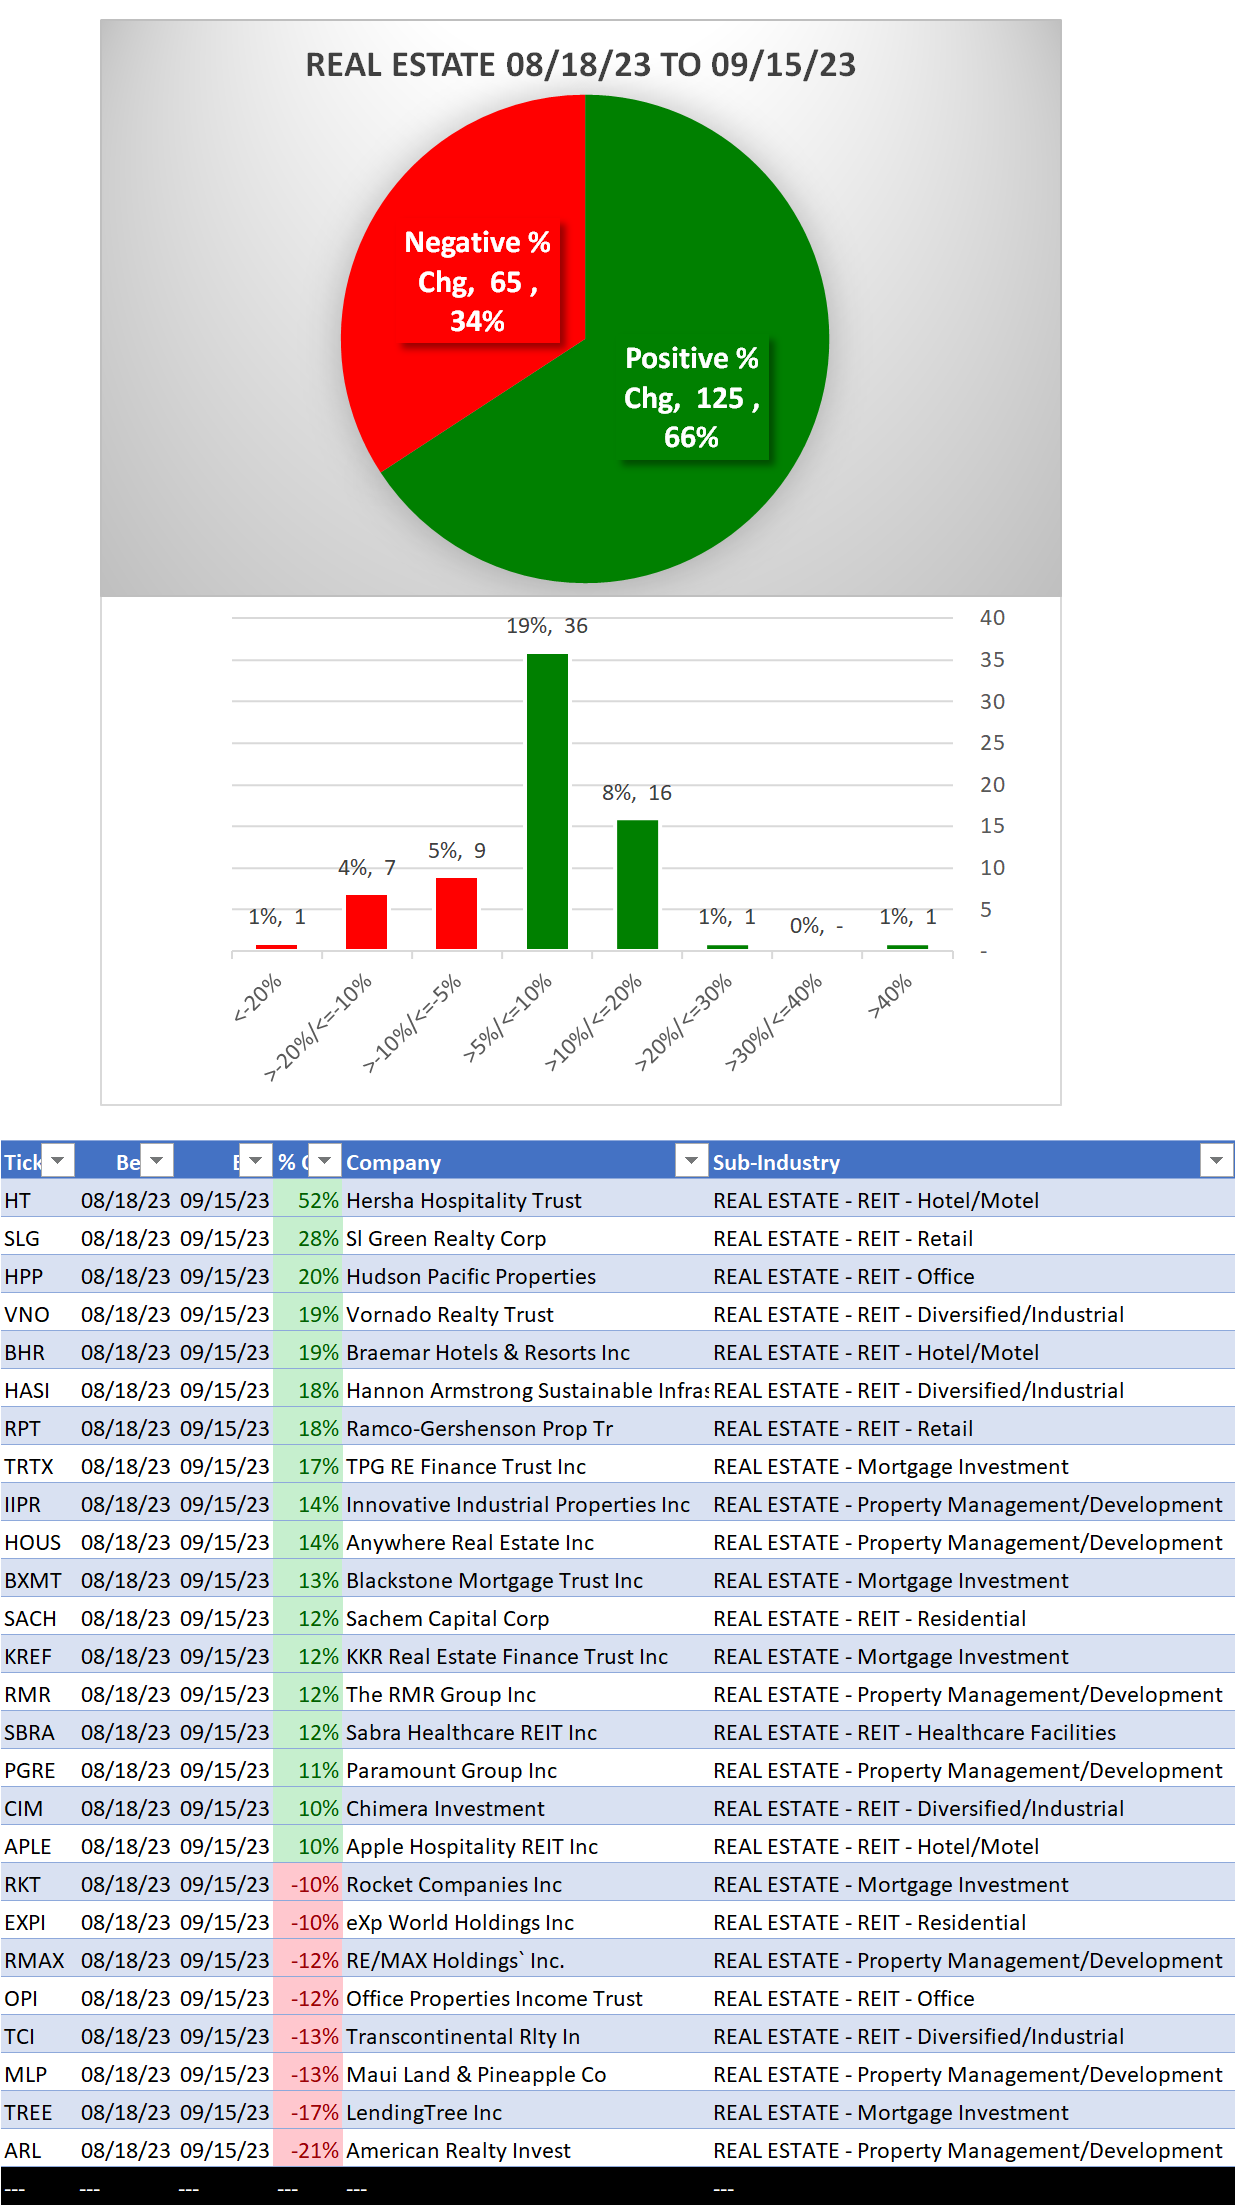
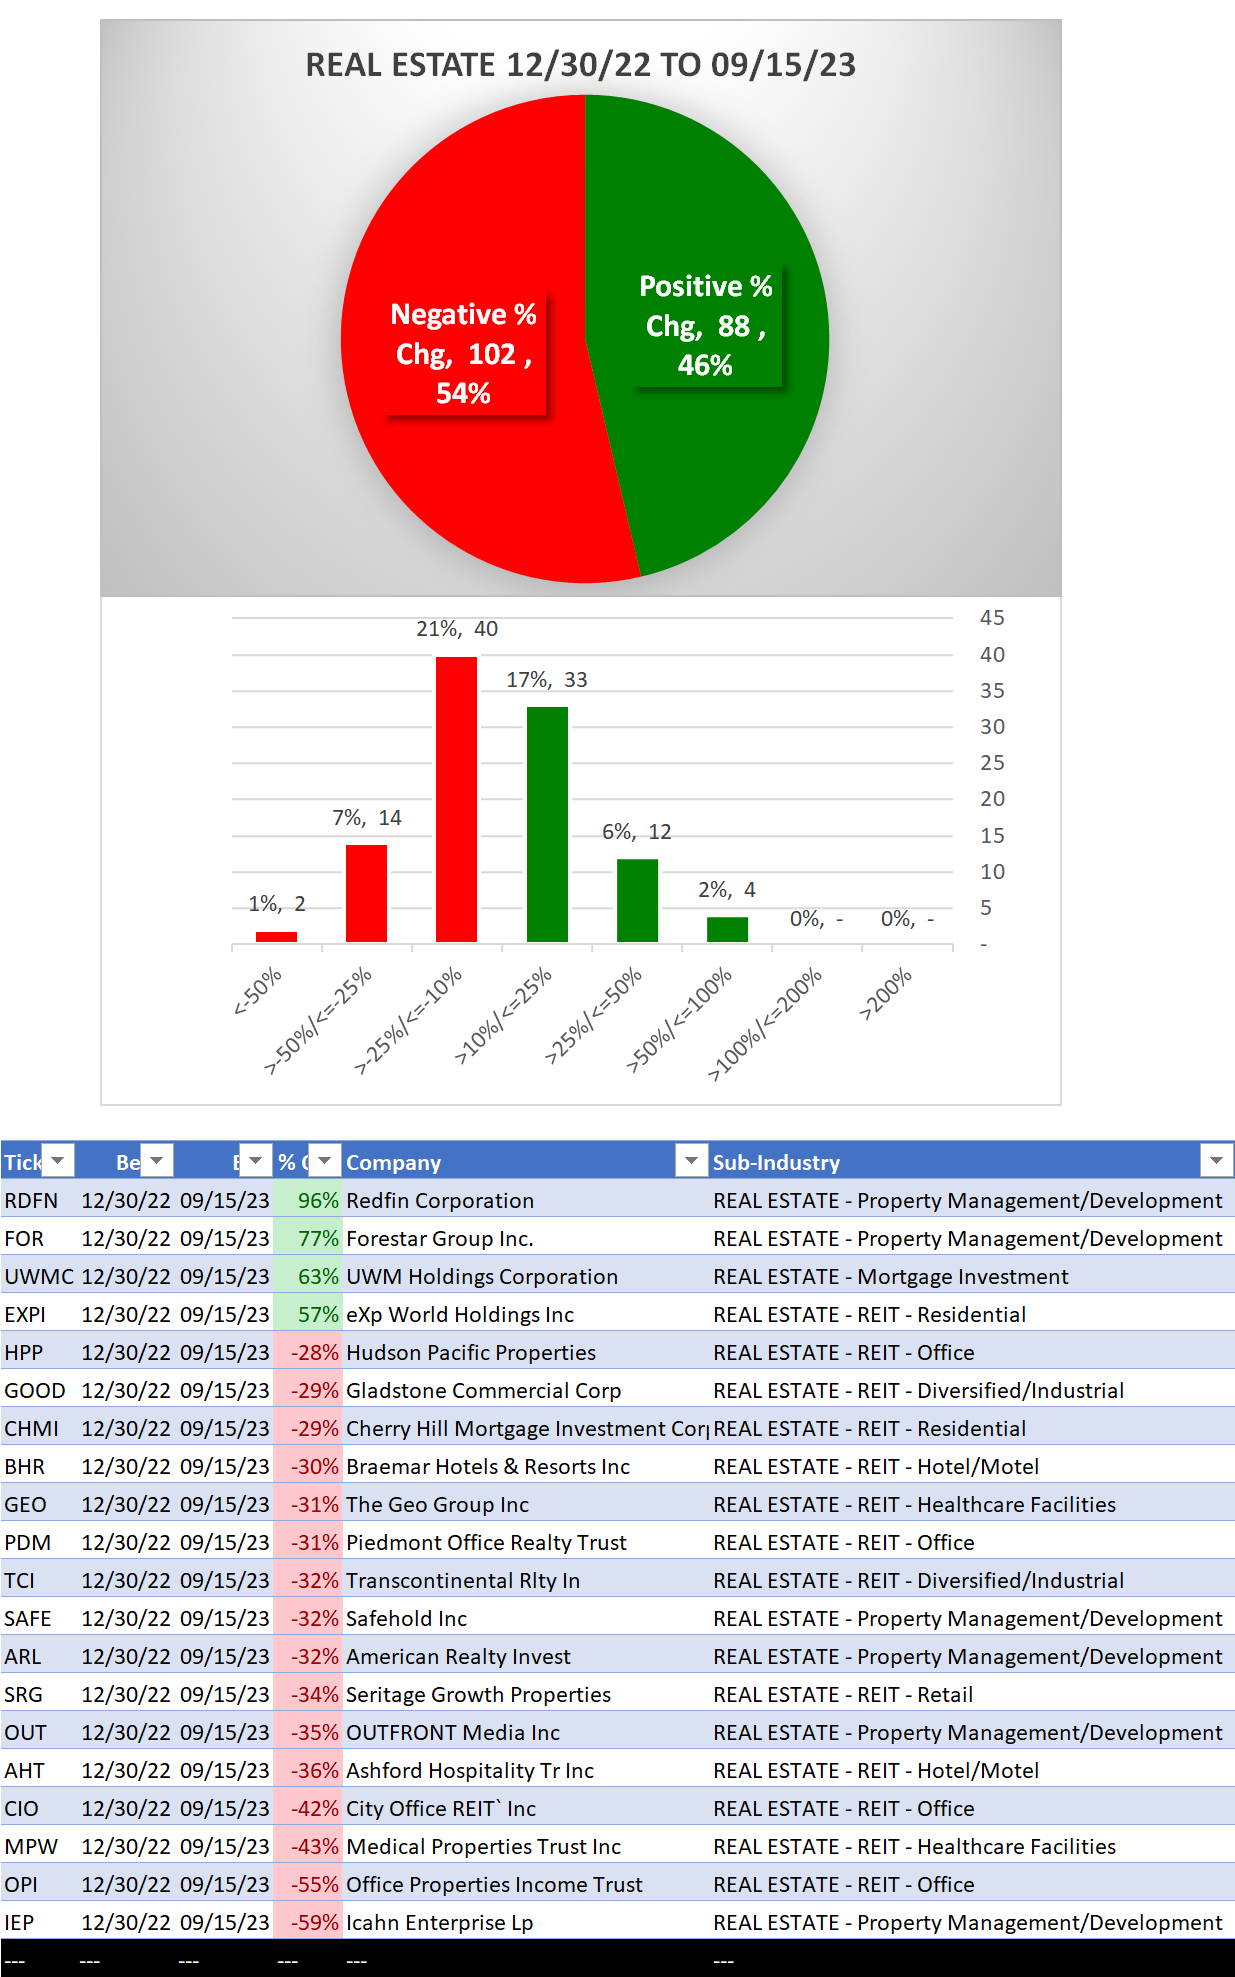
Performance
Bottom line: net flat the past 10 weeks
Context: strengthening recently vs. YTD
- 46% positive stocks YTD
- 66% positive stocks past 4 weeks
Background
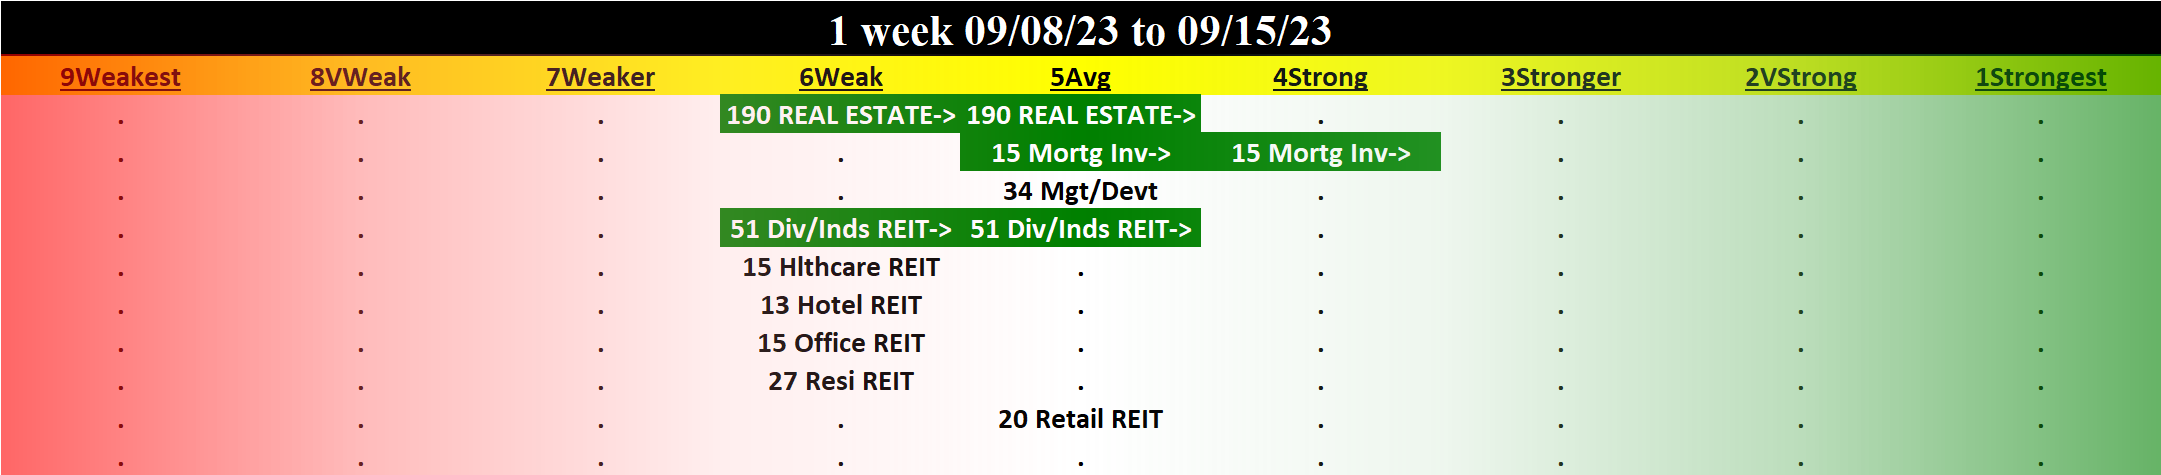
Largest of 8 sub-industries (190 stocks total):
- 51 stocks REIT - Diversified/Industrial
- 34 stocks Property Management/Development
- 27 stocks REIT - Residential
10 Biggest Market Cap stocks: PLD, AMT, BN, PSA, WELL, SPG, DLR, O, CSGP, AVB
DETAIL: 1 week review, YTD/4 weeks lookbacks
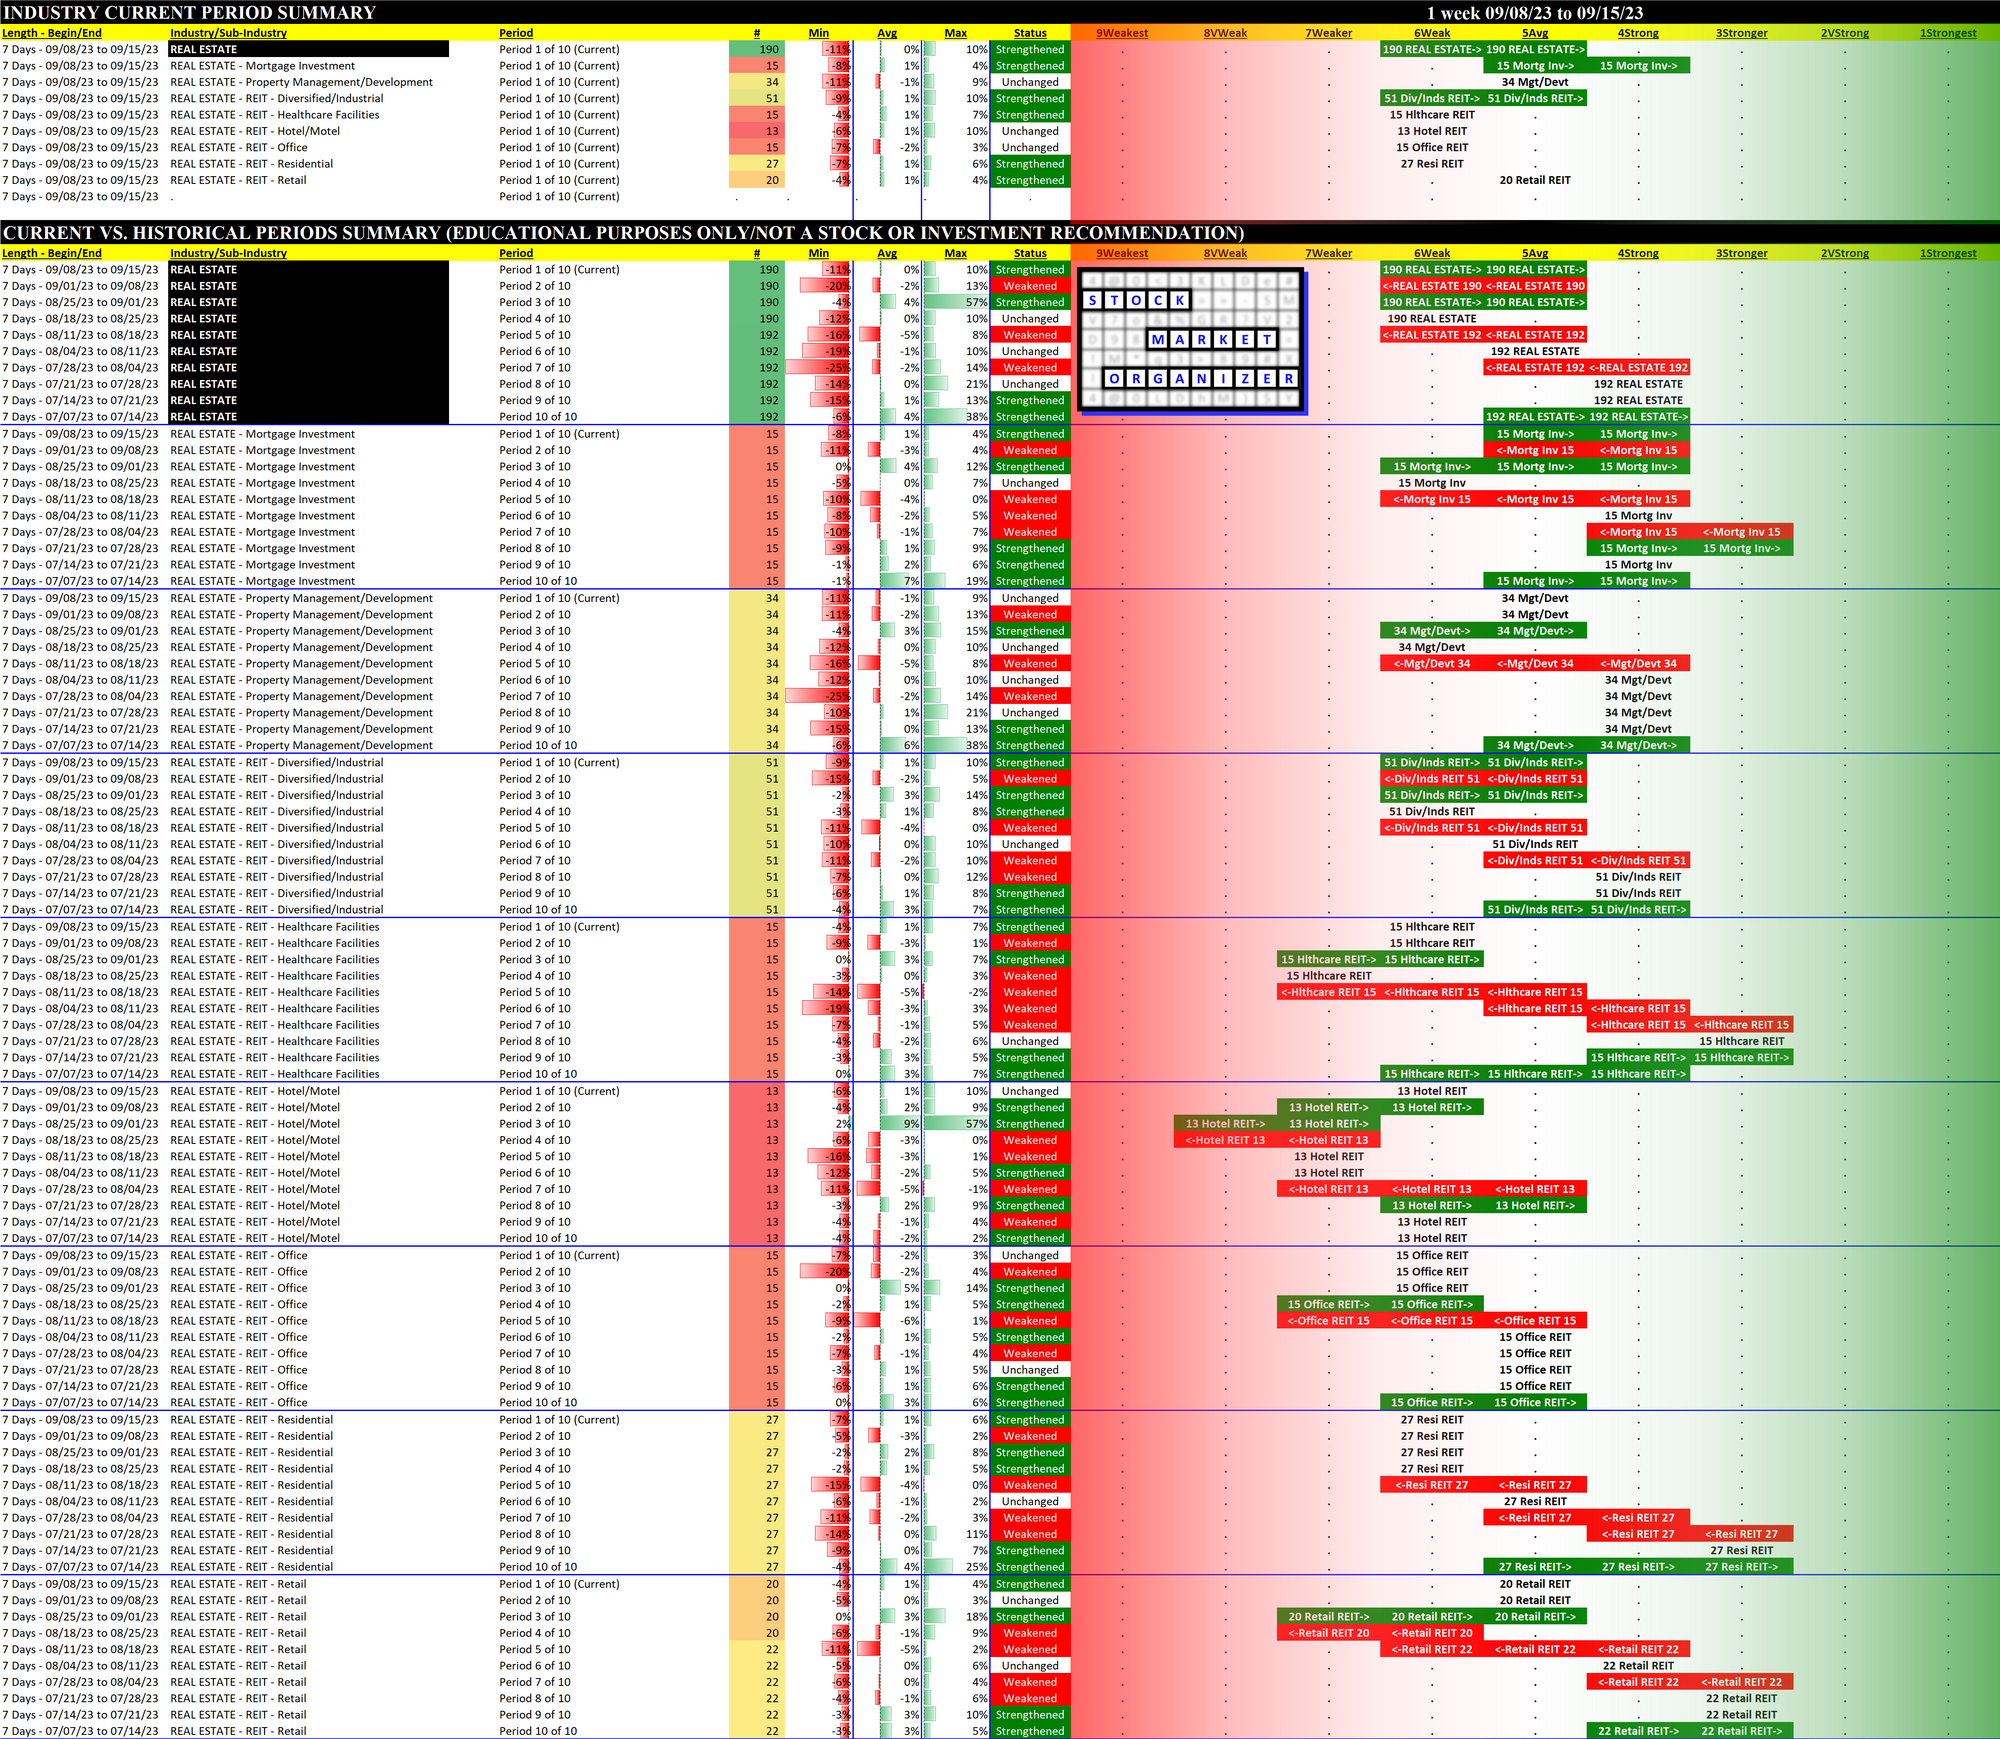
1 Week Review
Strengthened: 2/8 sub-industries
Weakened: 0/8 sub-industries
Strongest at Strong/4th strongest (of 9 levels) rating: Mortgage Investment
Weakest at Weak/6th strongest rating: (tie)
- REIT - Healthcare Facilities
- REIT - Hotel/Motel
- REIT - Office
- REIT - Residential
10-Week Week-by-Week Industry/Sub-industry Strength Comparison
What: recent week-by-week strength changes for the industry and each underlying sub-industry
Why: objective measurement of strengthening and weakening enabling comparison within and across industries and sub-industries
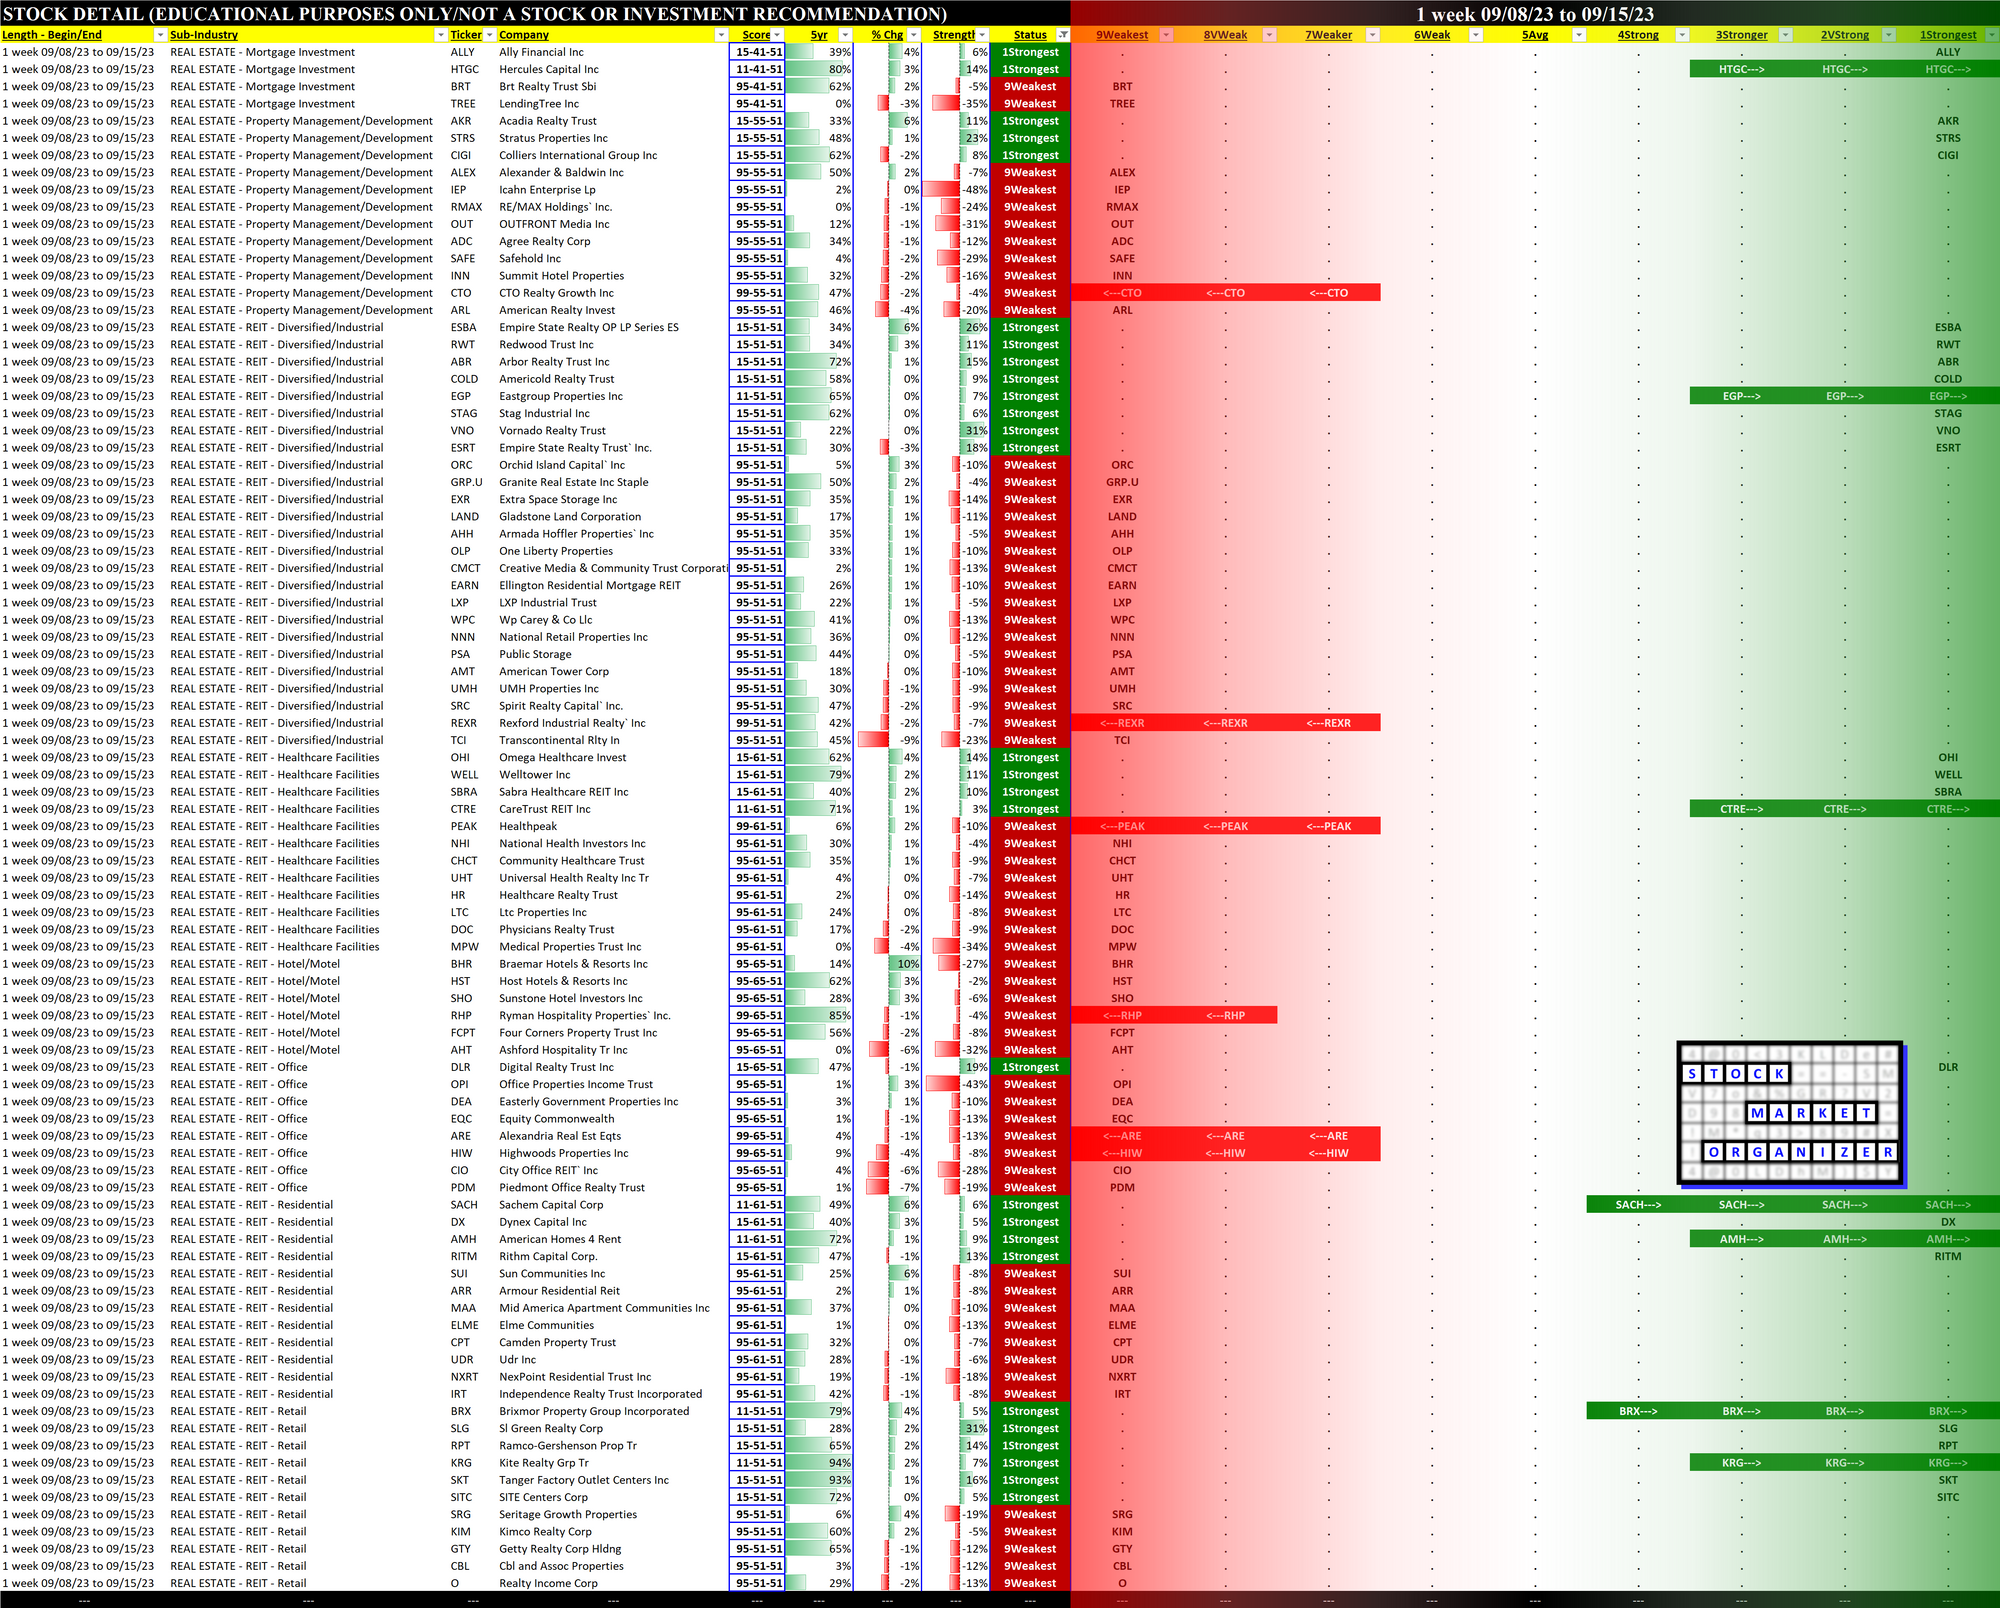
Strongest and Weakest Stocks
What: stocks currently rated Strongest/Weakest (highest/lowest of 9 strength ratings)
Why: most interesting stocks for available capital because
- the Strongest may be meme-stock mania candidates prone to breakouts, and
- the Weakest may be prone to large bottom-fishing/short-covering-driven pops... and may also be primed for bigger and faster falls. (Not guaranteed and not a recommendation - weak stocks in weakening sub-industries may be better shorts than high-flyers.)
YTD Lookback
4 Weeks Lookback