Real Estate 2023-03-09, interest rates are not your friend: what happens when rising cap rates take full effect?
The above is a rhetorical question. The fit will hit the shan.
LaSalle lost 55% on a South Coast Metro (Santa Ana) office building bought in 2019. Bought for $255/sf, sold for $115/sf. Spin it however you'd like, there is no escaping this comp in future appraisals.
Work from home isn't helping general office trends.
How does your 4% cap rate on Phoenix multi-family look when one-and two-year treasures are around 5% and the prime rate is 7.75%?
Will a Fed pivot save you?
Do you believe in miracles and the Fed's ability to pull one off?
(Hint: the market doesn't care what you believe.)
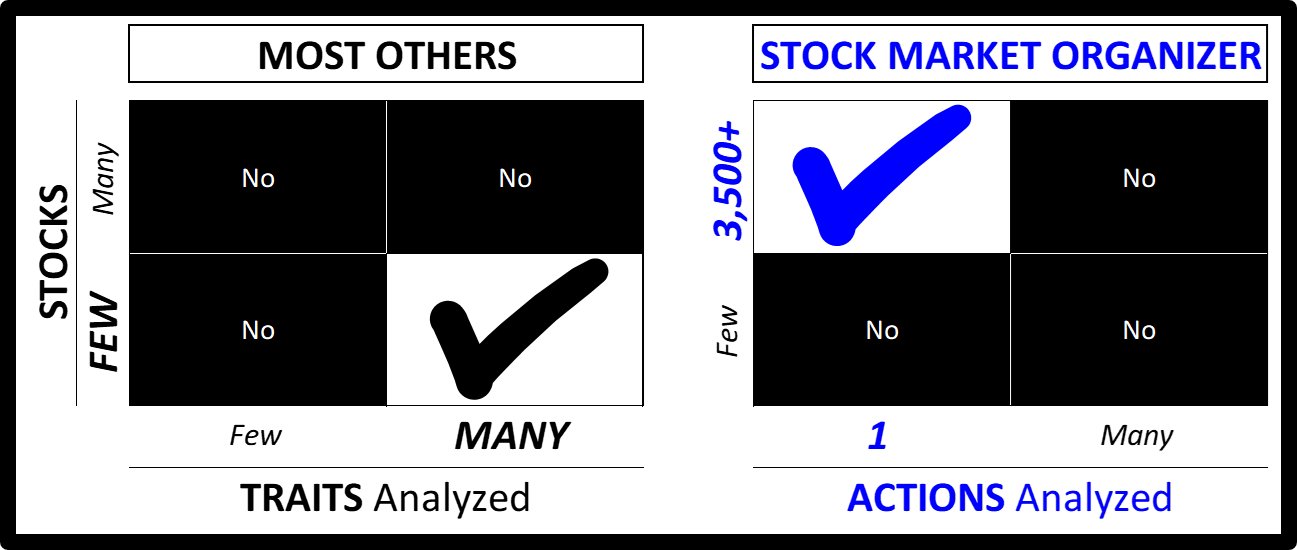
Q: What am I bringing to the table? A: Objective, repeatable strengthening action measurements
In other words, a straightforward measurement of how stocks, sub-industries, and industries compare to each other in terms of strengthening and weakening.
One can measure traits of stocks. P/E ratios, sales growth, profit margins, and so on. Warren Buffett has certainly shown the value and importance of such analysis. And many have profited in the market by following his methods. It is possible to stop at this analysis level and be perfectly successful and content.
But for others looking for a different way, a way to diversify strategies beyond value investing... how do you meaningfully weight these traits in a consistent way that also translates to sub-industries and industries? You may ask "why do I care about doing that?" Because it is clear to even the most casual observer that sub-industries are impacted by industry trends, and individual stocks are impacted by sub-industry trends.
More to the point - most stocks decline when the market falls (estimates are 9 of 10) and most stocks rise when the market rises (typically 3 of 4).
What I show you in my analyses is how individual stocks compare to their sub-industries and industries. I do this by measuring not multiple traits for a few stocks, but by measuring one action for all stocks of a minimum price/trading volume.
Example: Real Estate
Real Estate is a tailor-made example of a market slice where sub-industry and industry analysis is genuinely relevant. One important method for calculating values is the income approach, where a key metric is cap rate. Simply enough, the lower the cap rate, the higher the value. And vice versa.
The higher your cost of borrowing, the higher must be your cap rate.
So, now that interest rates have risen so much in the past year, what is going to happen with cap rates?
And what does that mean for real estate values?
Ask the sales brokers and their sellers who have a fat bid-ask spread that isn't being bridged. Someone will blink. Who might that be?
Borrowers still have to re-finance maturing mortgages. But what happens when the underlying real estate values have declined relative to the outstanding debt? Ask Brookfield, Blackstone, and Columbia Property Trust.
For holders of stocks in the Real Estate industry, some may be counting on dividends to get them through a period of declining stock prices. Yet, they might want to think about whether if Intel(!) can cut its dividend by 66% then might their favorite REIT eventually run into issues that cause them to cut their dividend?
So what? The Stock Market Organizer difference
Join me as I regularly track what happens strength-wise in the real estate and other industries. This graphic summarizes what I do differently than others:
This leads to the following industry-level view of Real Estate, which allows you to compare sub-industry strength:
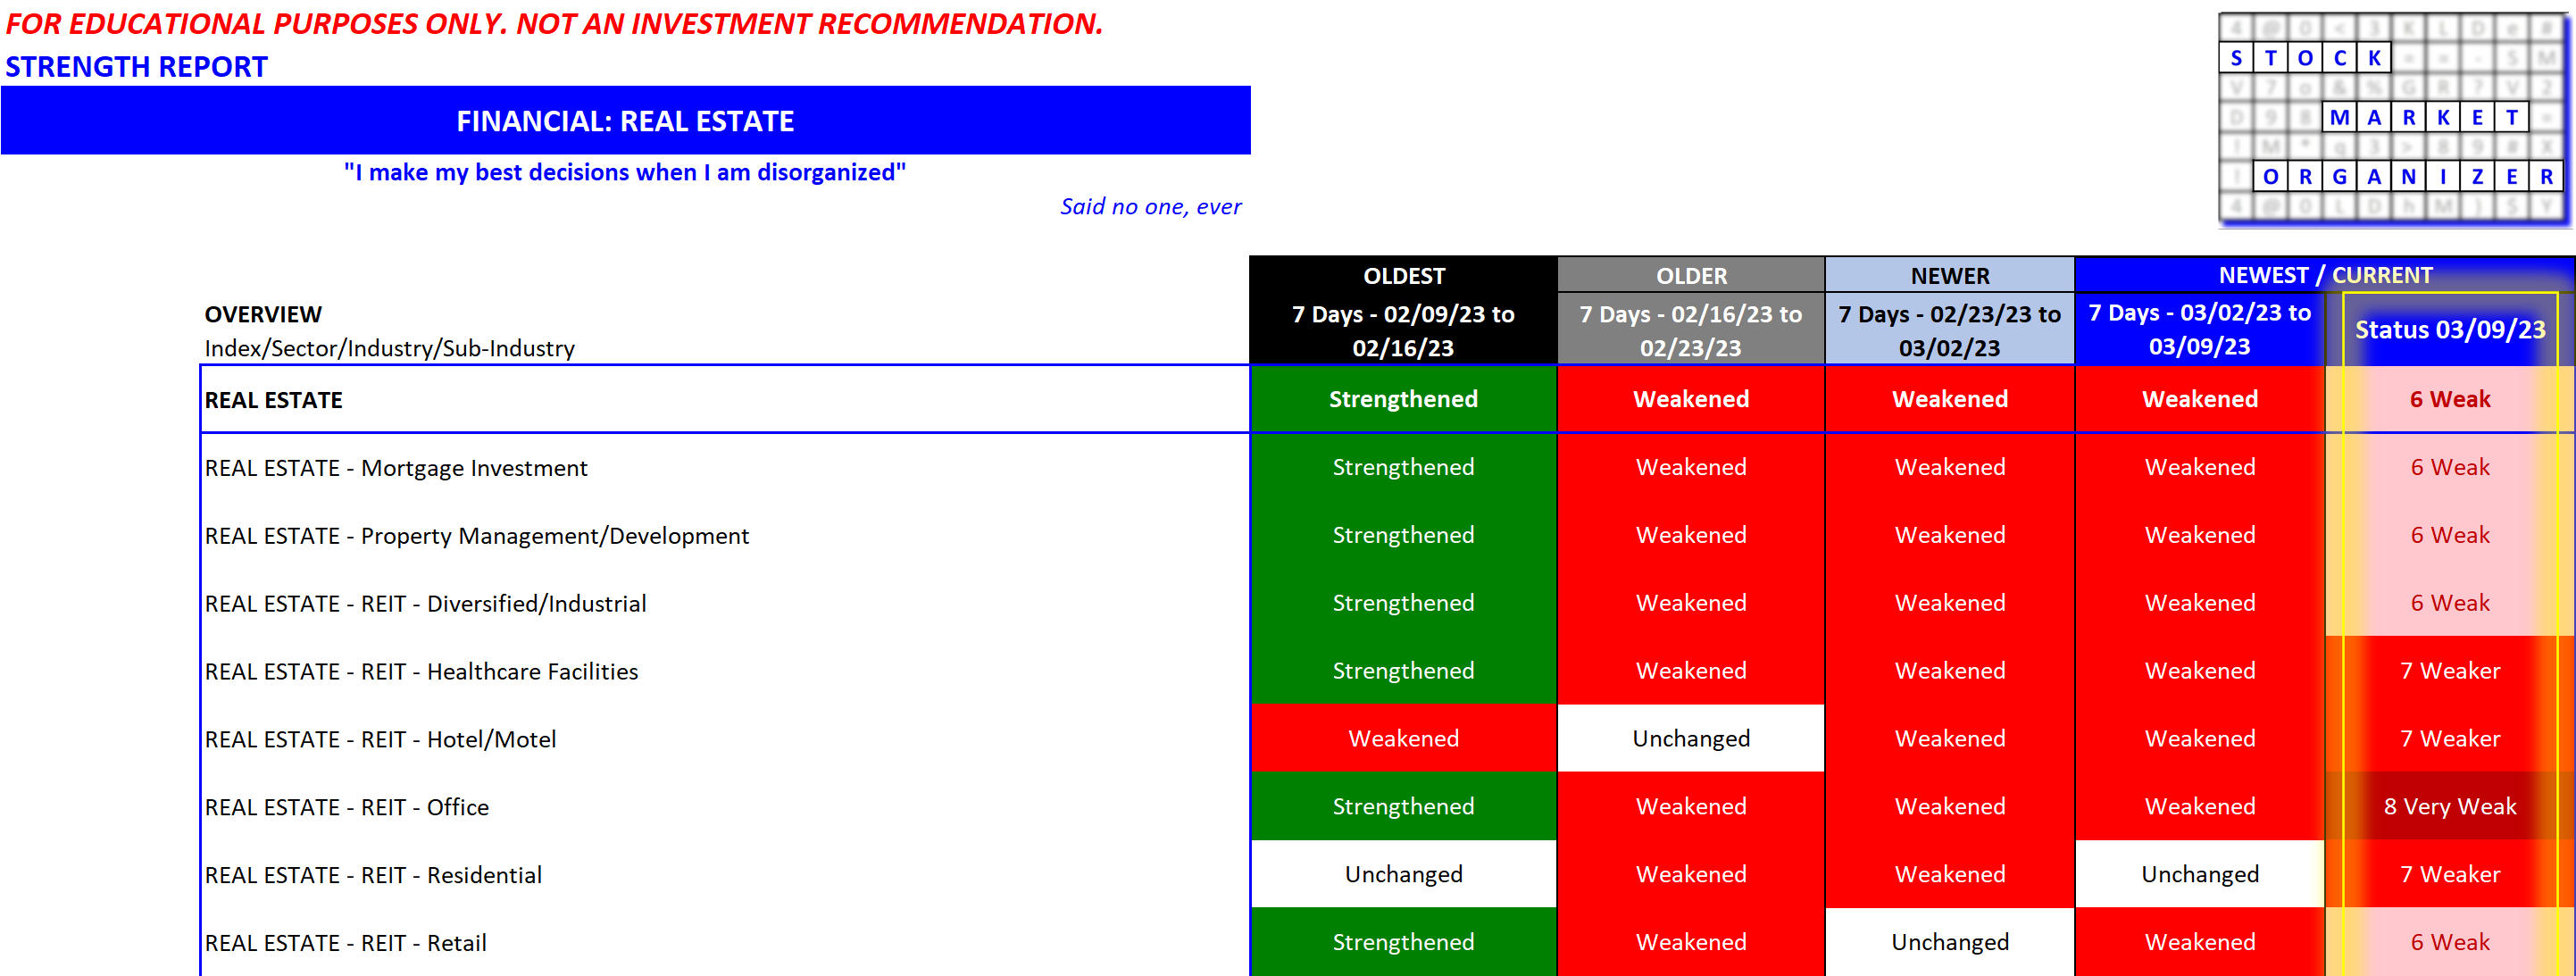
Note that Office is comparatively the weakest sub-industry. Not surprising. Is there any other perspective available to you elsewhere that so quickly provides such a comparison?
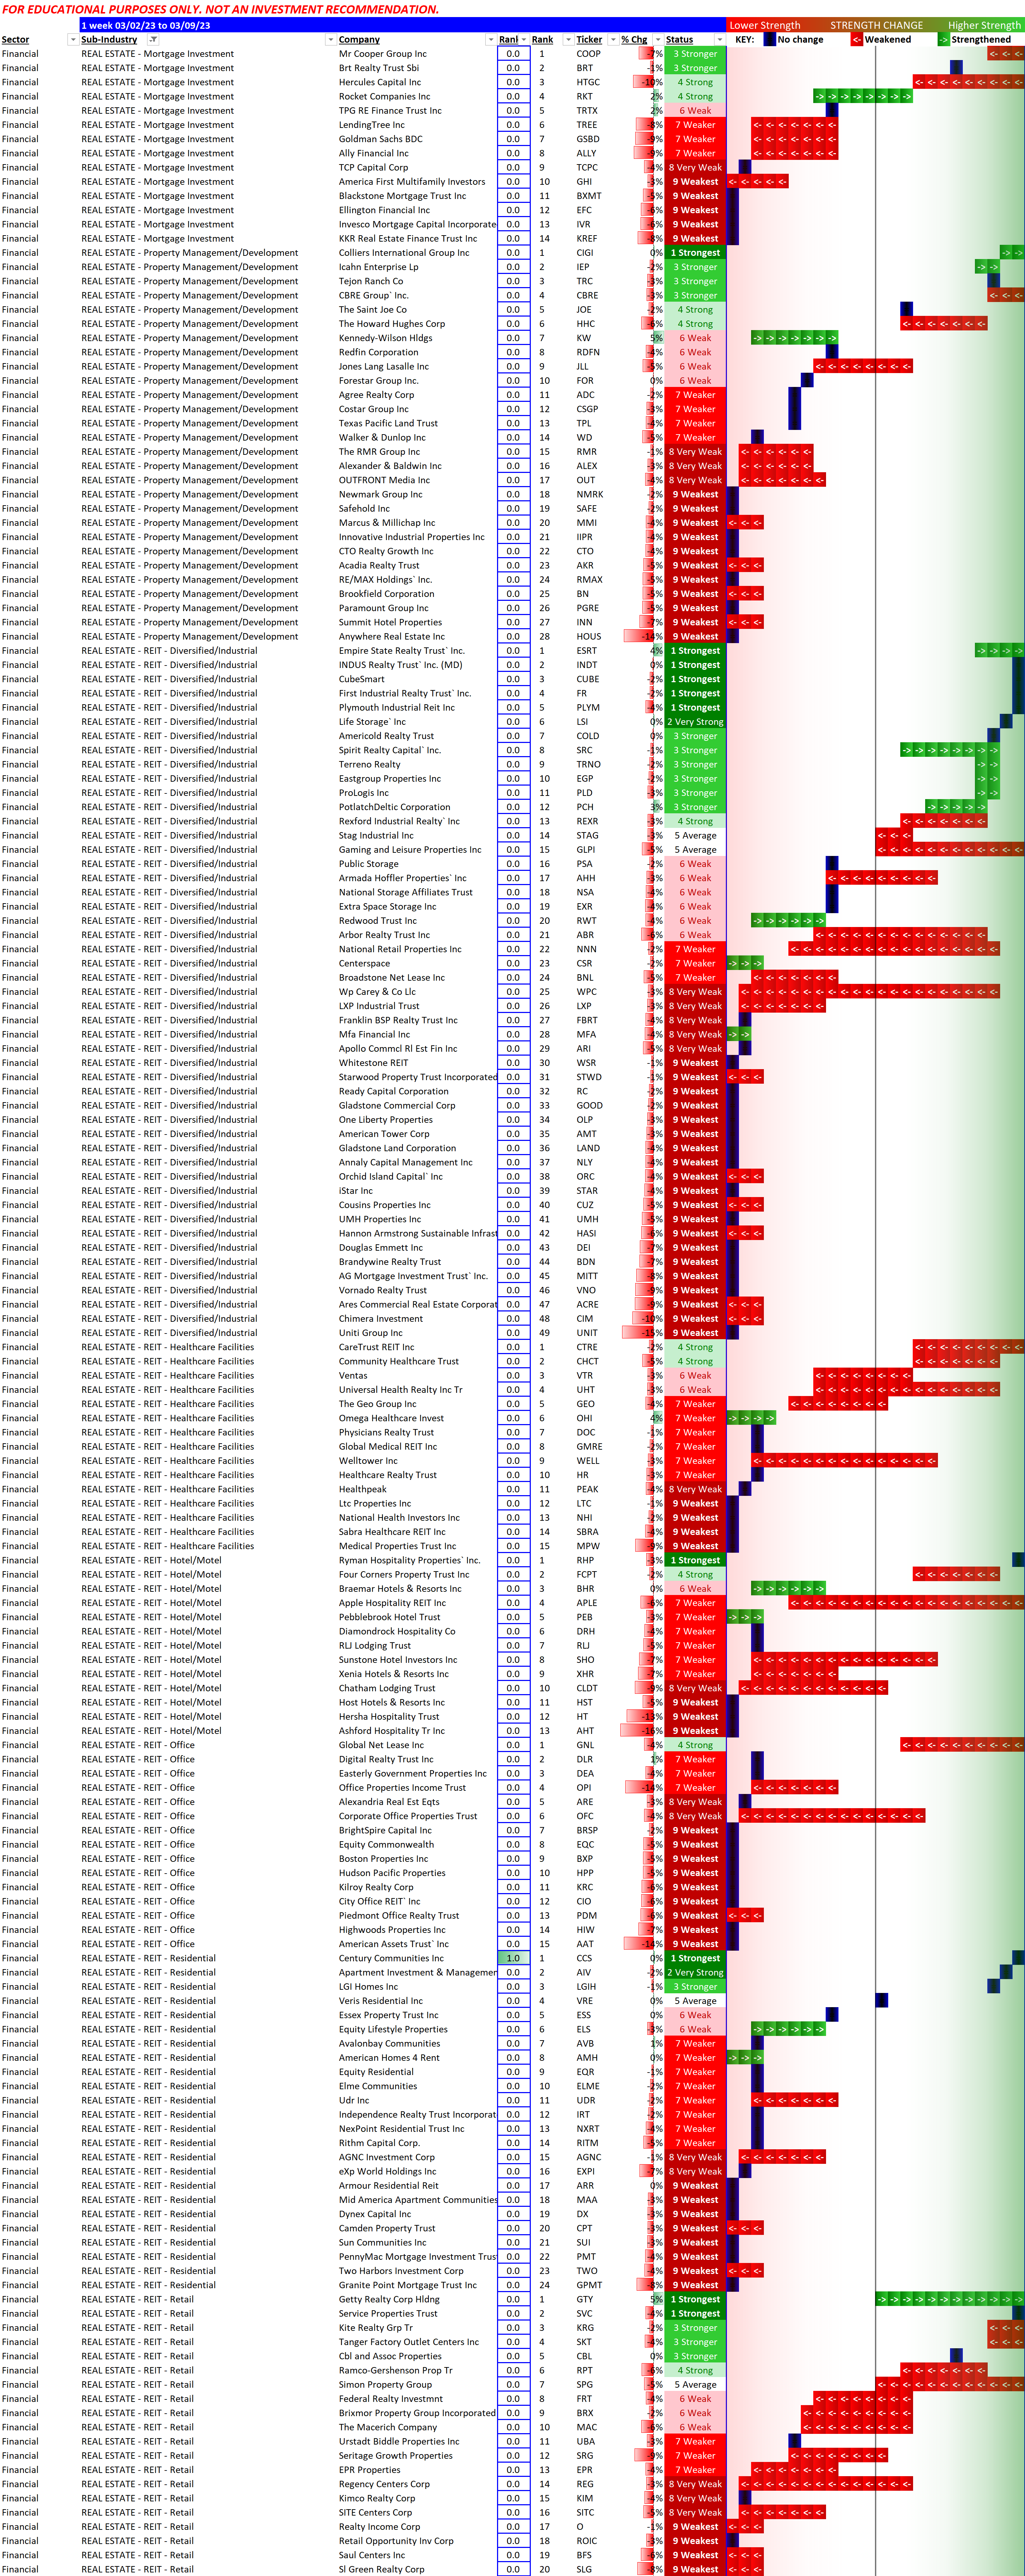
In turn, the underlying stock-by-stock detail is shown below. Once you get used to it, it is very simple. And helps you quickly understand where in the industry and component sub-industries there is strength.
Why is strength important?
The market is not dumb. All of us are smarter than any of us. 24/7/365 there are rocket scientists with unlimited computing power focused on extracting returns from the market. Price movement is a result of the actions and inactions of everyone involved in the market. Prices get out of line with fundamentals due to human emotions of fear and greed.
But on the whole prices reflect reasoned analysis of each stock's prospects. Thus, stocks strengthen for a reason, and other stocks weaken for a reason. It is not random.
By tracking how strong stocks are relative to each other, and the same with sub-industries and sub-industries, I am simply measuring what is the market's standing opinion on each. Not the opinions of the 10, 20, 50, or 100 smartest investors on the planet: the combined opinions of ALL market participants. And this is the one opinion that counts.
Find out what we all think by measuring strength, stock by stock, and then act appropriately.