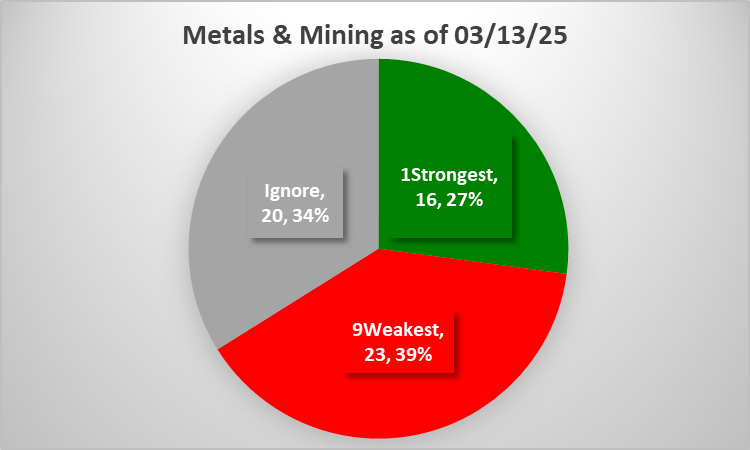
Metals & Mining Industry 2025-03-13: 5Average strength rating (Strengthened one rating)
This post is organized as follows:
I. Introduction
II. Market Environment - HEADWIND
III. Industry Background
IV. Industry/Sub-industry Recent Performance - Tailwind
V. Stock Details
I. Introduction
This post provides detail on the Metals & Mining industry - specifically:
🔹 An objective measurement of industry strengthening and weakening so you can objectively compare recent strength and weakness across/within industries and sub-industries.
🔹 A listing of stocks from 1Strongest through 9Weakest (highest/lowest rating of 9 levels) by sub-industry. Generally, stronger stocks rated 1Strongest have less overhead supply to impede further price appreciation. Meanwhile, weaker stocks rated 9Weakest may 1) be prone to “pops” from bargain hunting and short-covering yet, due to preceding weakness, are 2) also prone to falling far and fast from holders "throwing in the towel."
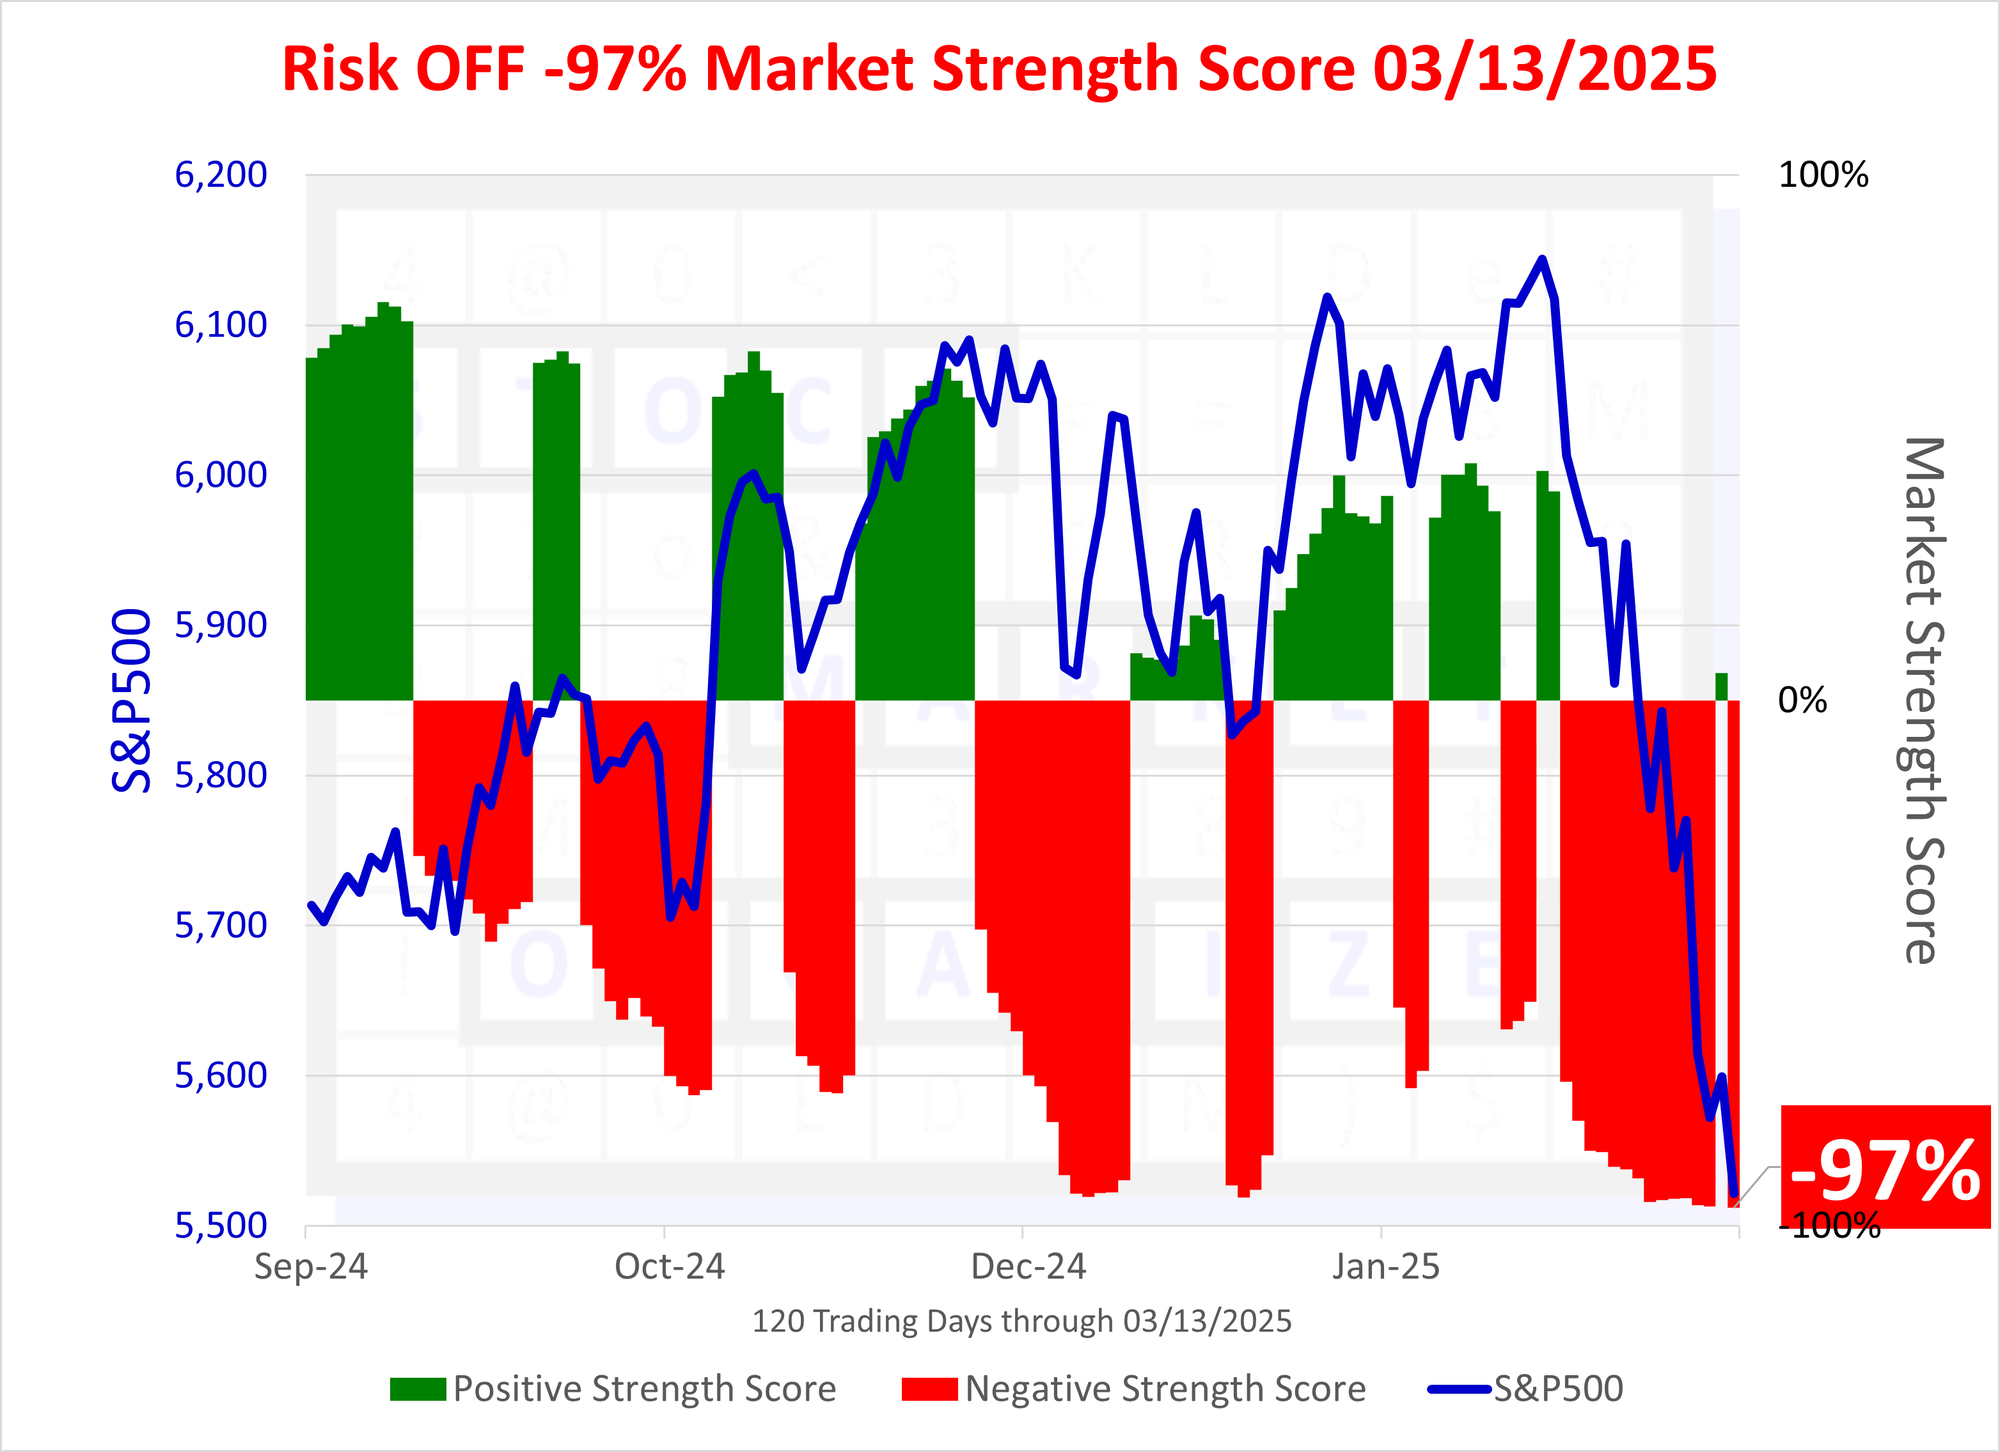
II. Market Environment
This system seeks to understand the current market environment before considering sector, industry, sub-industry, and stock-level strength. There is no guarantee this objective measurement will remain either favorable to longs (tailwinds present) or unfavorable (headwinds present). The critical factor is this acknowledges the clear influence market factors have on the levels below it and lays the groundwork for subsequent principle-based decision-making.
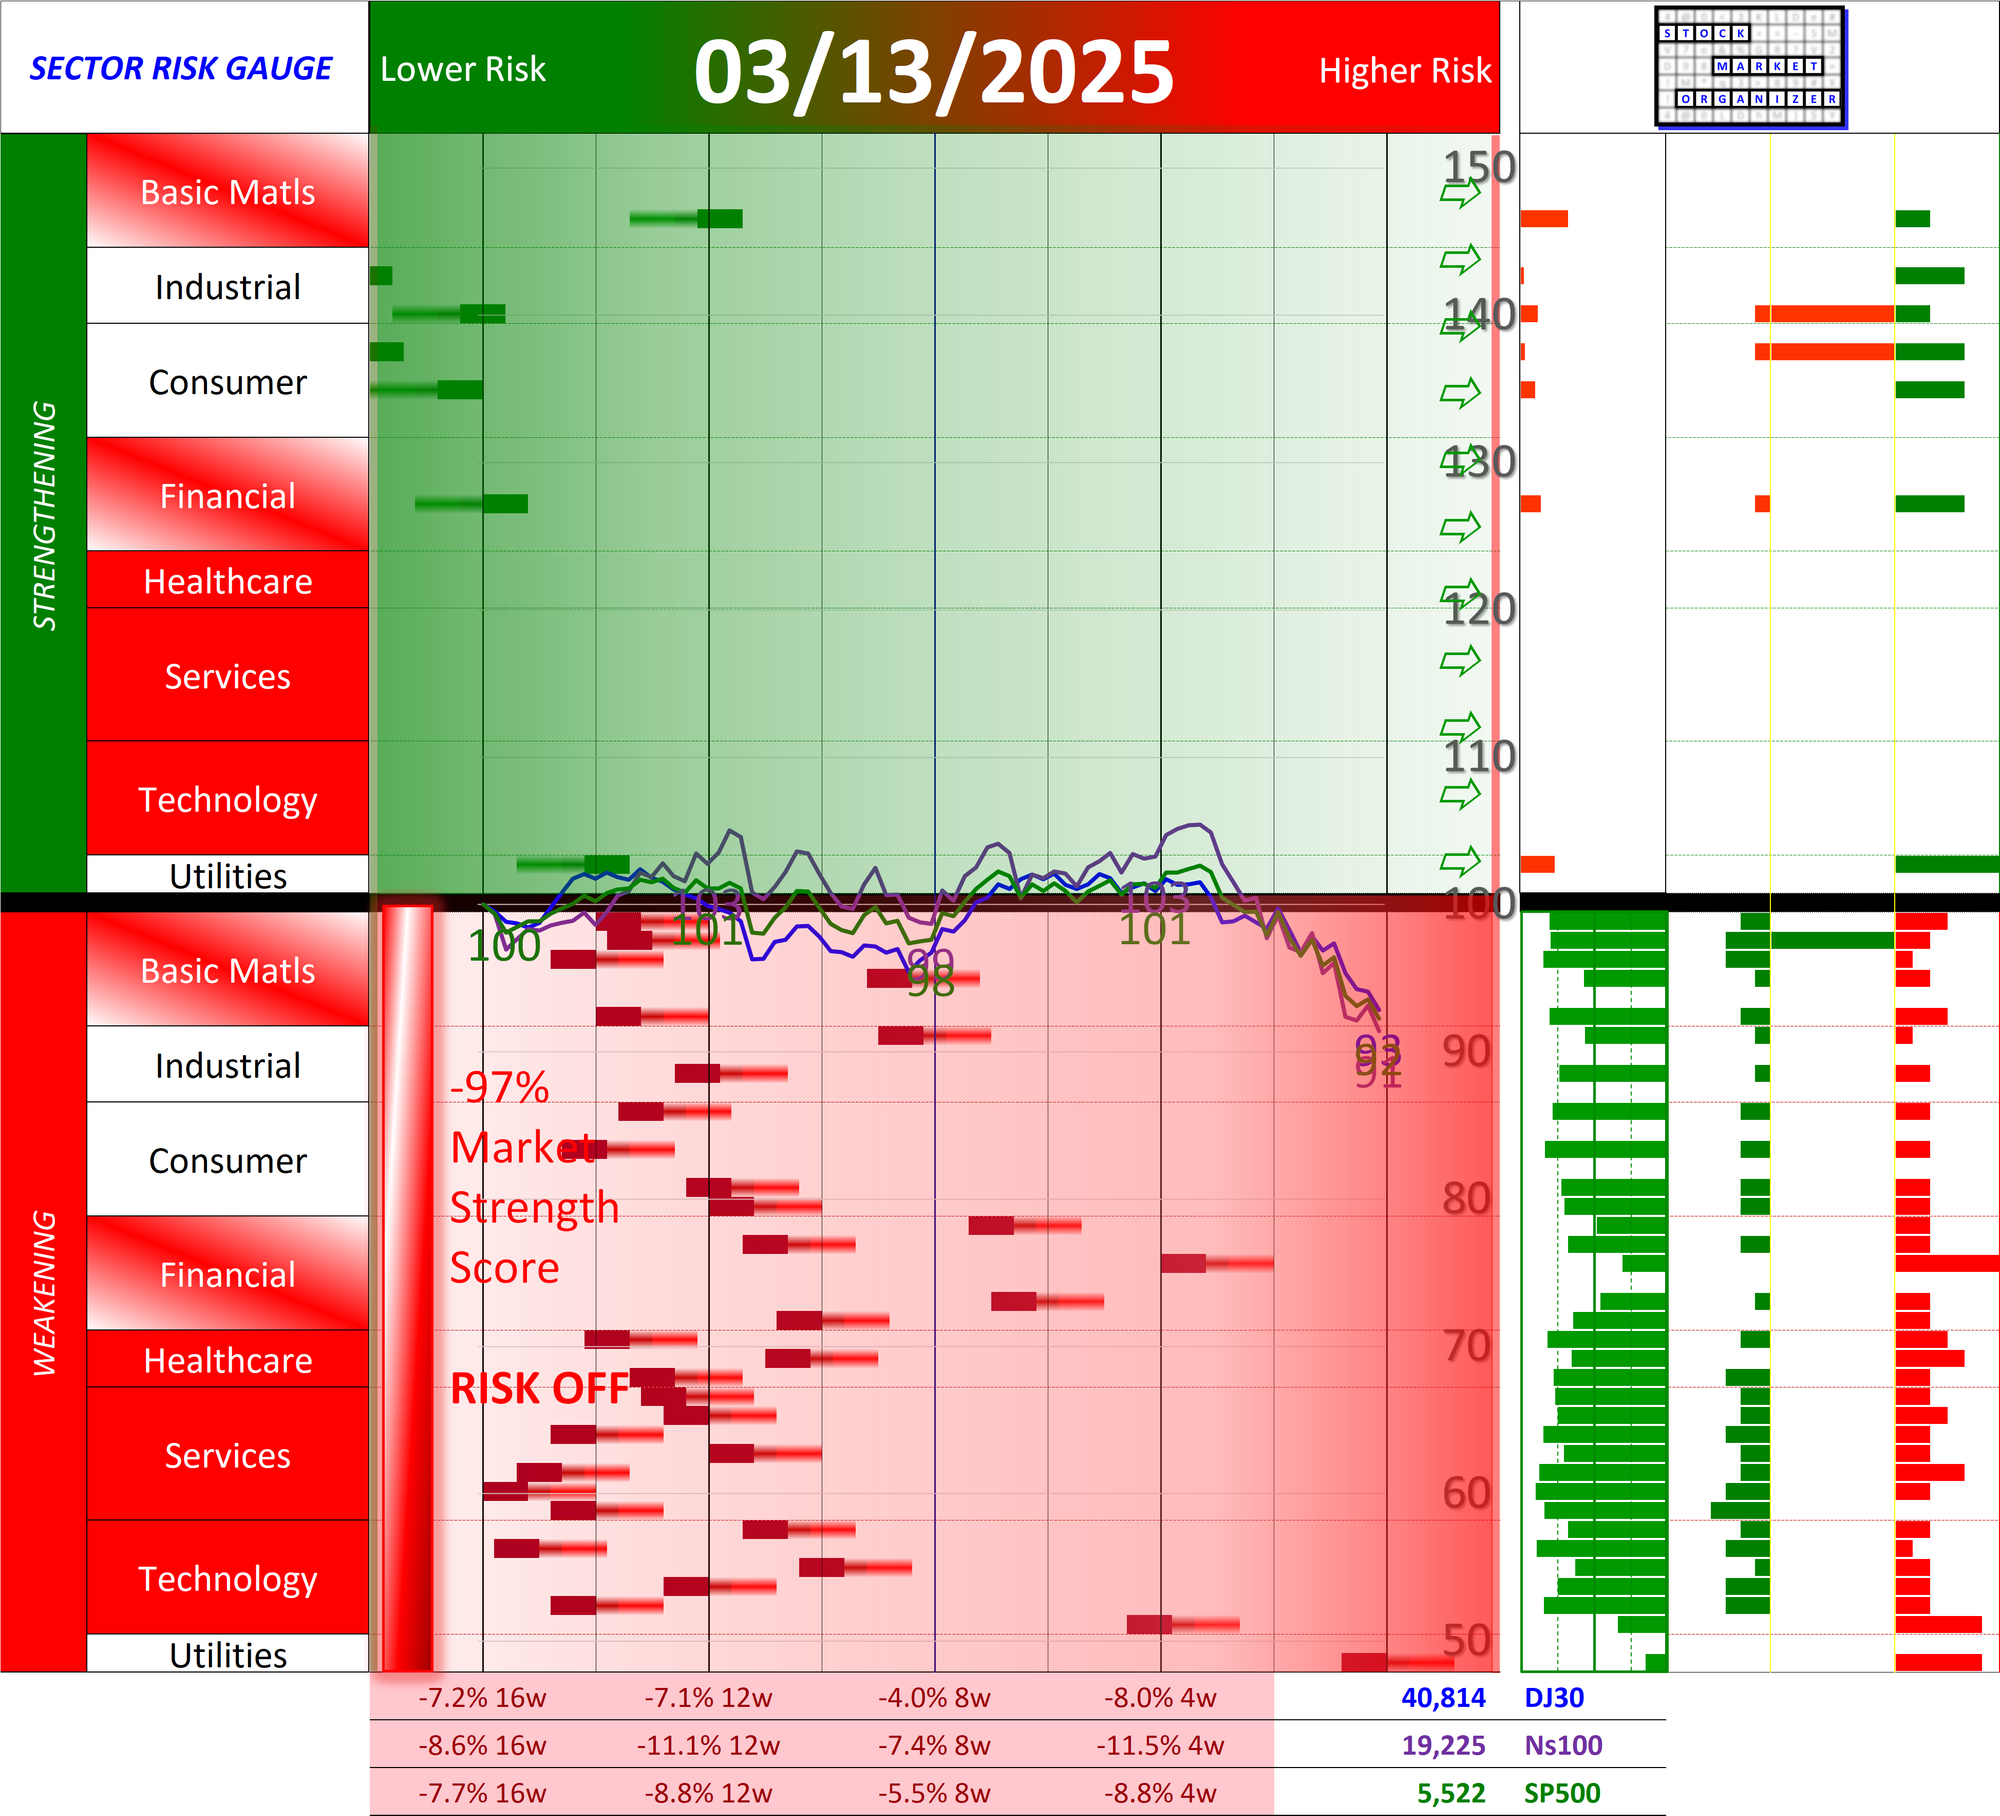
The current strength score is -97% as shown below. The lower bound for this score is -100% so, while of course not guaranteed that will happen, there is room to fall. While there is not much more room to fall, current levels are anecdotally highly correlated with high volatility. There is no way to determine the amount of index points that would be associated with a fall to -100%. Please see this post for a look at two key times the strength score reached -100% (the Great Financial Crisis and the COVID-19 Pandemic).
Here's today's associated Sector Risk Gauge:
III. Industry Background
Largest of 7 sub-industries (59 stocks, average 8):
- Industrial Metals & Minerals (17 stocks)
- Gold (13 stocks)
- Steel & Iron (11 stocks)
- Silver (9 stocks)
Top 10 Market Caps:
SCCO/Southern Copper Corp, FCX/Freeport-McMoran Inc, NEM/Newmont Corporation, AEM/Agnico Eagle Mines Ltd, GOLD/Barrick Gold Corp, NUE/Nucor Corp, WPM/Wheaton Precious Metals Corp, FNV/Franco Nevada Corp, TECK/Teck Resources Limited, STLD/Steel Dynamics Inc
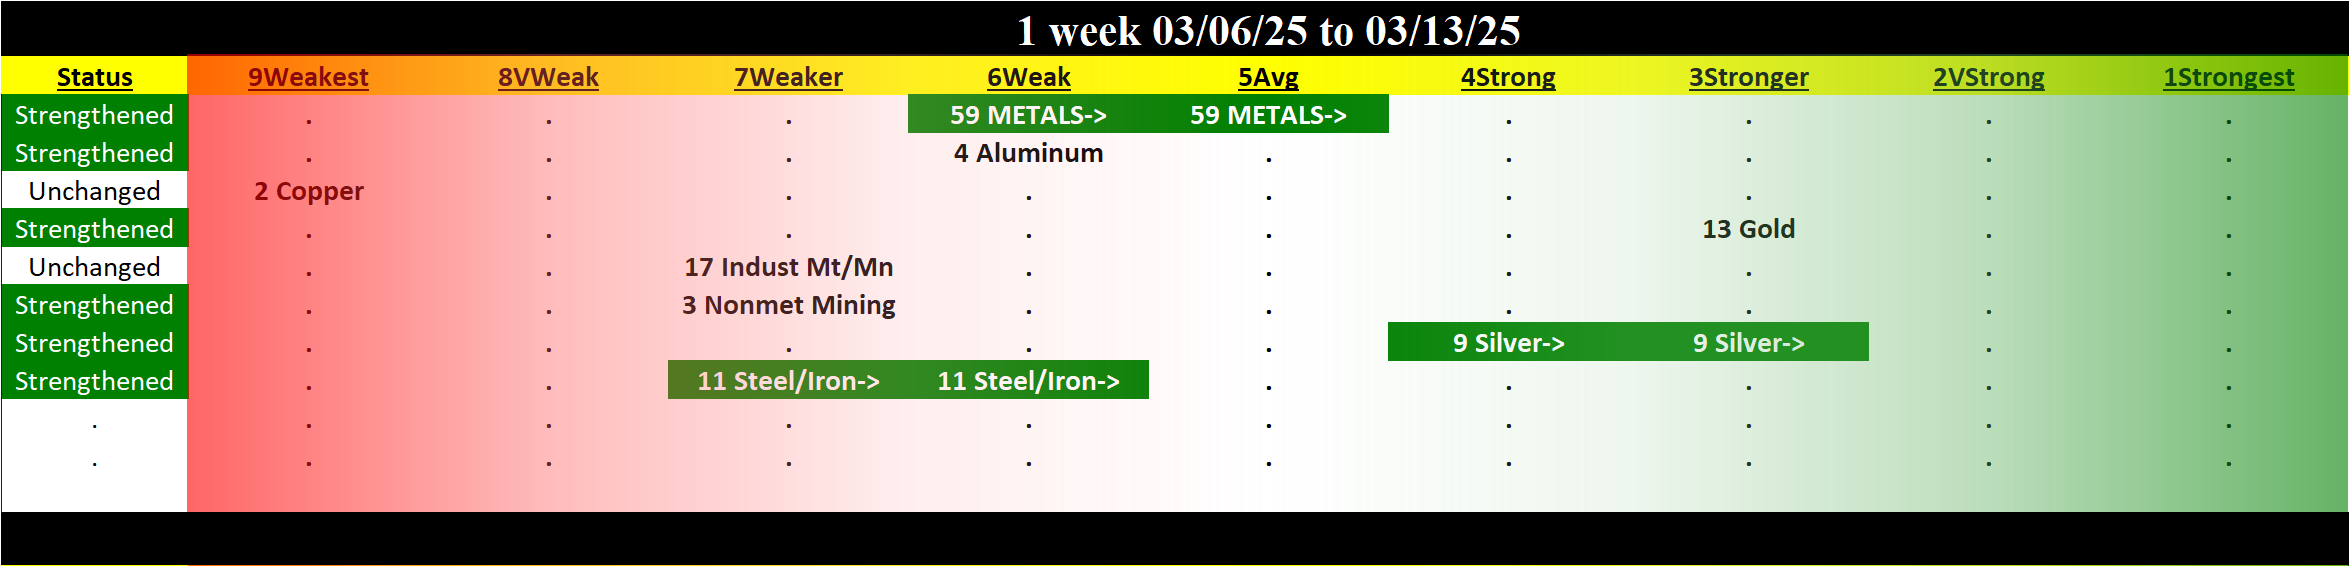
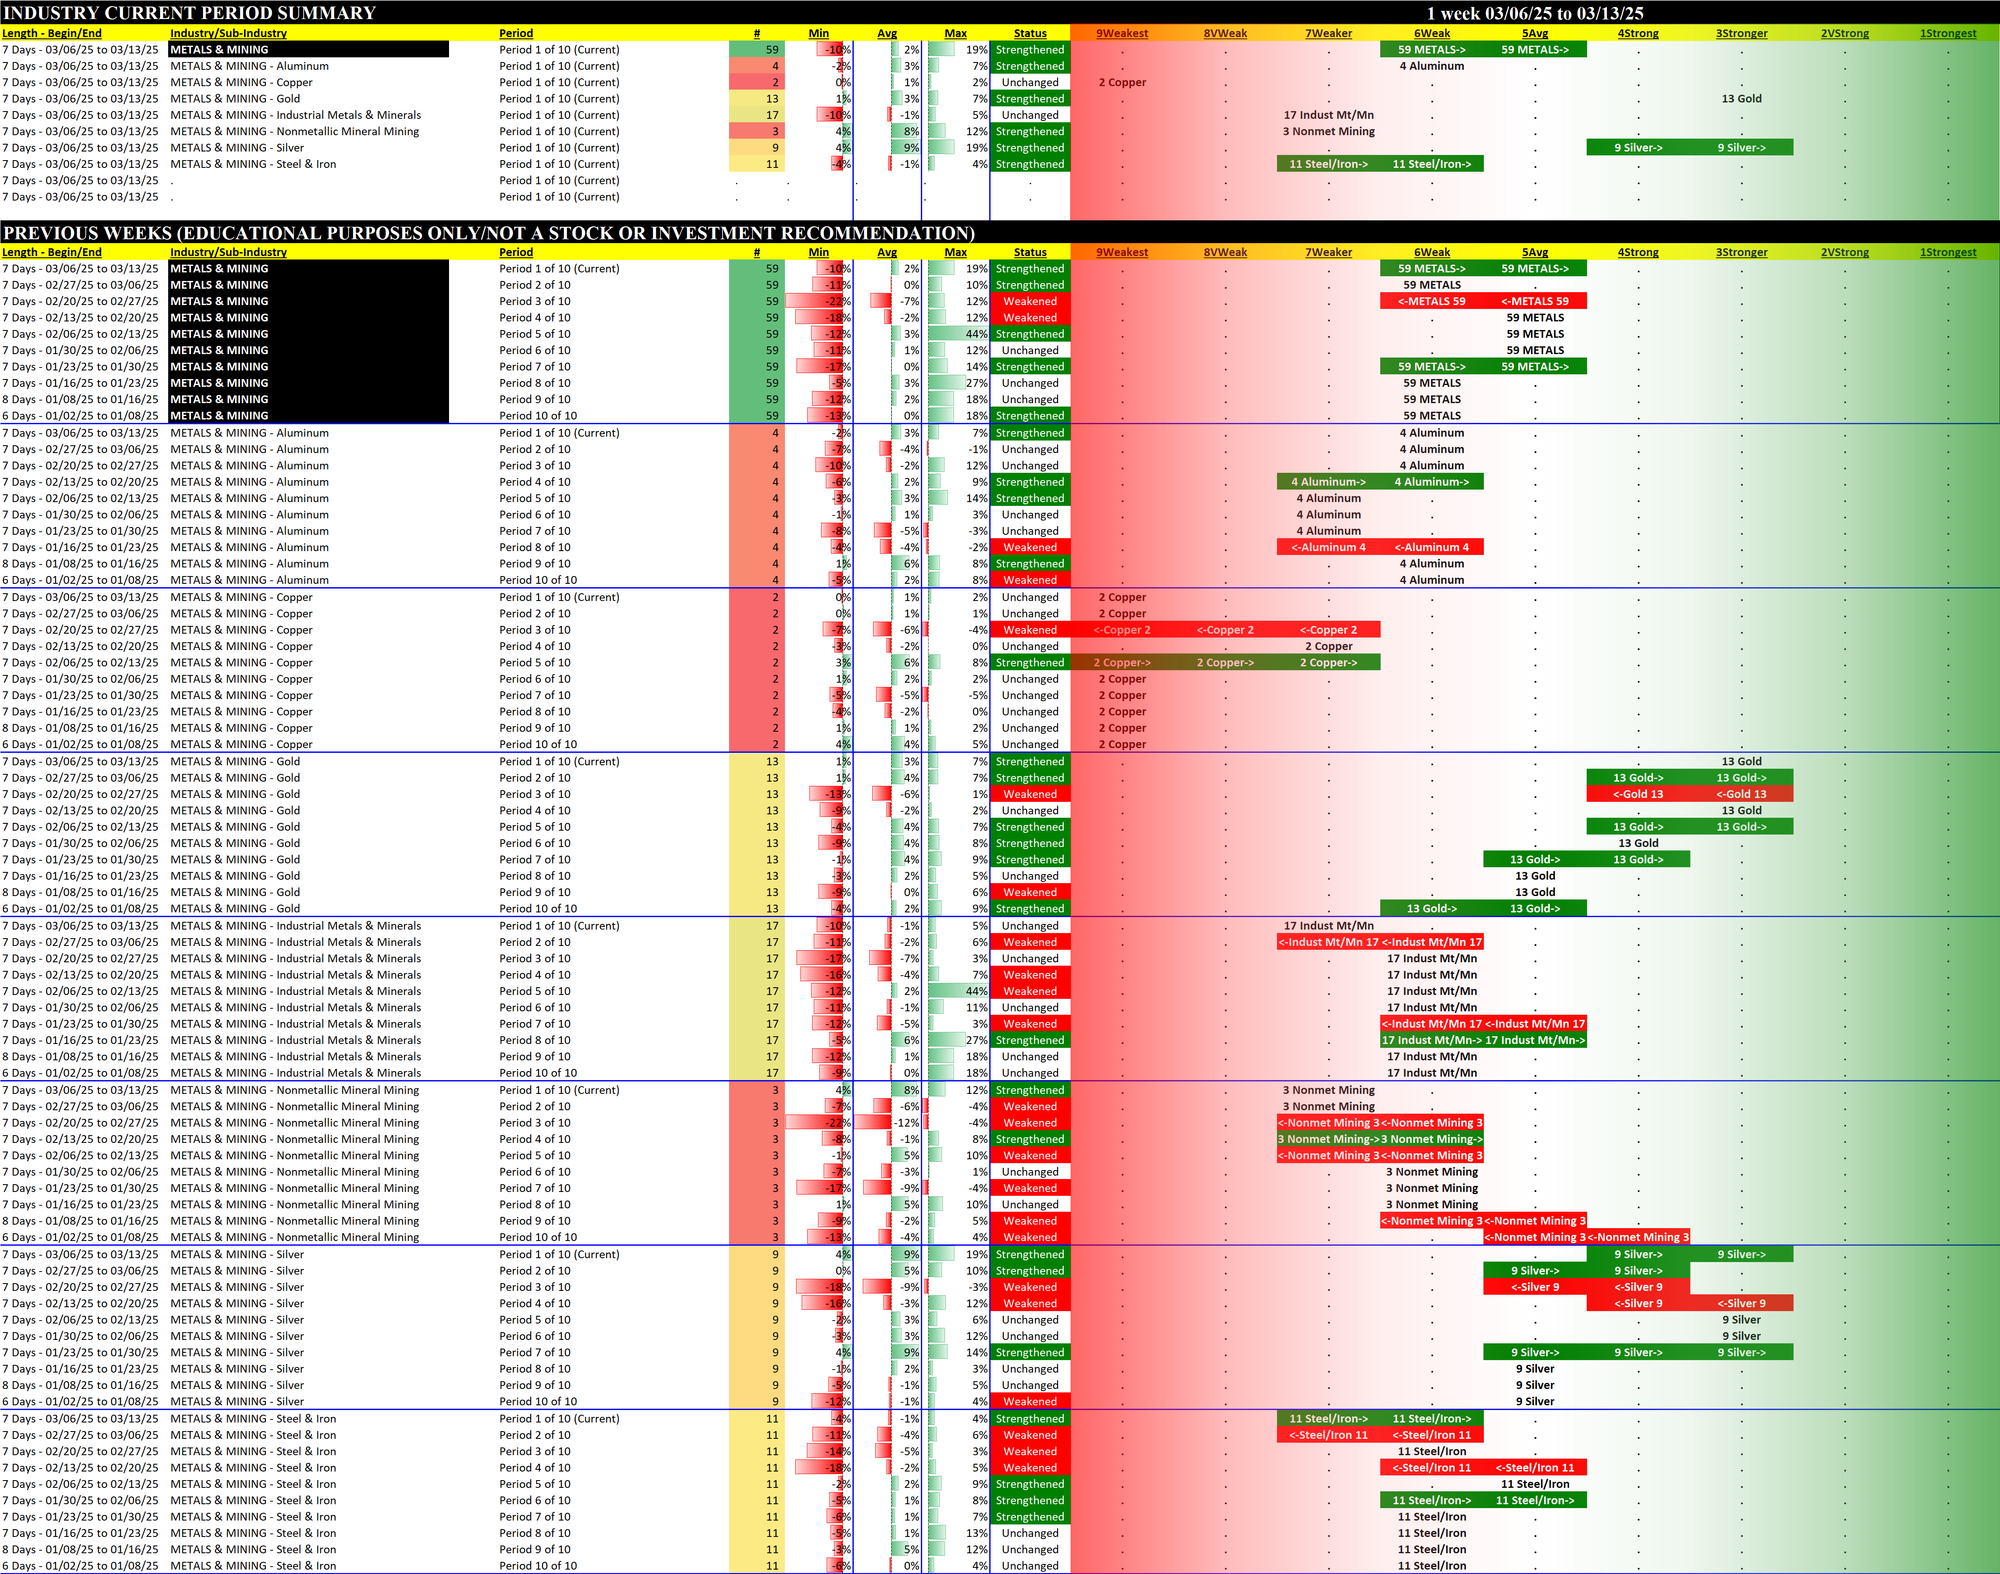
IV. Industry Recent Performance - 5Average Strengthened one rating = Tailwind
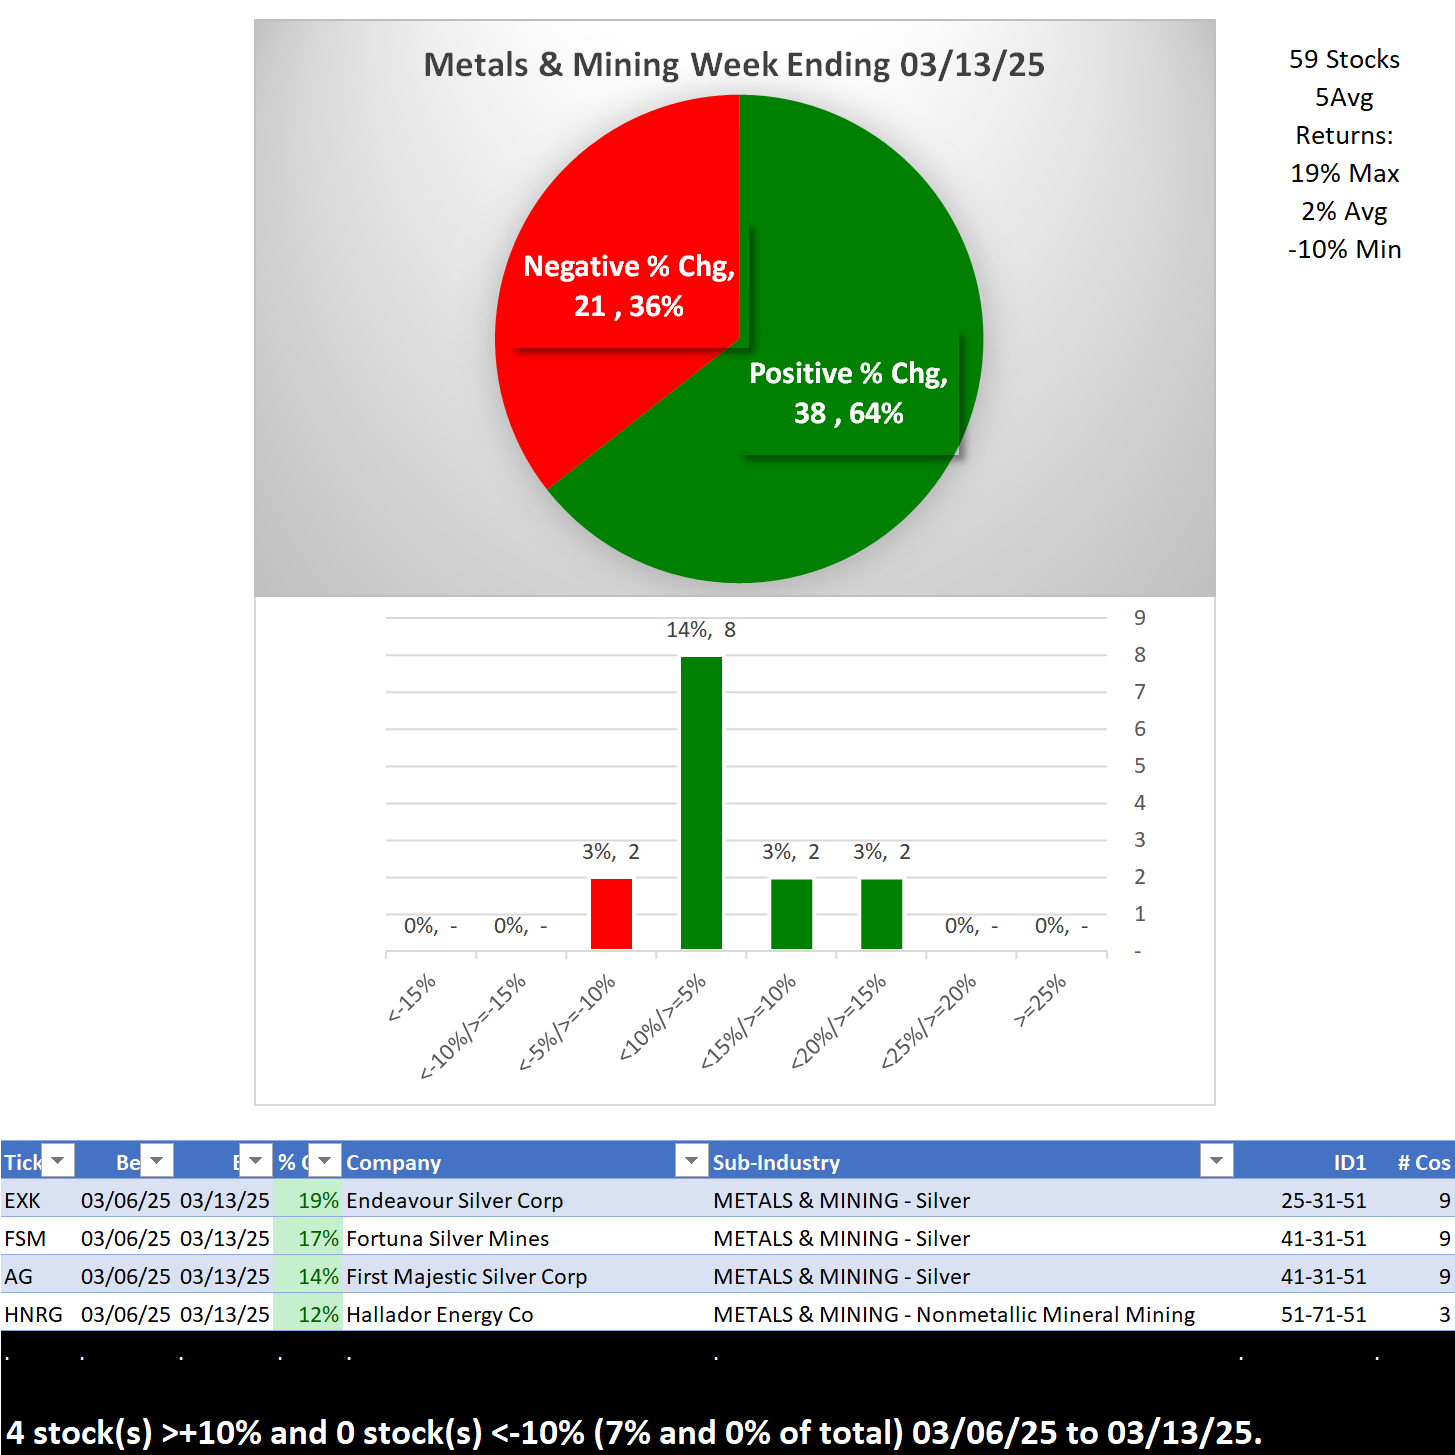
The following summarizes this week's positive/negative performance and major outliers (greater than +10% and lesser than -10%) and the past 10 weeks ratings and changes for the Metals & Mining sub-industries.
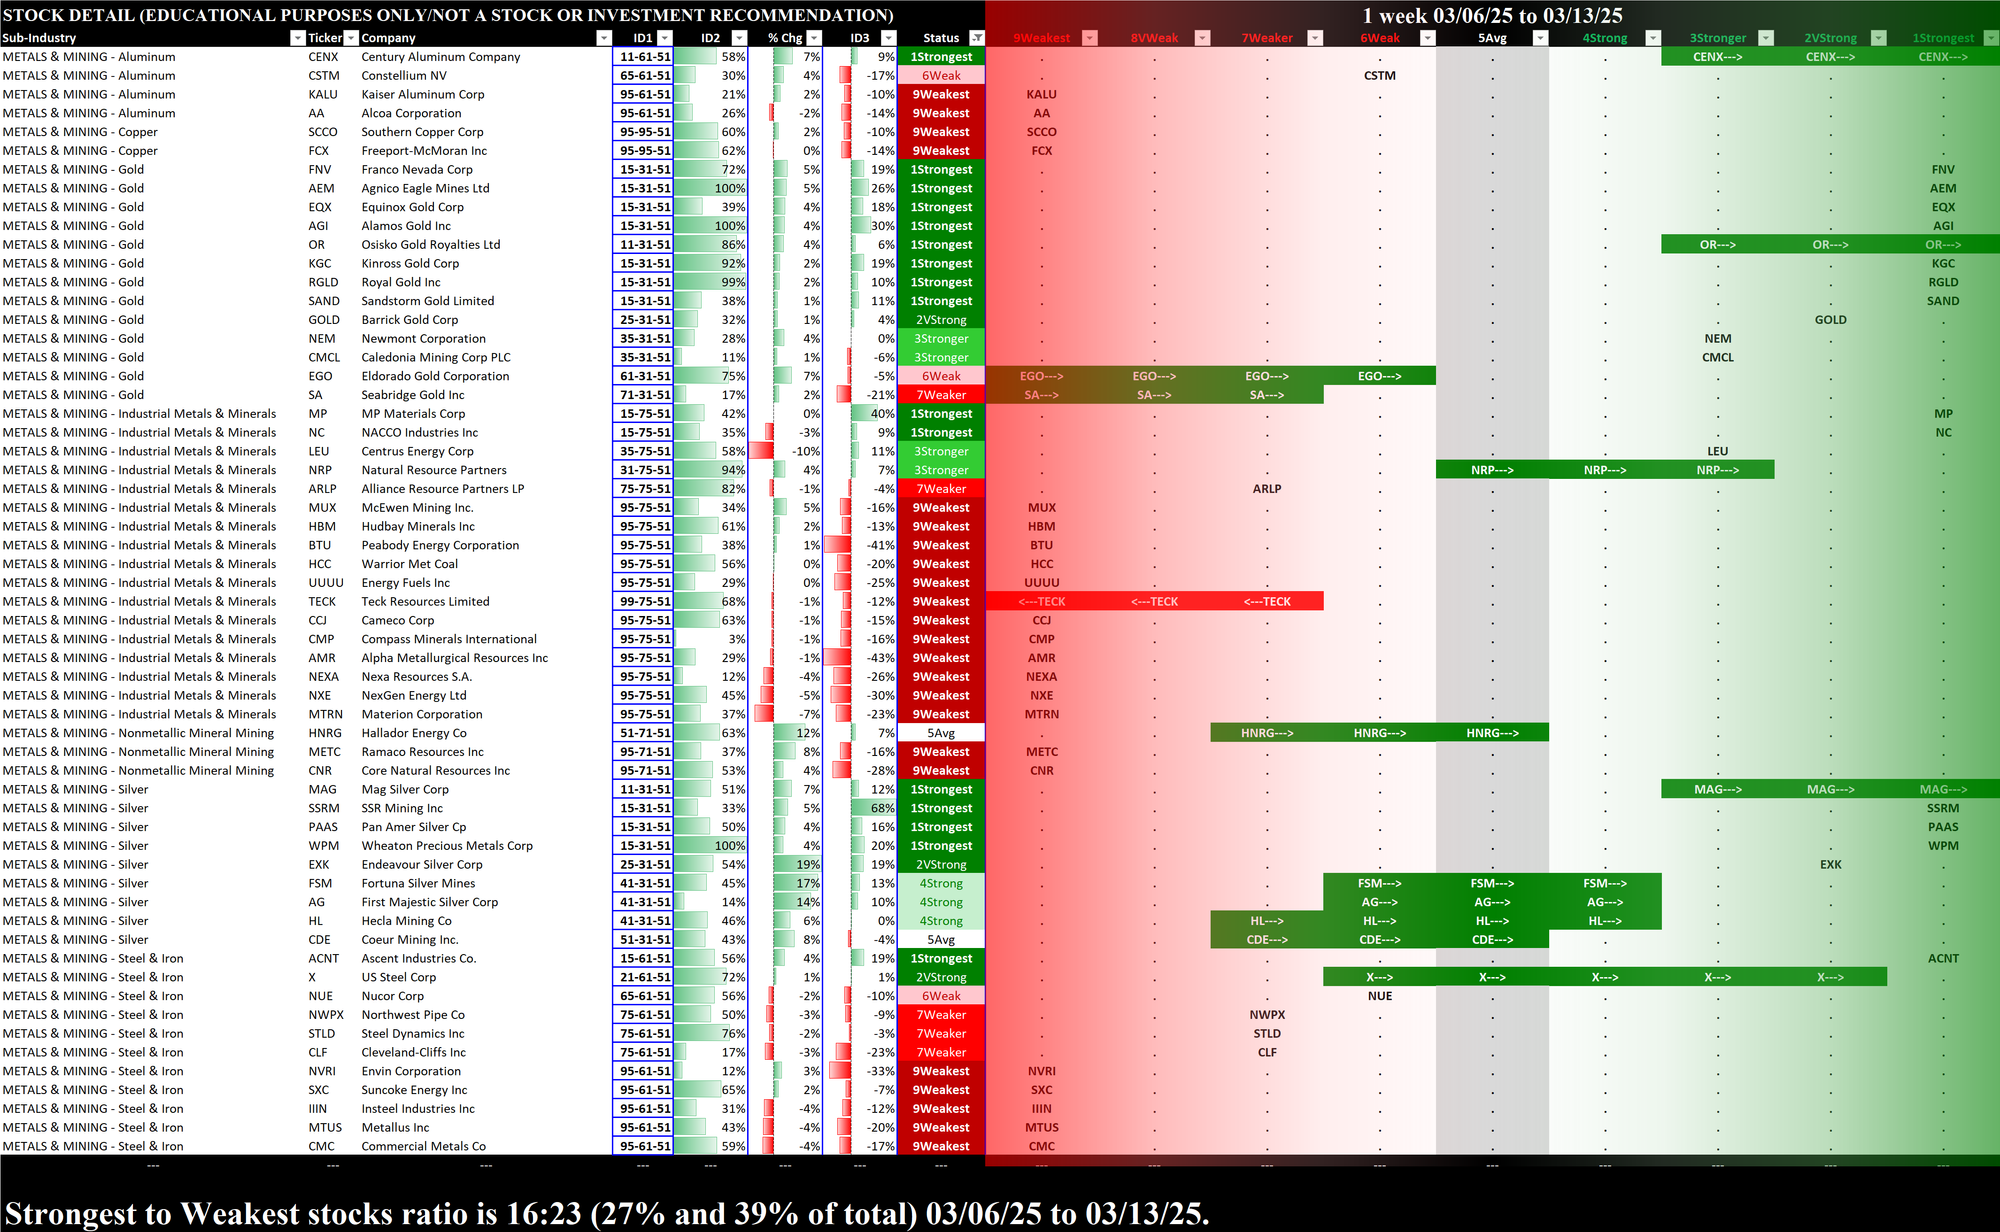
V. Stock Details
The following provides a listing of all Metals & Mining industry stocks in order of 1) sub-industry, 2) strongest-to-weakest strength rating, then 3) highest to lowest return this week. This is preceded by a summary of the proportion of 1Strongest to 9Weakest stocks.