Metals & Mining 2023-12-19: UP +1 to STRONG strength rating (4th strongest of 9 levels), previous move was also UP
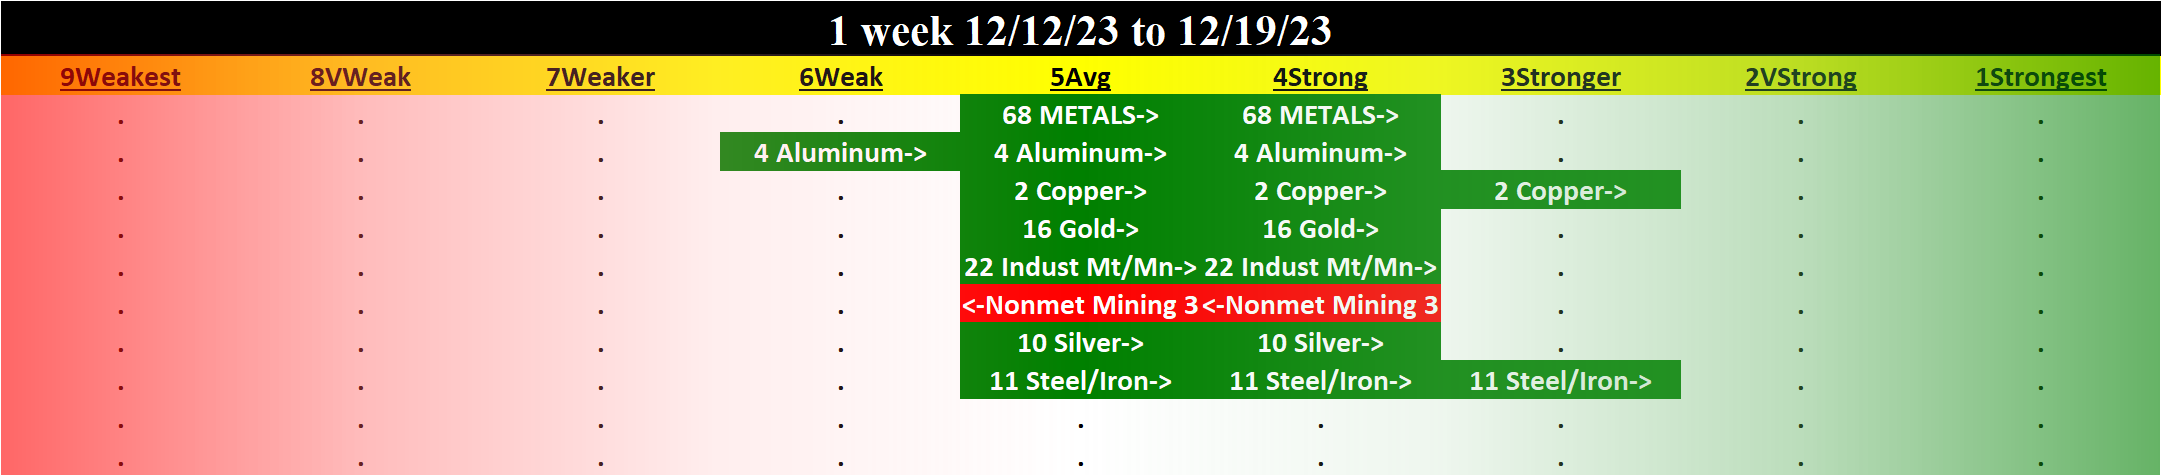
Metals/Mining flexing as 1 week 6/7 sub-industries strengthened, 93% positive stocks, 53% stocks >10%. Gold up to Strong rating (4th strongest of 9 levels).
Full details at downloadable file linked below.
What are you seeing here and why do you care? Partial listing:
🔹 An objective measurement of industry strengthening and weakening so you can objectively compare strength and weakness across/within industries and sub-industries.
🔹 A listing of stocks rated Strongest and Weakest (highest/lowest strength of 9 levels) by sub-industry, saving you significant time finding stocks that may be prone to making bigger moves faster. Stronger stocks have less overhead resistance, Weaker stocks are prone to “pops” from bargain hunting and short-covering yet due to preceding weakness are also prone to falling far and fast.
Background
Largest of 7 sub-industries (68 stocks, average 10):
- Industrial Metals & Minerals (22 stocks)
- Gold (16 stocks)
- Steel & Iron (11 stocks)
- Silver (10 stocks)
Top 10 Market Cap stocks: SCCO/Southern Copper Corp, FCX/Freeport-McMoran Inc, NUE/Nucor Corp, NEM/Newmont Corporation, GOLD/Barrick Gold Corp, AEM/Agnico Eagle Mines Ltd, WPM/Wheaton Precious Metals Corp, FNV/Franco Nevada Corp, STLD/Steel Dynamics Inc, TECK/Teck Resources Limited.
Details
🔹 28% Strongest Stocks, 10% Weakest Stocks.
🔹 STRENGTHENING 1 Week vs. Mid- and Longer-Term // 1 week positive/negative stocks ratio is HIGHER than both 4 weeks and 3 Months (93%/82%/72% positive)
🔹 Sub-industry Overview:
STRONGEST at Stronger rating/3rd strongest of 9 levels:
- Copper (2 stocks)
- Steel & Iron (11 stocks)
WEAKEST at Average rating/5th strongest of 9 levels:
- Nonmetallic Mineral Mining (3 stocks)
🔹 Lookback Periods Comparison:
3 Months: 24% stocks >+20% and 7% stocks <-20%.
___UP most:
METC +79% (Nonmet Mining)
CENX +66% (Aluminum)
CDE +64% (Silver)
X +54% (Steel/Iron)
CLF +47% (Steel/Iron)
___DOWN most:
LAC -63% (Indust Mt/Mn)
SSRM -25% (Silver)
HNRG -24% (Nonmet Mining)
FNV -22% (Gold)
EXK -20% (Silver)
4 weeks: 51% stocks >+10% and 3% stocks <-10%.
___UP most:
NVRI +54% (Steel/Iron)
CENX +46% (Aluminum)
X +41% (Steel/Iron)
GSM +32% (Indust Mt/Mn)
CDE +32% (Silver)
___DOWN most:
HNRG -27% (Nonmet Mining)
UUUU -17% (Indust Mt/Mn)
ARLP -9% (Indust Mt/Mn)
NG -7% (Gold)
ACNT -6% (Steel/Iron)
1 Week: 53% stocks >+10% and 1% stocks <-10%.
___UP most:
CENX +48% (Aluminum)
AA +35% (Aluminum)
X +33% (Steel/Iron)
CDE +24% (Silver)
CLF +23% (Steel/Iron)
___DOWN most:
HNRG -14% (Nonmet Mining)
UUUU -5% (Indust Mt/Mn)
CCJ -5% (Indust Mt/Mn)
NXE -2% (Indust Mt/Mn)
ACNT 0% (Steel/Iron)