Metals & Mining 2023-09-26: DOWN -1 to WEAK strength rating (6th strongest of 9 levels), previous move was UP
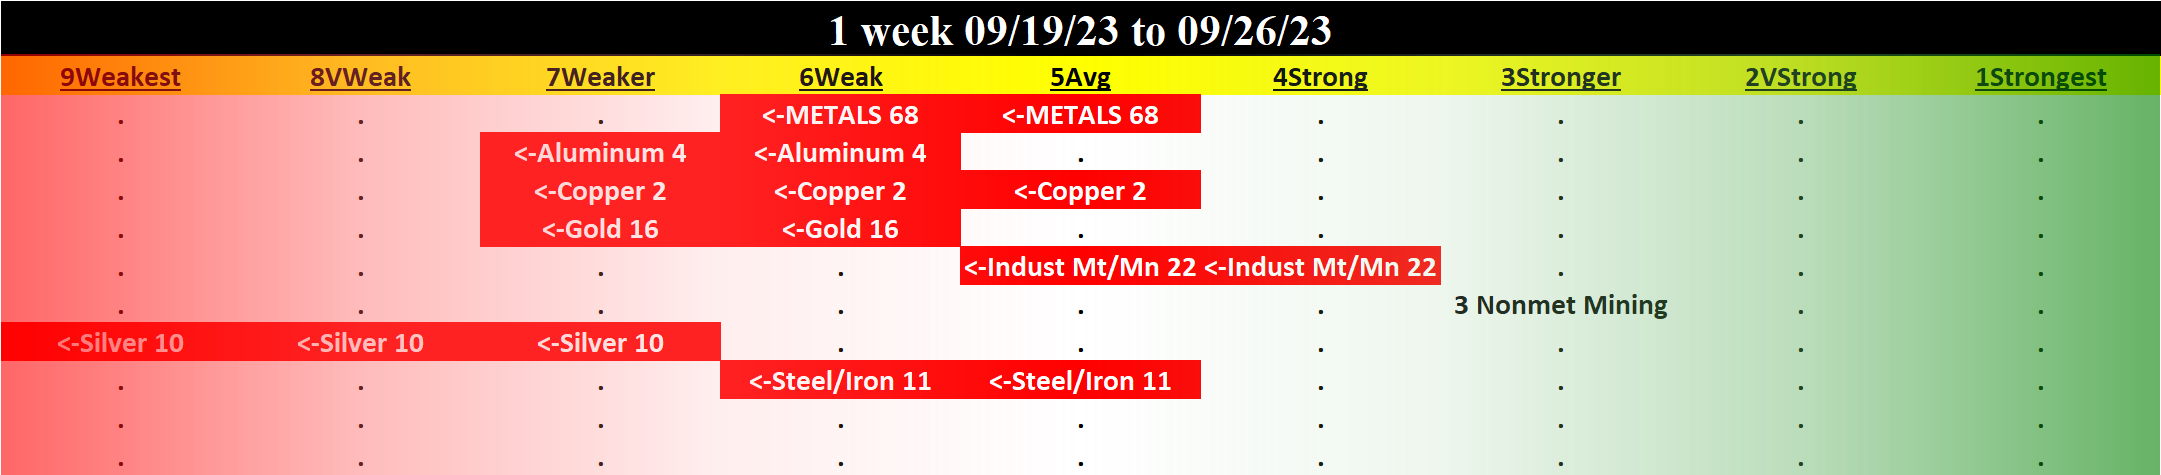
TABLE OF CONTENTS
- INDUSTRY OVERVIEW
1A. Performance
1B. Background - SUB-INDUSTRIES AND STOCKS DETAIL
2A. Sub-Industries Overview
2B. Sub-Industries 10-Week Strengthening Analysis
2C. Stocks 1 Week Strongest and Weakest - STRENGTH BY LOOKBACK PERIOD (with Best/Worst stocks)
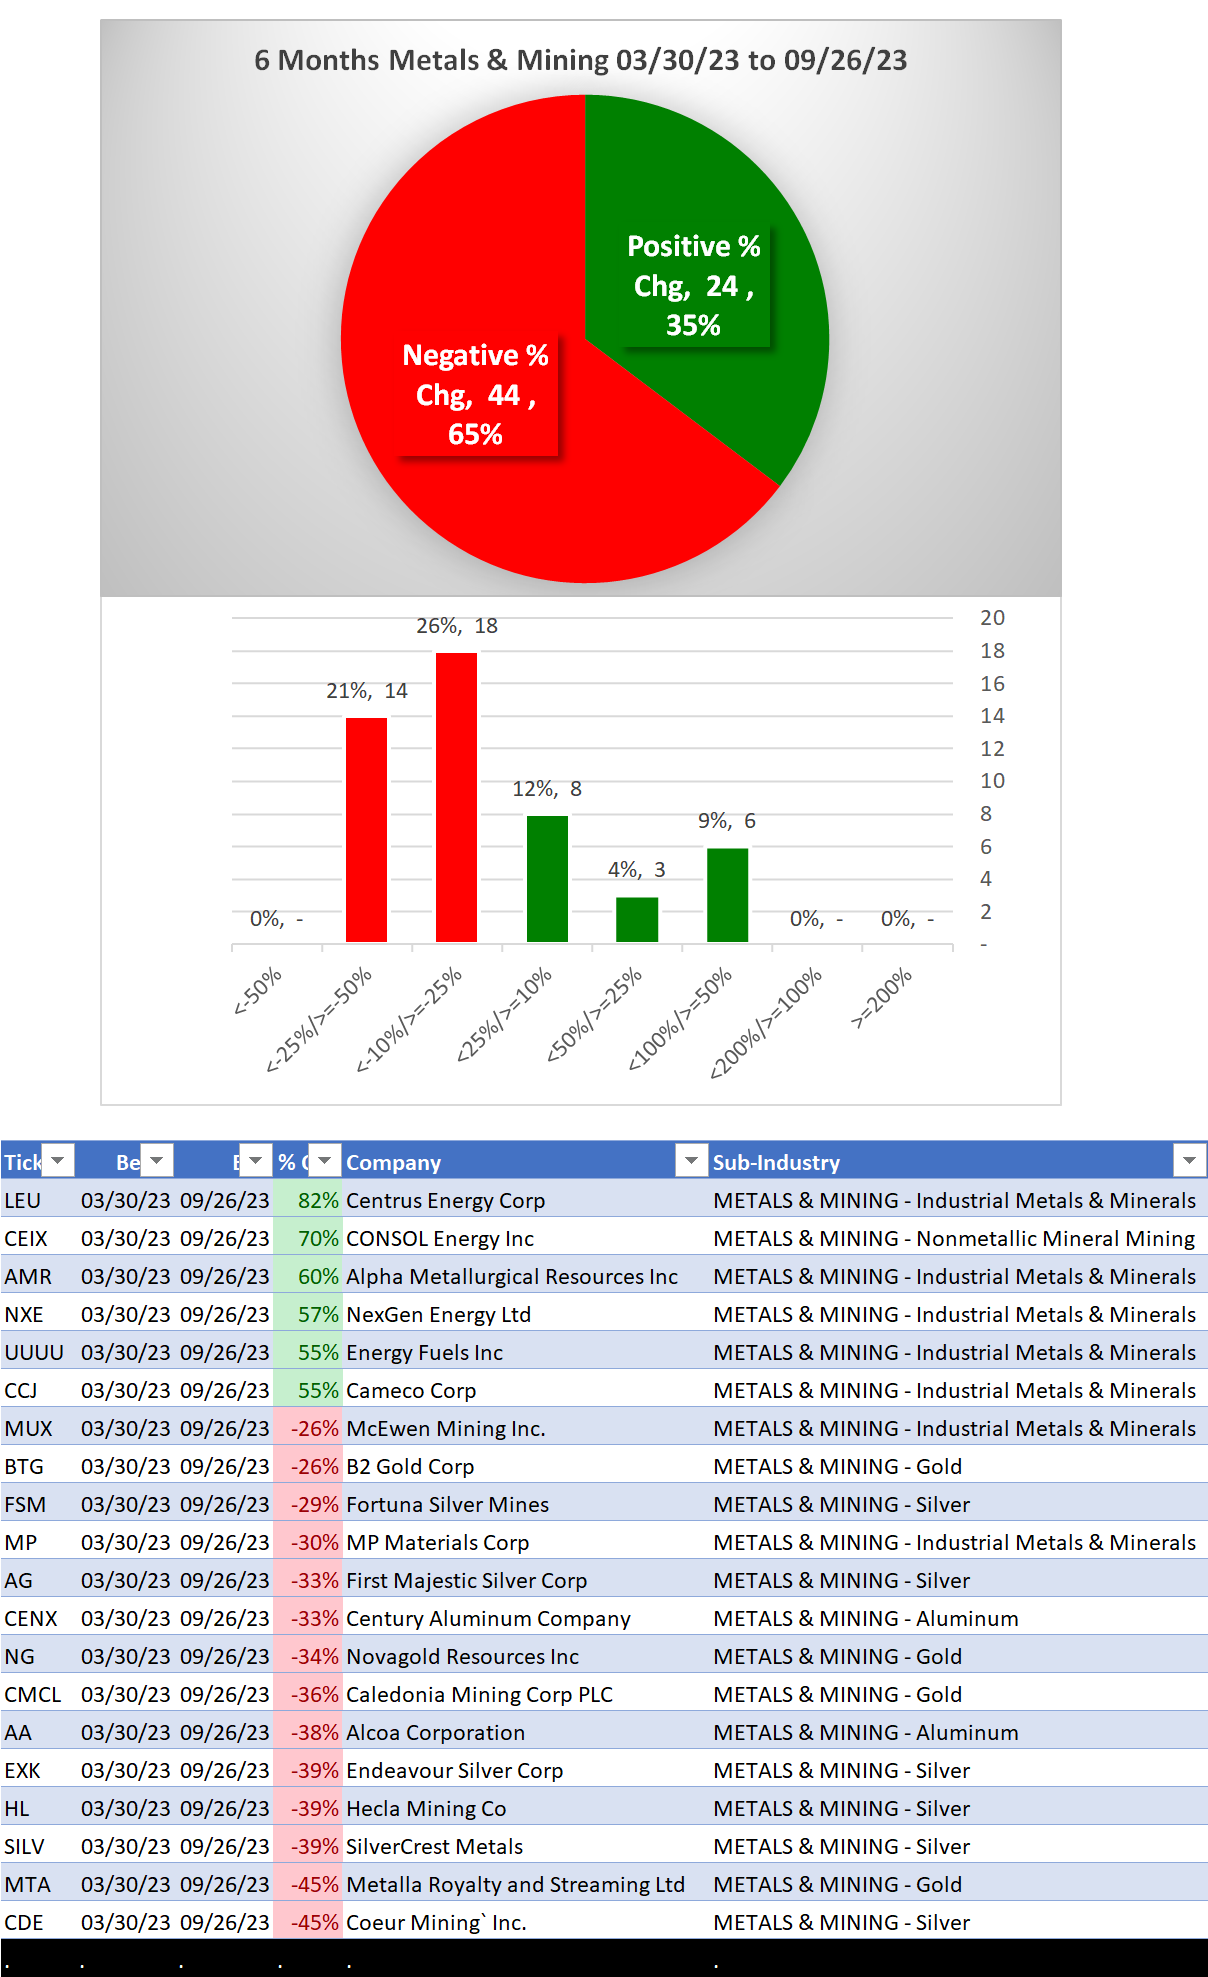
3A. Lookback 6 Months
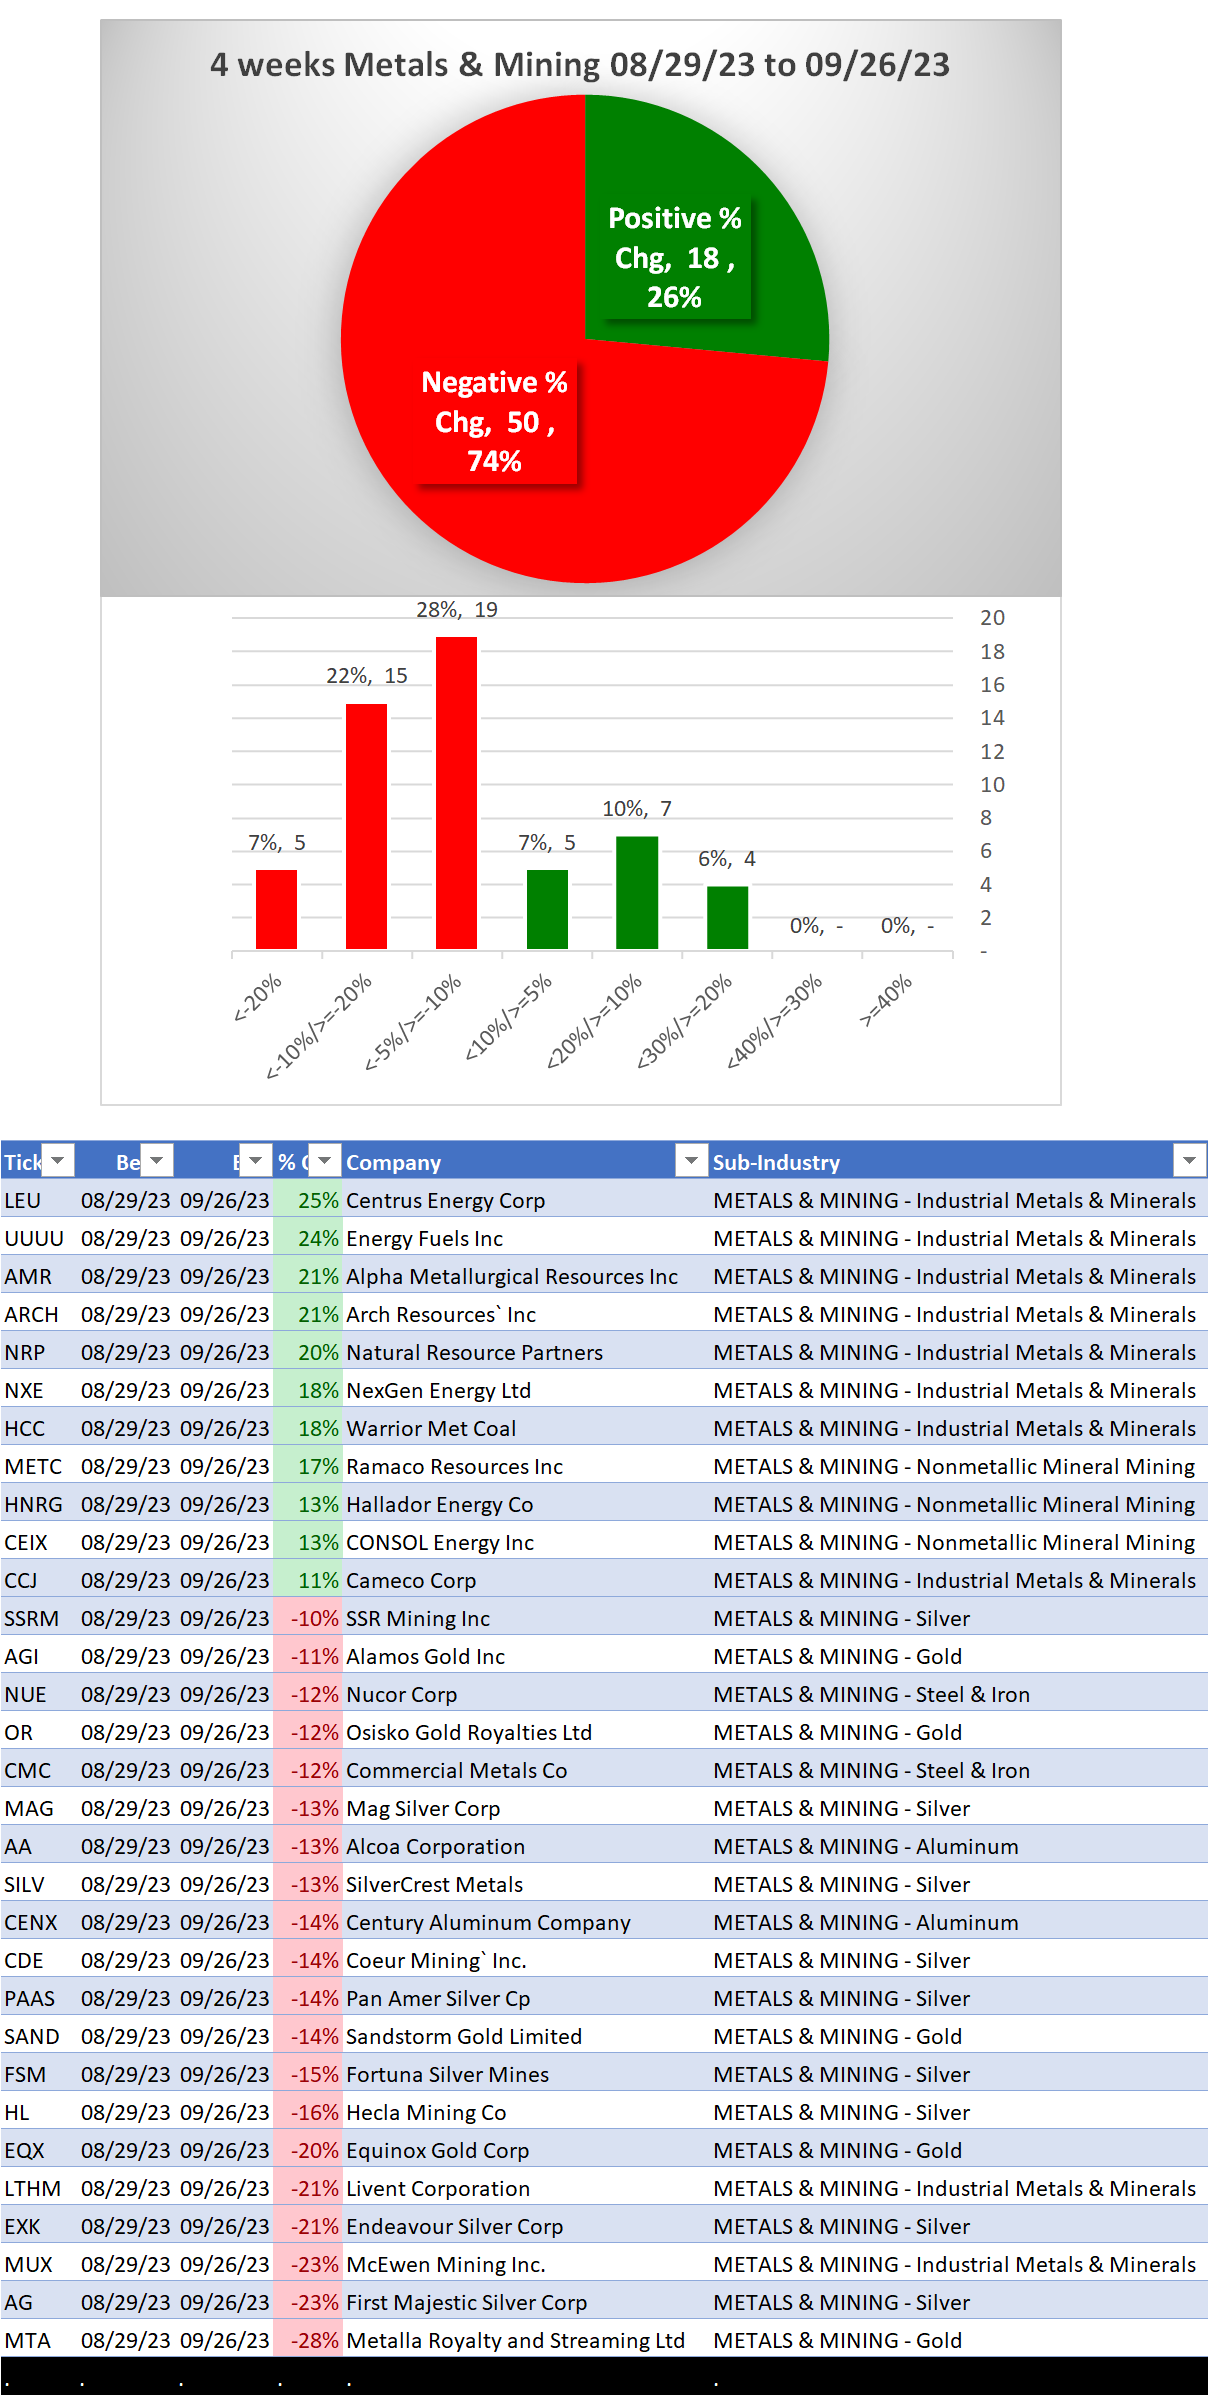
3B. Lookback 4 weeks
3C. Lookback 1 Week
1. INDUSTRY OVERVIEW
1A. Performance
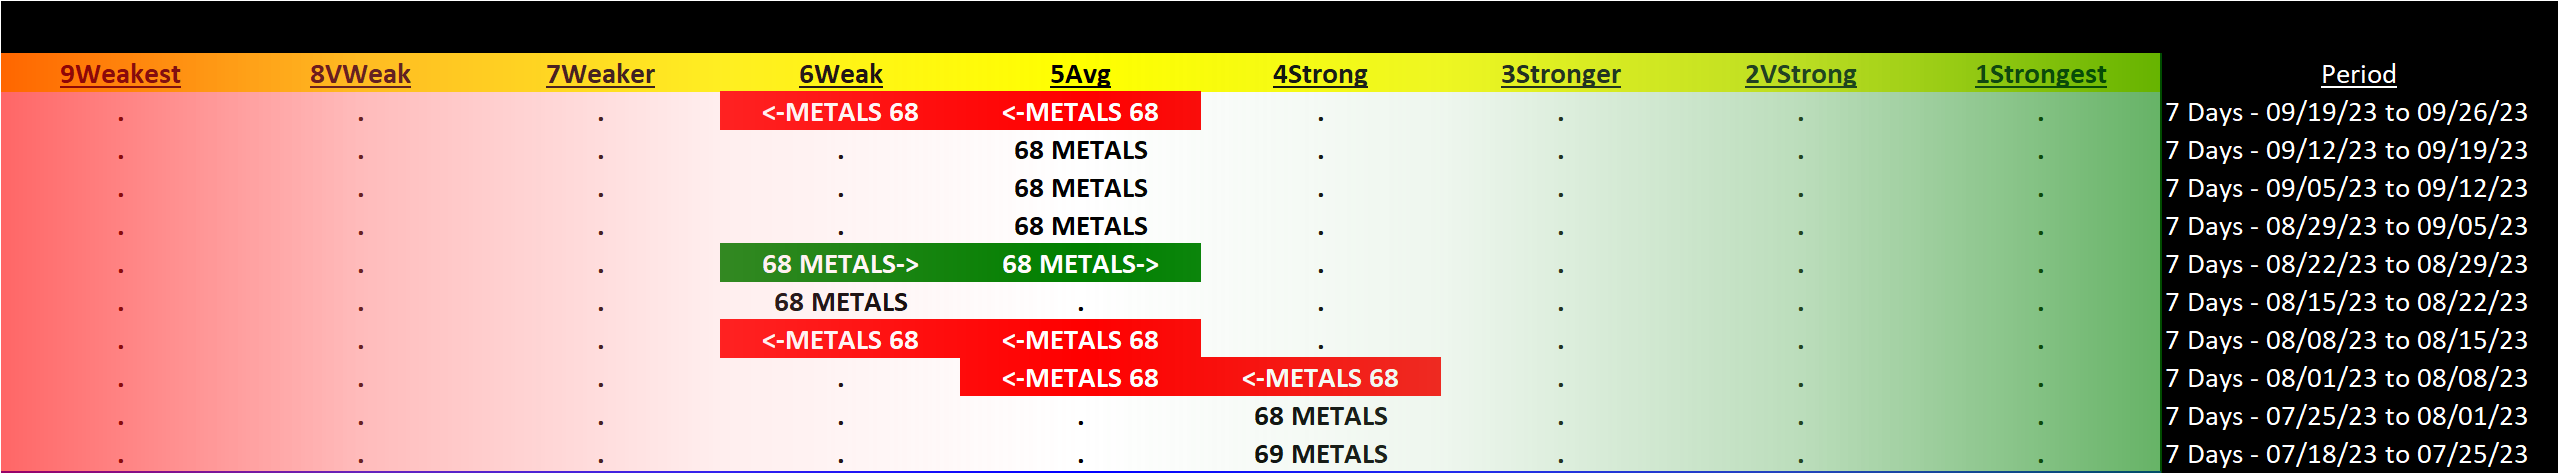
Past 10 Weeks Strengthening/Weakening week-by-week, per the following chart:
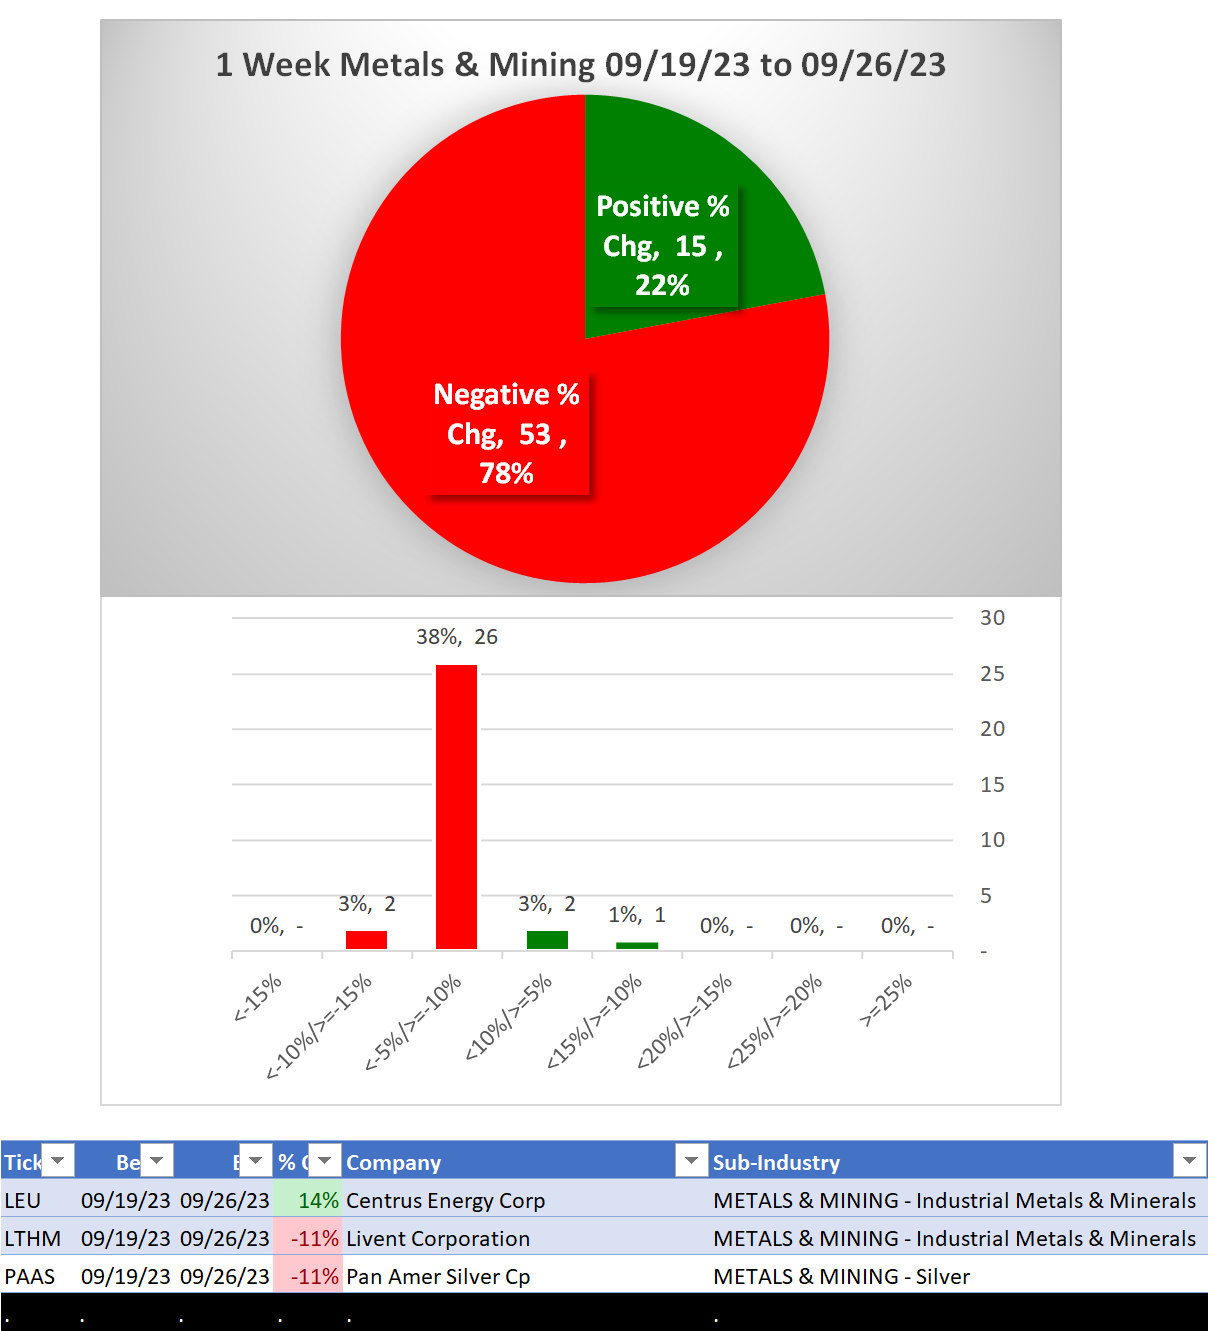
WEAKENING 1 Week vs. Mid- and Longer-Term // 1 week positive/negative stocks ratio is LOWER than both 4 weeks and 6 Months, per the following chart:
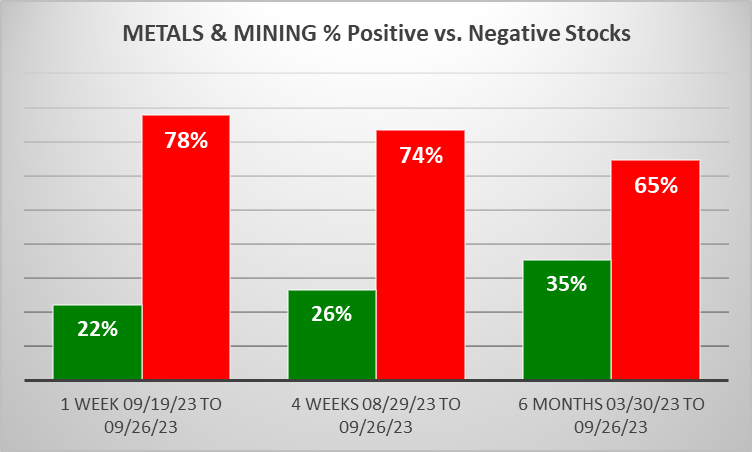
Comments:
- 4 weeks, 29% of total stocks <-10%.
- Silver sub-industry has the Weakest rating (lowest of 9 levels).
- 46% of industry stacks are currently rated Weakest.
1B. Background
Largest of 7 sub-industries (68 stocks, average 10):
- Industrial Metals & Minerals (22 stocks)
- Gold (16 stocks)
- Steel & Iron (11 stocks)
- Silver (10 stocks)
Top 10 by Market Capitalization:
SCCO/Southern Copper Corp, FCX/Freeport-McMoran Inc, NUE/Nucor Corp, NEM/Newmont Corporation, GOLD/Barrick Gold Corp, FNV/Franco Nevada Corp, AEM/Agnico Eagle Mines Ltd, TECK/Teck Resources Limited, WPM/Wheaton Precious Metals Corp, STLD/Steel Dynamics Inc
2. SUB-INDUSTRIES AND STOCKS DETAIL
2A. Sub-Industries Overview
Strengthened: 0/7 sub-industries
Weakened: 6/7 sub-industries
STRONGEST at Stronger rating/3rd strongest of 9 levels:
- Nonmetallic Mineral Mining (3 stocks)
WEAKEST at Weakest rating/9th strongest of 9 levels:
- Silver (10 stocks)
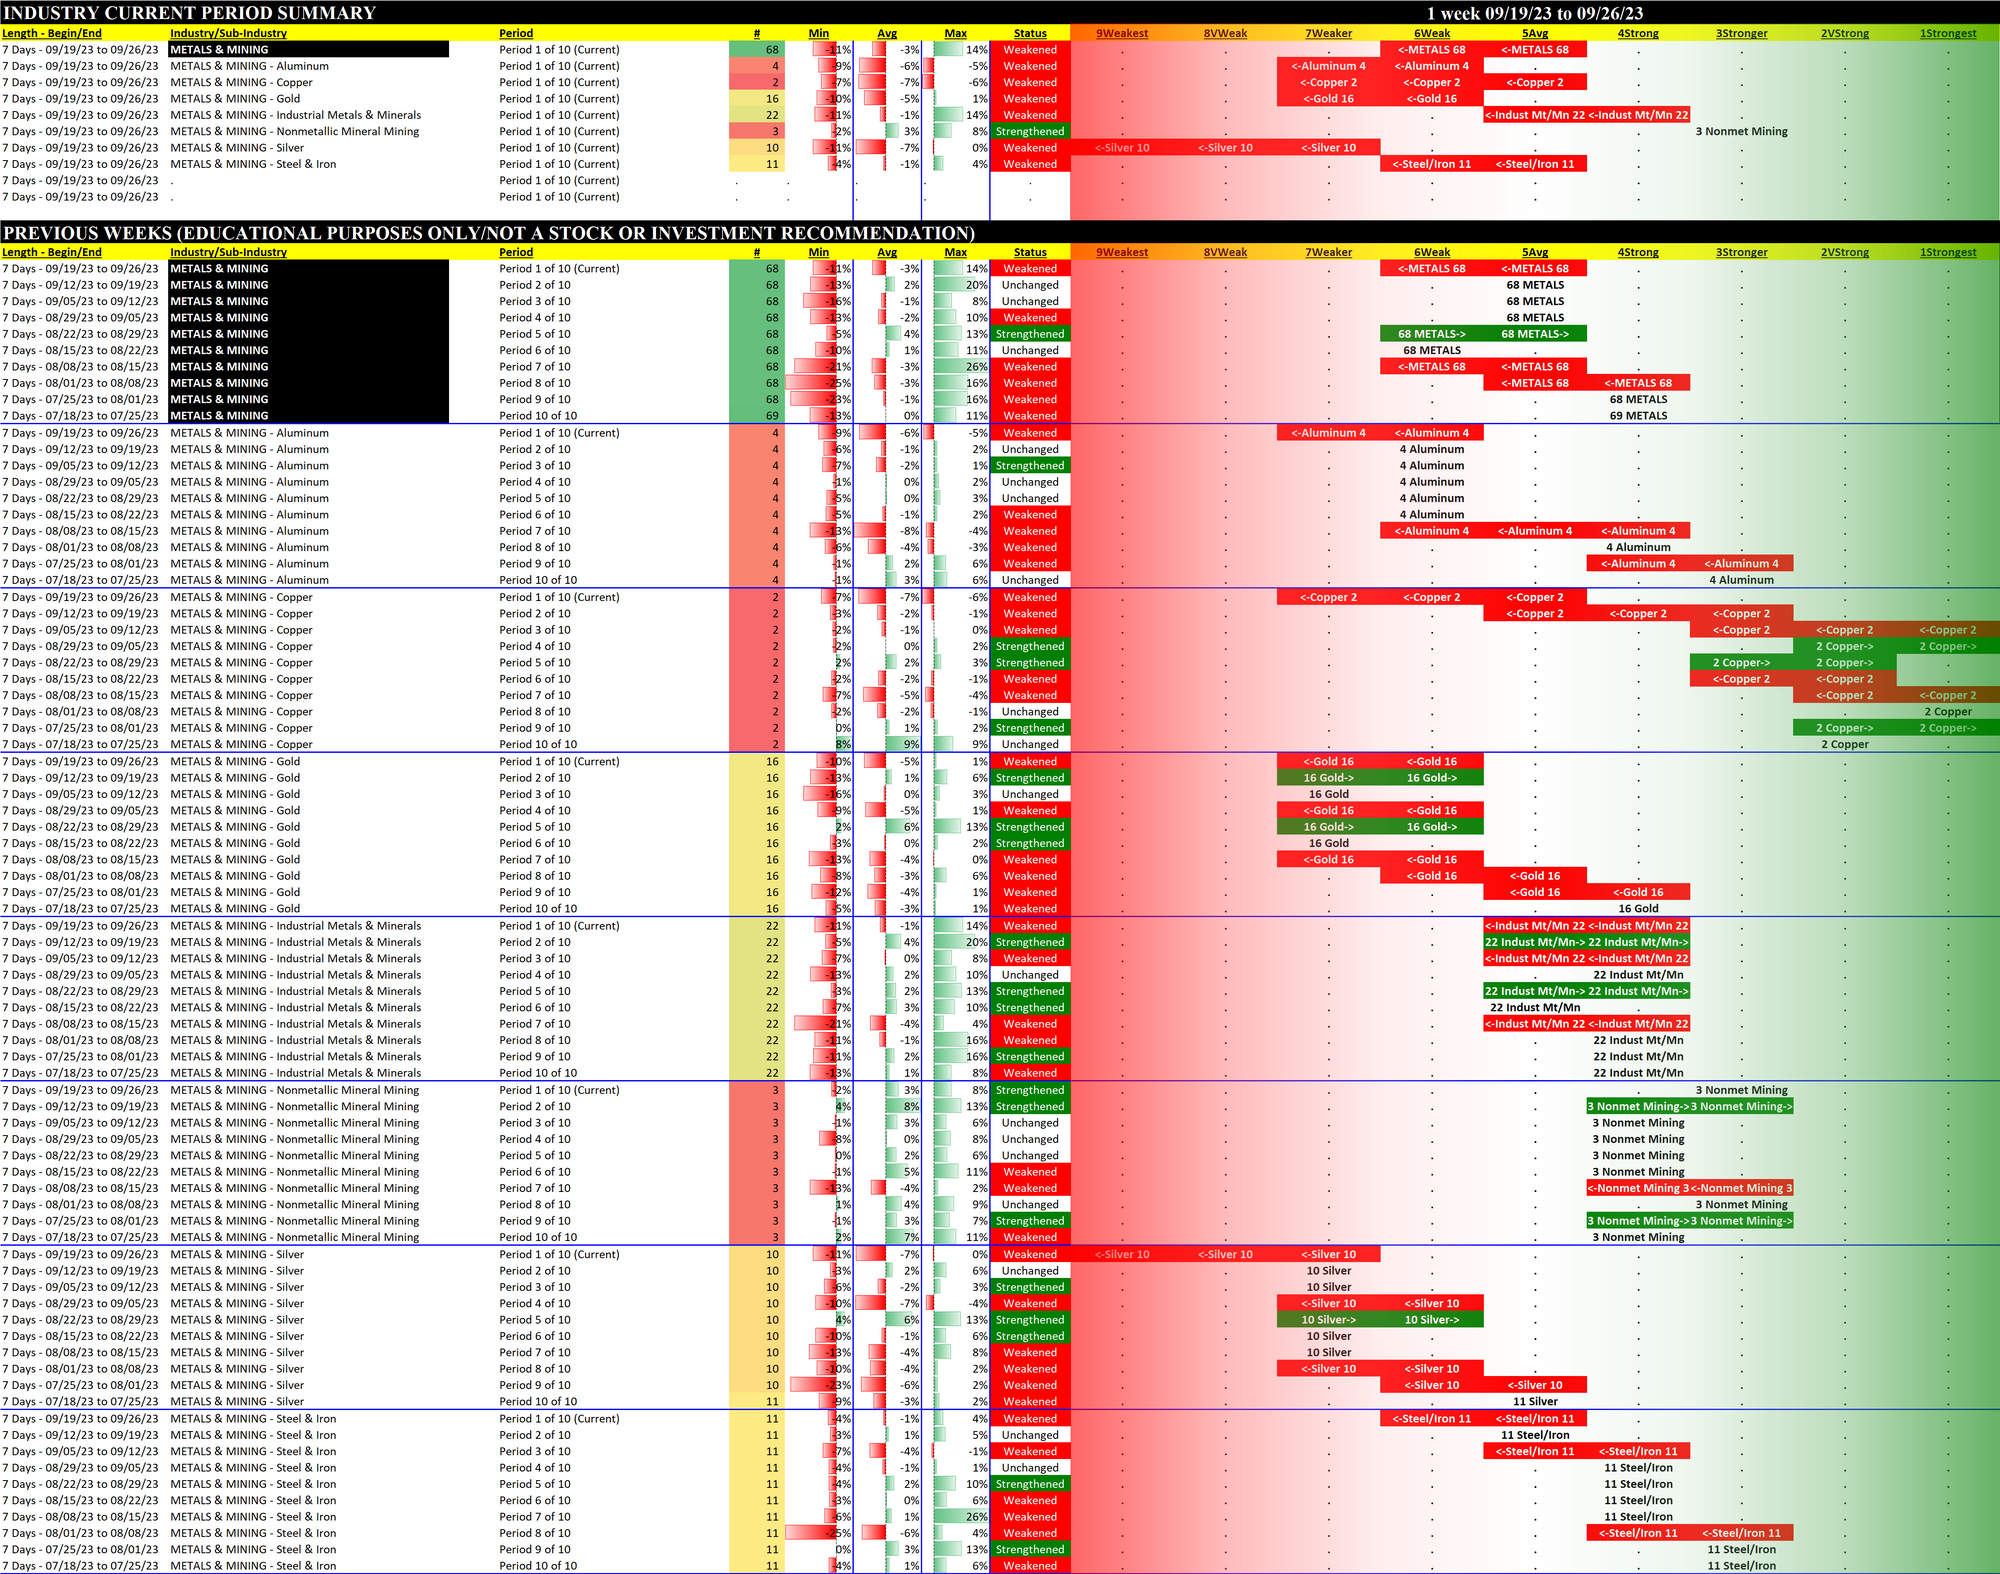
2B. Sub-Industries 10-Week Strengthening Analysis
What: recent week-by-week strength changes for the industry and each underlying sub-industry
Why: objective measurement of strengthening and weakening enabling comparison within and across industries and sub-industries
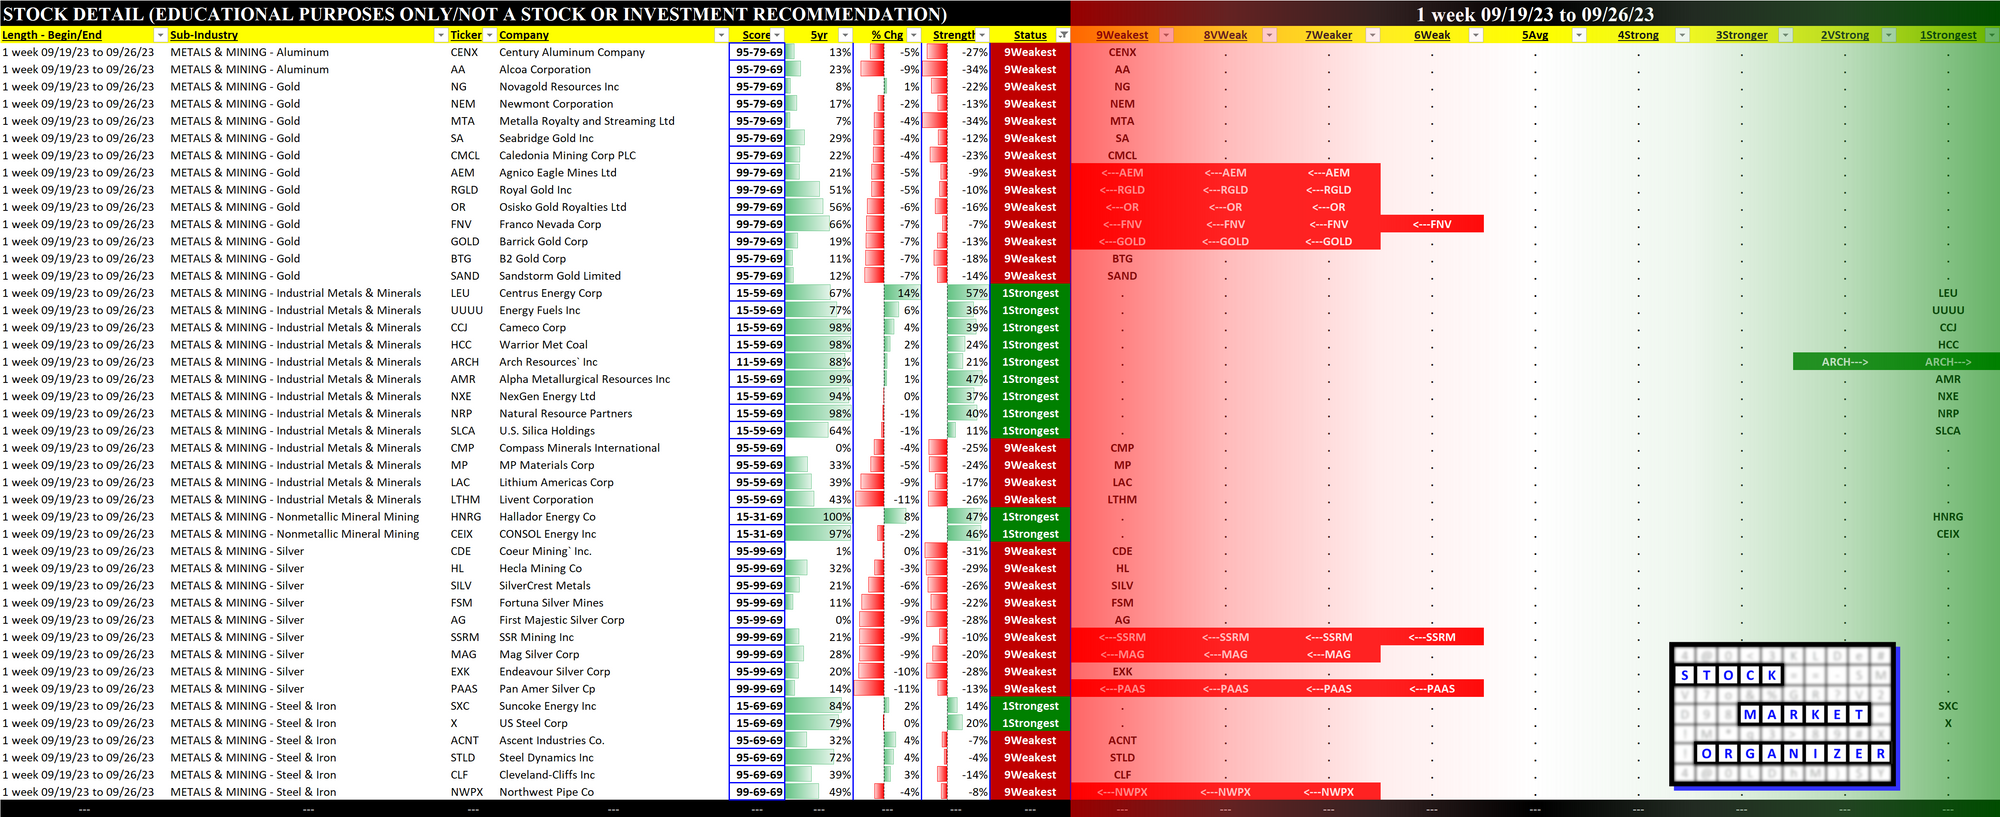
2C. Stocks 1 Week Strongest and Weakest
What: stocks currently rated Strongest/Weakest (highest/lowest of 9 strength ratings)
Why: most interesting stocks for available capital because
- the Strongest have the least amount of overhead supply to dampen breakouts while
- the Weakest may be prone to volatility, subject to big pops from bottom-fishing and short-covering BUT ALSO to bigger and faster falls.
(Not guaranteed and not a recommendation - weak stocks in weakening sub-industries may be better shorts than high-flyers.)
STRENGTH BY LOOKBACK PERIOD (with Best/Worst stocks)
3A. Lookback 6 Months
3B. Lookback 4 weeks
3C. Lookback 1 Week