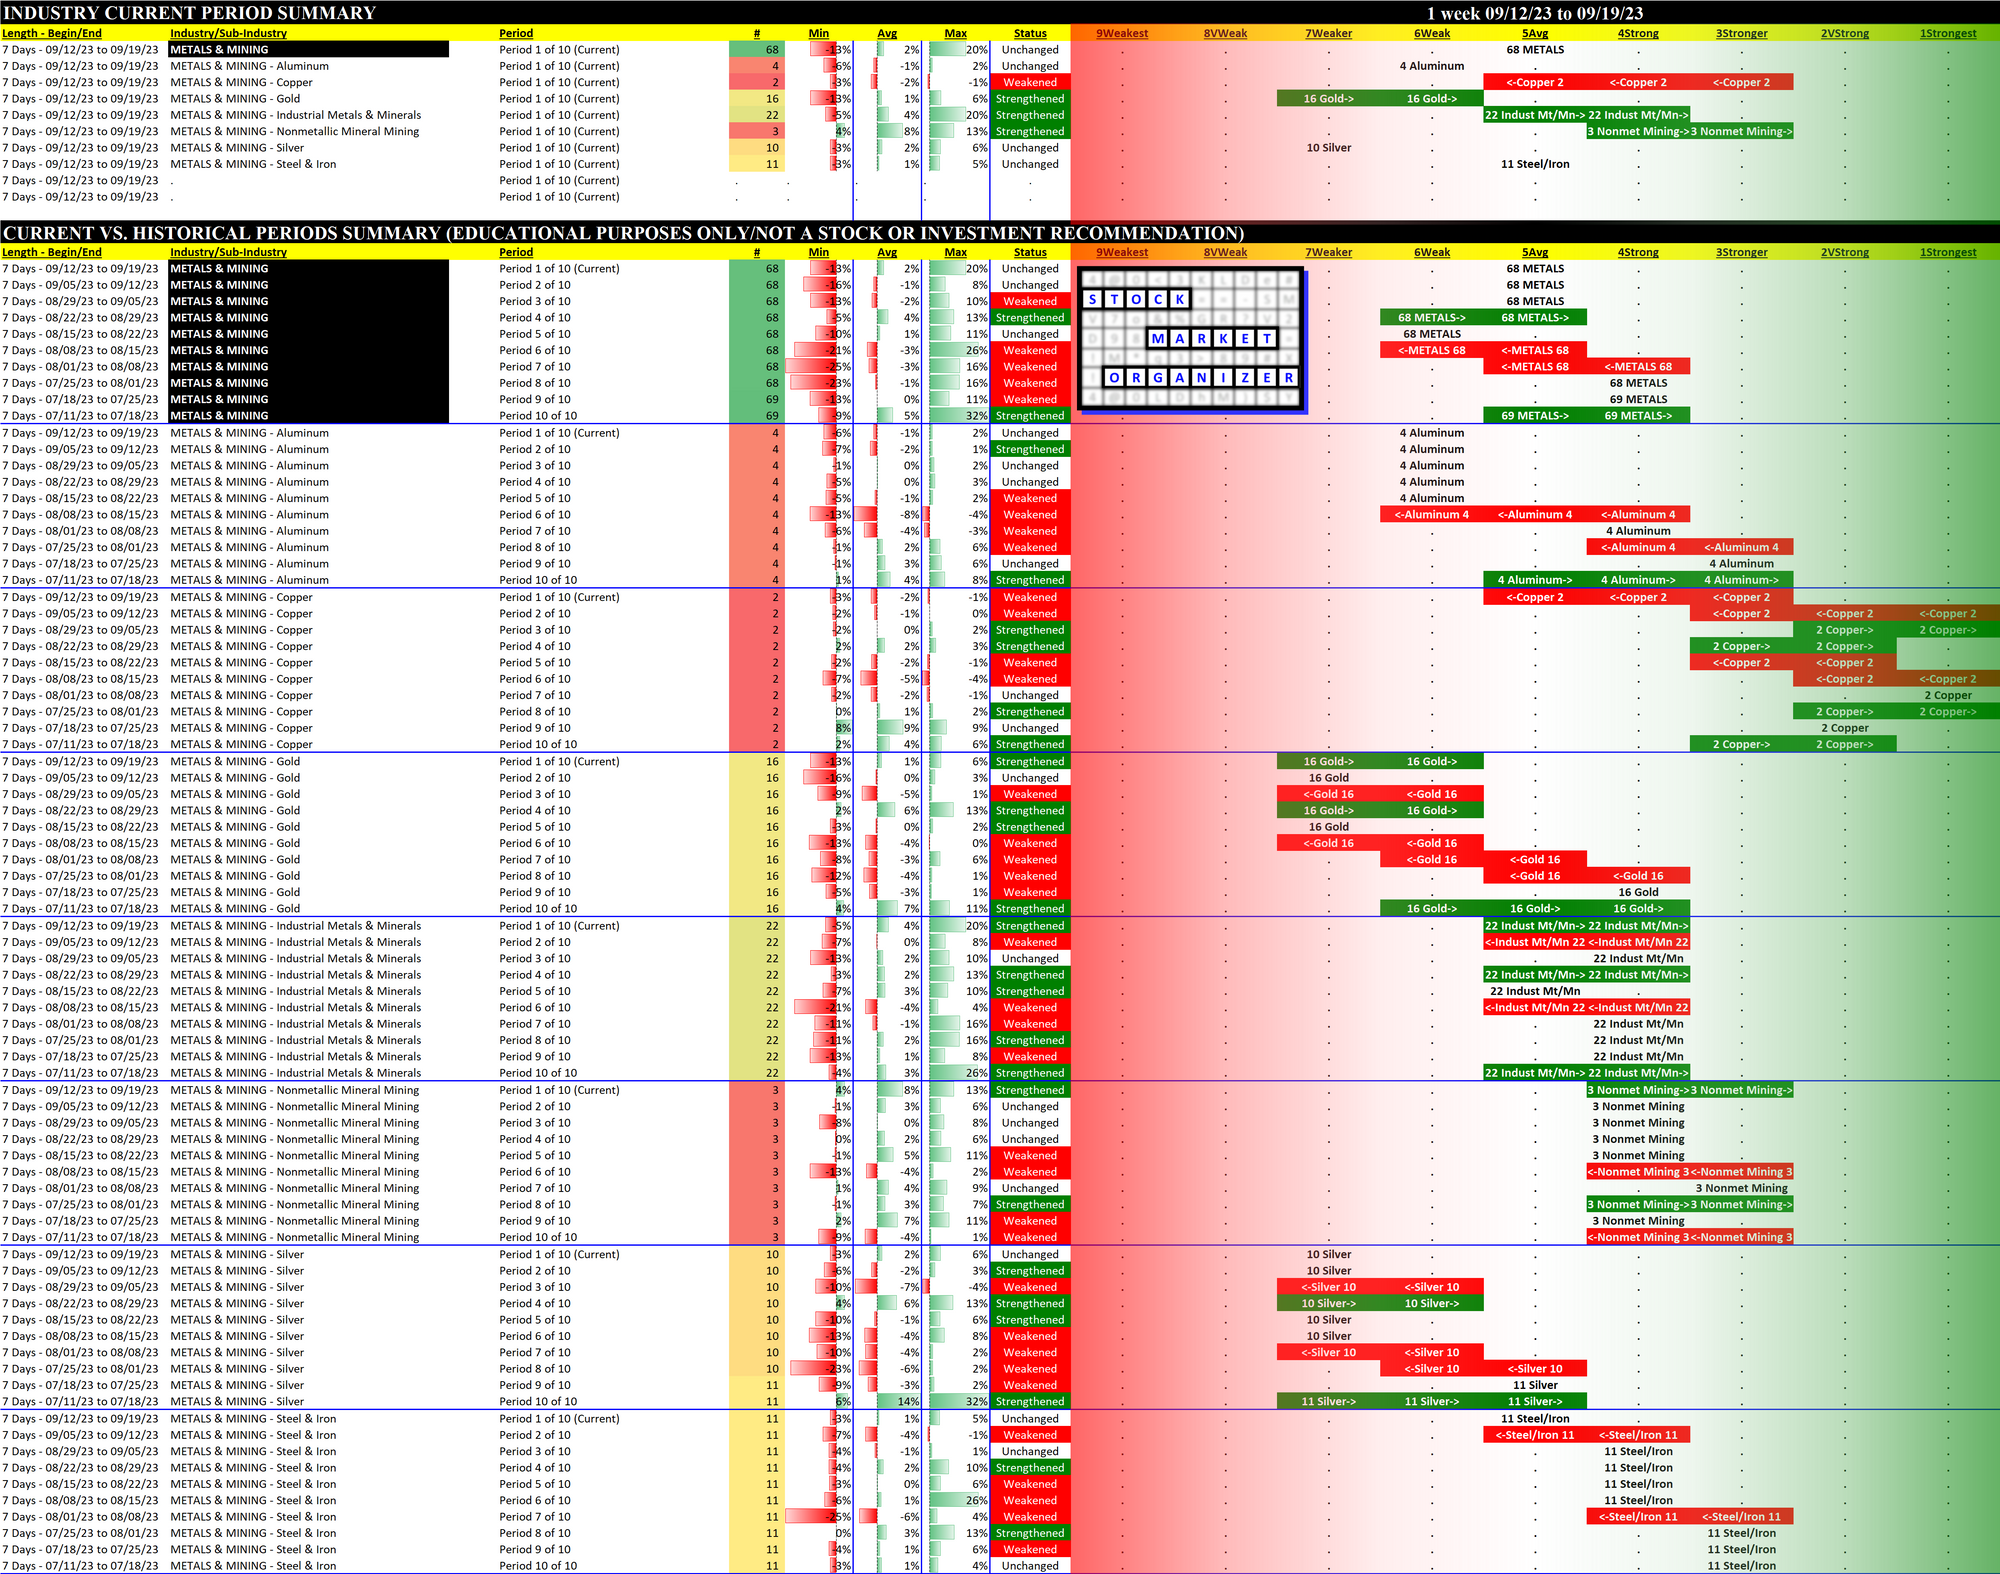
Metals & Mining 2023-09-19: Unchanged at AVERAGE strength rating (5th strongest of 9 levels), previous move was UP
SUMMARY
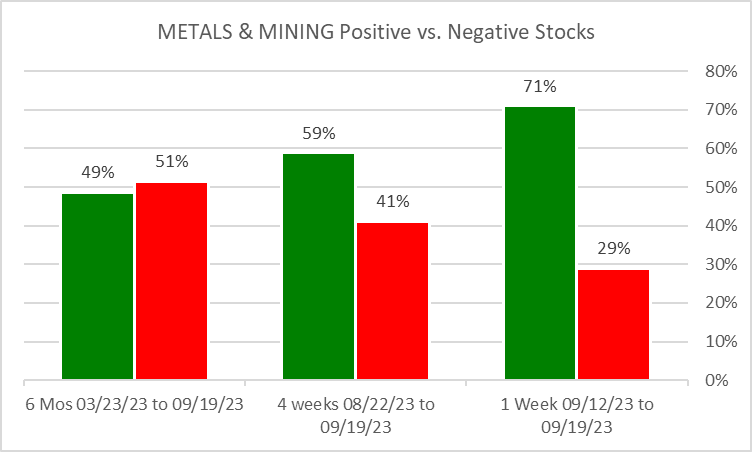
Performance
Bottom Line: net weakening 1 level through 10 weeks of chopping
Context: strengthened 1 week vs. 4 weeks/6 months
Other Notes:
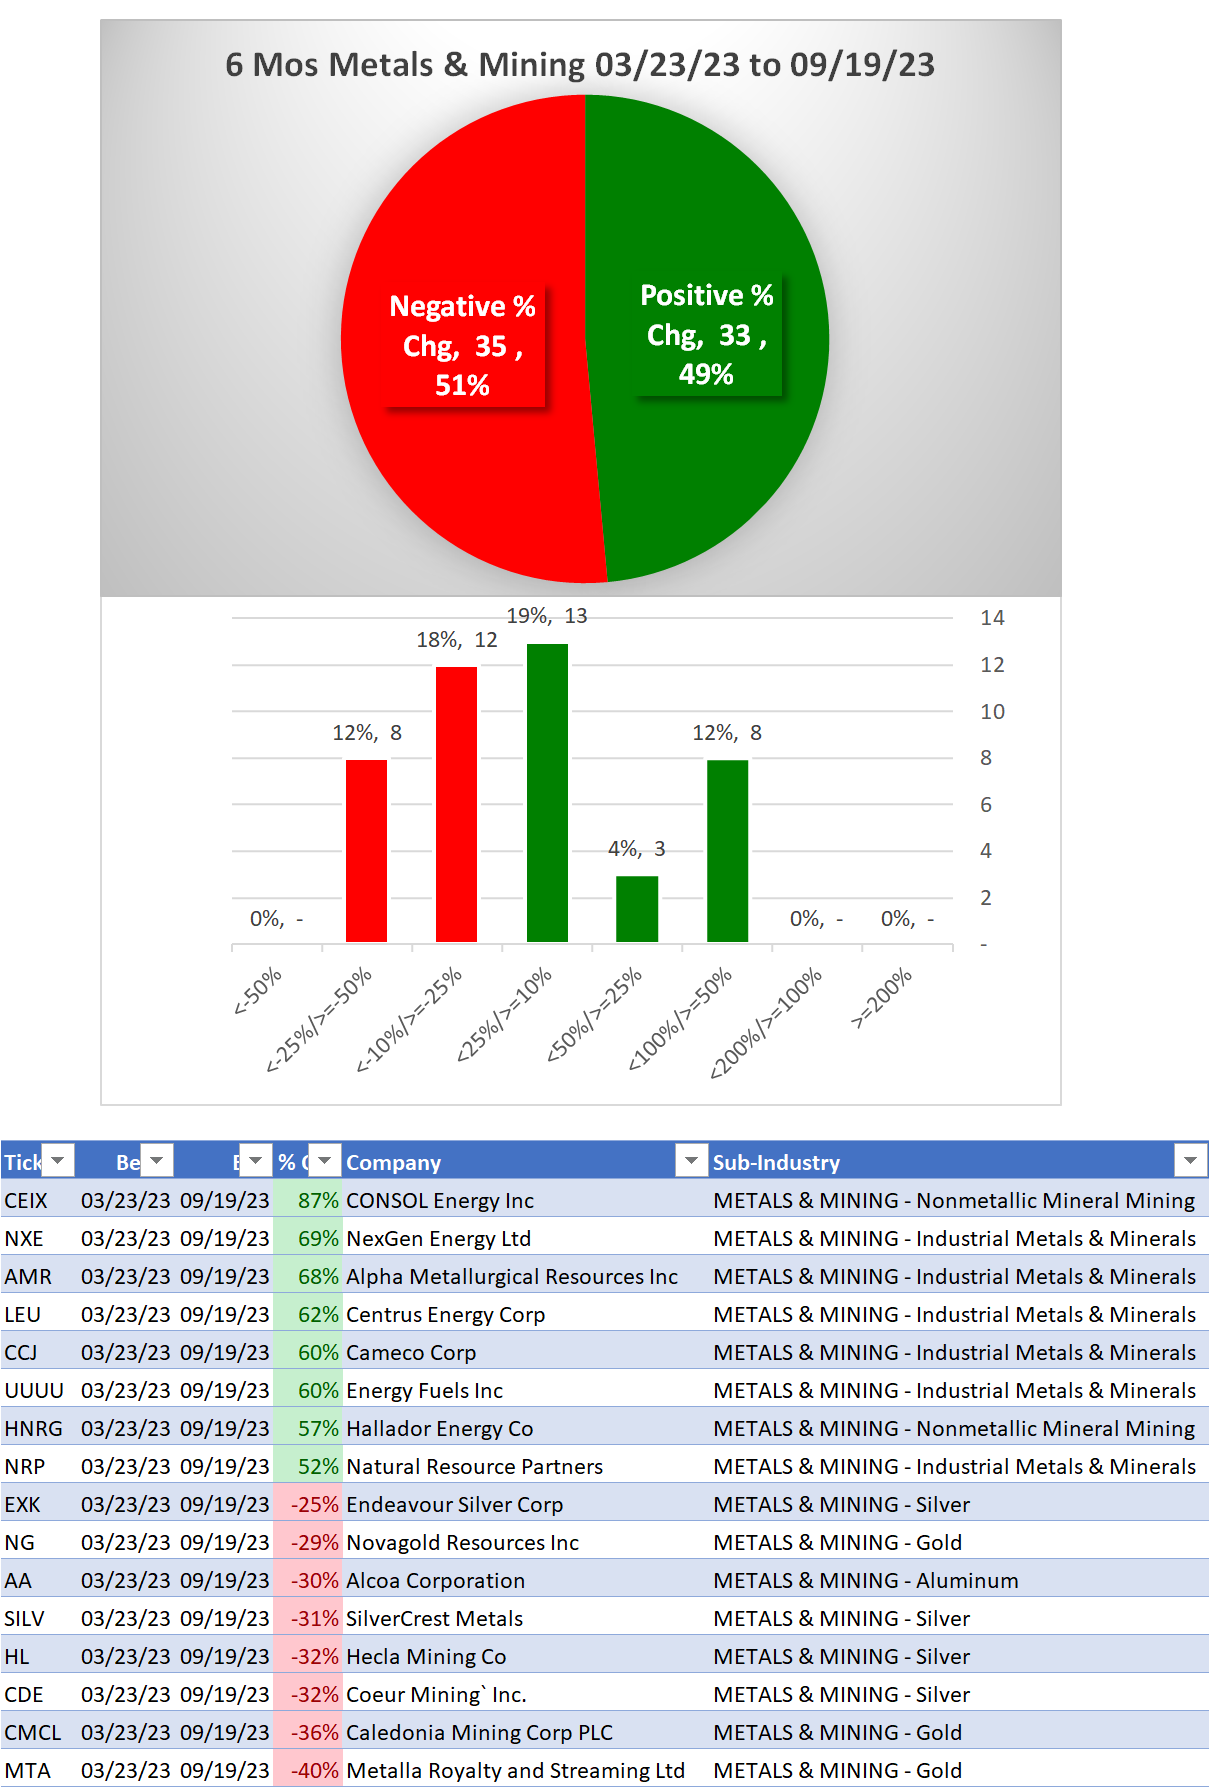
6 Months
CEIX/CONSOL Energy Inc (Nonmetallic Mineral Mining) +87%
SILV/SilverCrest Metals (Silver) -31%
HL/Hecla Mining Co (Silver) -32%
CDE/Coeur Mining Inc. (Silver) -32%
CMCL/Caledonia Mining Corp PLC (Gold) -36%
MTA/Metalla Royalty and Streaming Ltd (Gold) -40%
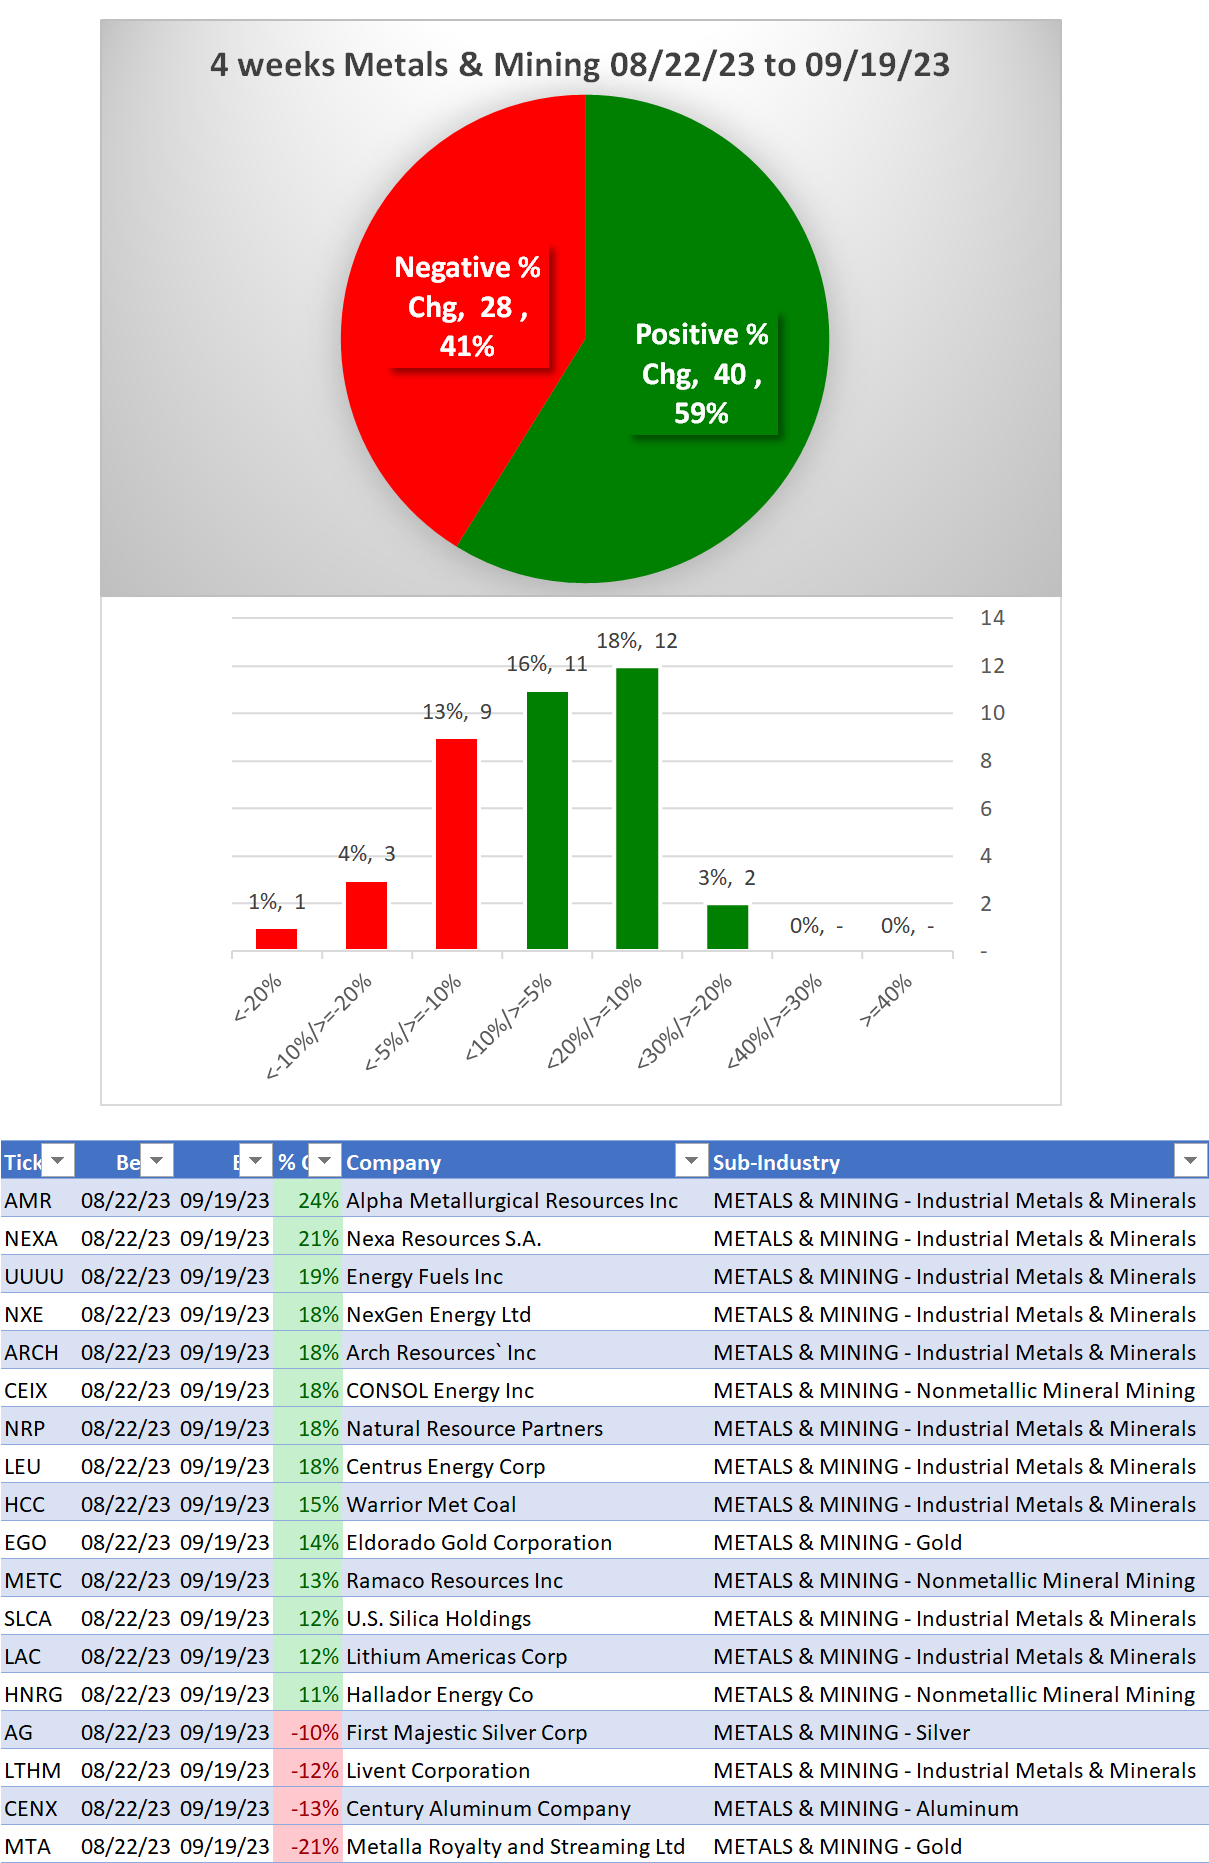
4 Weeks
AMR/Alpha Metallurgical Resources Inc (Industrial Metals & Minerals) +24%
NEXA/Nexa Resources S.A. (Industrial Metals & Minerals) +21%
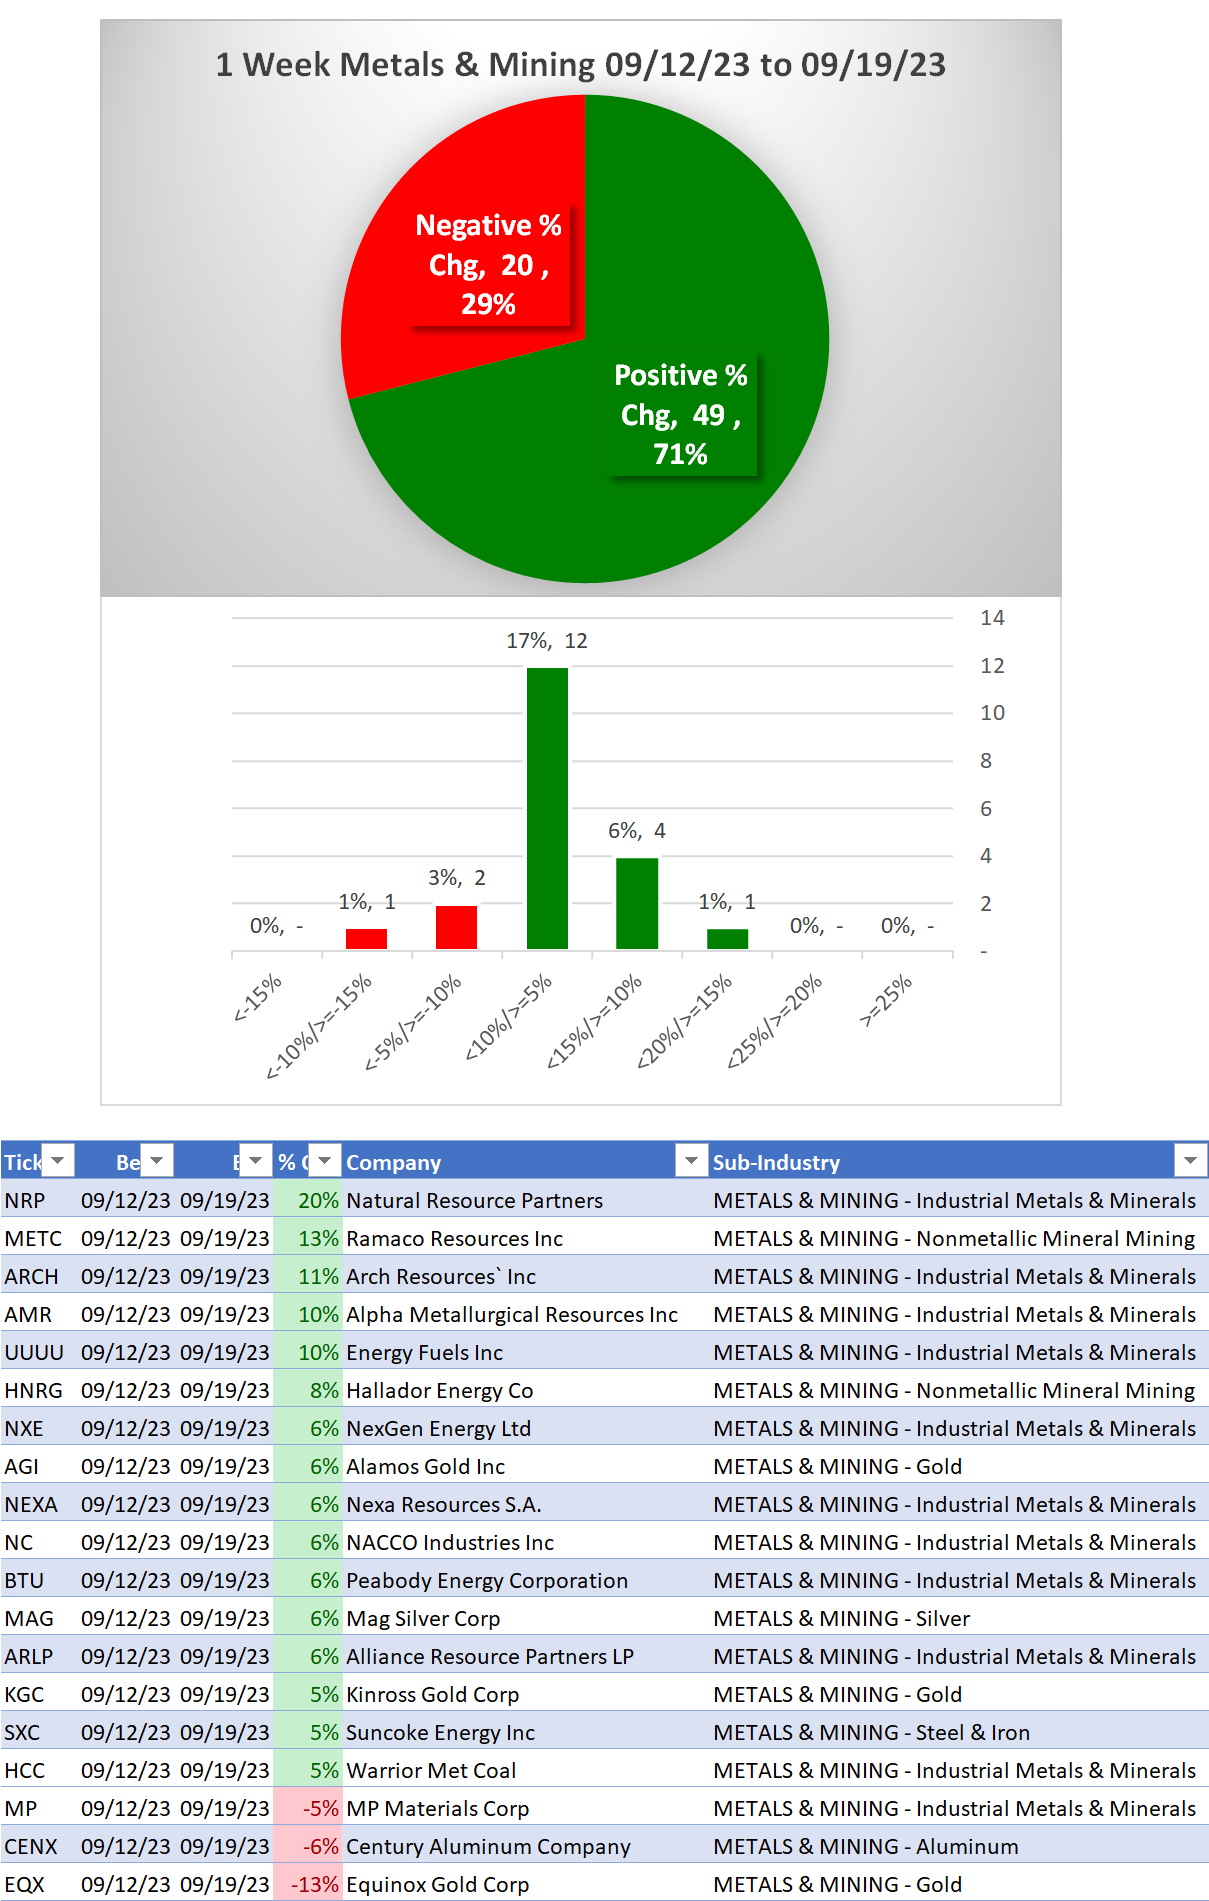
1 Week
Gold strengthened 1 level
Feast or famine - Strongest stocks 25% and 34% of total, Weakest stocks 34% of total
NRP/Natural Resource Partners (Industrial Metals & Minerals) +20%
Background
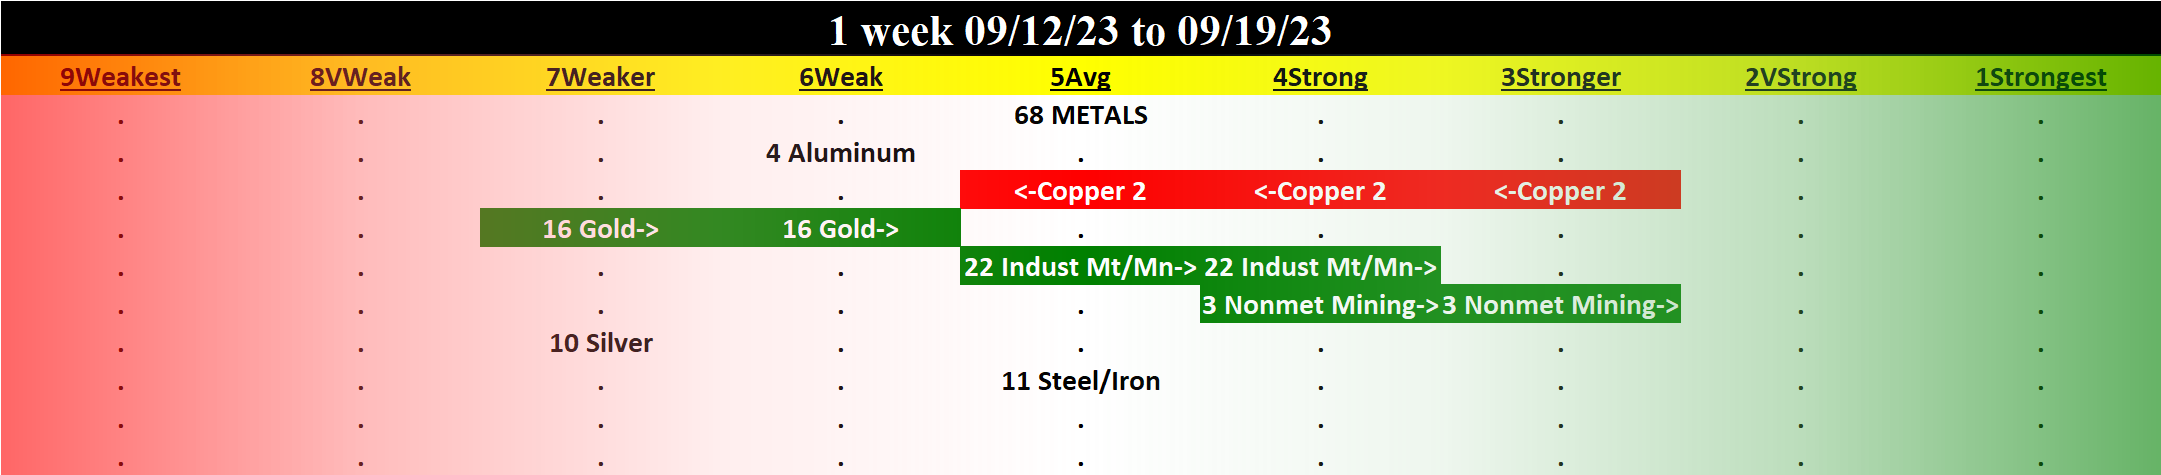
Largest/most material of 7 sub-industries (68 stocks total, average 10 stocks/sub-industry):
22 stocks Industrial Metals & Minerals
16 stocks Gold
11 stocks Steel & Iron
10 stocks Silver
10 Biggest Market Cap stocks: SCCO, FCX, NUE, NEM, GOLD, FNV, AEM, TECK, WPM, STLD
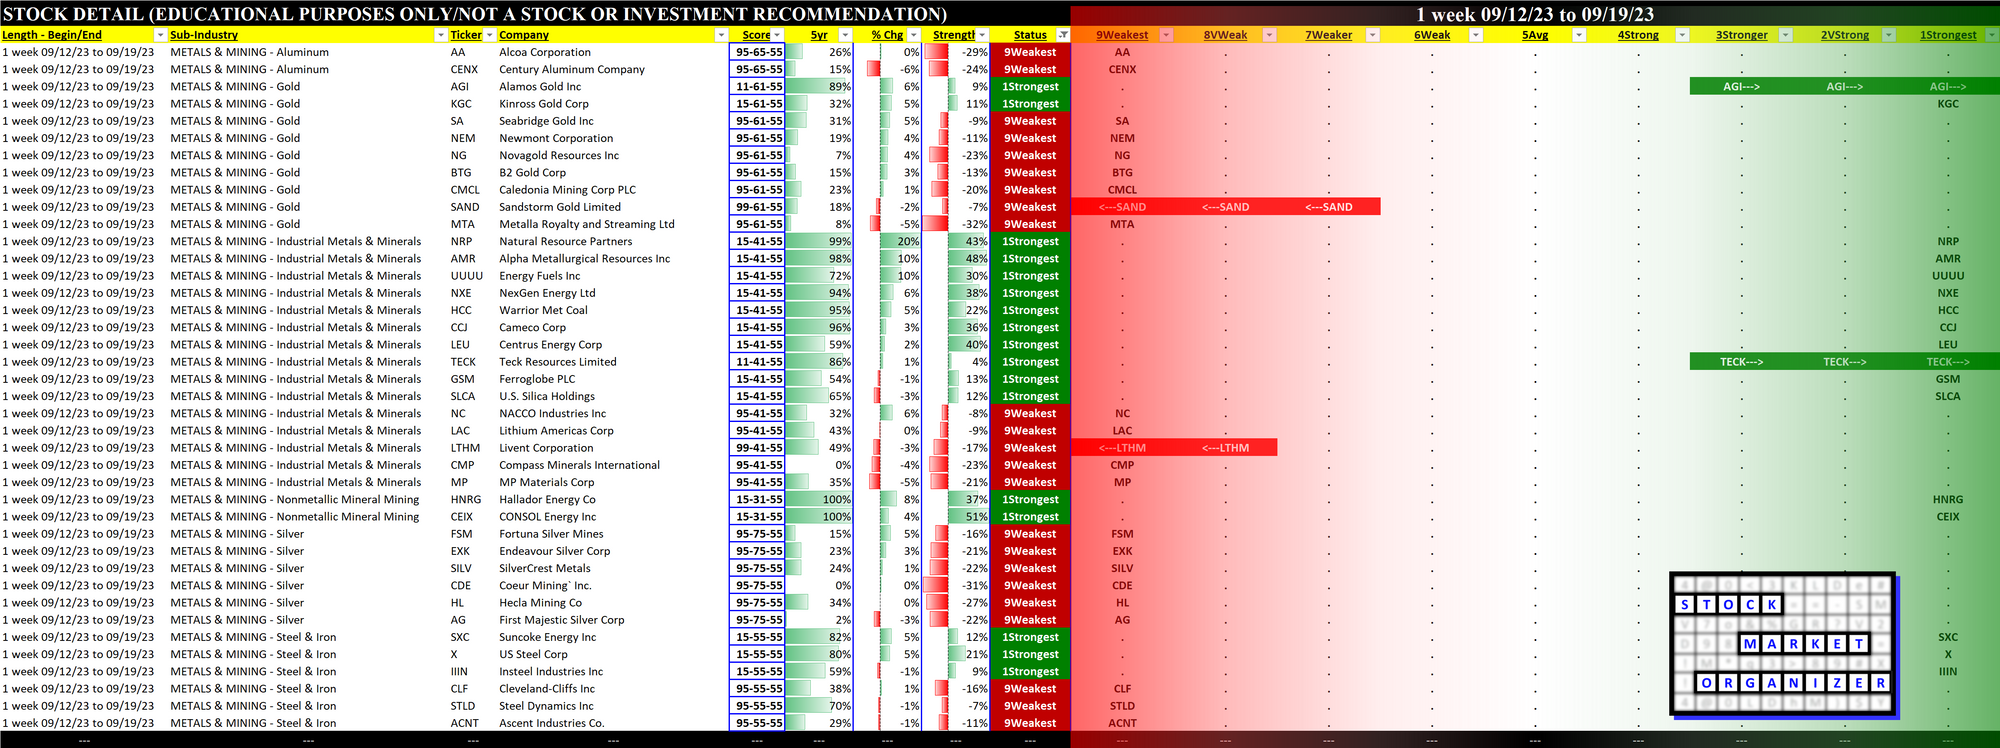
DETAIL: 1 Week Performance Review
Status
Strengthened: 3/7 sub-industries
Weakened: 1/7 sub-industries
Strongest at Stronger rating/3rd strongest of 9 levels:
3 stocks Nonmetallic Mineral Mining
Weakest at Weaker rating/7th strongest of 9 levels:
10 stocks Silver
Detail Charts: Sub-Industry and Stock
10-Week Week-by-Week Industry/Sub-industry Strength Comparison
What: recent week-by-week strength changes for the industry and each underlying sub-industry
Why: objective measurement of strengthening and weakening enabling comparison within and across industries and sub-industries
Strongest and Weakest Stocks
What: stocks currently rated Strongest/Weakest (highest/lowest of 9 strength ratings)
Why: most interesting stocks for available capital because
- the Strongest may be meme-stock mania candidates prone to breakouts, and
- the Weakest may be prone to large bottom-fishing/short-covering-driven pops... and may also be primed for bigger and faster falls.
(Not guaranteed and not a recommendation - weak stocks in weakening sub-industries may be better shorts than high-flyers.)
DETAIL: Lookbacks 6 Mos vs. 4 weeks vs. 1 Week
6 Mos Lookback
4 weeks Lookback
1 Week Lookback