Metals/Mining 2023-09-12: Unchanged at "AVERAGE" strength rating (5th strongest of 9 levels), previous move was UP
Bottom line: Metals & Mining has generally been up over the past 4 weeks but down over the past 6 weeks, and flat over the past 10 weeks.
Key stocks: SCCO, FCX, NUE, NEM, GOLD, FNV, AEM, TECK, WPM, STLD (top 10 by market cap).
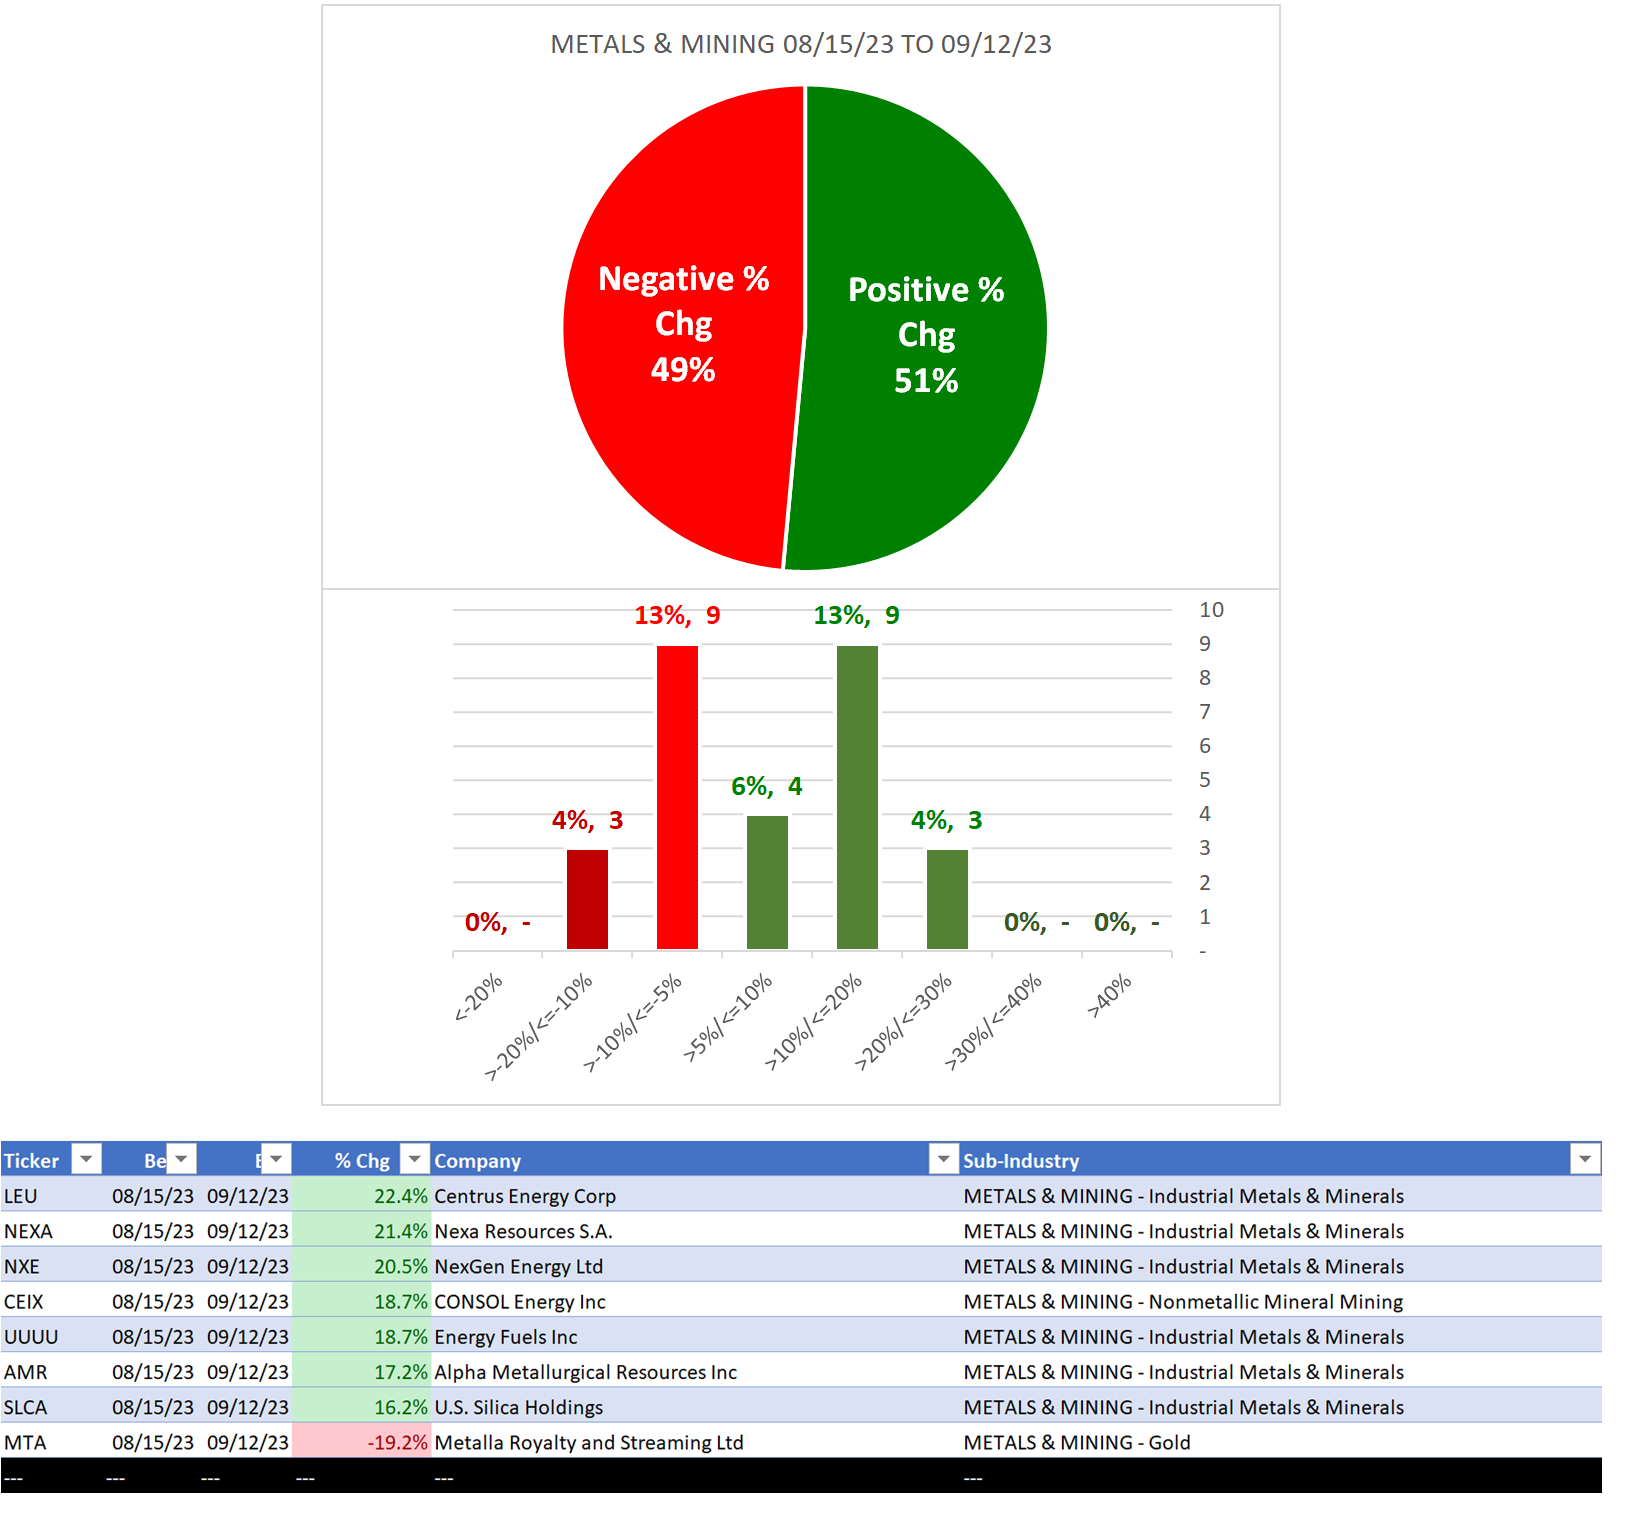
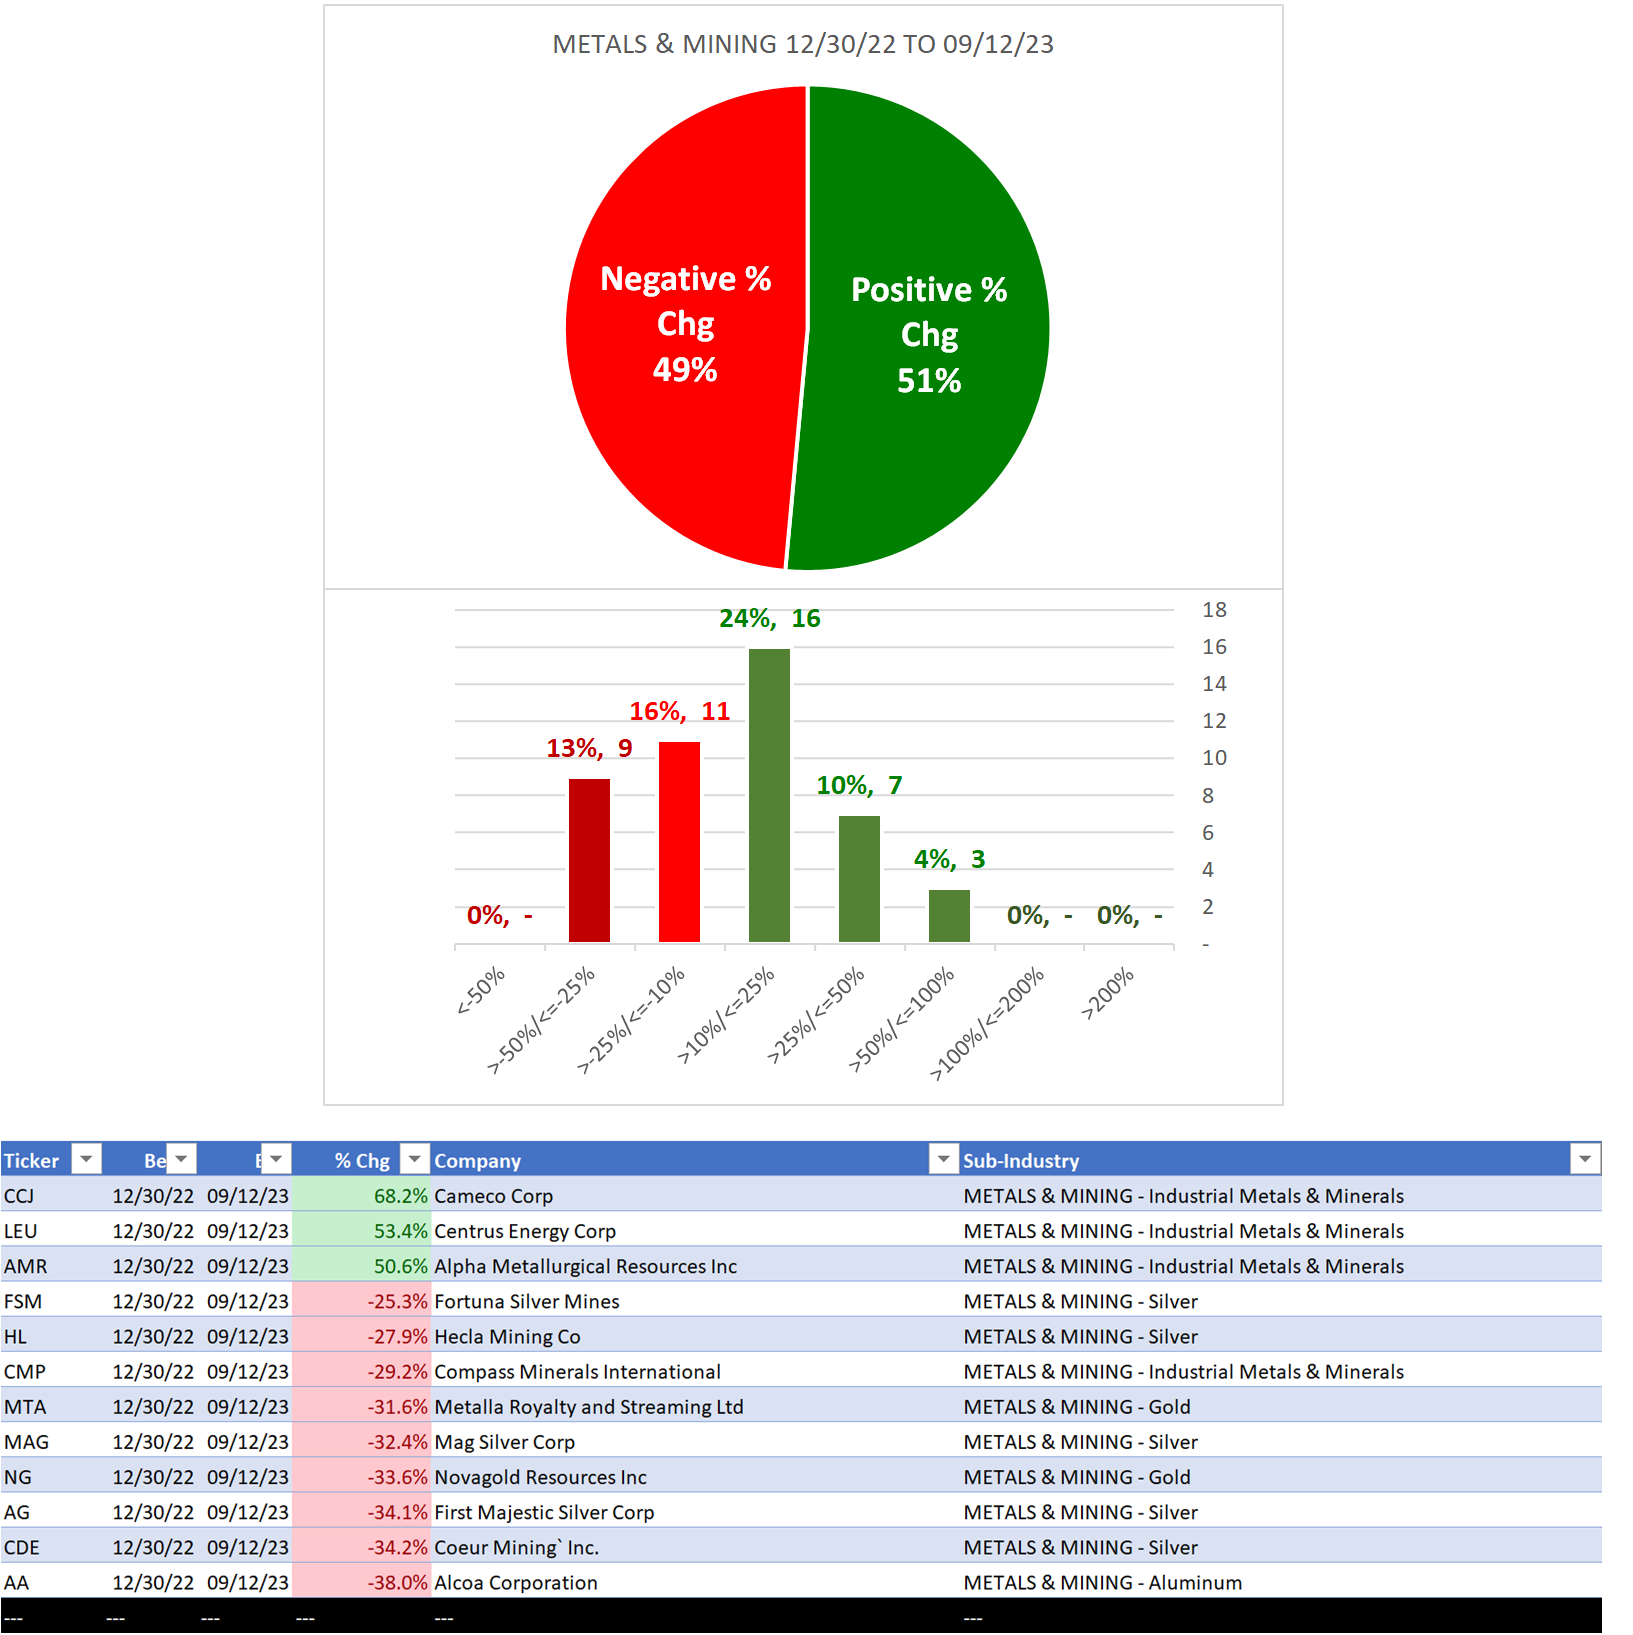
Context: The industry has been 51% positive YTD and over the past month.
One week, YTD, and one month reviews below, along with links to past reviews.
1 Week Detail
Overview
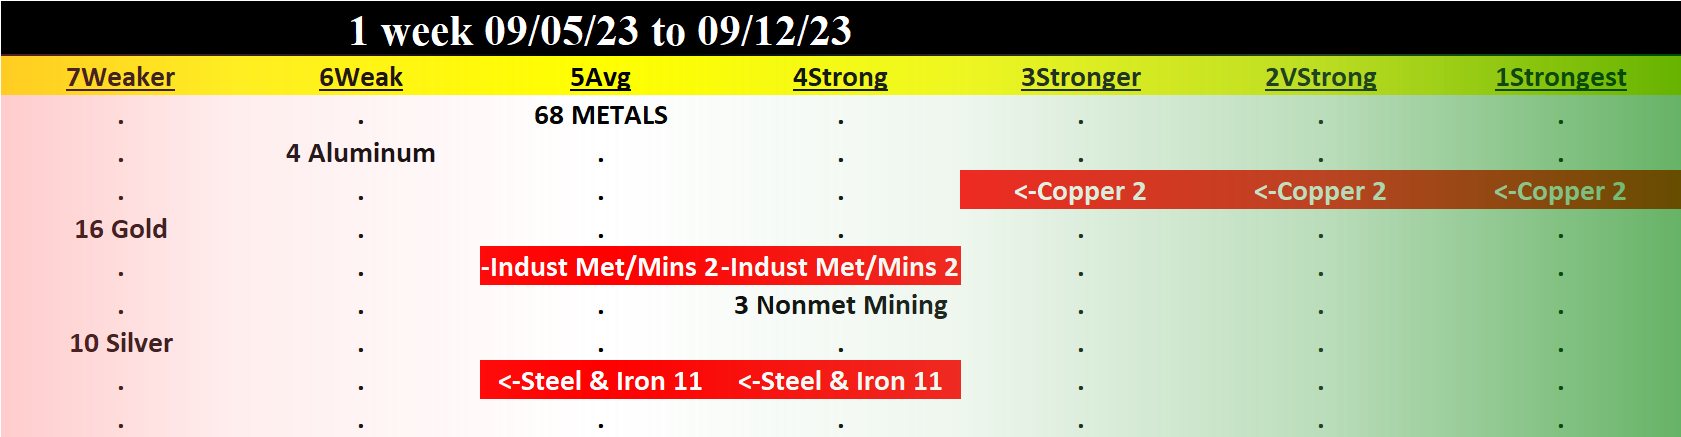
No sub-industries strengthened and 3 sub-industries weakened (7 total).
Strongest at Stronger rating (3rd strongest of 9 levels):
1. Copper
Weakest at Weaker rating (7th strongest):
1. Tie, Gold and Silver
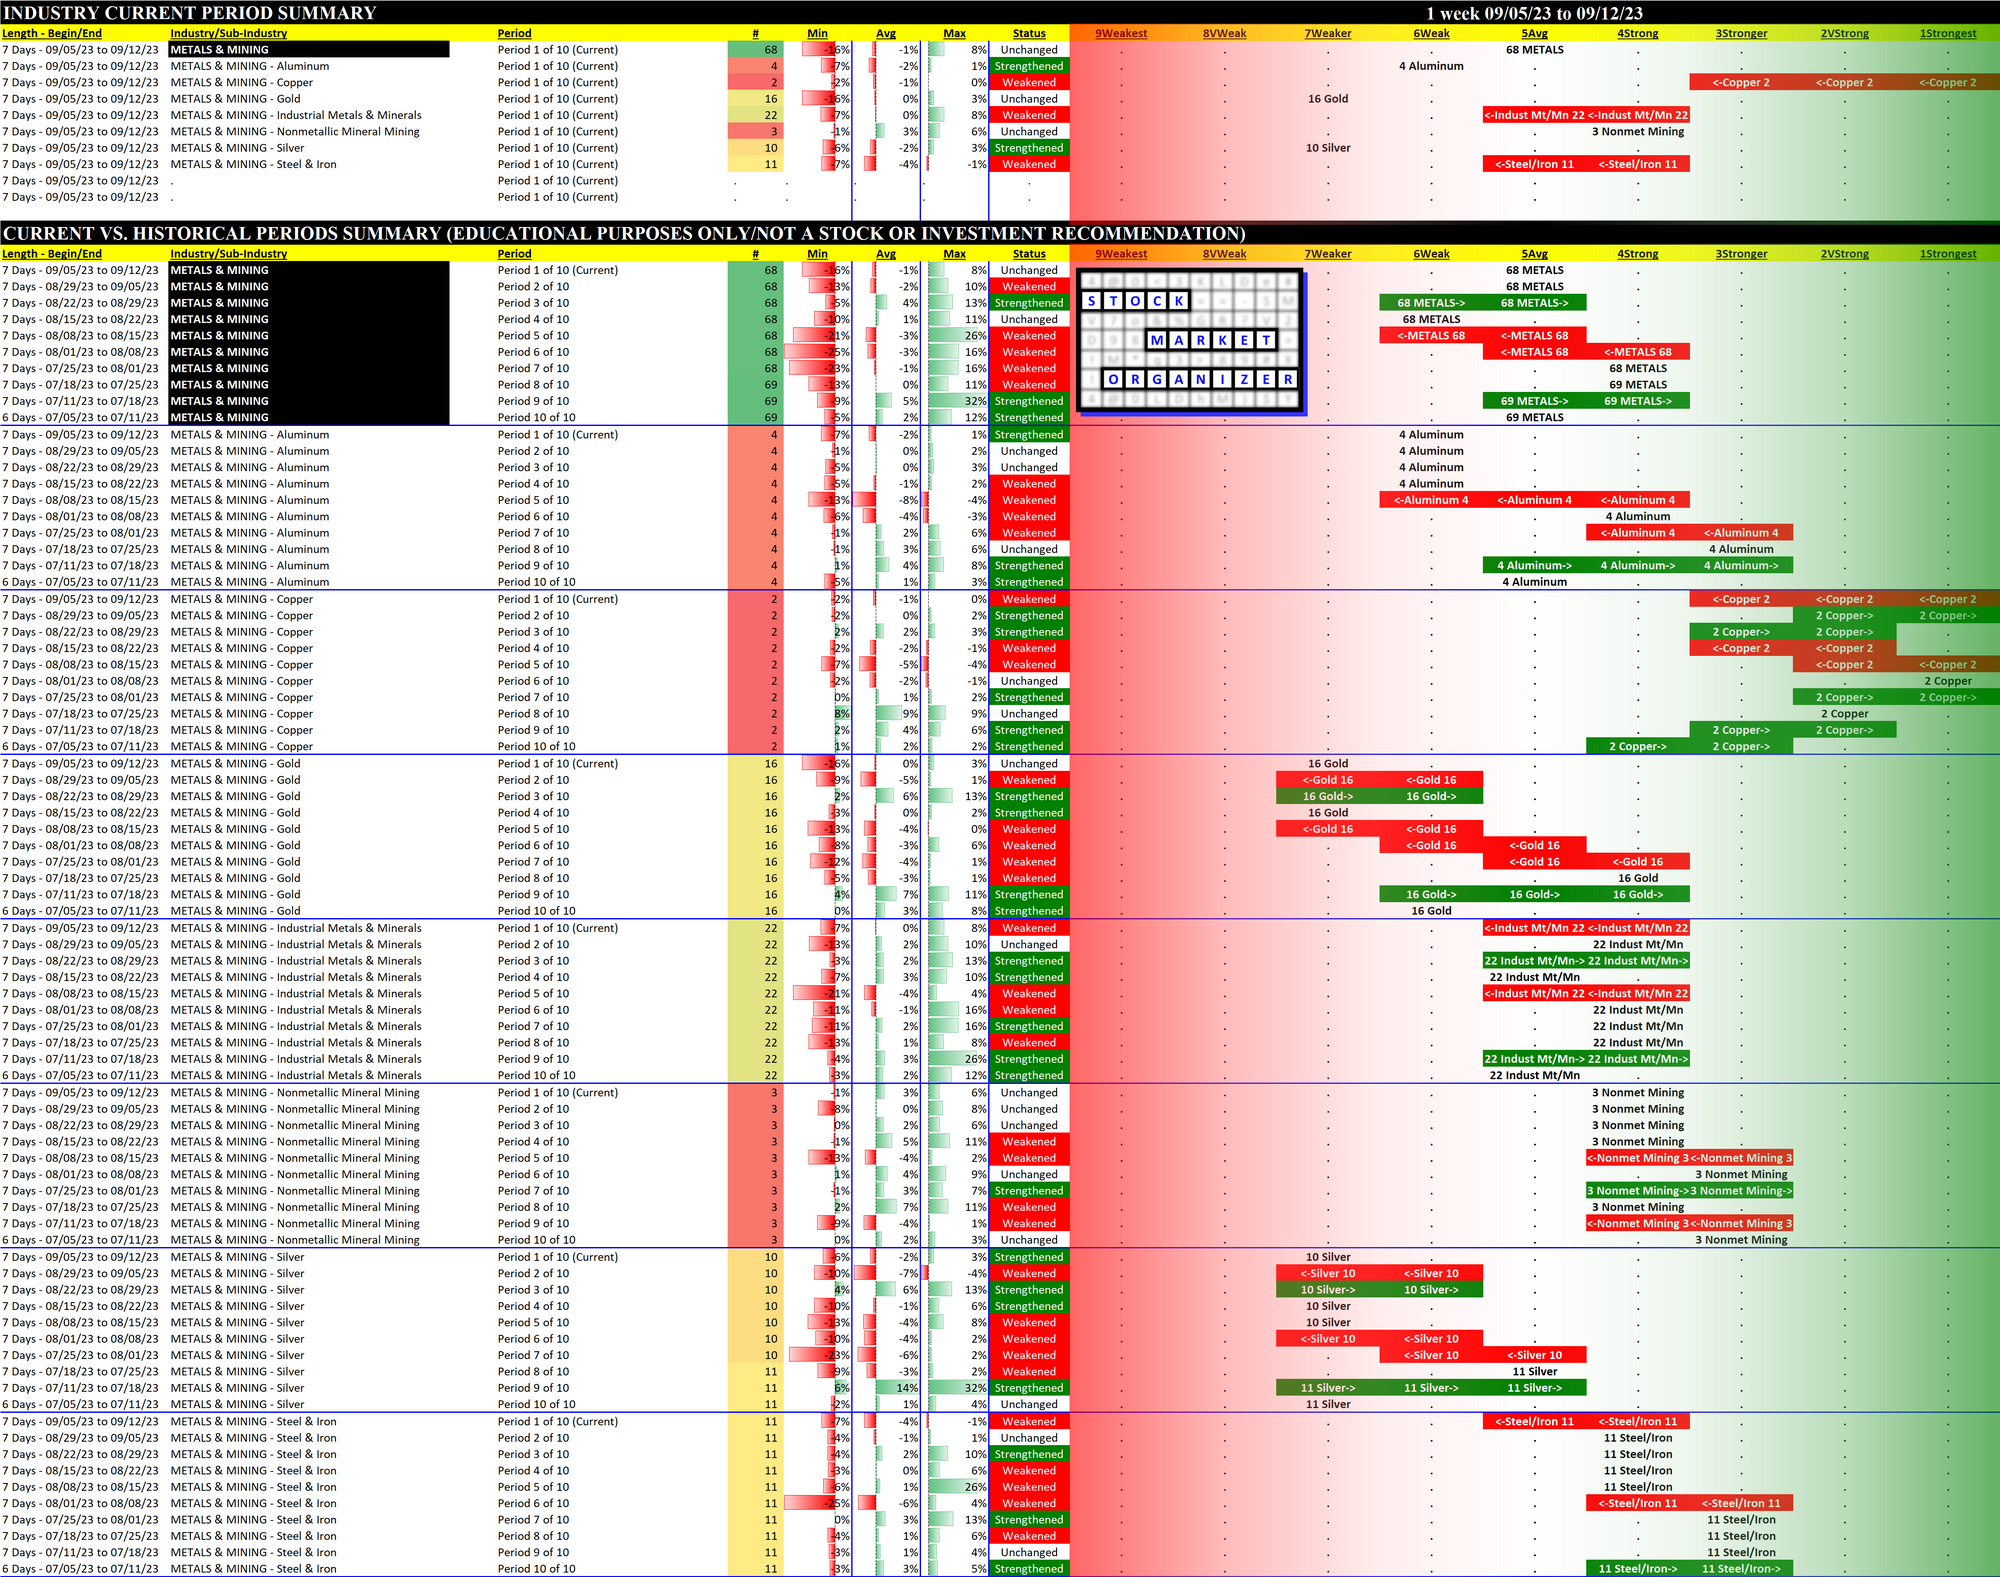
10-Week Industry/Sub-industry Week-by-Week Comparison
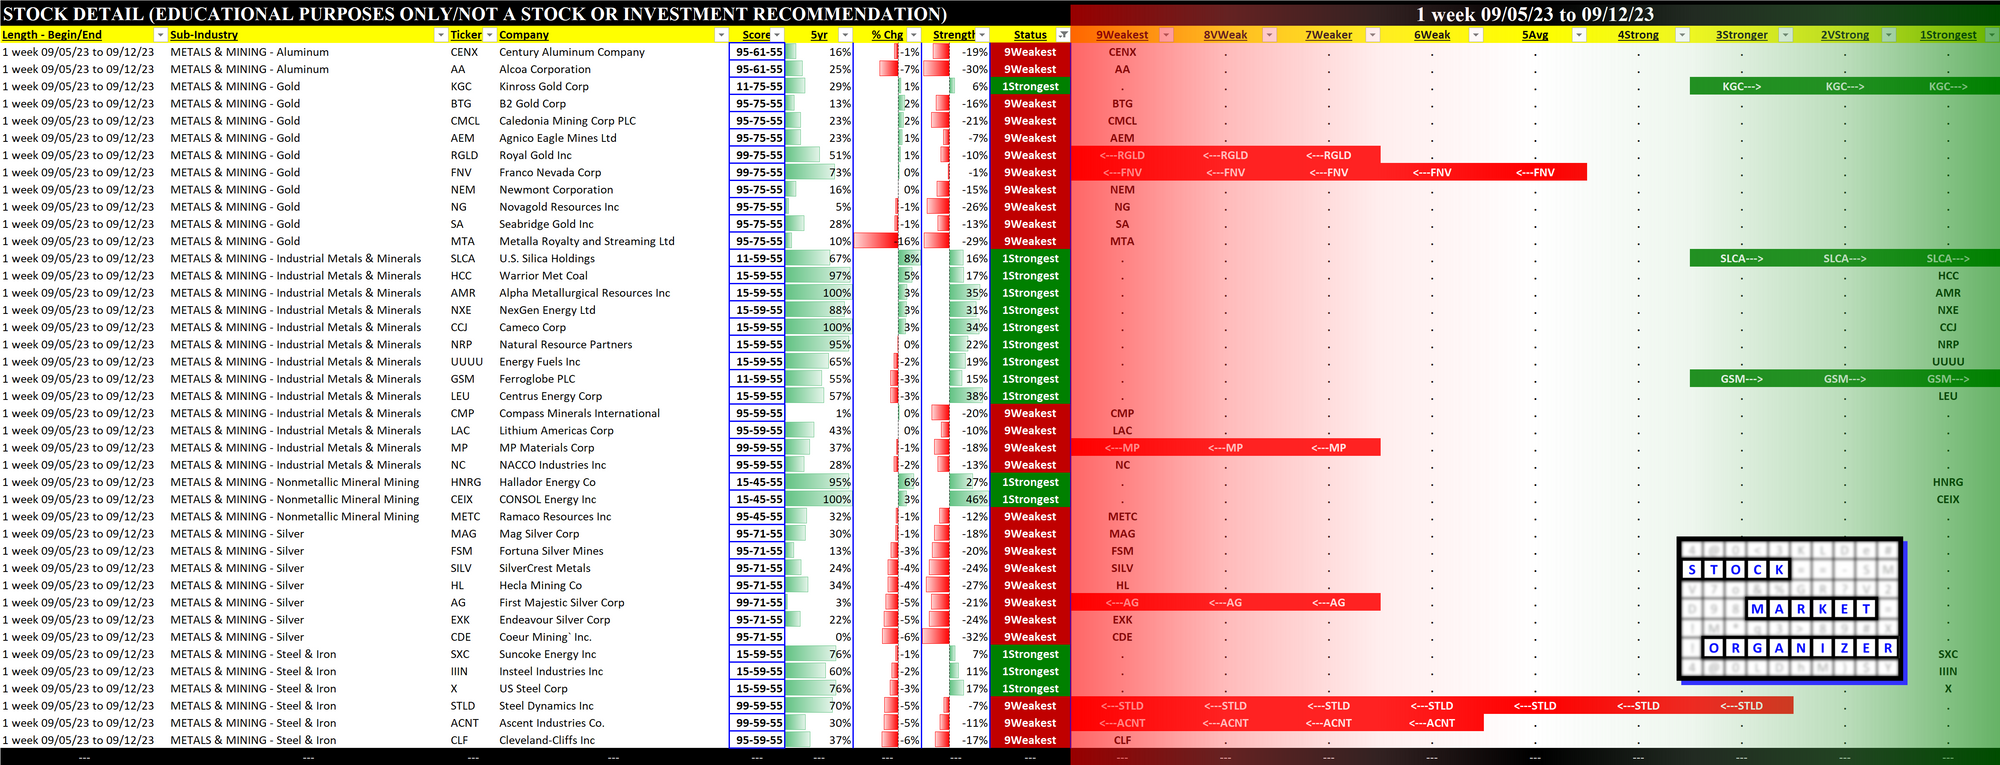
Individual Stock Leaders and Laggards
Current strongest and weakest stocks are shown below. These are of most interest as the downtrodden are prone to large (if perhaps temporary) pops while the strongest have been leading the charge for their sub-industries.
Historical Context - YTD and 4 week Lookbacks
Standout winners and losers for different lookback periods are shown below including their sub-industries.
YTD Lookback
4 Week Lookback