Materials & Construction 2023-10-03: DOWN -1 to WEAK strength rating (6th strongest of 9 levels), previous move was also DOWN
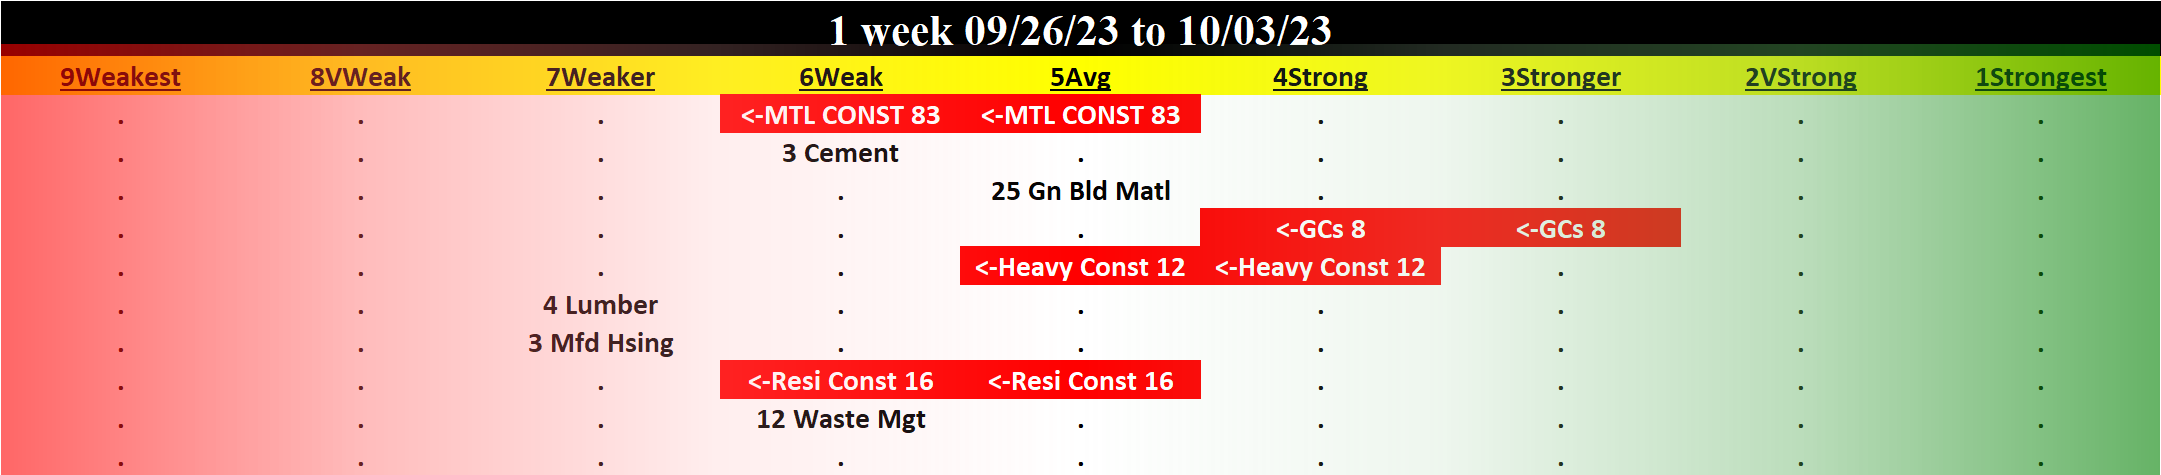
TABLE OF CONTENTS
- INDUSTRY OVERVIEW
1A. Performance
1B. Background - SUB-INDUSTRIES AND STOCKS DETAIL
2A. Sub-Industries Overview
2B. Sub-Industries 10-Week Strengthening Analysis
2C. Stocks 1 Week Strongest and Weakest - STRENGTH BY LOOKBACK PERIOD (with Best/Worst stocks)
3A. Lookback 6 Months
3B. Lookback 4 weeks
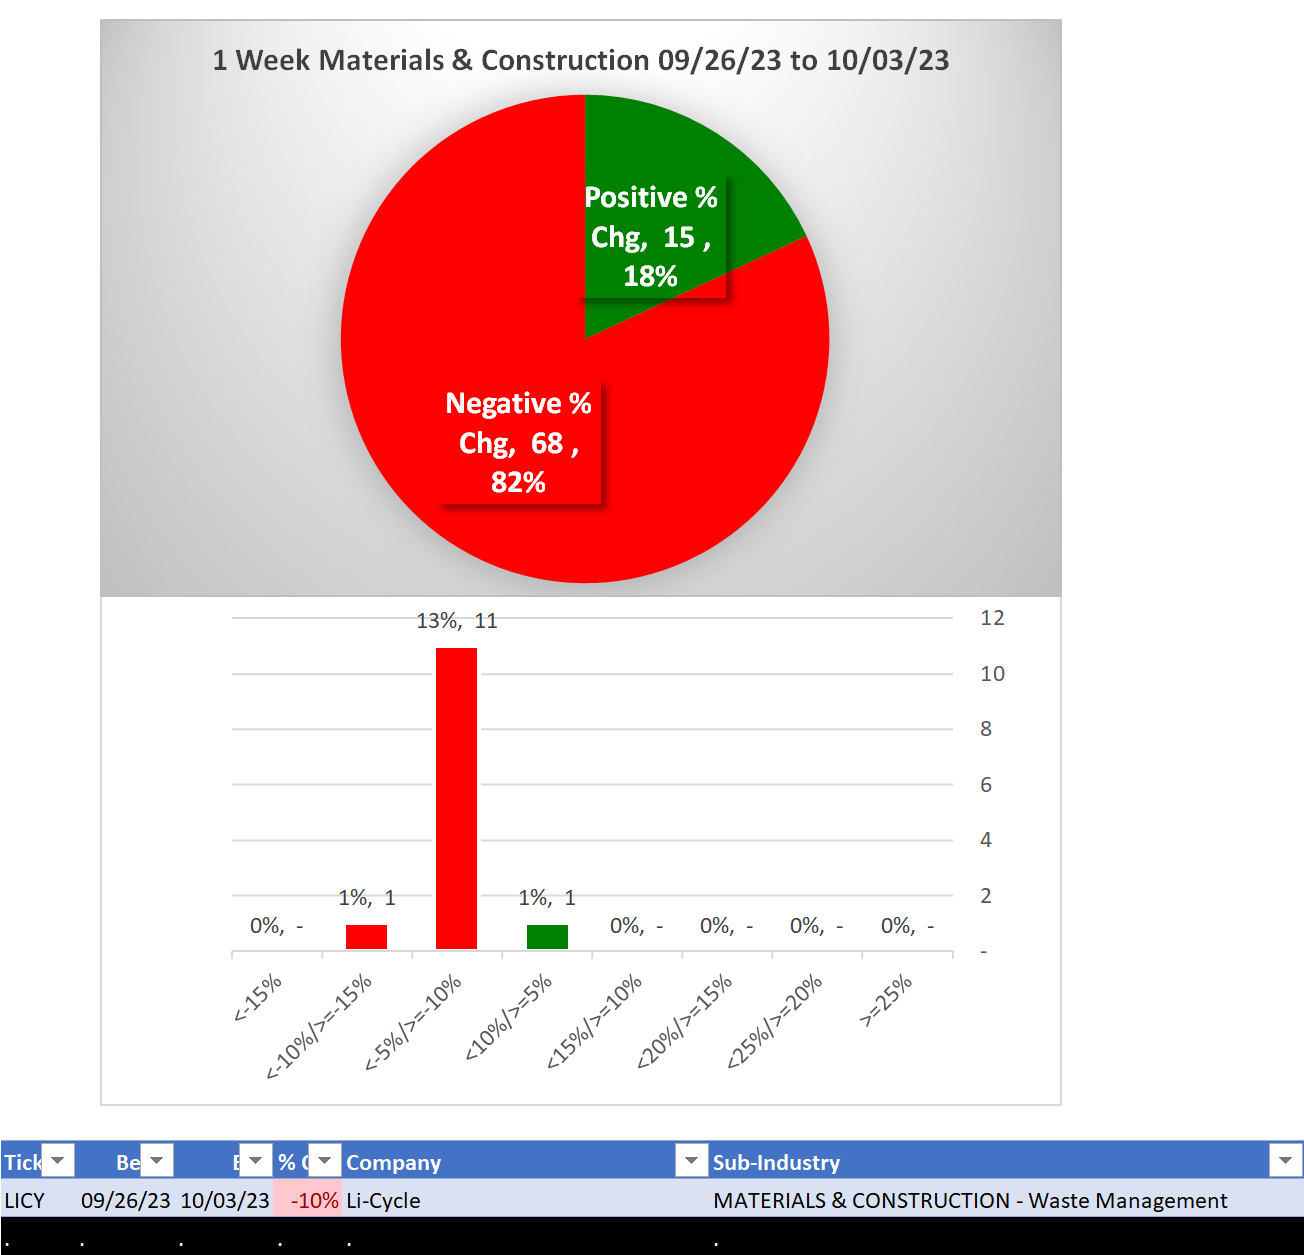
3C. Lookback 1 Week
1. INDUSTRY OVERVIEW
1A. Performance
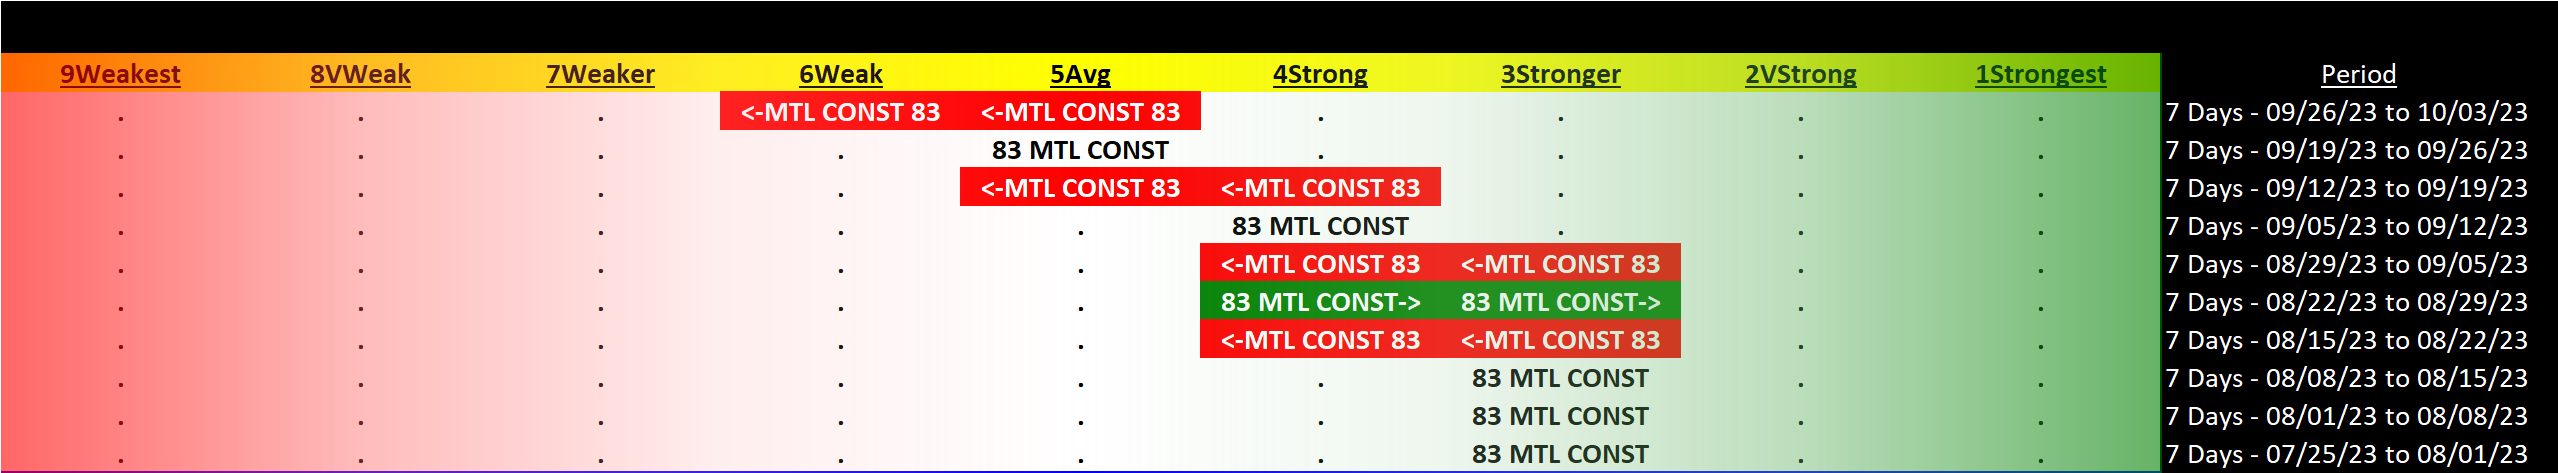
Past 10 Weeks Strengthening/Weakening week-by-week, per the following chart:
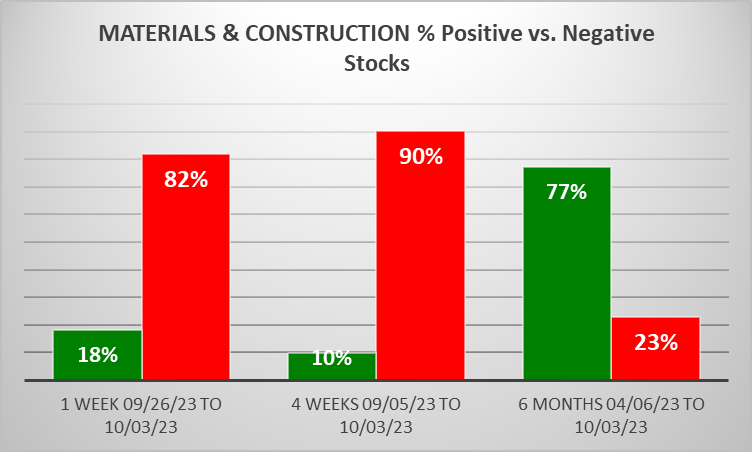
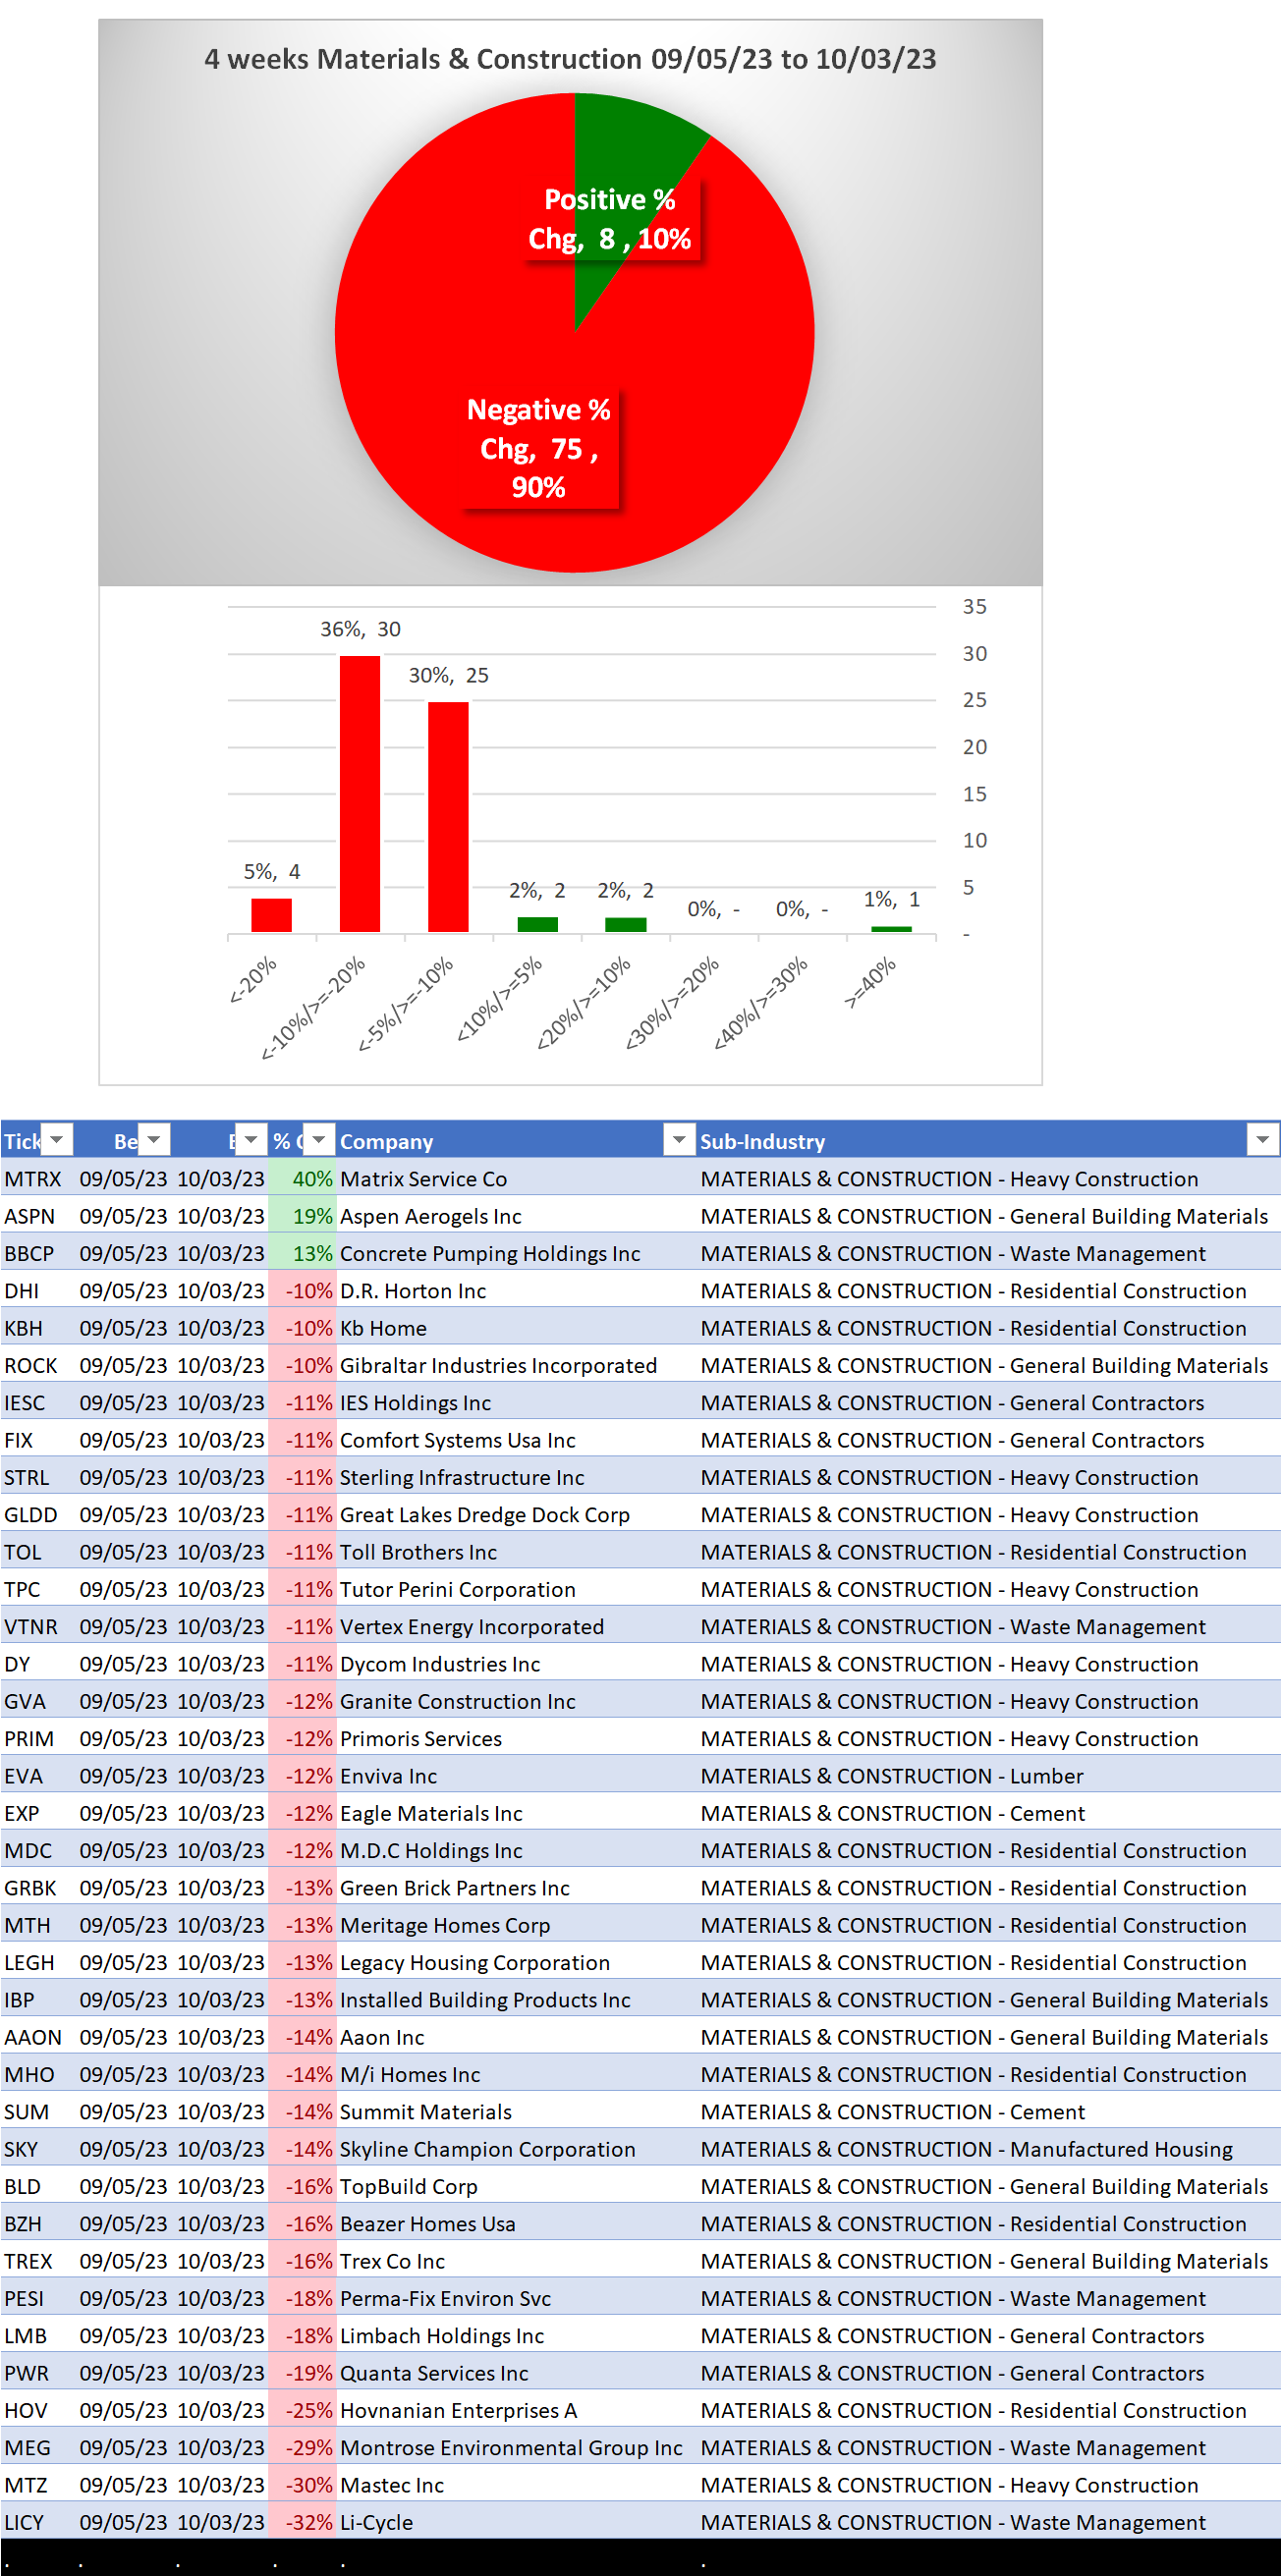
Mixed/STRENGTHENING 1 Week vs. Mid- and Longer-Term // 1 week positive/negative stocks ratio is HIGHER than 4 weeks but LOWER than 6 Months, per the following chart:
Comment:
- Residential Construction (homebuilders) has weakened 5 of 9 strength levels in 7 weeks
- 4 weeks, 41% of total stocks returned <-10%.
1B. Background
Largest of 8 sub-industries (83 stocks, average 10):
- General Building Materials (25 stocks)
- Residential Construction (16 stocks)
- Heavy Construction (12 stocks)
- Waste Management (12 stocks)
Top 10 by Market Capitalization:
WM/Waste Management Inc, CARR/Carrier Global Corporation, RSG/Republic Services Inc, DHI/D.R. Horton Inc, WCN/Waste Connections Inc, LEN/Lennar Corp Cl A, FAST/Fastenal Company, PWR/Quanta Services Inc, VMC/Vulcan Materials Co, MLM/Martin Marietta Materials Inc
2. SUB-INDUSTRIES AND STOCKS DETAIL
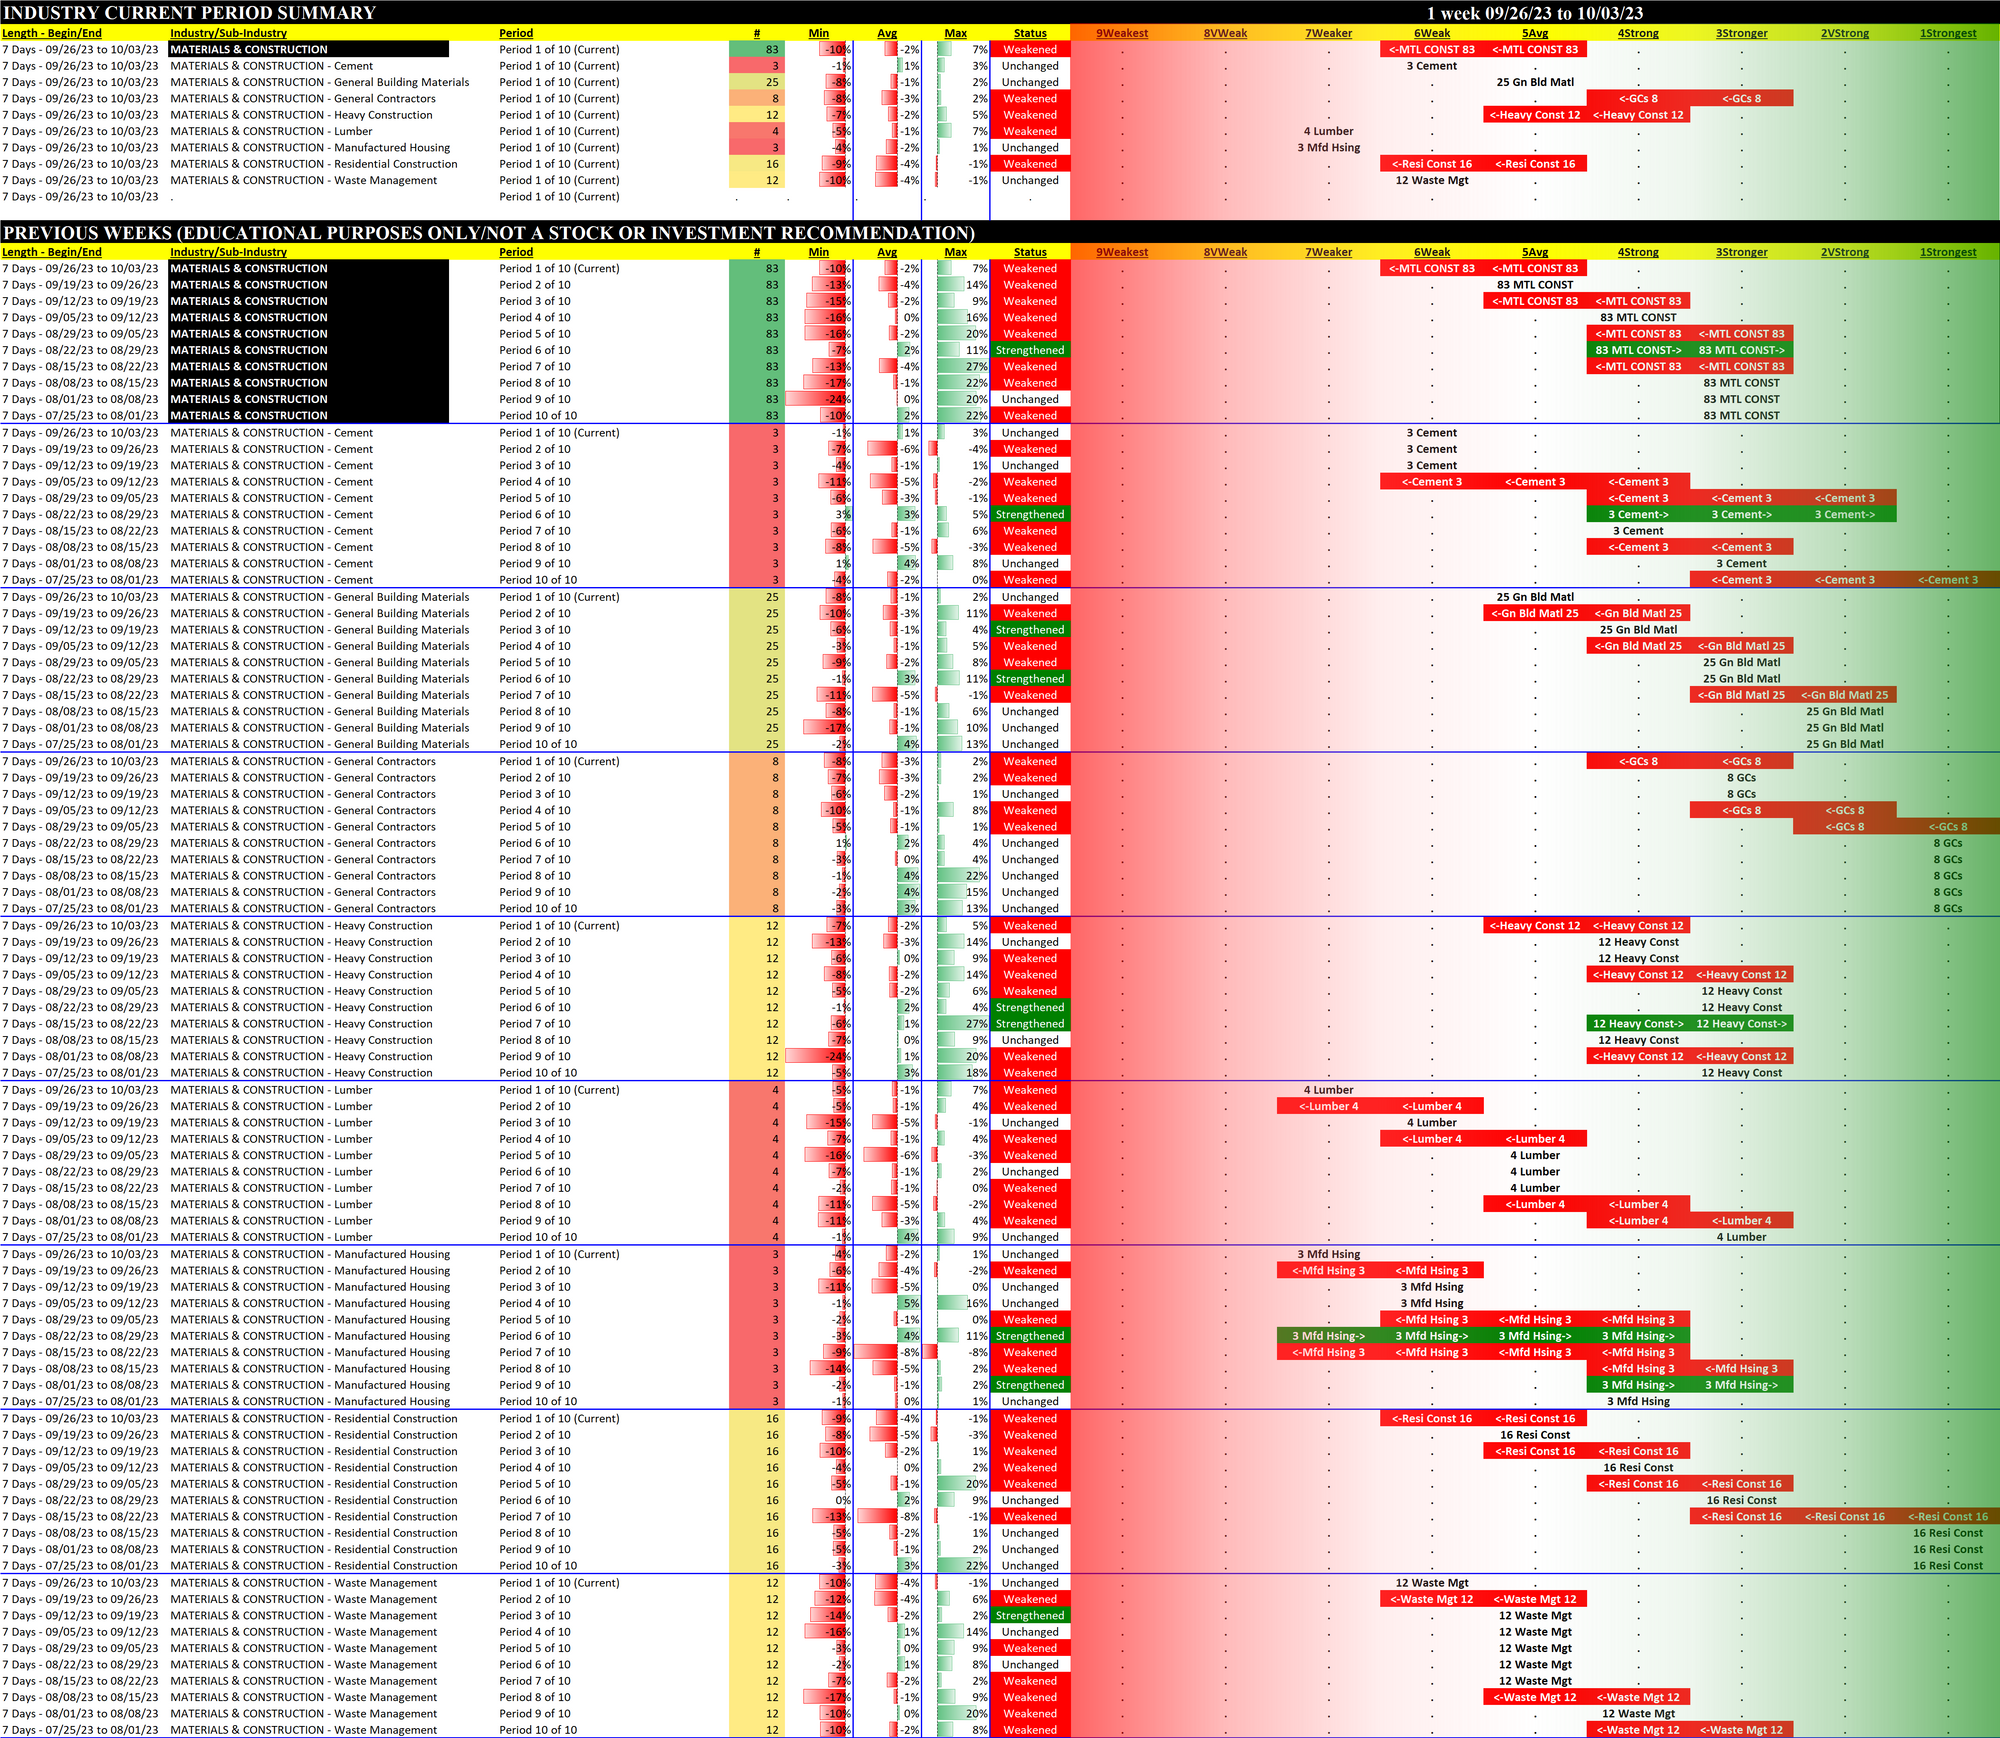
2A. Sub-Industries Overview
Strengthened: 0/8 sub-industries
Weakened: 3/8 sub-industries
STRONGEST at Strong rating/4th strongest of 9 levels:
- General Contractors (8 stocks)
WEAKEST at Weaker rating/7th strongest of 9 levels:
- Lumber (4 stocks)
- Manufactured Housing (3 stocks)
2B. Sub-Industries 10-Week Strengthening Analysis
What: recent week-by-week strength changes for the industry and each underlying sub-industry
Why: objective measurement of strengthening and weakening enabling comparison within and across industries and sub-industries
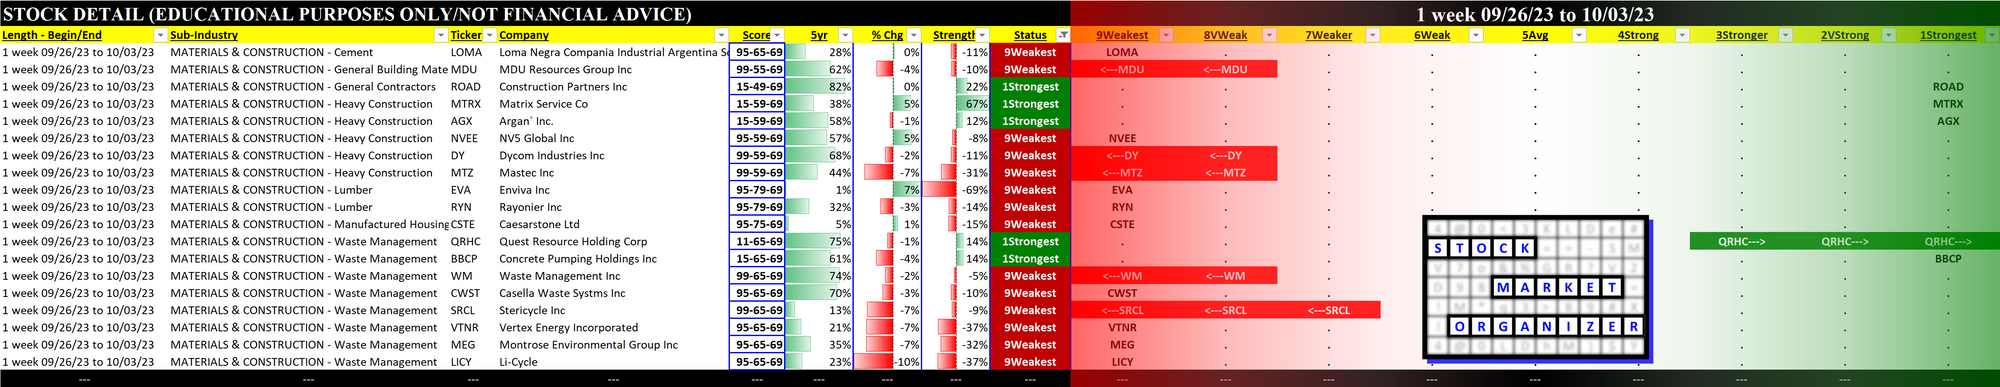
2C. Stocks 1 Week Strongest and Weakest
What: stocks currently rated Strongest/Weakest (highest/lowest of 9 strength ratings)
Why: most interesting stocks for available capital because
- the Strongest have the least amount of overhead supply to dampen breakouts while
- the Weakest may be prone to volatility, subject to big pops from bottom-fishing and short-covering BUT ALSO to bigger and faster falls.
(Not guaranteed and not a recommendation - weak stocks in weakening sub-industries may be better shorts than high-flyers.)
3. STRENGTH BY LOOKBACK PERIOD (with Best/Worst stocks)
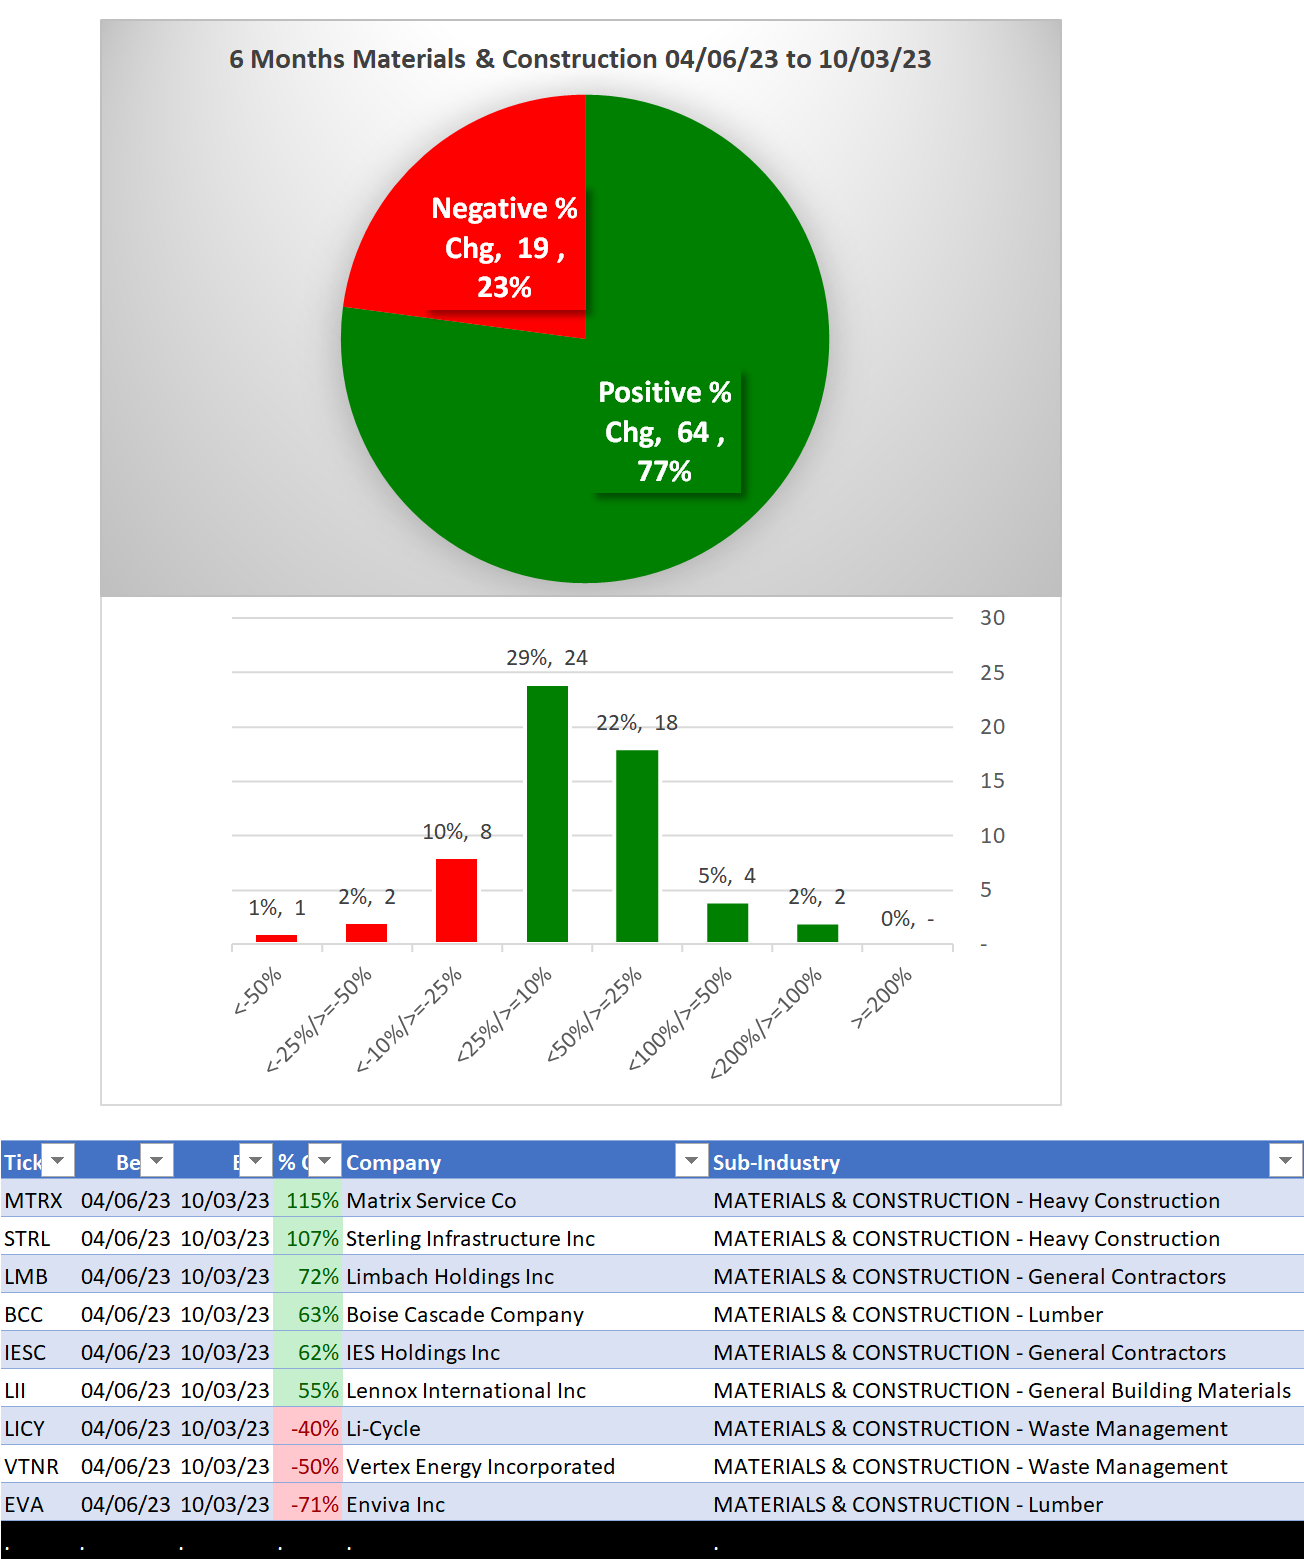
3A. Lookback 6 Months
3B. Lookback 4 weeks
3C. Lookback 1 Week