Materials & Construction 2023-09-19: DOWN -1 to AVERAGE strength rating (5th strongest of 9 levels), previous move was also DOWN
SUMMARY
Performance
Bottom Line: weakened 2 strength levels in 3 weeks
Context:
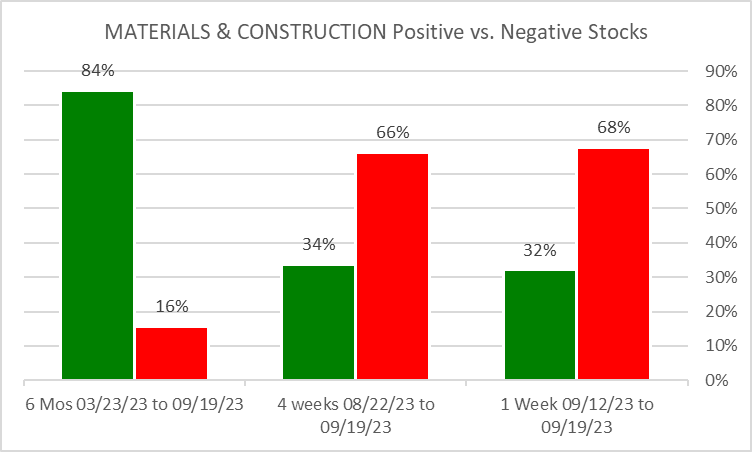
- weakening short/mid-term vs. longer-term.
- Positive stocks 1 week/4 weeks < 50% the 6 month total.
Other Notes:
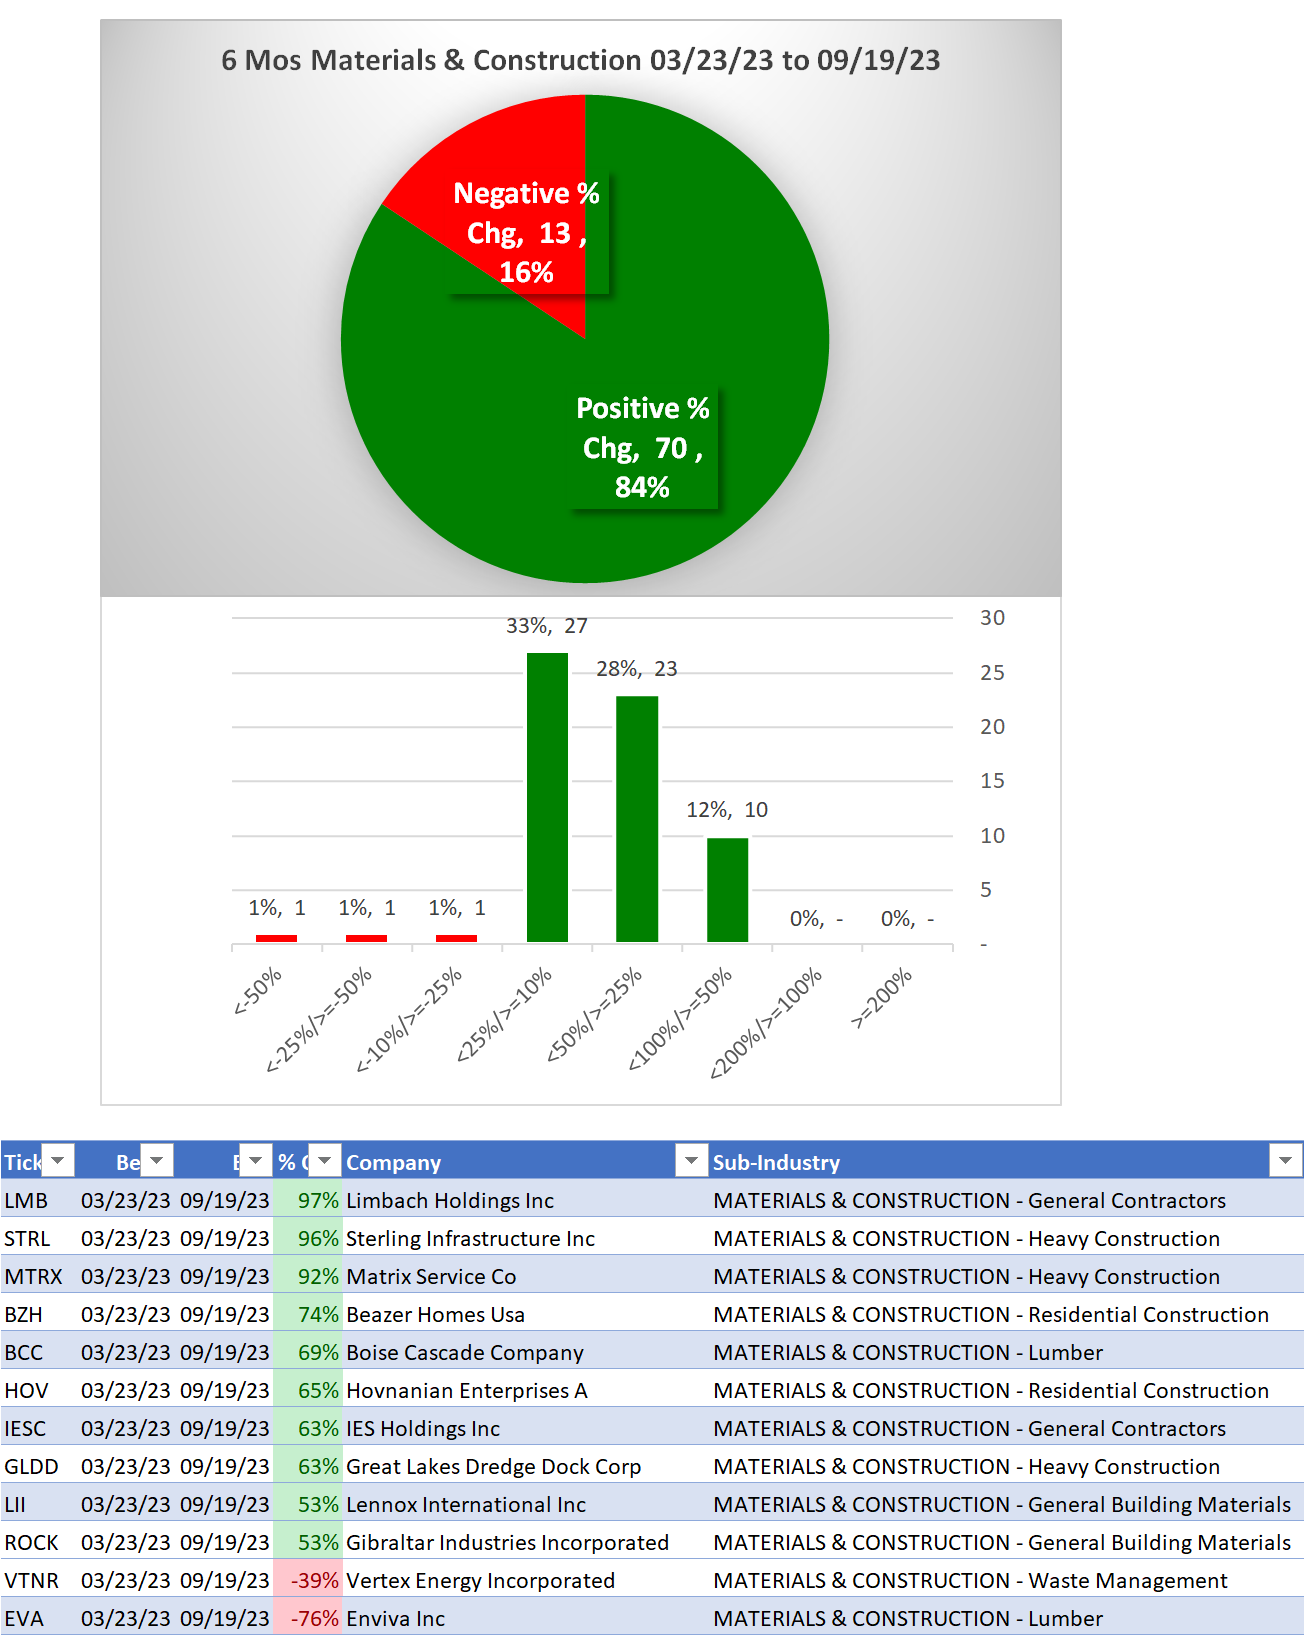
6 Months
LMB/Limbach Holdings Inc (General Contractors) +97%
STRL/Sterling Infrastructure Inc (Heavy Construction) +96%
MTRX/Matrix Service Co (Heavy Construction) +92%
VTNR/Vertex Energy Incorporated (Waste Management) -39%
EVA/Enviva Inc (Lumber) -76%
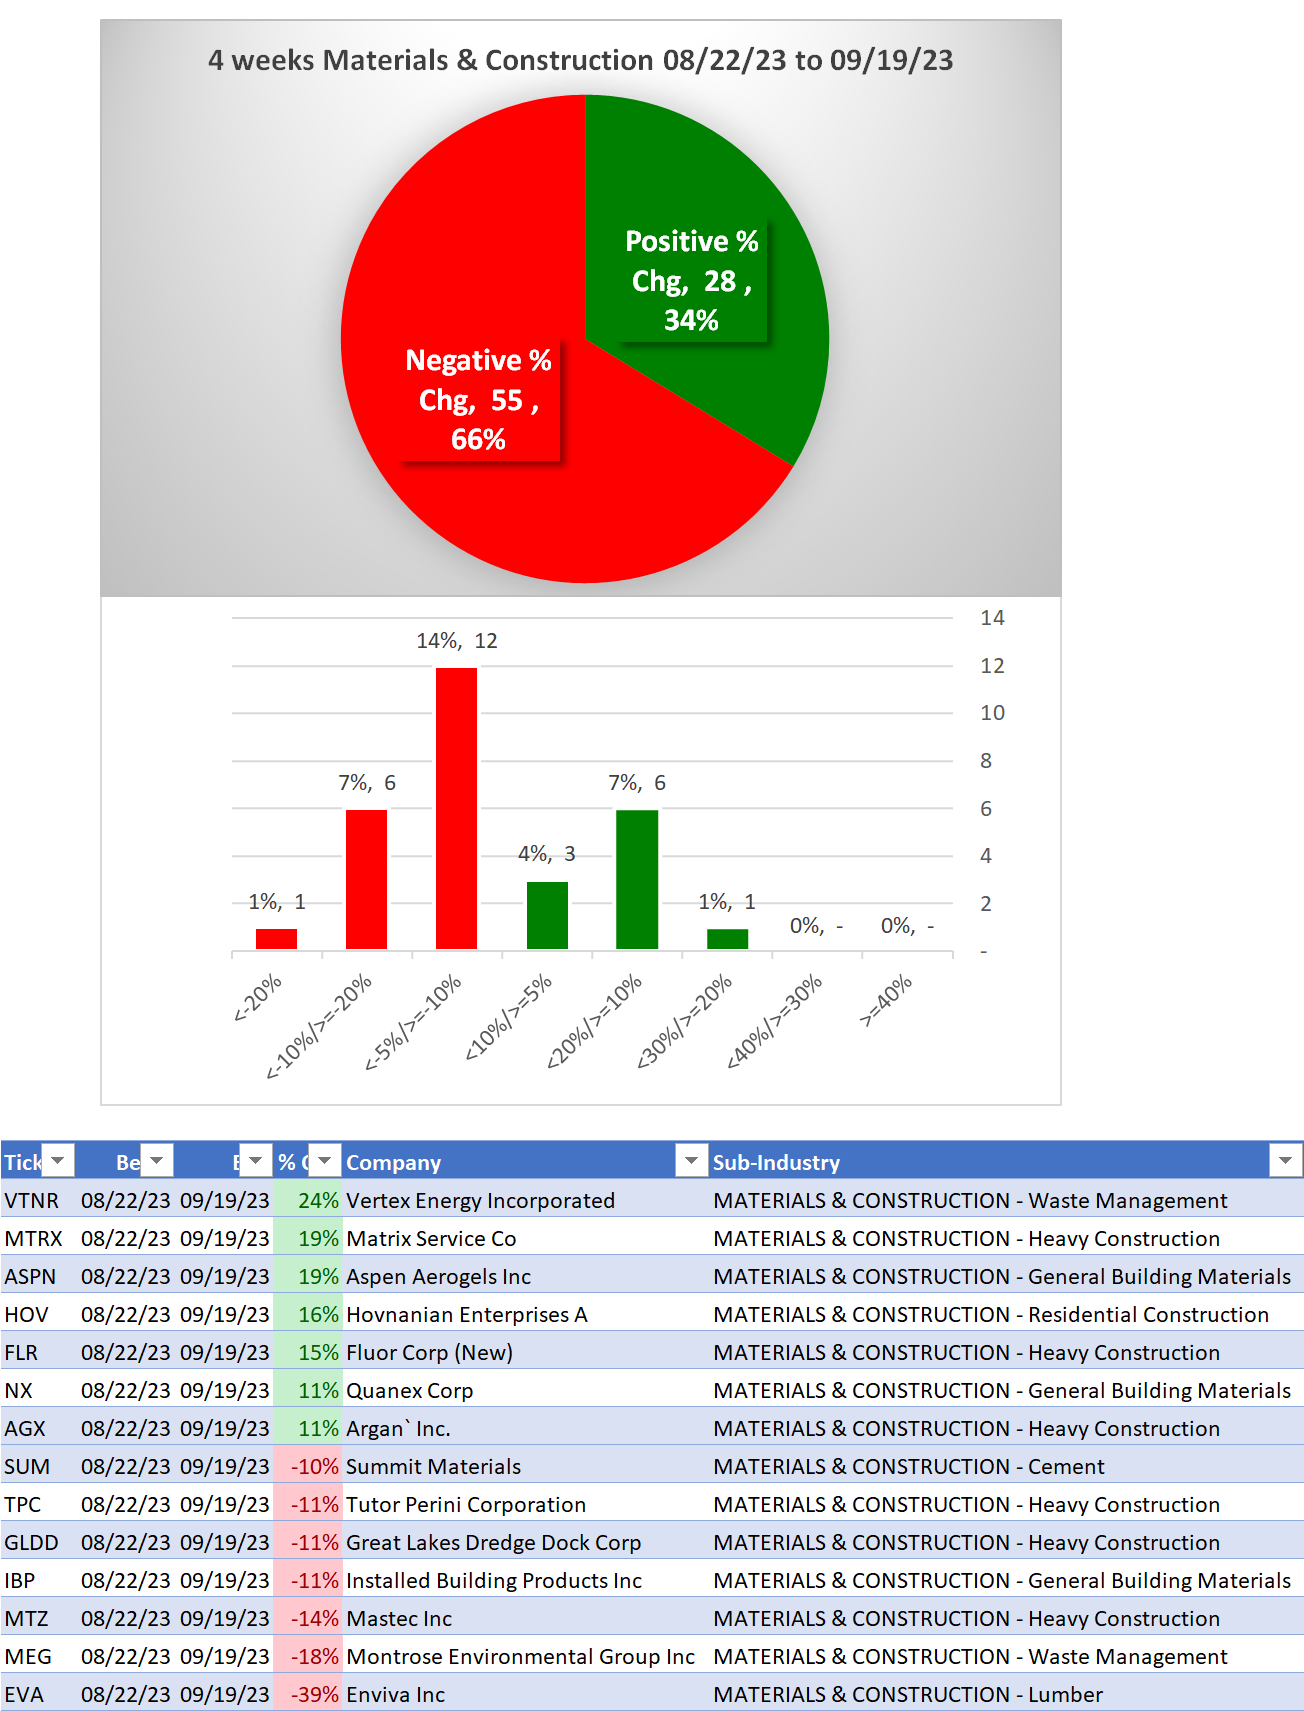
4 Weeks
VTNR/Vertex Energy Incorporated (Waste Management) +24%
MTRX/Matrix Service Co (Heavy Construction) +19%
ASPN/Aspen Aerogels Inc (General Building Materials) +19%
HOV/Hovnanian Enterprises A (Residential Construction) +16%
MEG/Montrose Environmental Group Inc (Waste Management) -18%
EVA/Enviva Inc (Lumber) -39%
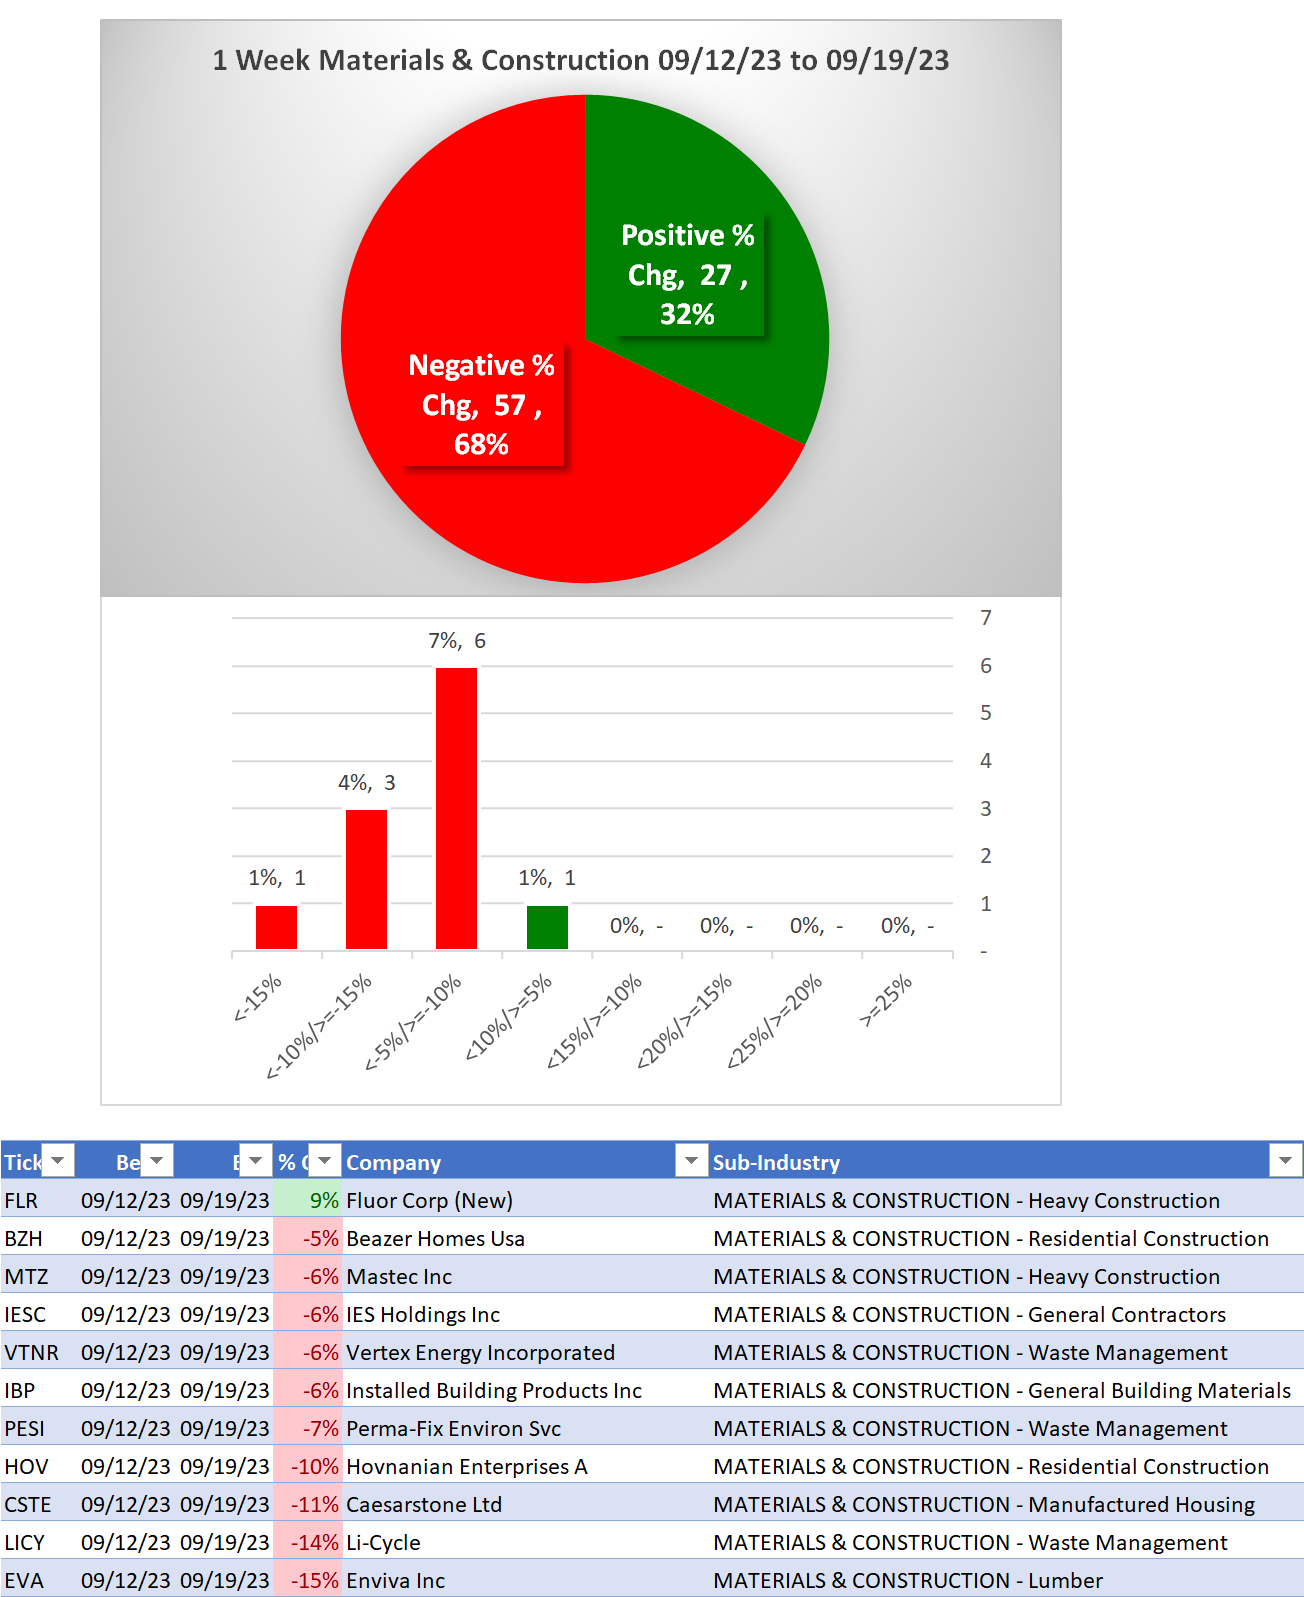
1 Week
EVA/Enviva Inc (Lumber) -15%
Background
Largest/most material of 8 sub-industries (83 stocks total, average 10 stocks/sub-industry):
25 stocks General Building Materials
16 stocks Residential Construction
12 stocks Heavy Construction
12 stocks Waste Management
10 Biggest Market Cap stocks: WM, CARR, RSG, DHI, WCN, LEN, FAST, PWR, VMC, MLM
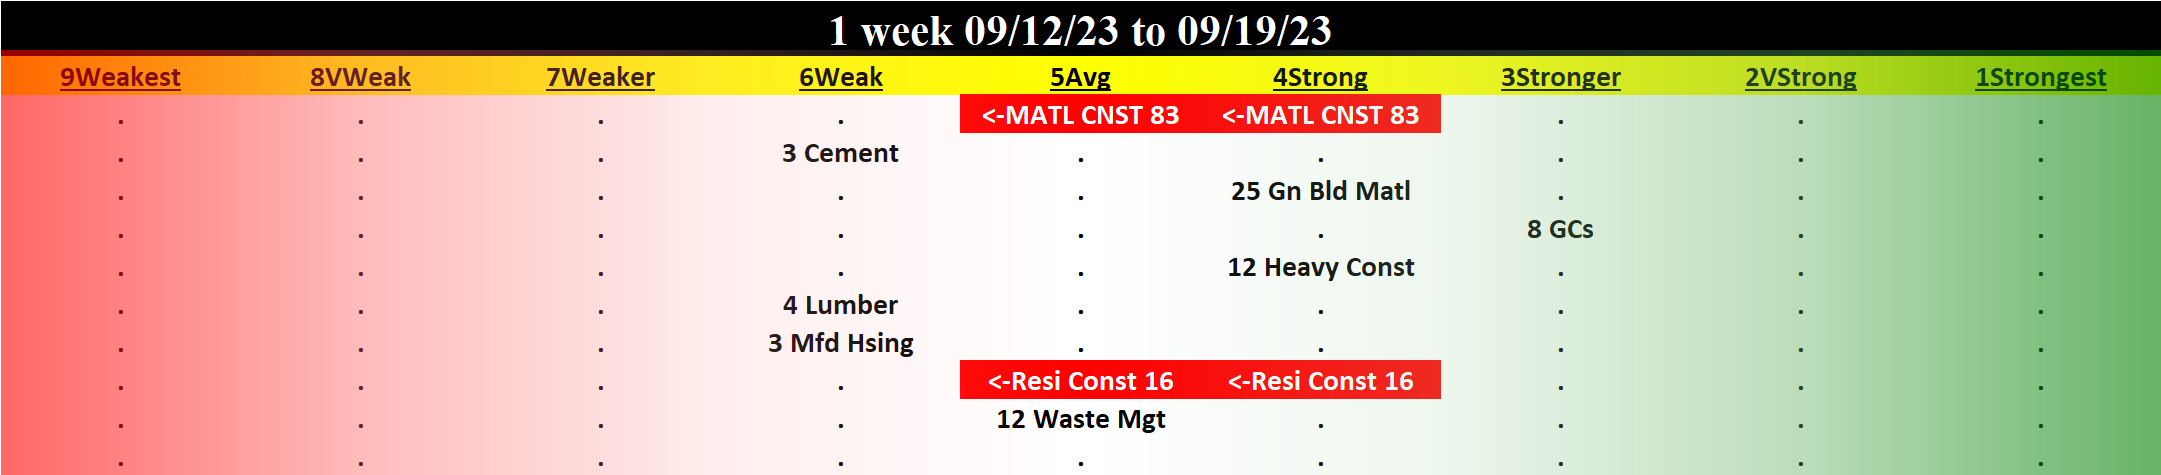
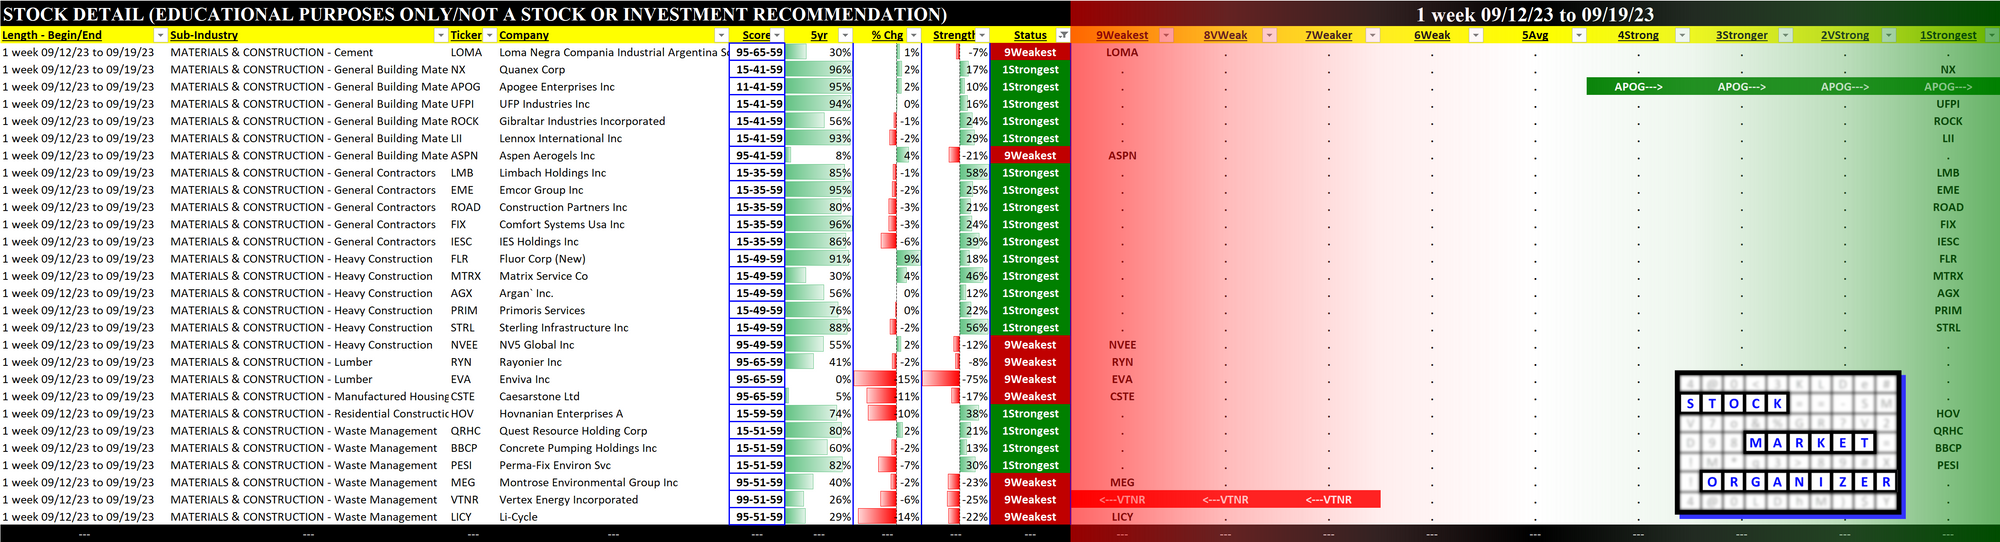
DETAIL: 1 Week Performance Review
Status
Strengthened: 0/8 sub-industries
Weakened: 1/8 sub-industries
Strongest at Stronger rating/3rd strongest of 9 levels:
8 stocks General Contractors
Weakest at Weak rating/6th strongest of 9 levels:
3 stocks Cement
4 stocks Lumber
3 stocks Manufactured Housing
Detail Charts: Sub-Industry and Stock
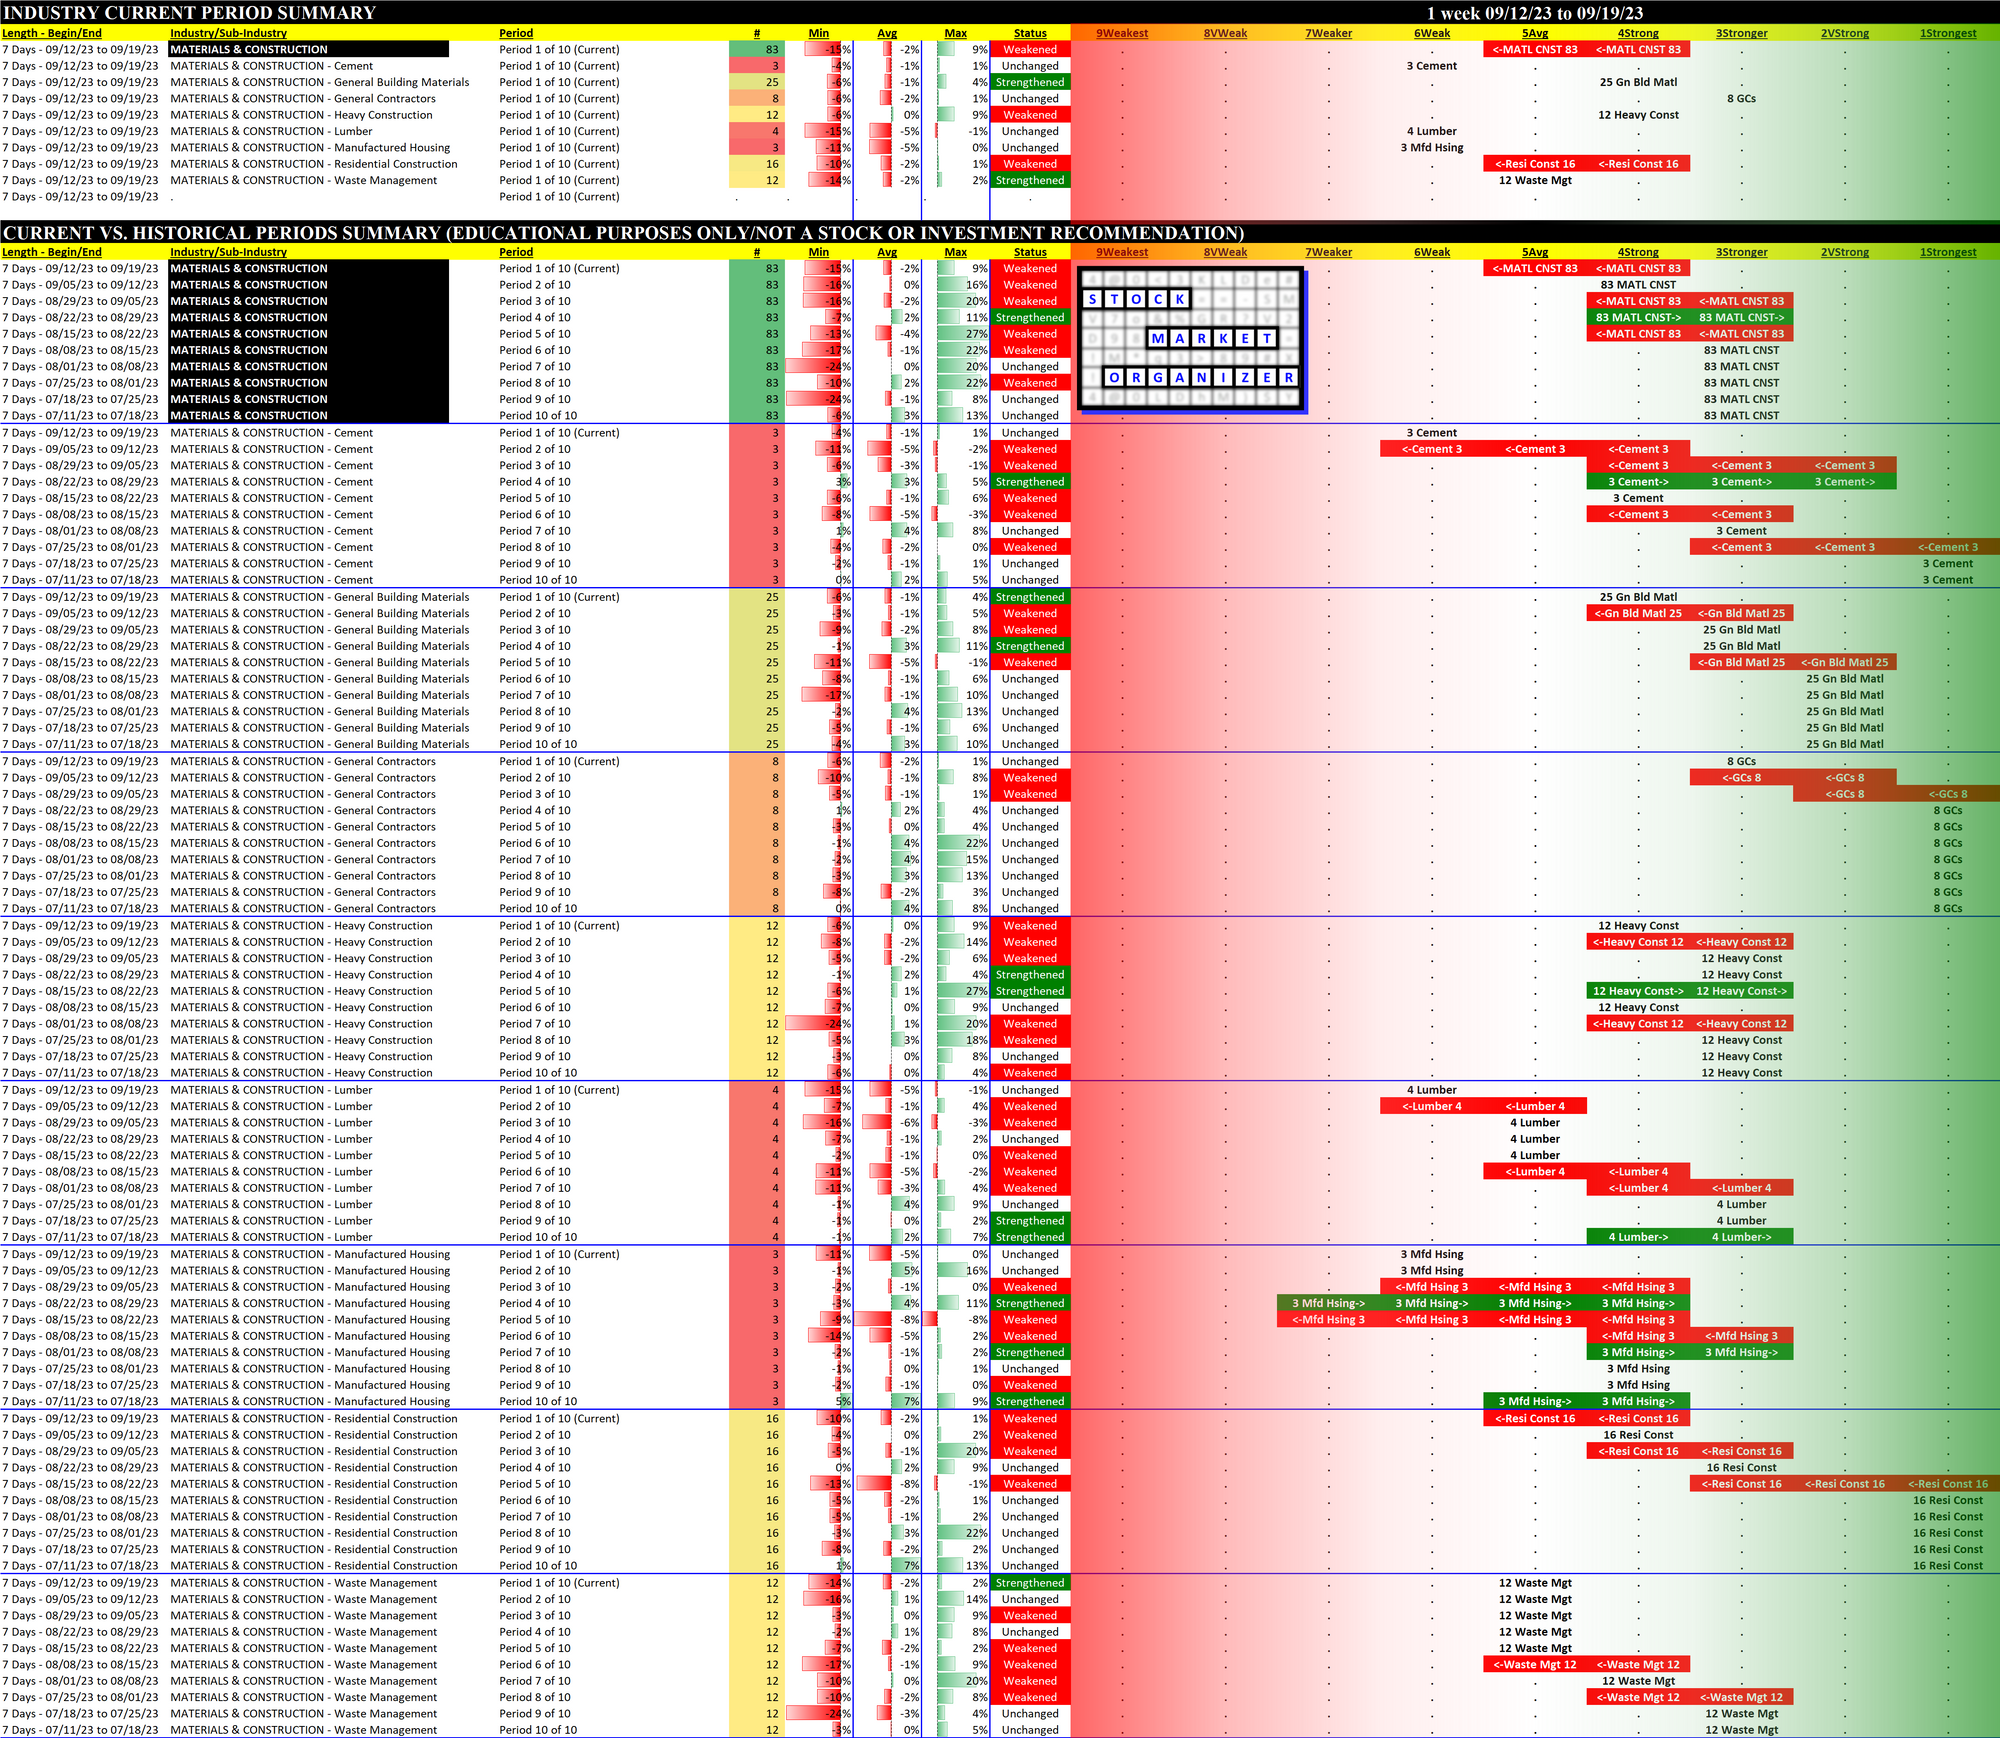
10-Week Week-by-Week Industry/Sub-industry Strength Comparison
What: recent week-by-week strength changes for the industry and each underlying sub-industry
Why: objective measurement of strengthening and weakening enabling comparison within and across industries and sub-industries
Strongest and Weakest Stocks
What: stocks currently rated Strongest/Weakest (highest/lowest of 9 strength ratings)
Why: most interesting stocks for available capital because
- the Strongest may be meme-stock mania candidates prone to breakouts, and
- the Weakest may be prone to large bottom-fishing/short-covering-driven pops... and may also be primed for bigger and faster falls.
(Not guaranteed and not a recommendation - weak stocks in weakening sub-industries may be better shorts than high-flyers.)
DETAIL: Lookbacks 6 Mos vs. 4 weeks vs. 1 Week
6 Mos Lookback
4 weeks Lookback
1 Week Lookback