Major indexes strength status as of 2023-05-08?
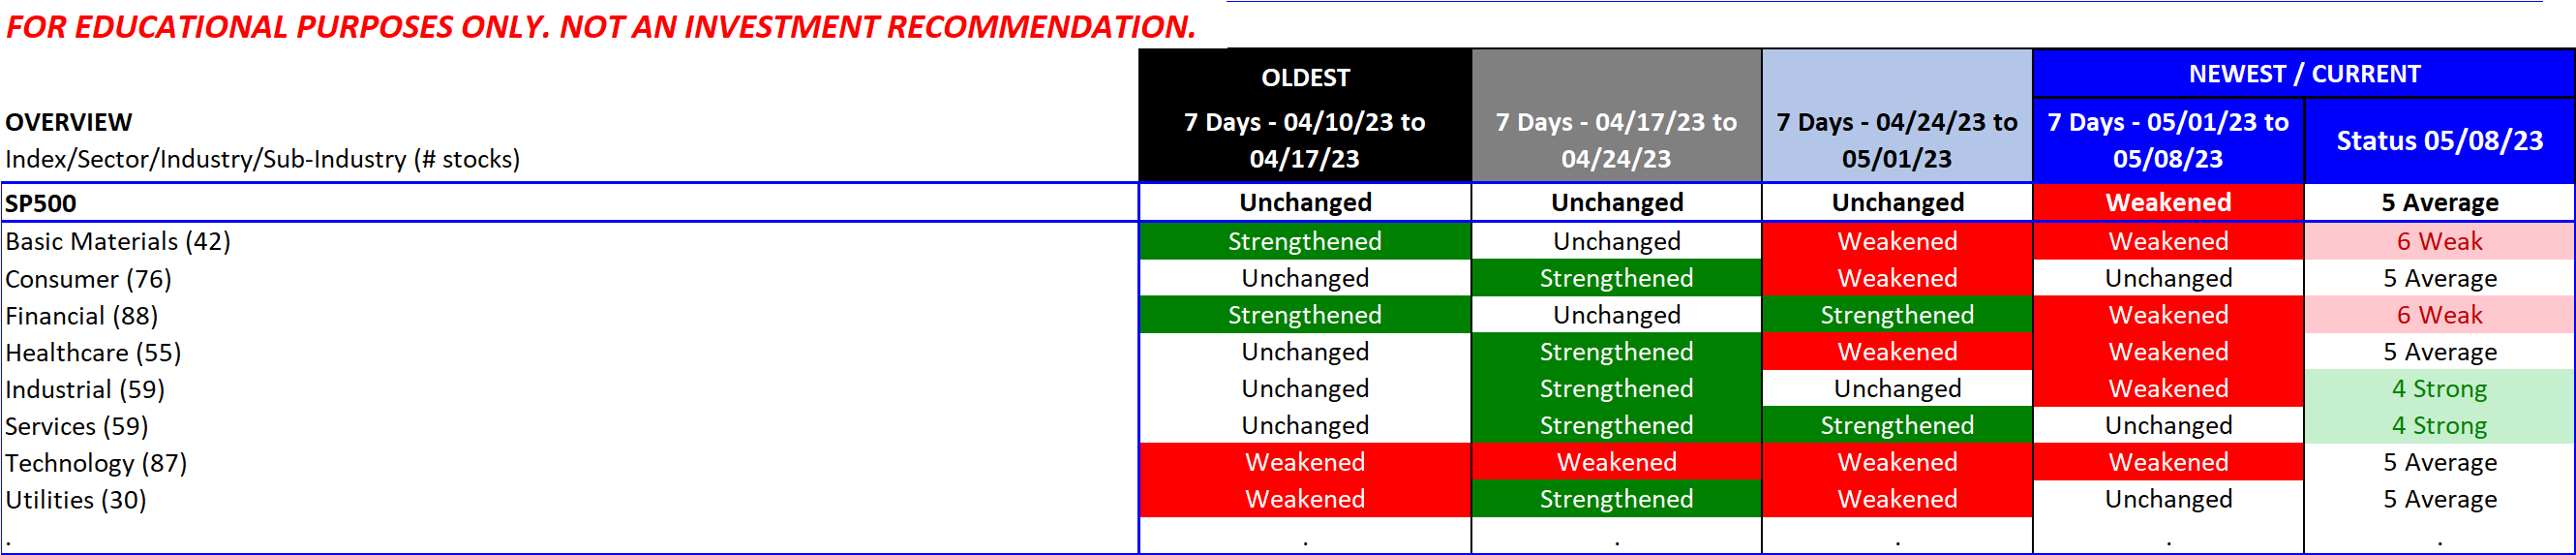
Following up yesterday's post I did the same analysis for the major indexes. This version provides more detail in the summary chart in the upper right corner of the detail pages. For example, here's today's S&P 500 summary:

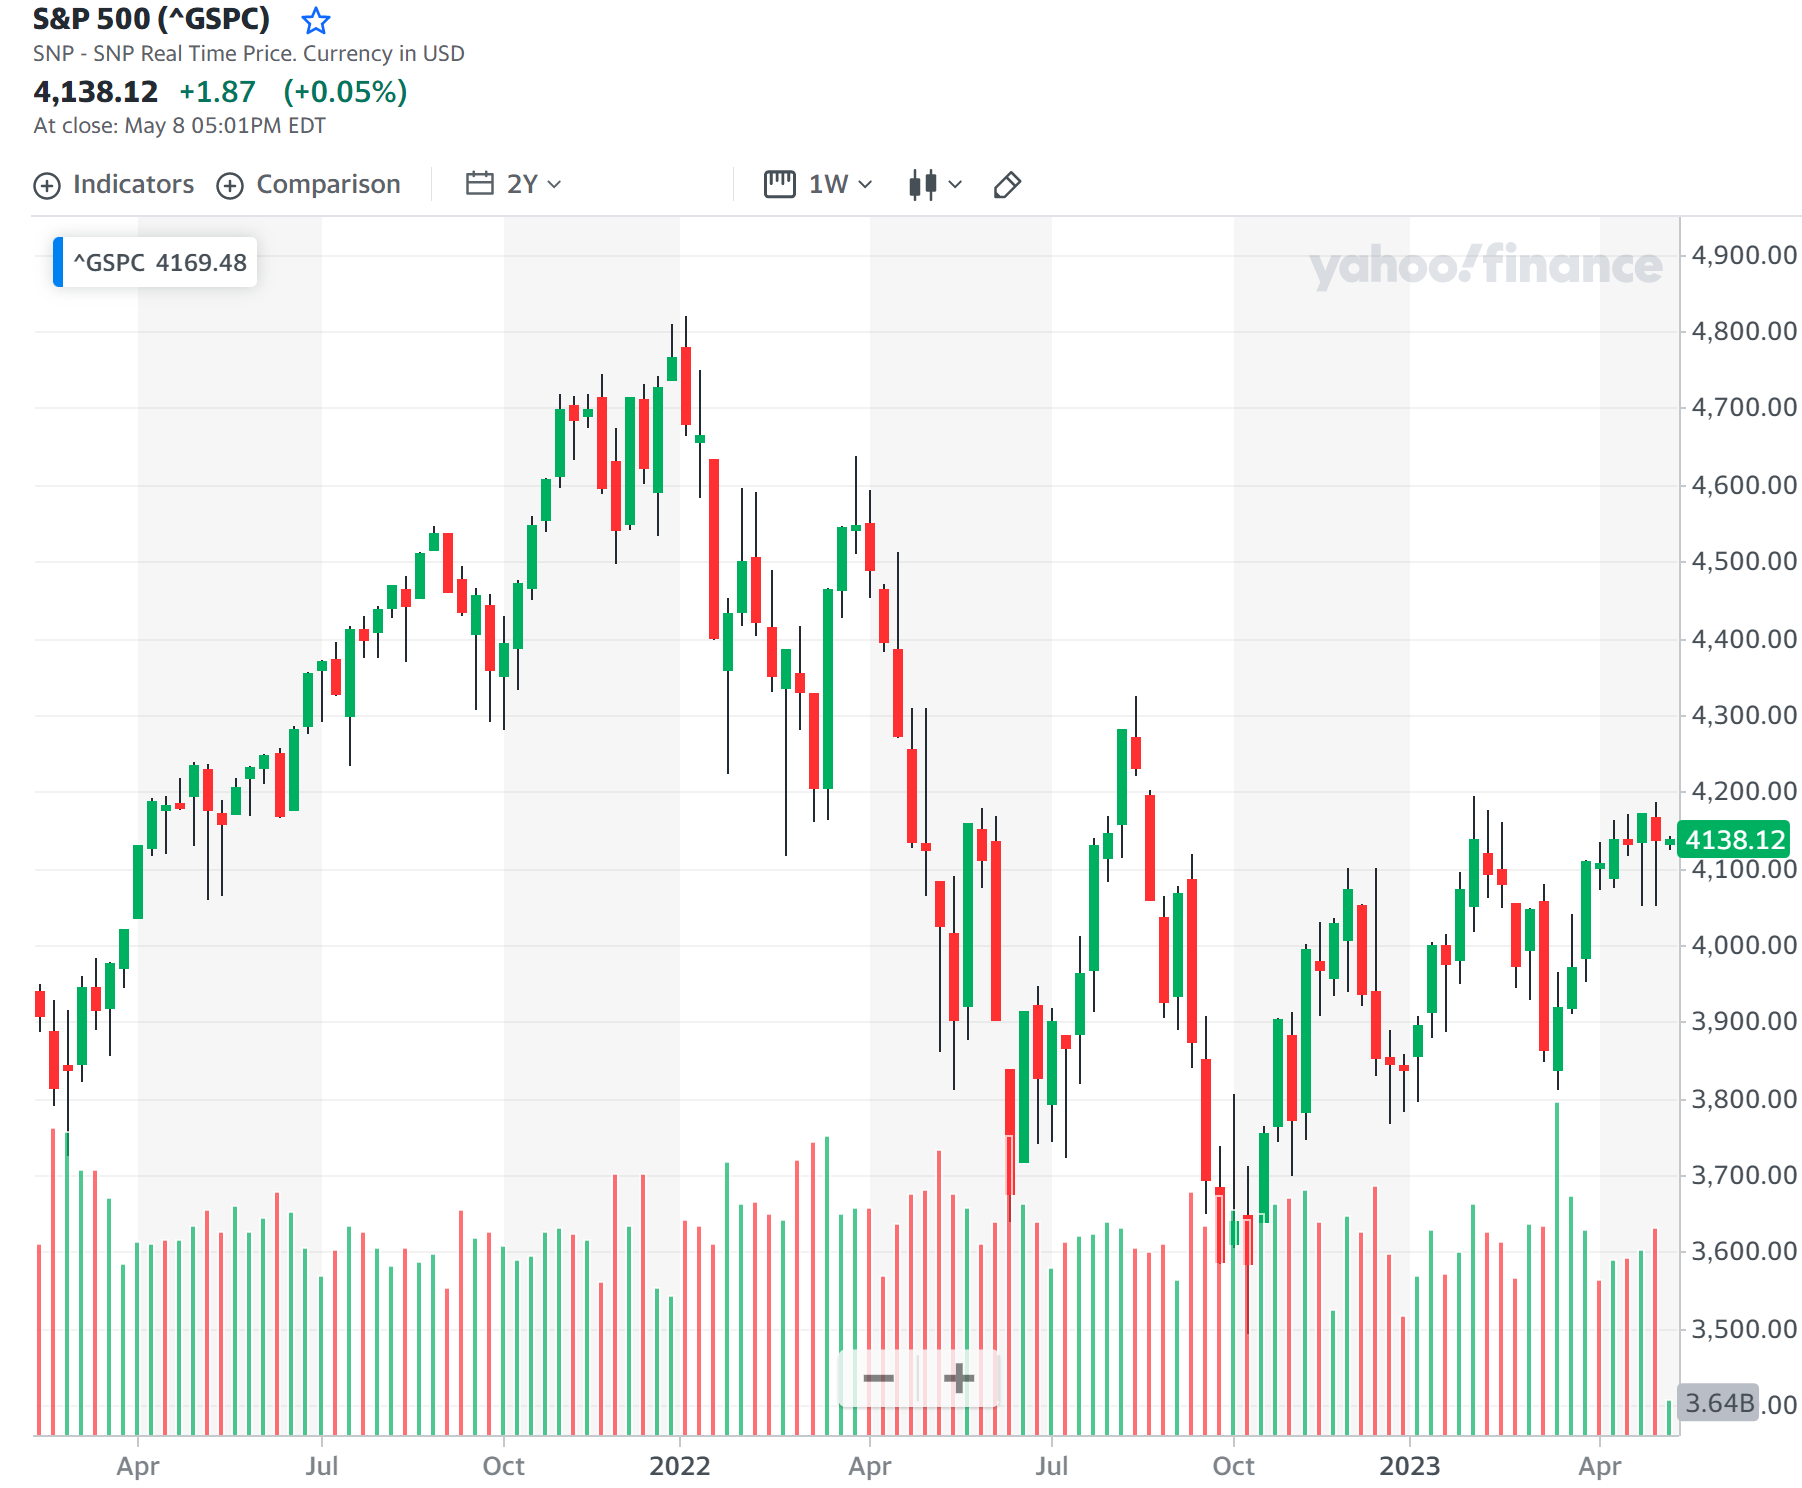
Which bottom-lines this chart on the detail page:
The value here is the ability to do this analysis for the individual industries. That analysis reveals the needed, materially-useful stock-by-stock detail in more meaningful groupings.
Downloadable Report
Below is the link to the summary report which is the source of the above graphics.