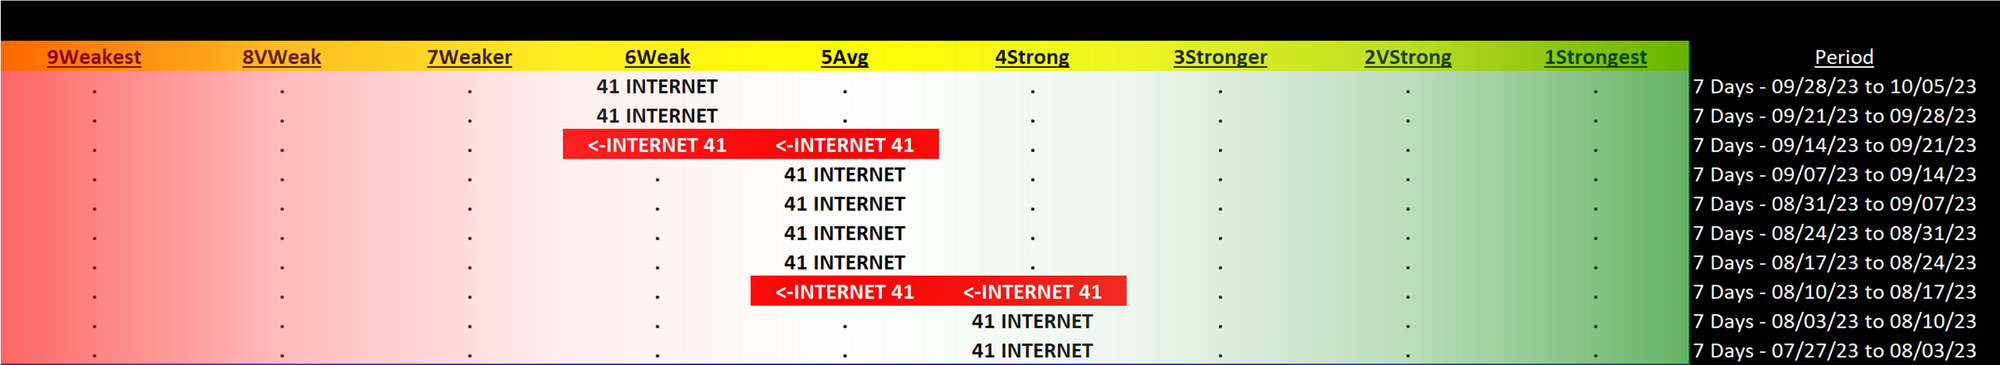
Internet 2023-10-05: Unchanged at WEAK strength rating (6th strongest of 9 levels), previous move was DOWN
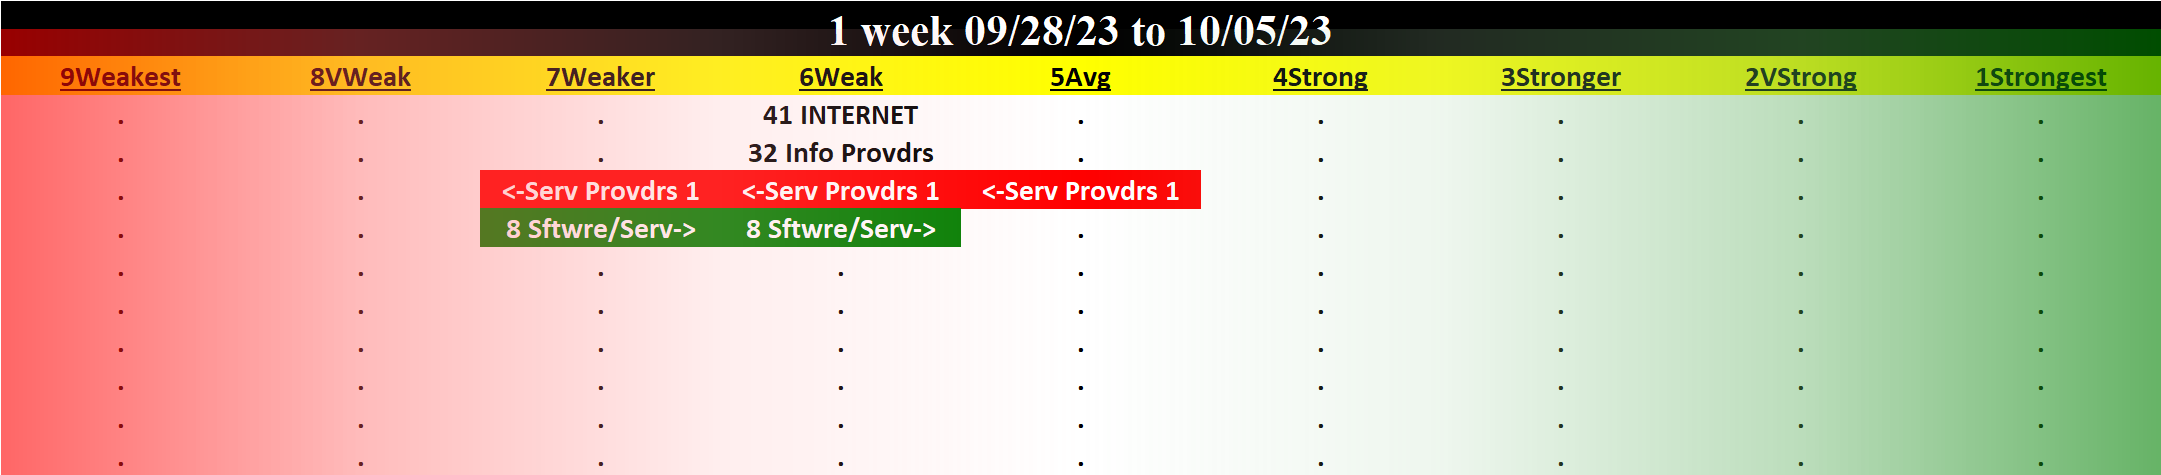
TABLE OF CONTENTS
- INDUSTRY OVERVIEW
1A. Performance
1B. Background - SUB-INDUSTRIES AND STOCKS DETAIL
2A. Sub-Industries Overview
2B. Sub-Industries 10-Week Strengthening Analysis
2C. Stocks 1 Week Strongest and Weakest - STRENGTH BY LOOKBACK PERIOD (with Best/Worst stocks)
3A. Lookback 6 Months
3B. Lookback 4 weeks
3C. Lookback 1 Week
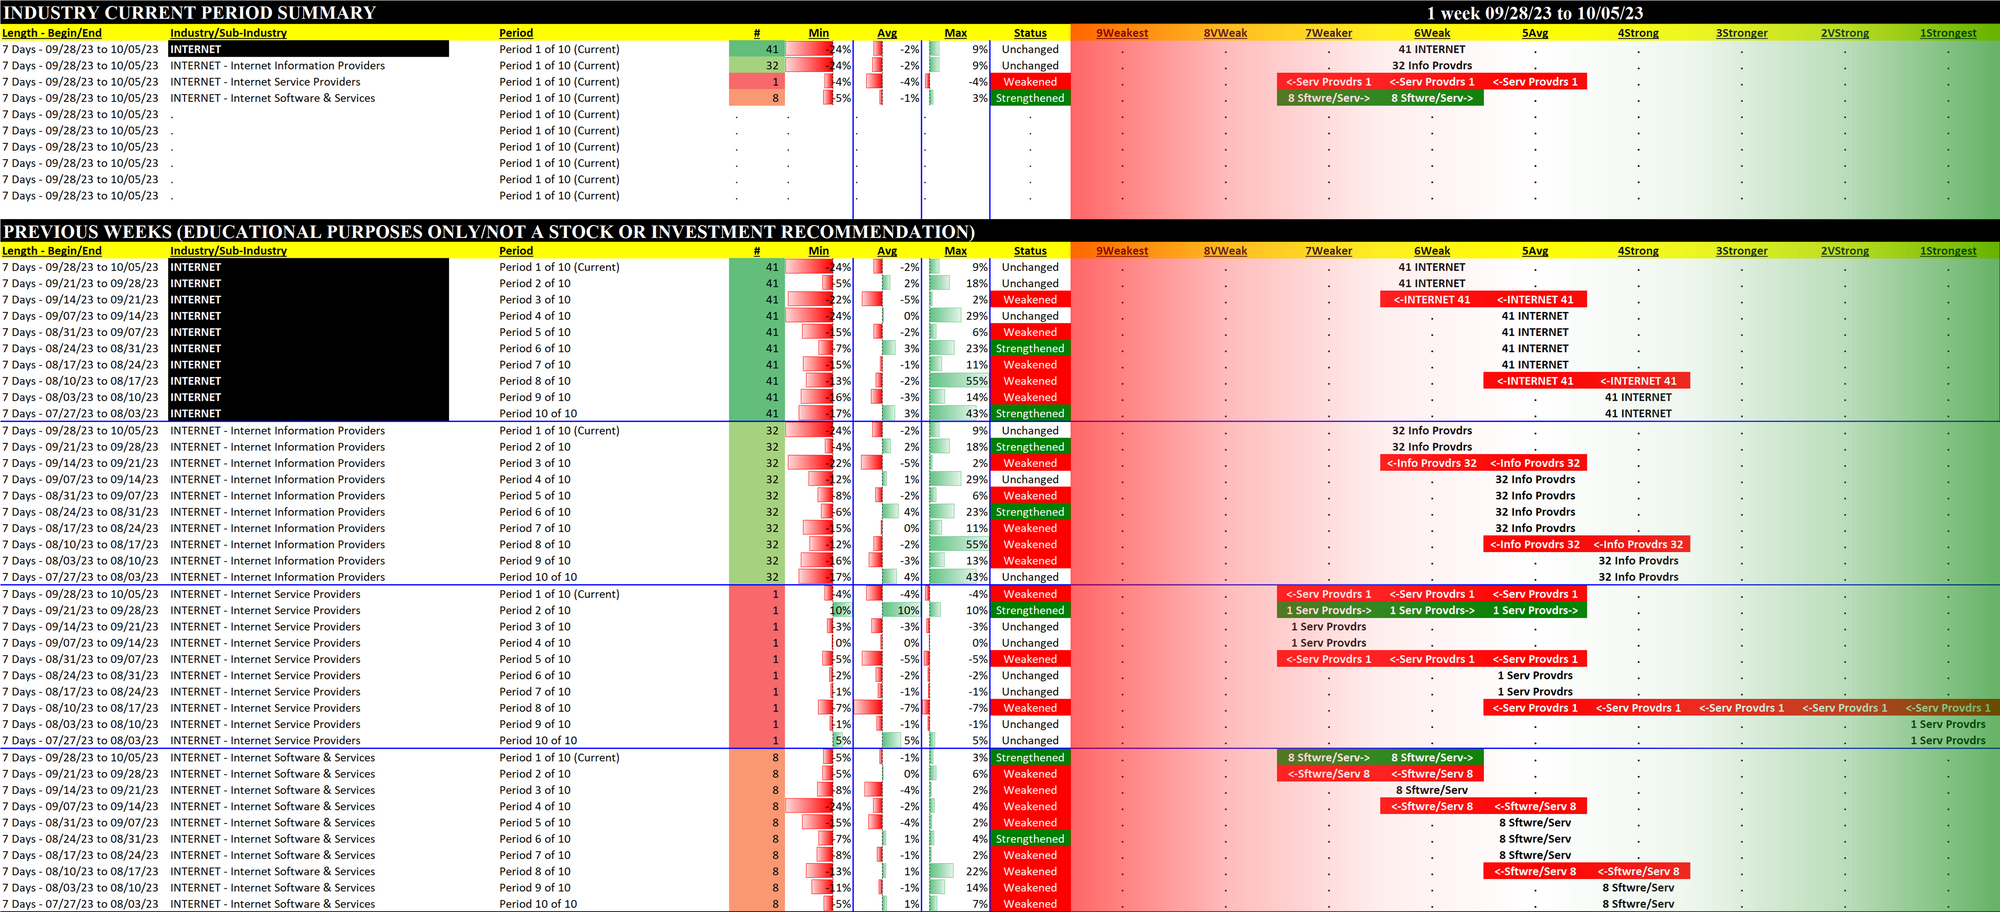
1. INDUSTRY OVERVIEW
1A. Performance
Past 10 Weeks Strengthening/Weakening week-by-week, per the following chart:
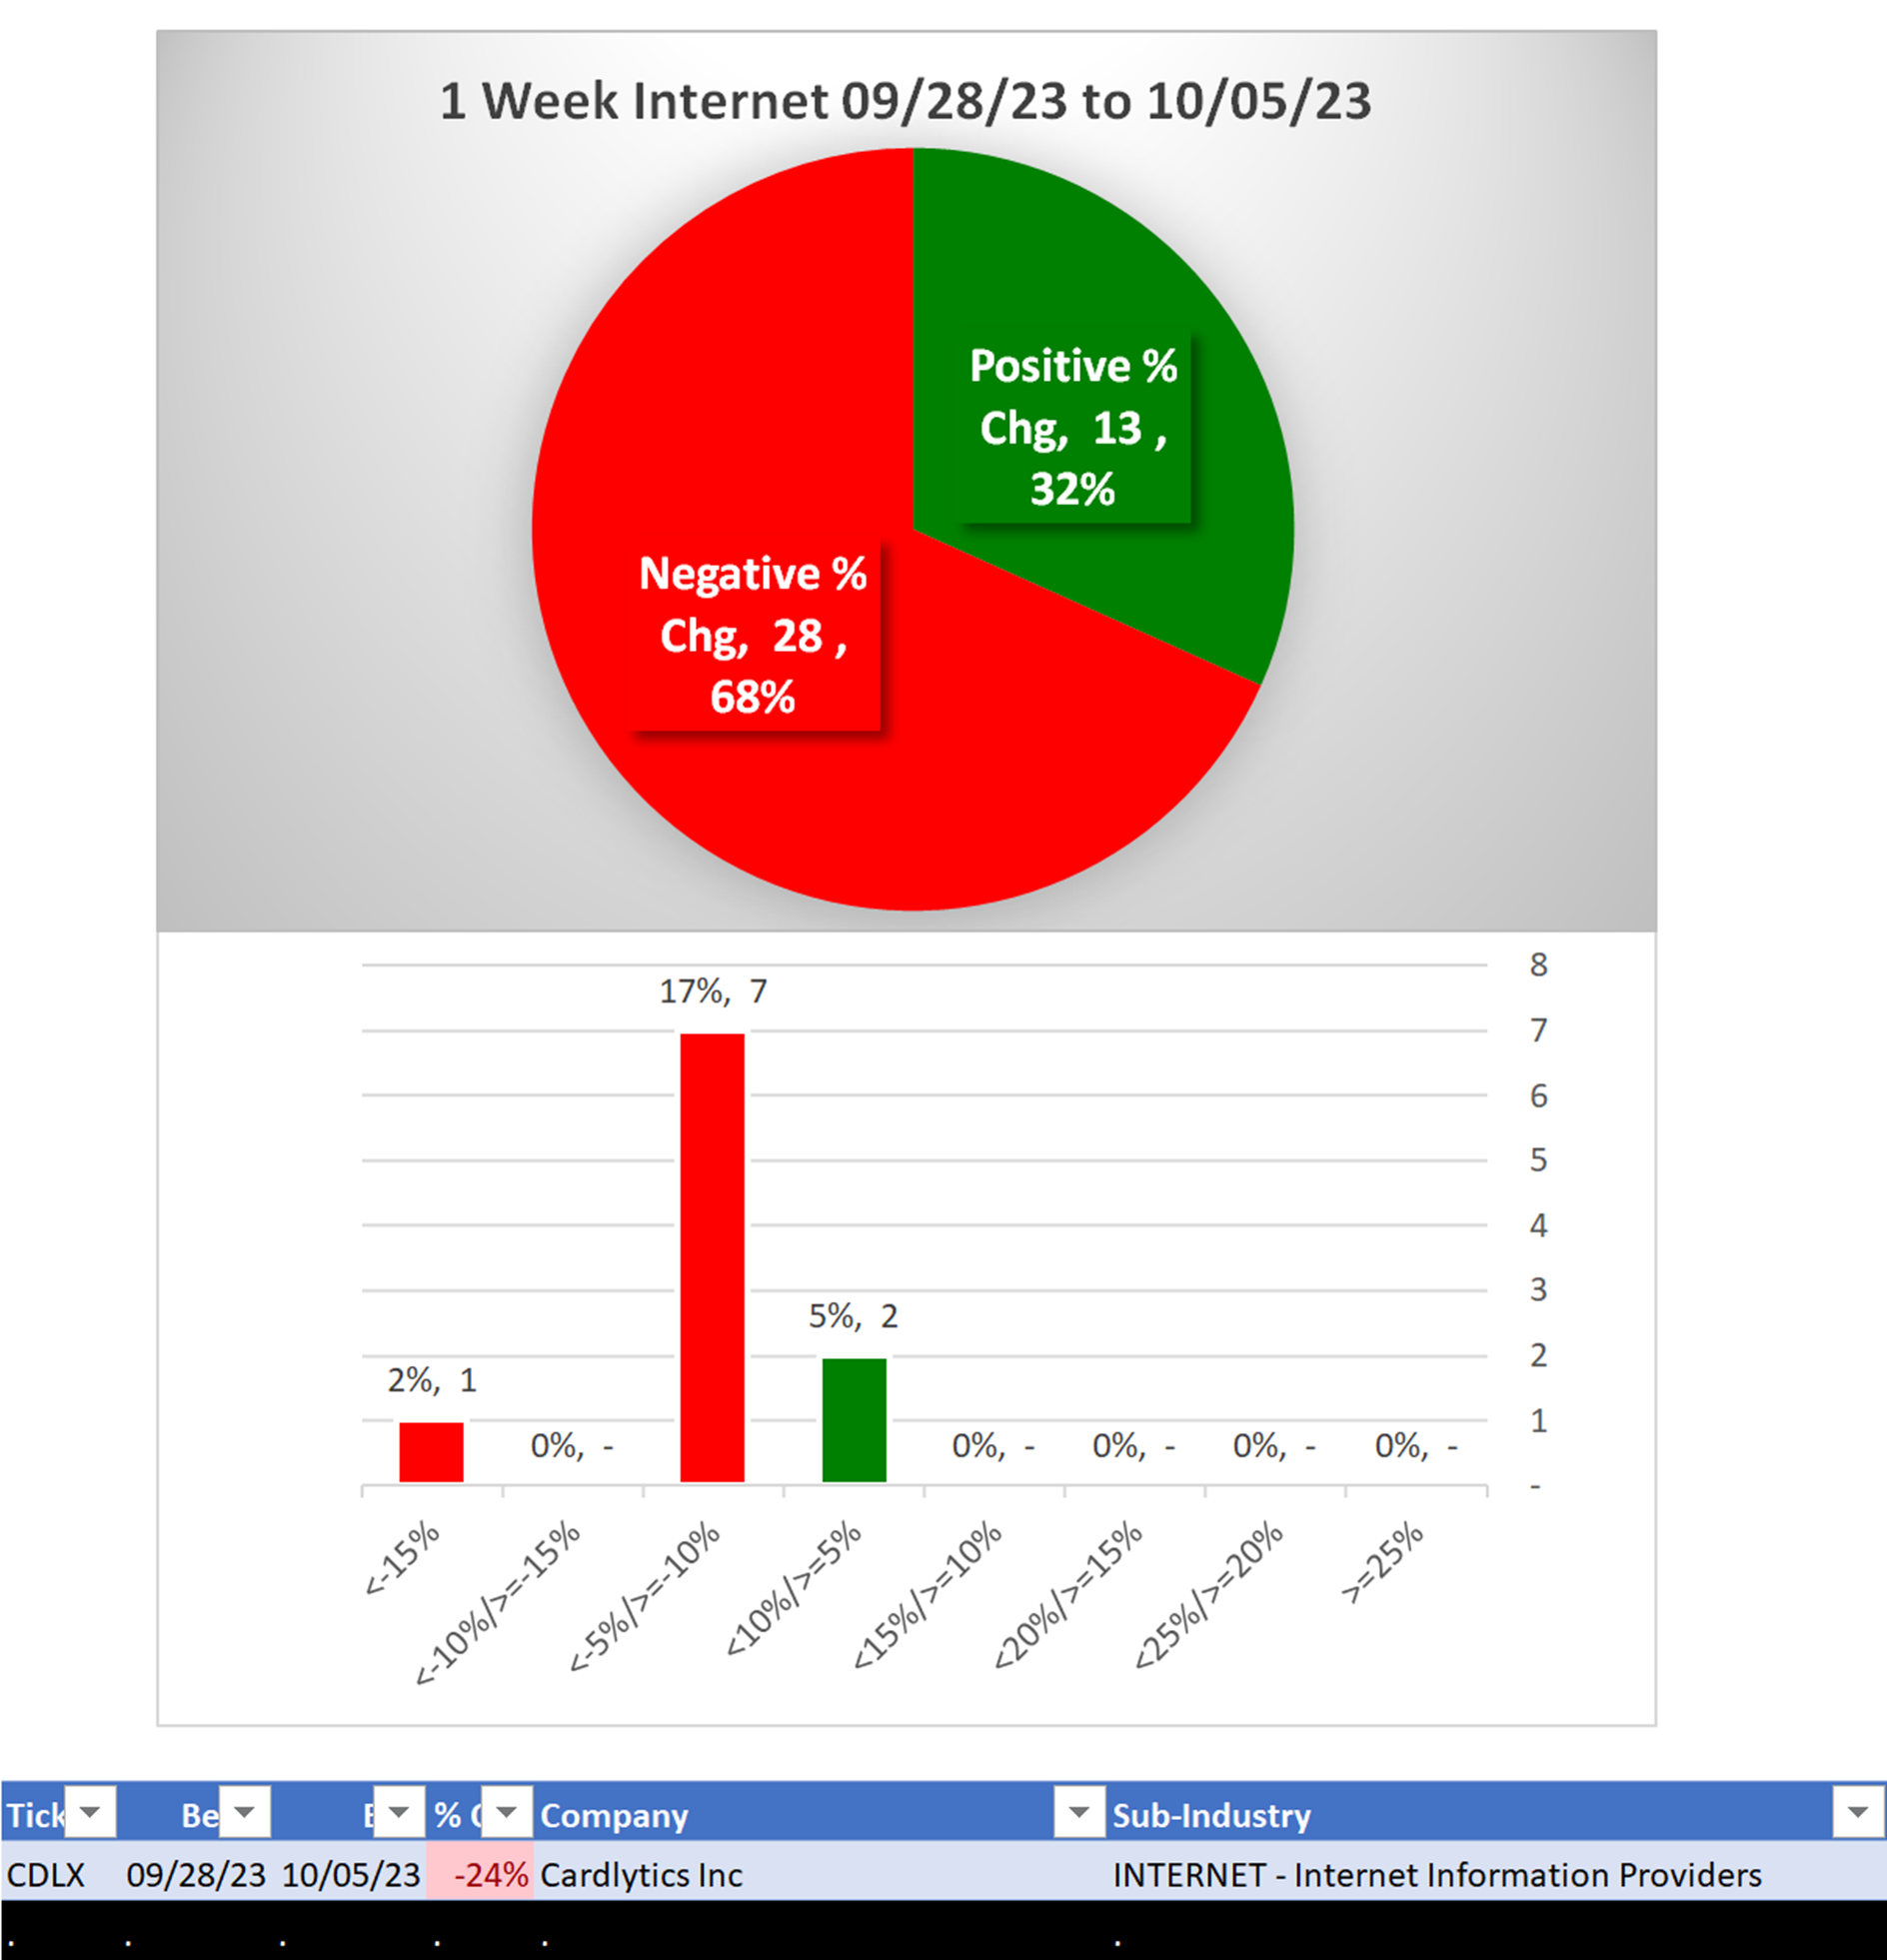
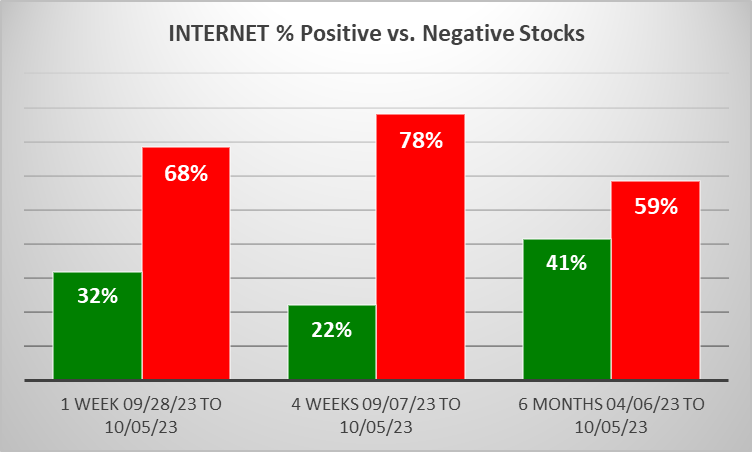
Mixed/STRENGTHENING 1 Week vs. Mid- and Longer-Term // 1 week positive/negative stocks ratio is HIGHER than 4 weeks but LOWER than 6 Months, per the following chart:
1B. Background
Largest of 3 sub-industries (41 stocks, average 14):
- Internet Information Providers (32 stocks)
- Internet Software & Services (8 stocks)
Top 10 by Market Capitalization:
GOOG/Alphabet Inc, META/Meta Platforms Inc, BKNG/Booking Holdings Inc, EQIX/Equinix Inc, DASH/DoorDash Inc, GIB/Cgi Group Inc, ZM/Zoom Video Communications Inc, PINS/Pinterest Inc, AKAM/Akamai Technologies Inc, EXPE/Expedia Inc
2. SUB-INDUSTRIES AND STOCKS DETAIL
2A. Sub-Industries Overview
Strengthened: 1/3 sub-industries
Weakened: 1/3 sub-industries
STRONGEST at Weak rating/6th strongest of 9 levels:
- Internet Information Providers (32 stocks)
- Internet Software & Services (8 stocks)
WEAKEST at Weaker rating/7th strongest of 9 levels:
- Internet Service Providers (1 stocks)
2B. Sub-Industries 10-Week Strengthening Analysis
What: recent week-by-week strength changes for the industry and each underlying sub-industry
Why: objective measurement of strengthening and weakening enabling comparison within and across industries and sub-industries
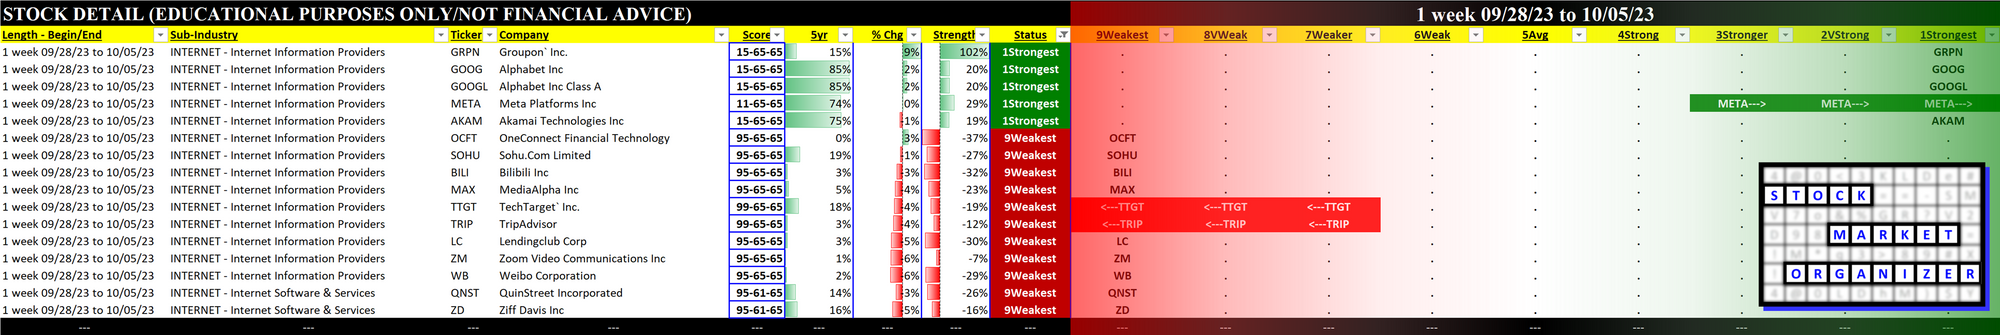
2C. Stocks 1 Week Strongest and Weakest
What: stocks currently rated Strongest/Weakest (highest/lowest of 9 strength ratings)
Why: most interesting stocks for available capital because
- the Strongest have the least amount of overhead supply to dampen breakouts while
- the Weakest may be prone to volatility, subject to big pops from bottom-fishing and short-covering BUT ALSO to bigger and faster falls.
(Not guaranteed and not a recommendation - weak stocks in weakening sub-industries may be better shorts than high-flyers.)
3. STRENGTH BY LOOKBACK PERIOD (with Best/Worst stocks)
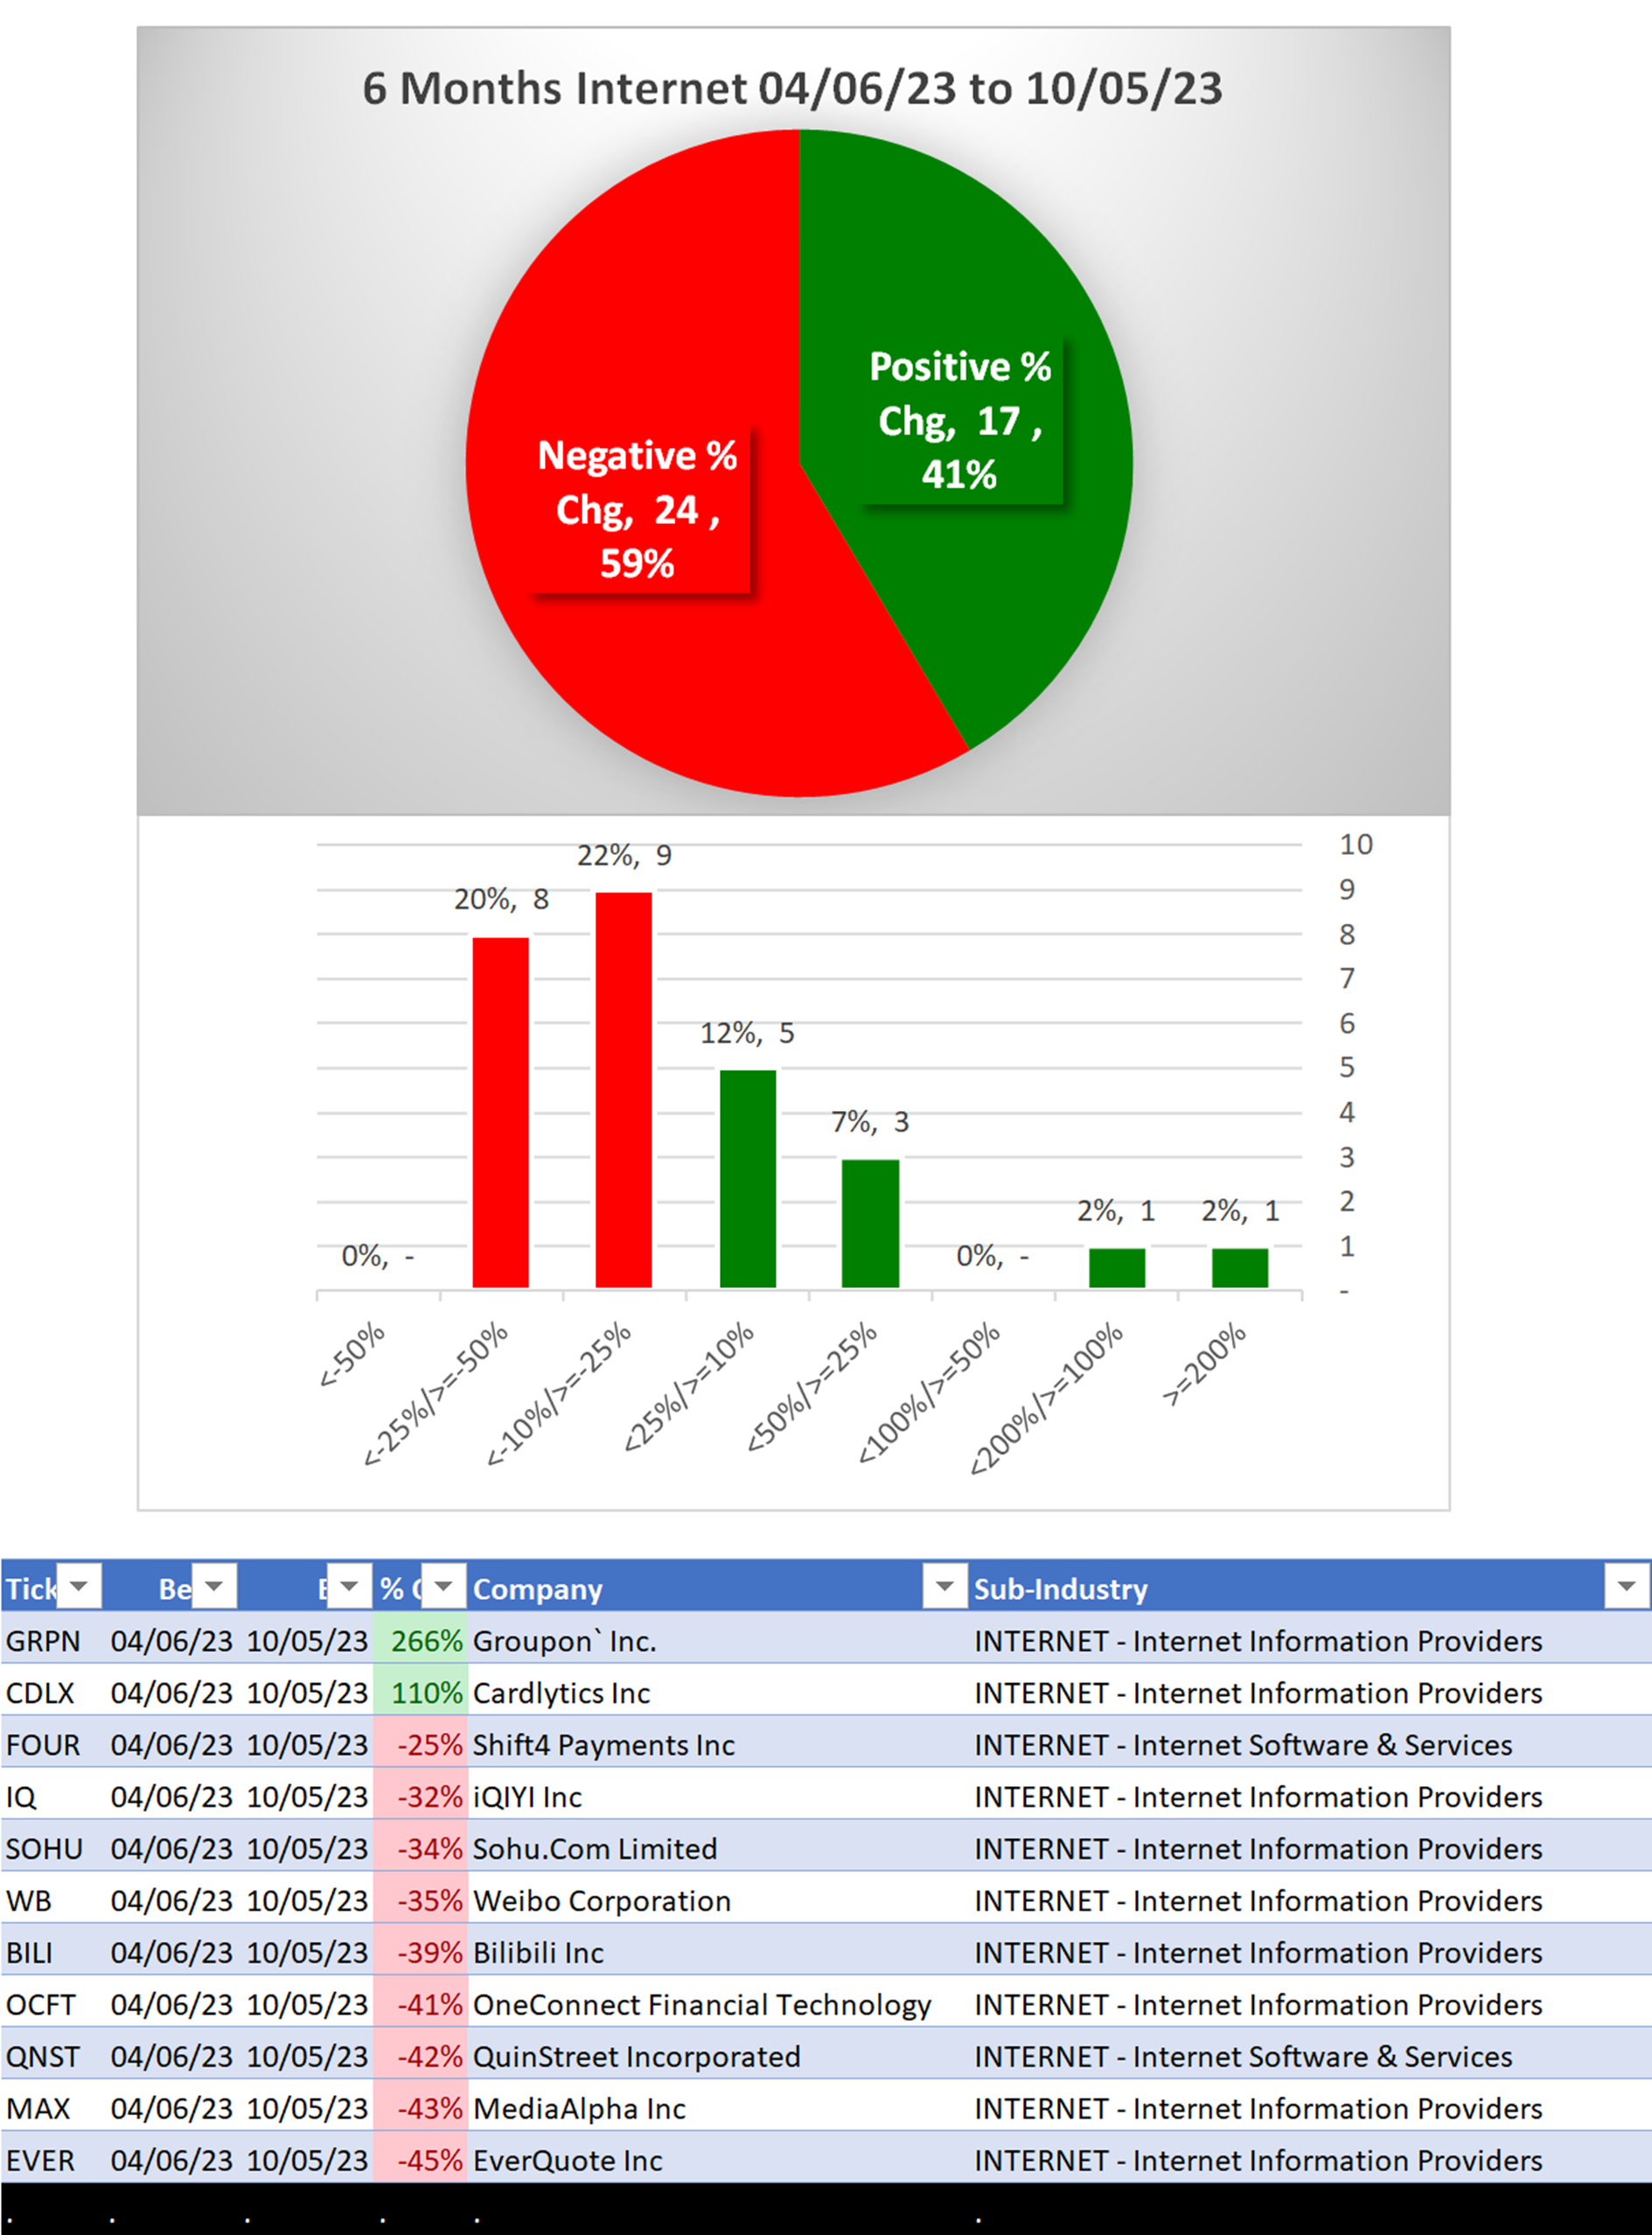
3A. Lookback 6 Months
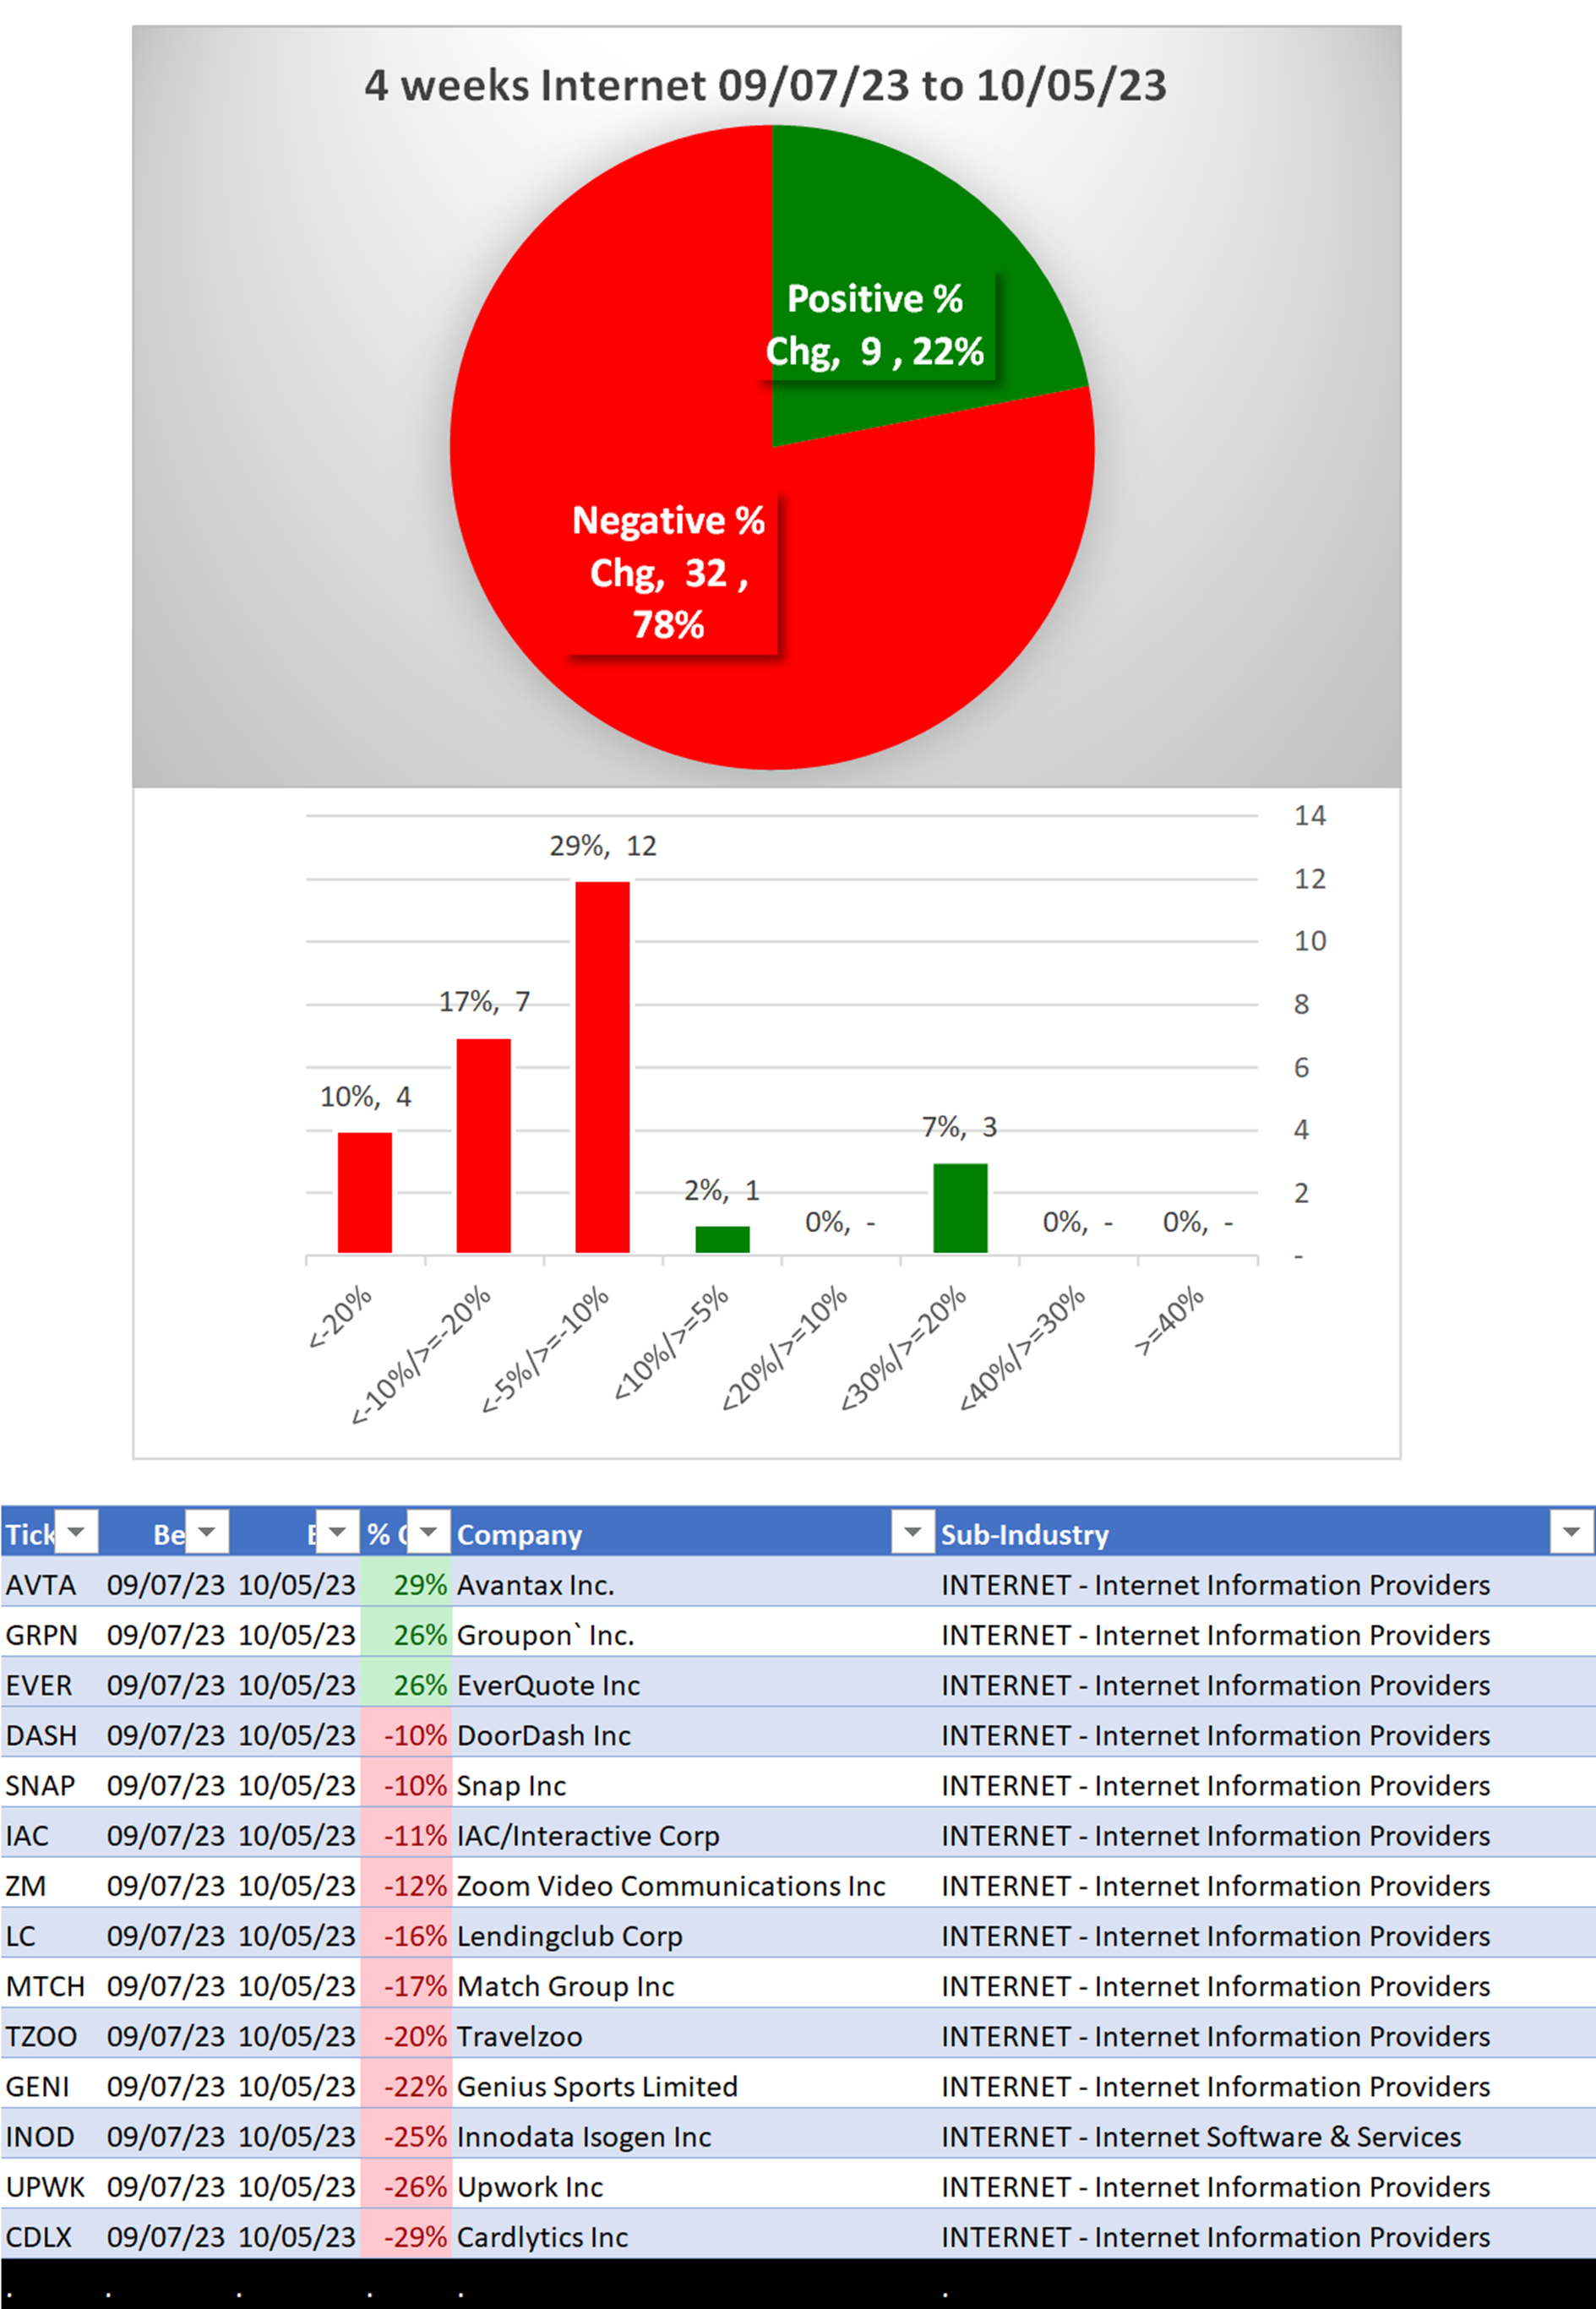
3B. Lookback 4 weeks
3C. Lookback 1 Week