Indexes Tue 2025-03-25: SP500 5Average (Unch), NDX 5Average (Unch)
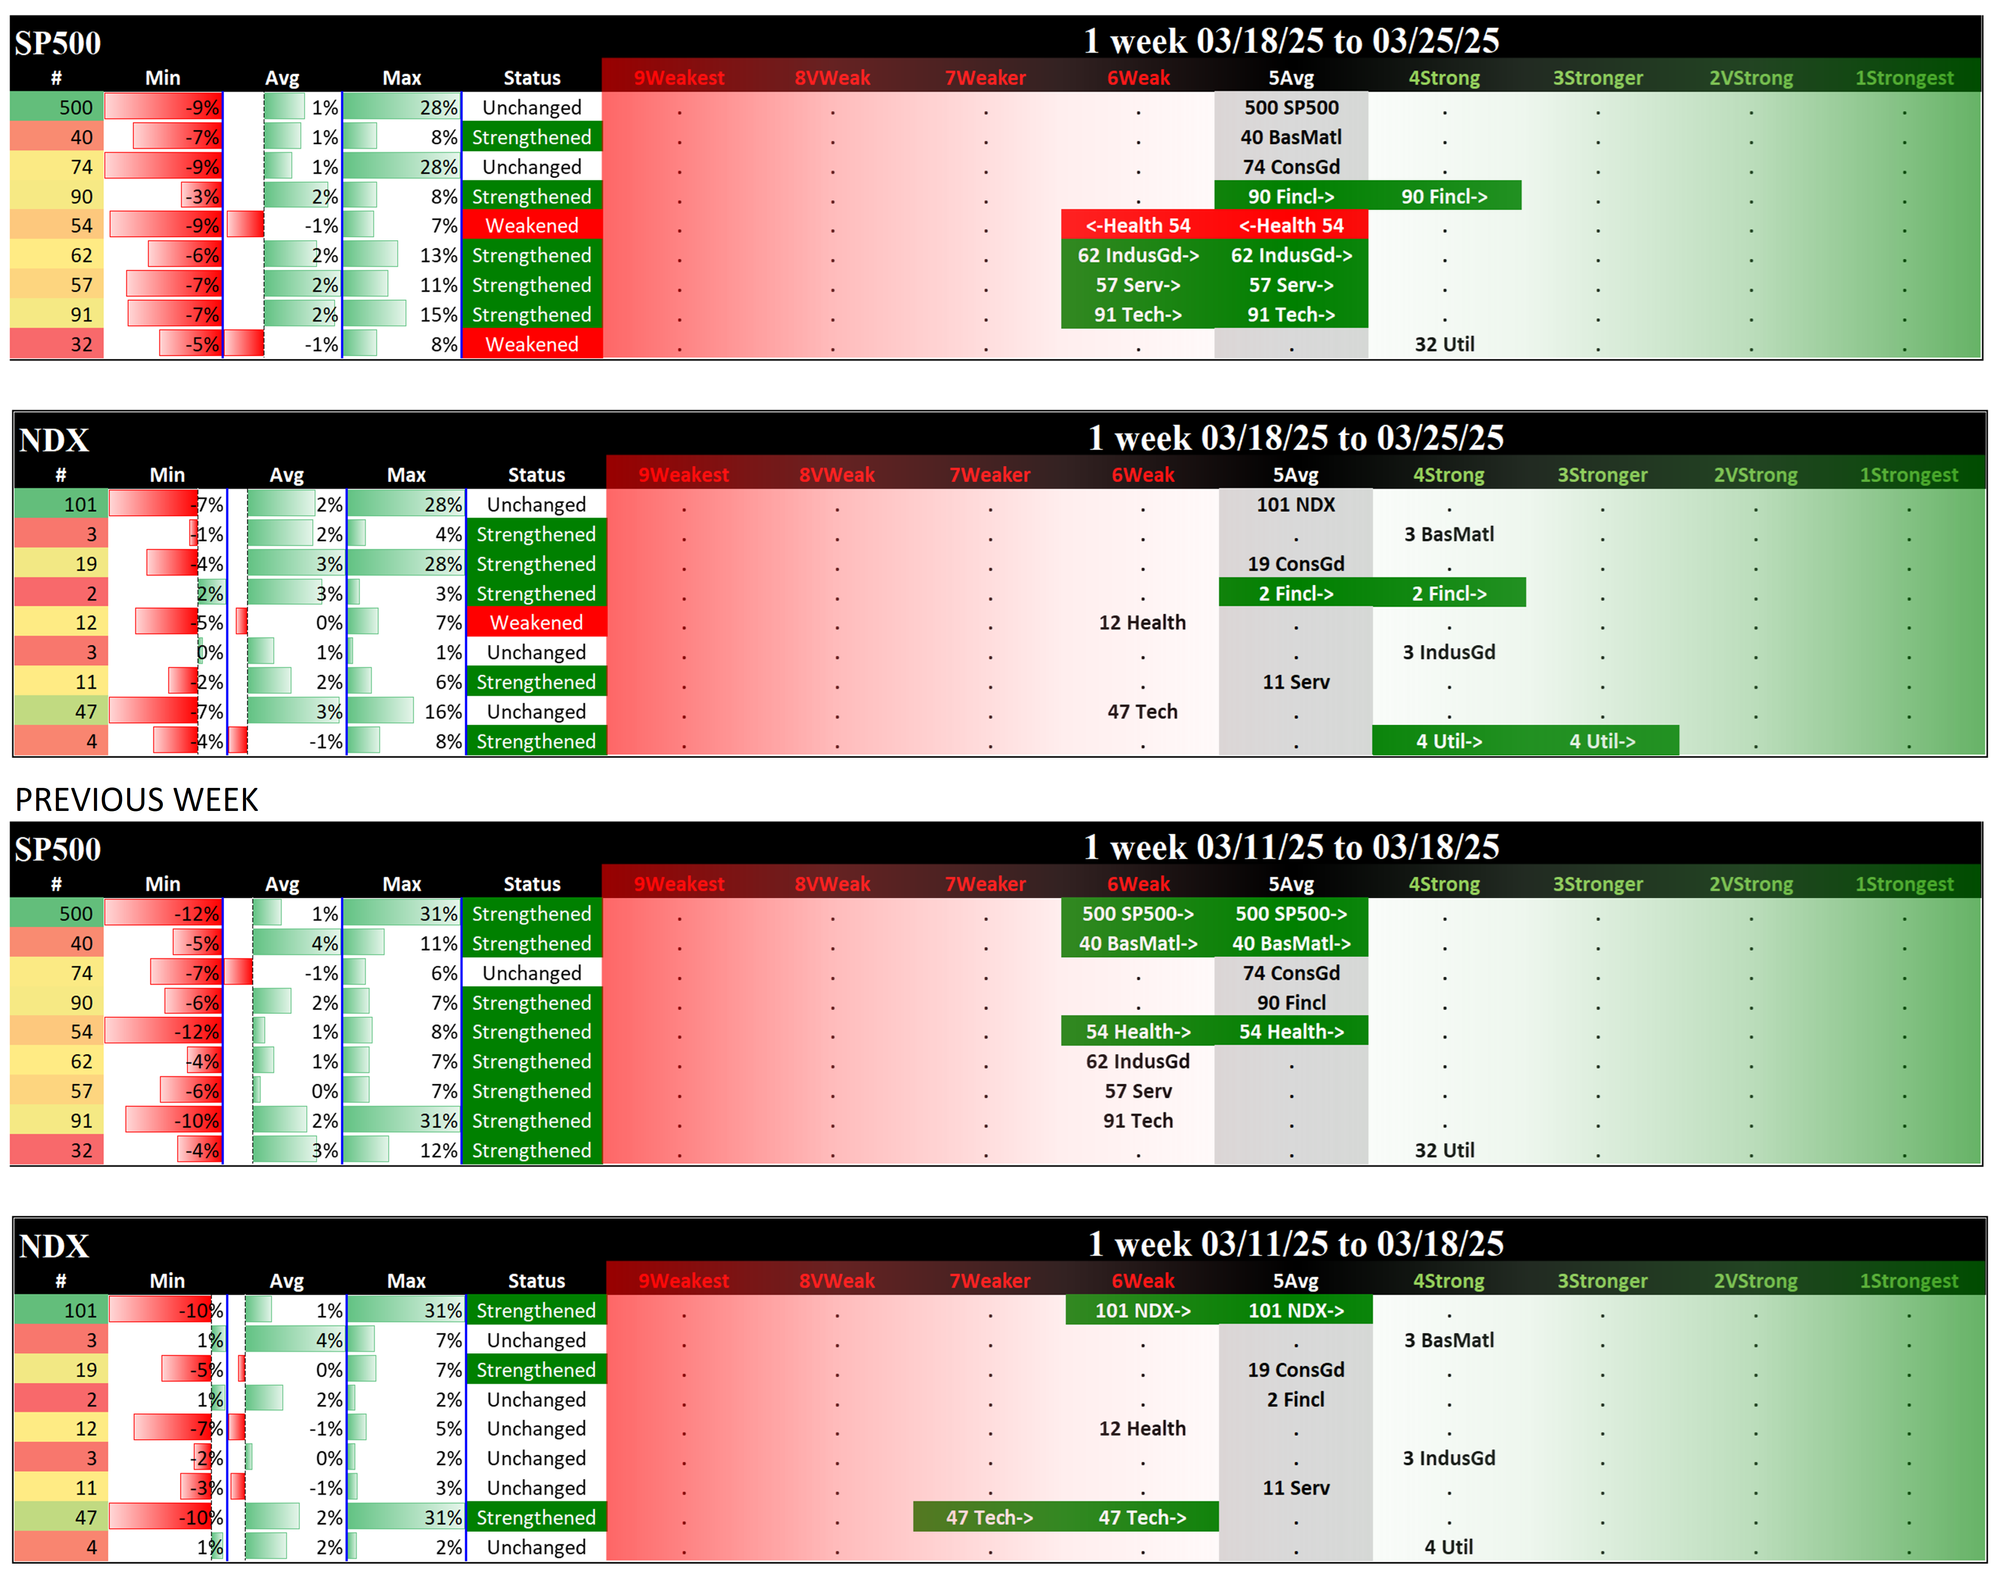
This post provides the following information.
I. Background
II. What Do The Pies Say?
III. Indexes - Component Sectors, 1Strongest / 9Weakest Stocks
IV. Stocks at 5+ Year Highs and Lows
I. Background
This analysis provides a Stock Market Organizer summary view of the S&P 500 and Nasdaq 100 for the week ended Tuesday, 03/25/25. This means this is a stock-by-stock strength analysis of the component stocks for each index, aggregated upward in level to the sector and index levels.
This purposely excludes the Dow Industrials. This analysis is more impactful the more the stocks analyzed. In turn, I pay minimal attention to the strength scores calculated for the NDX sectors, except for Technology which has 47 stocks.
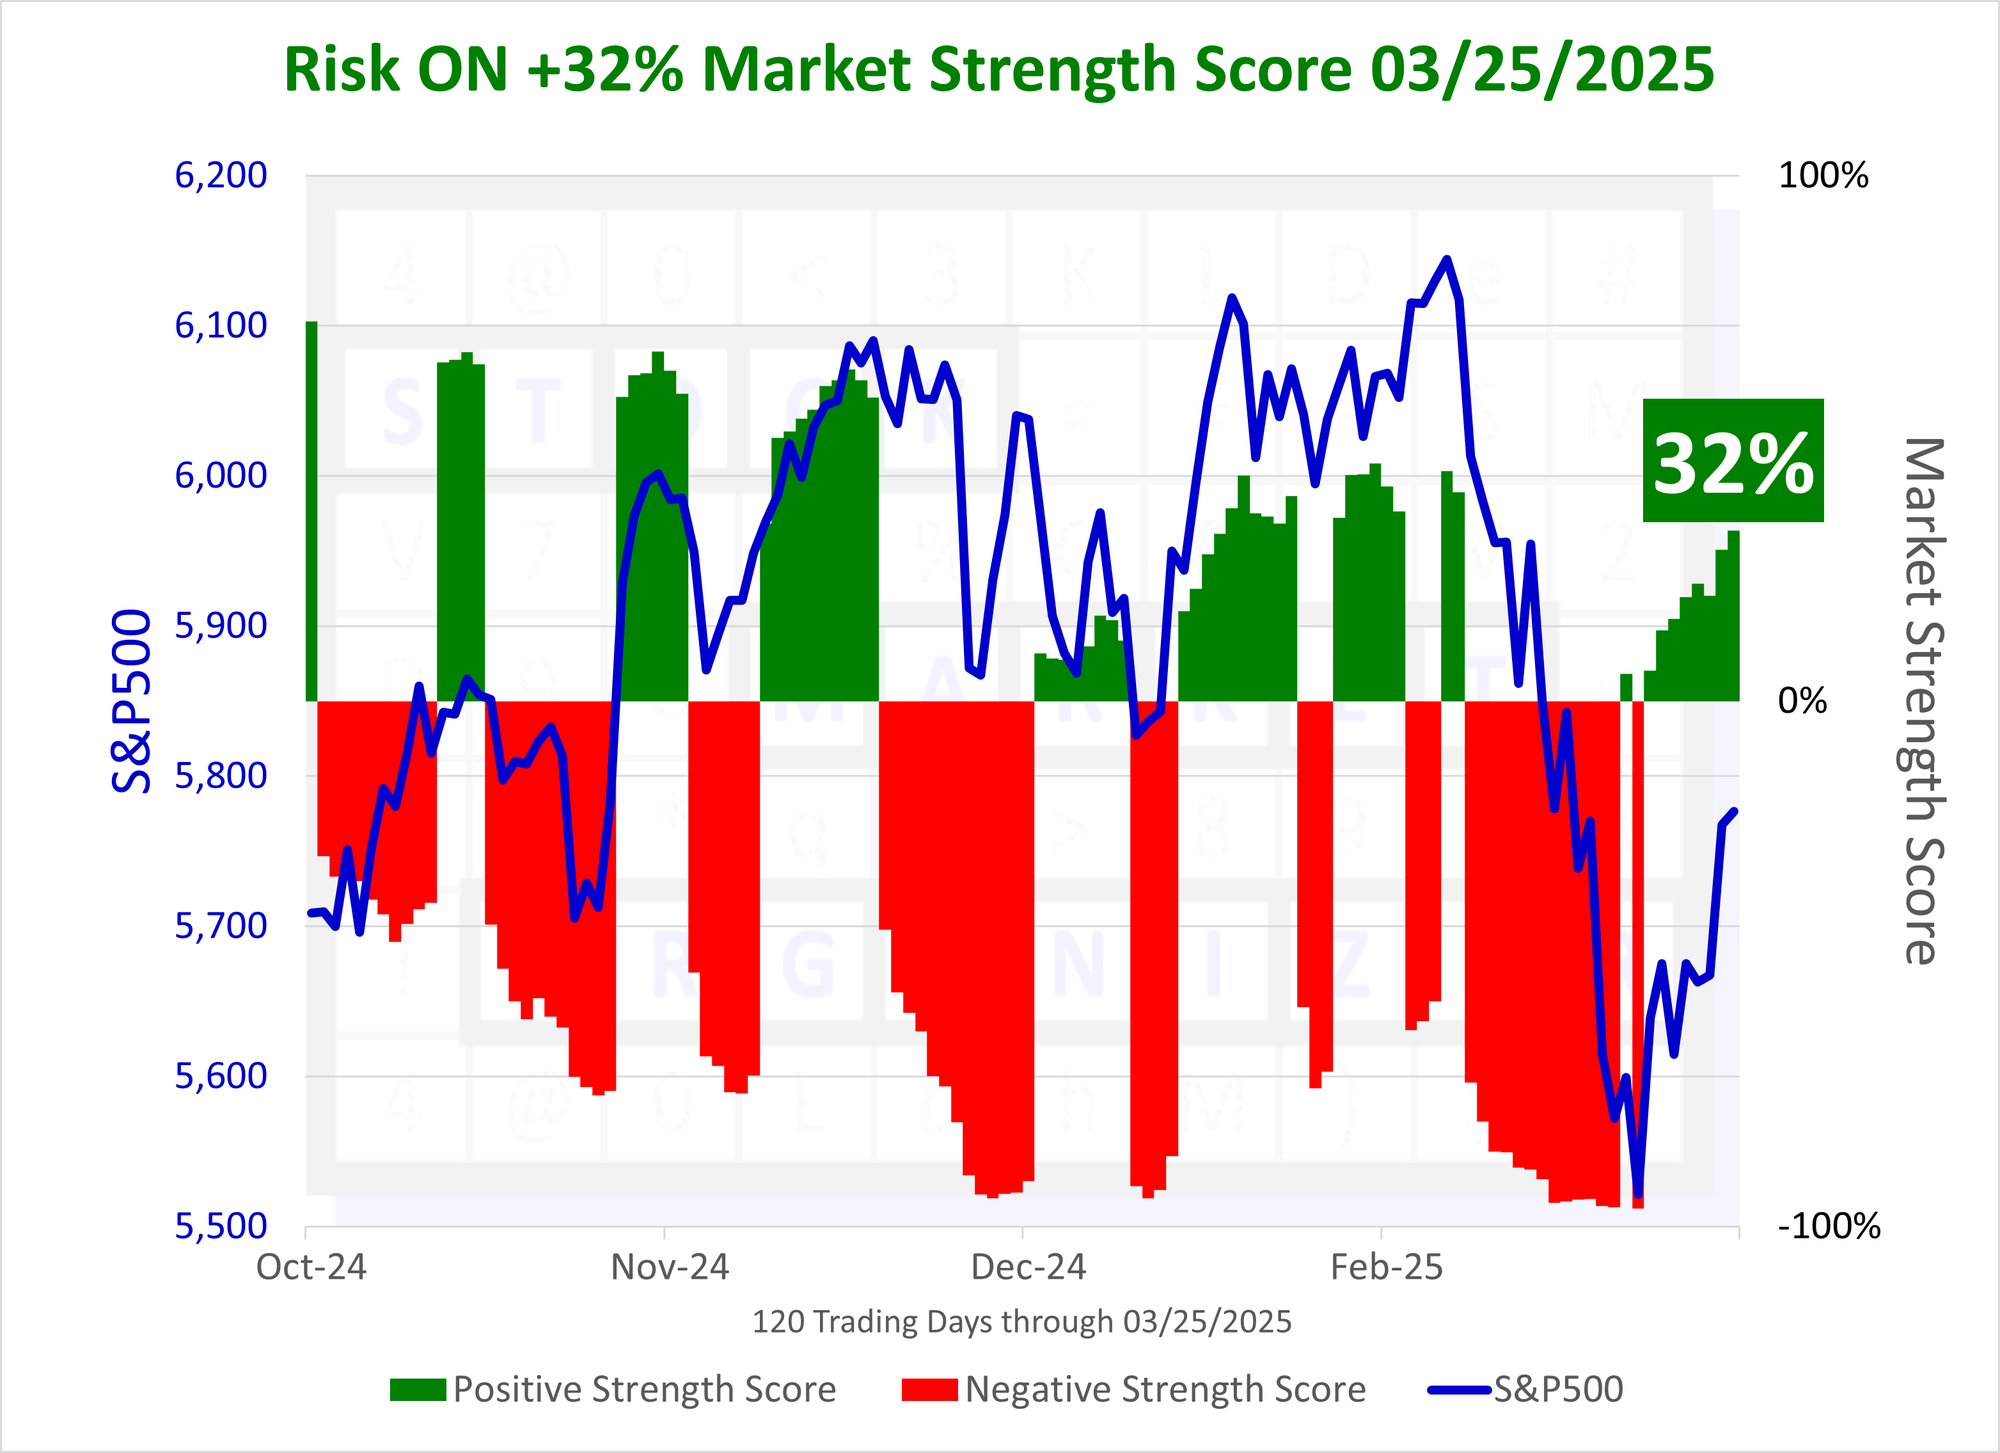
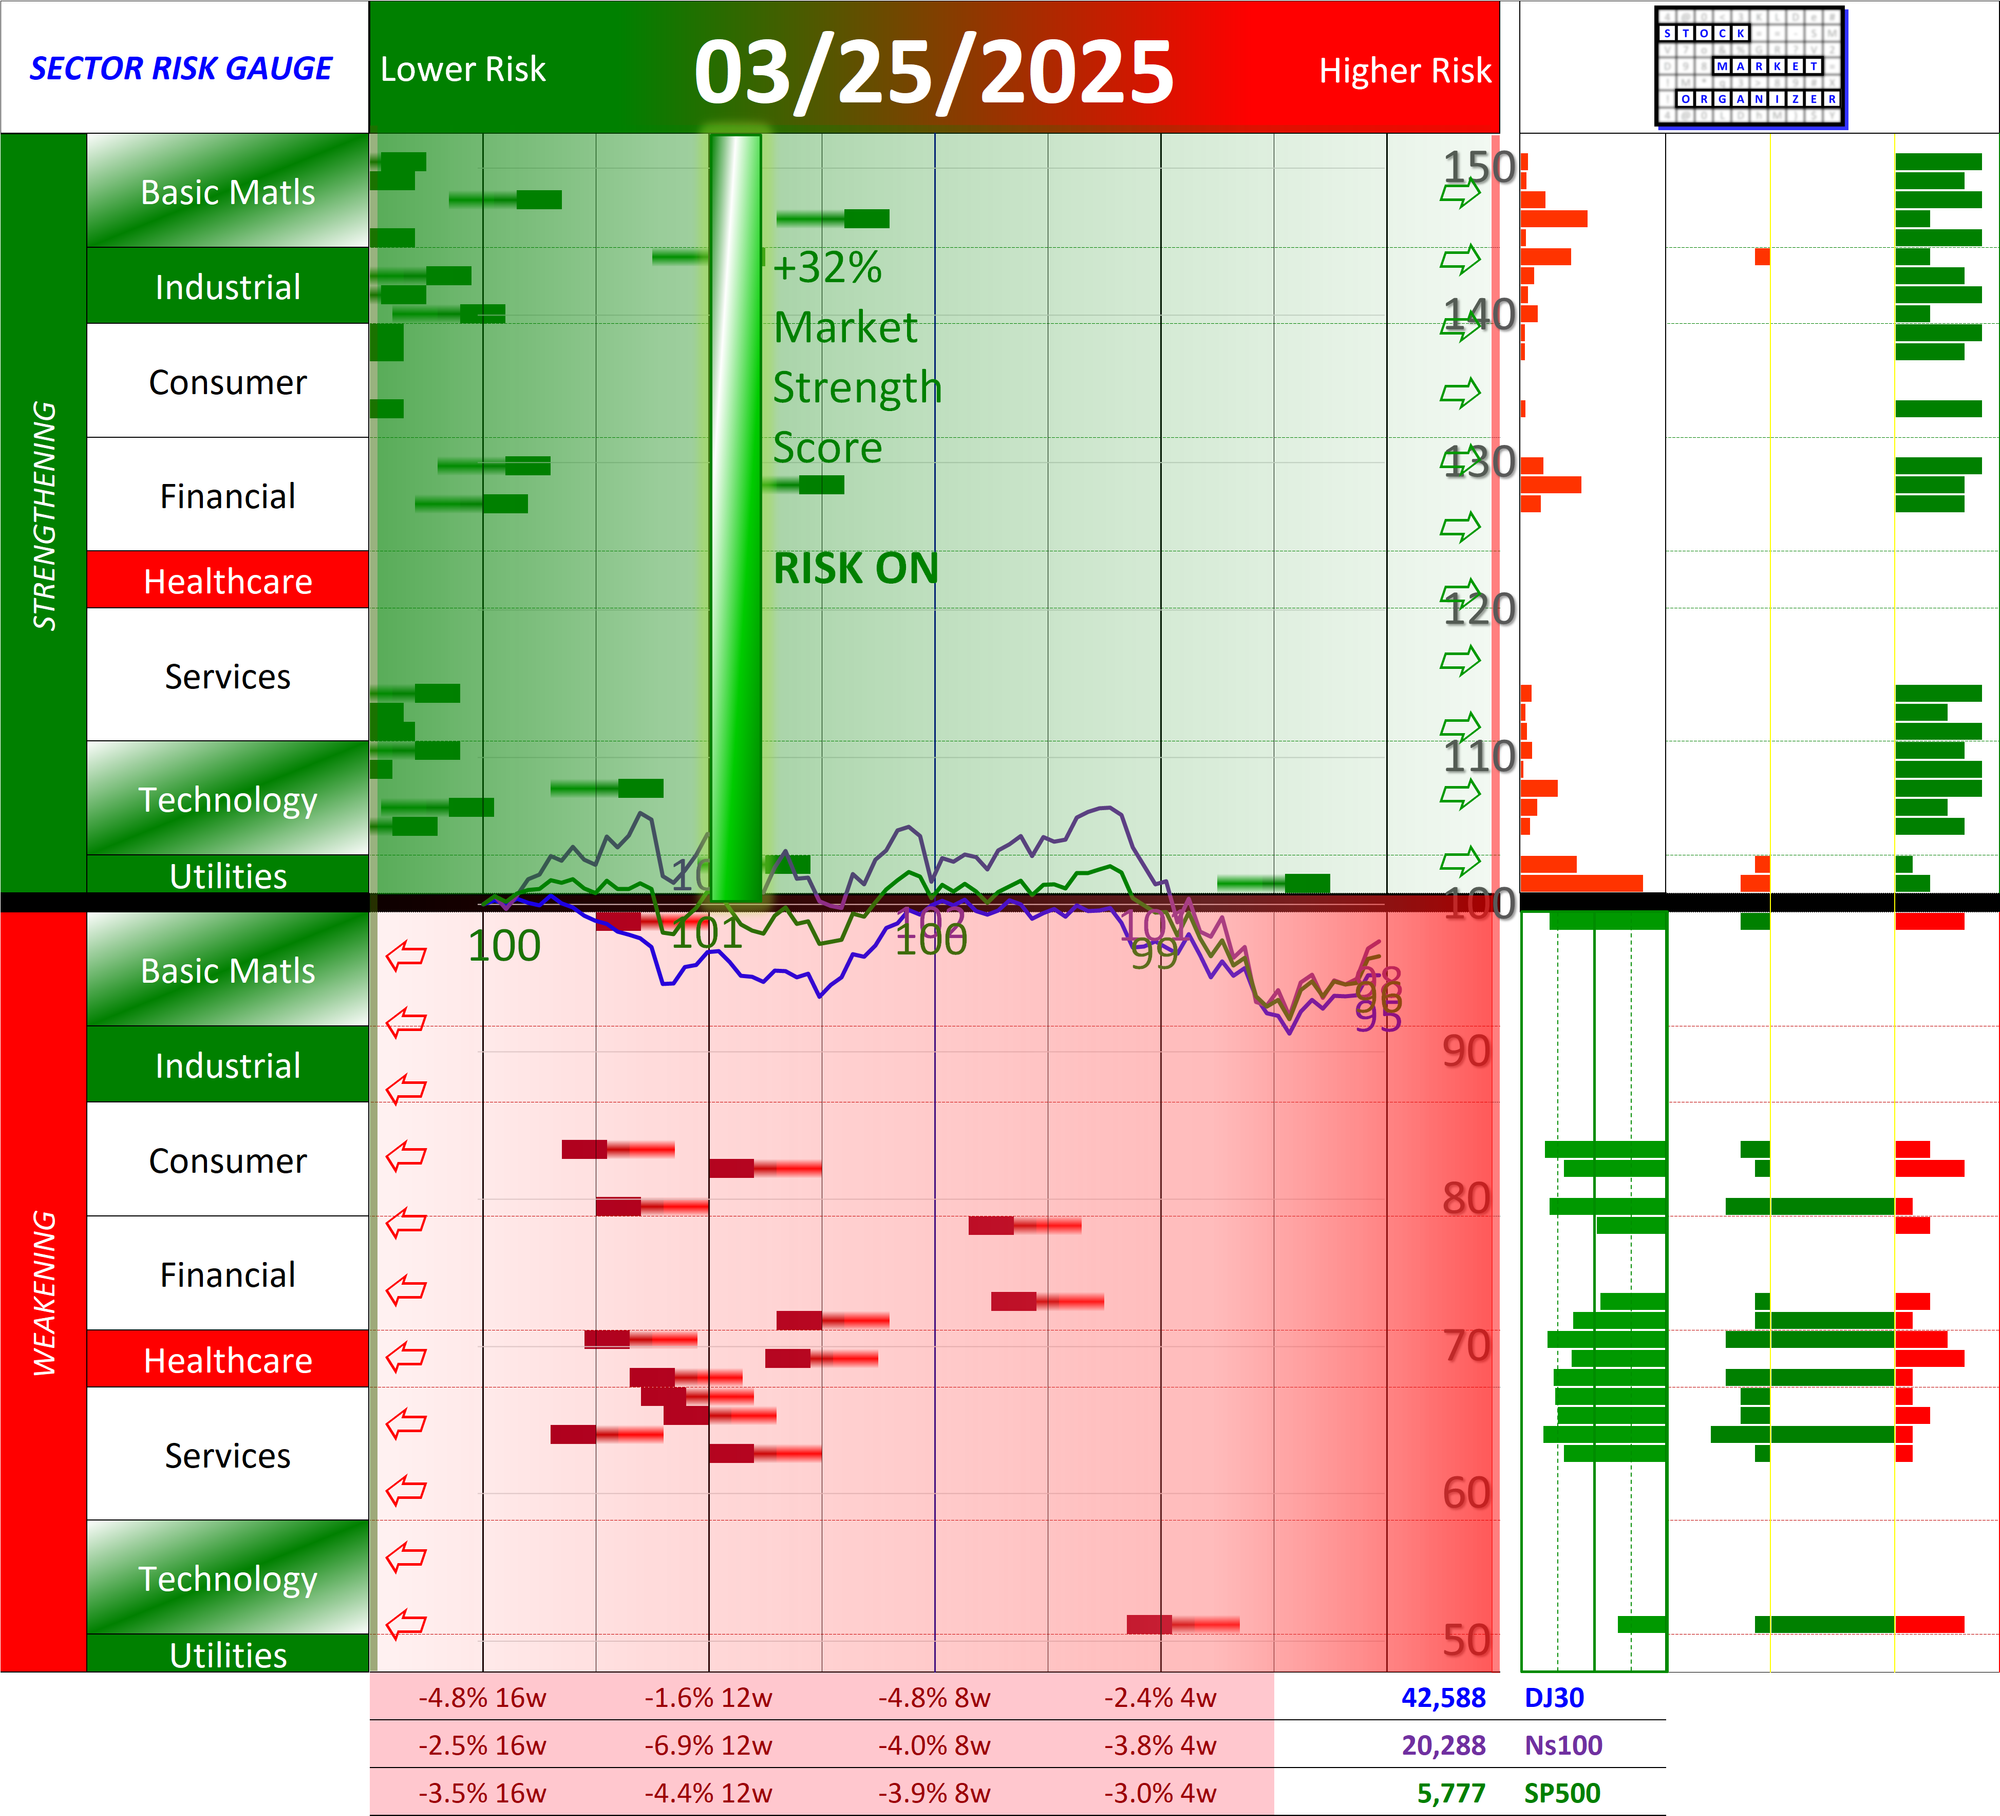
Today the Market Strength Score and Sector Risk Gauge remain positive at +32%.
II. What Do The Pies Say?
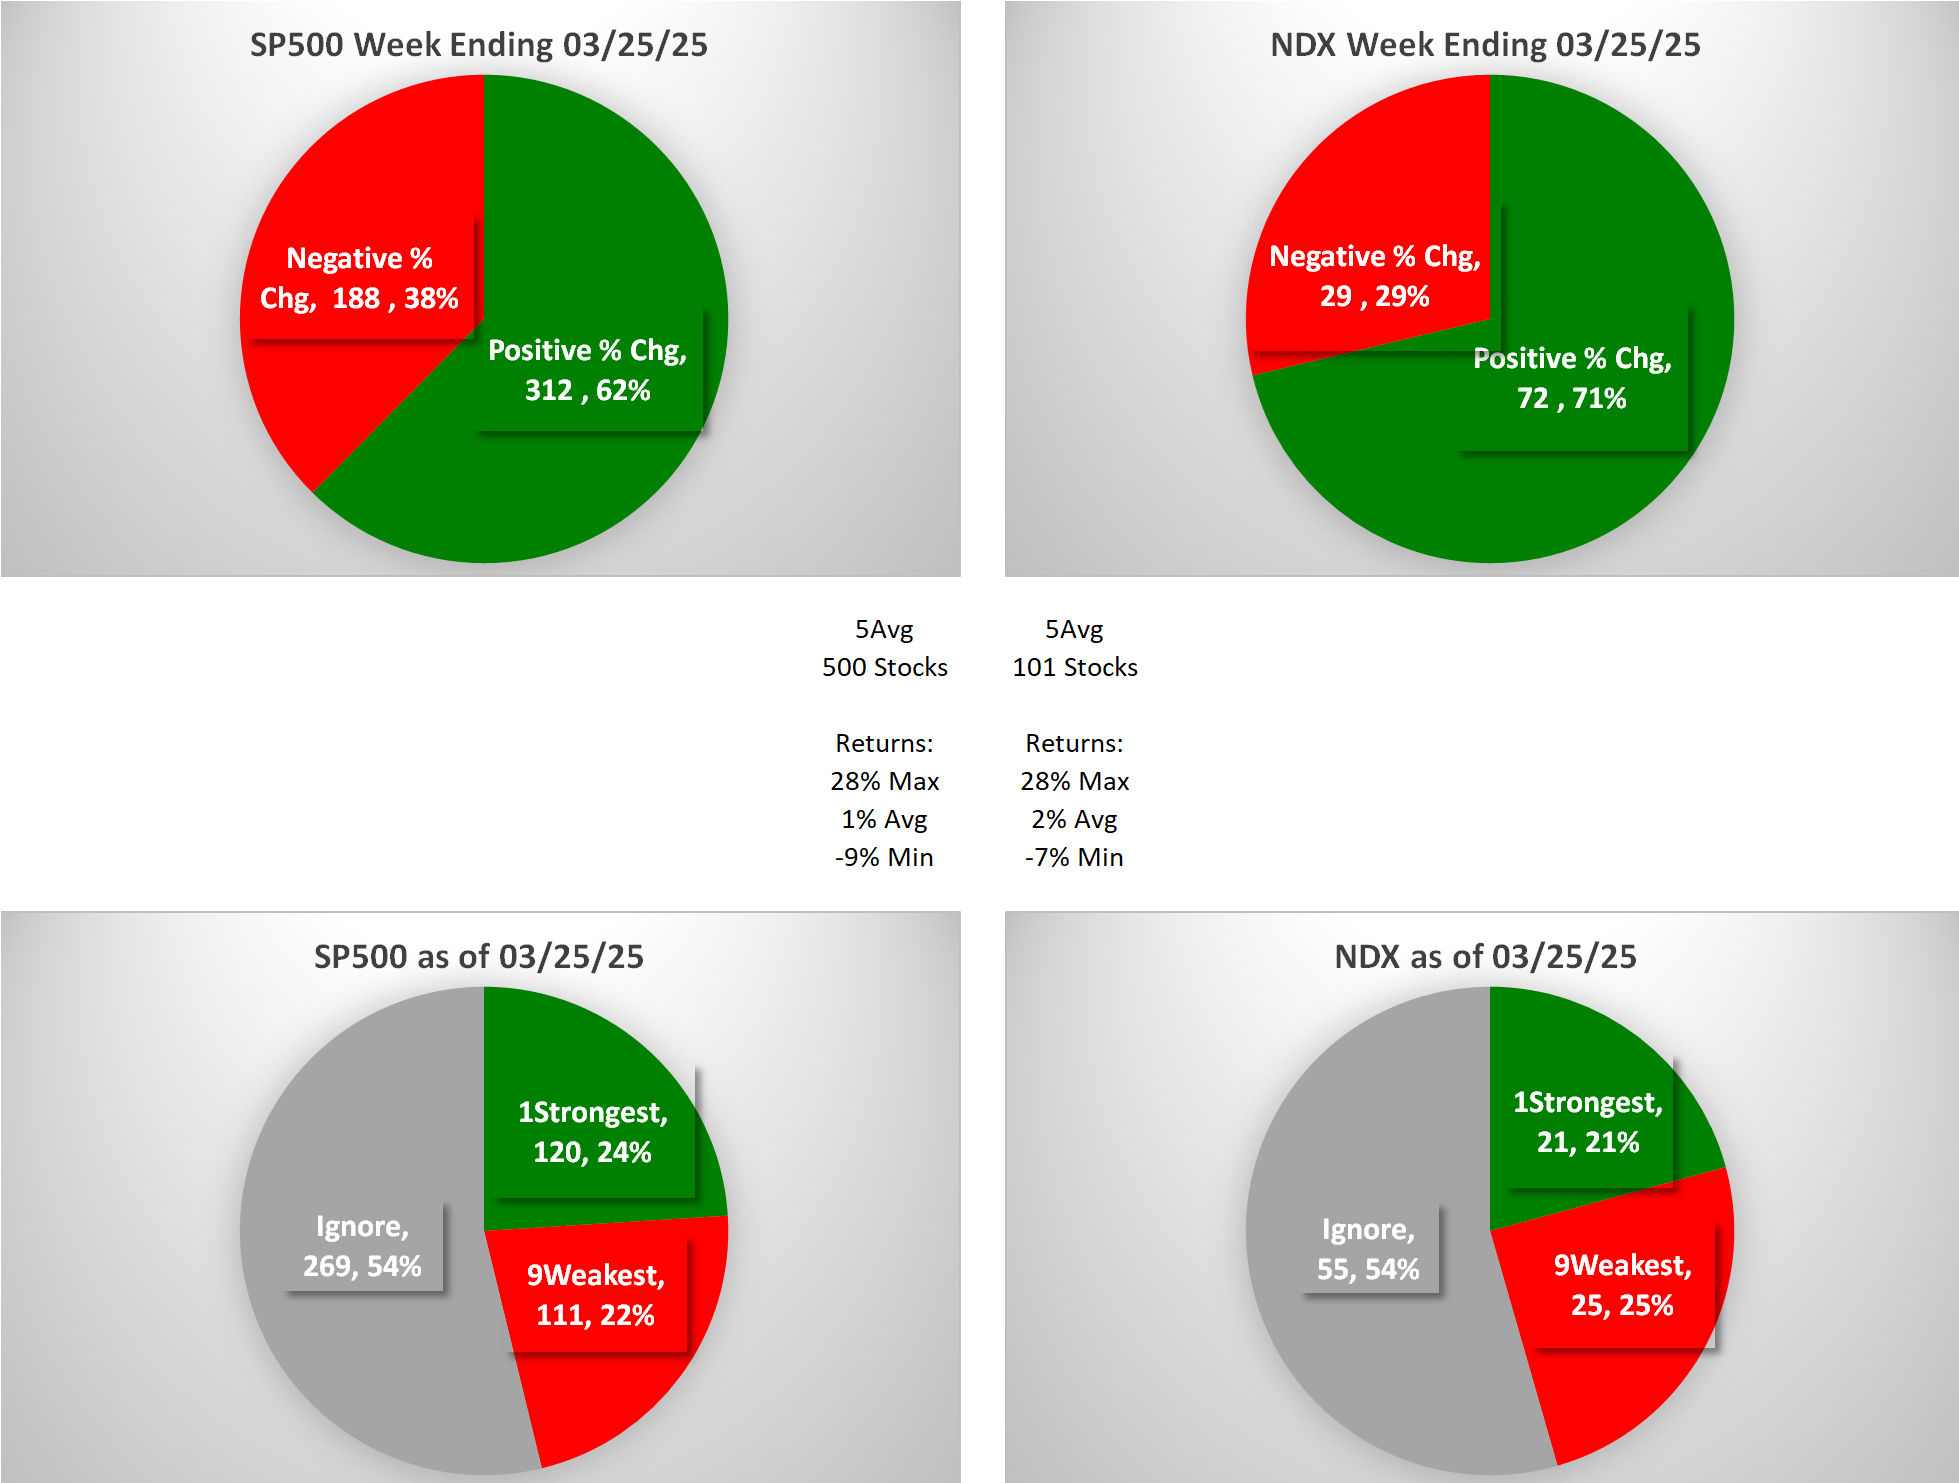
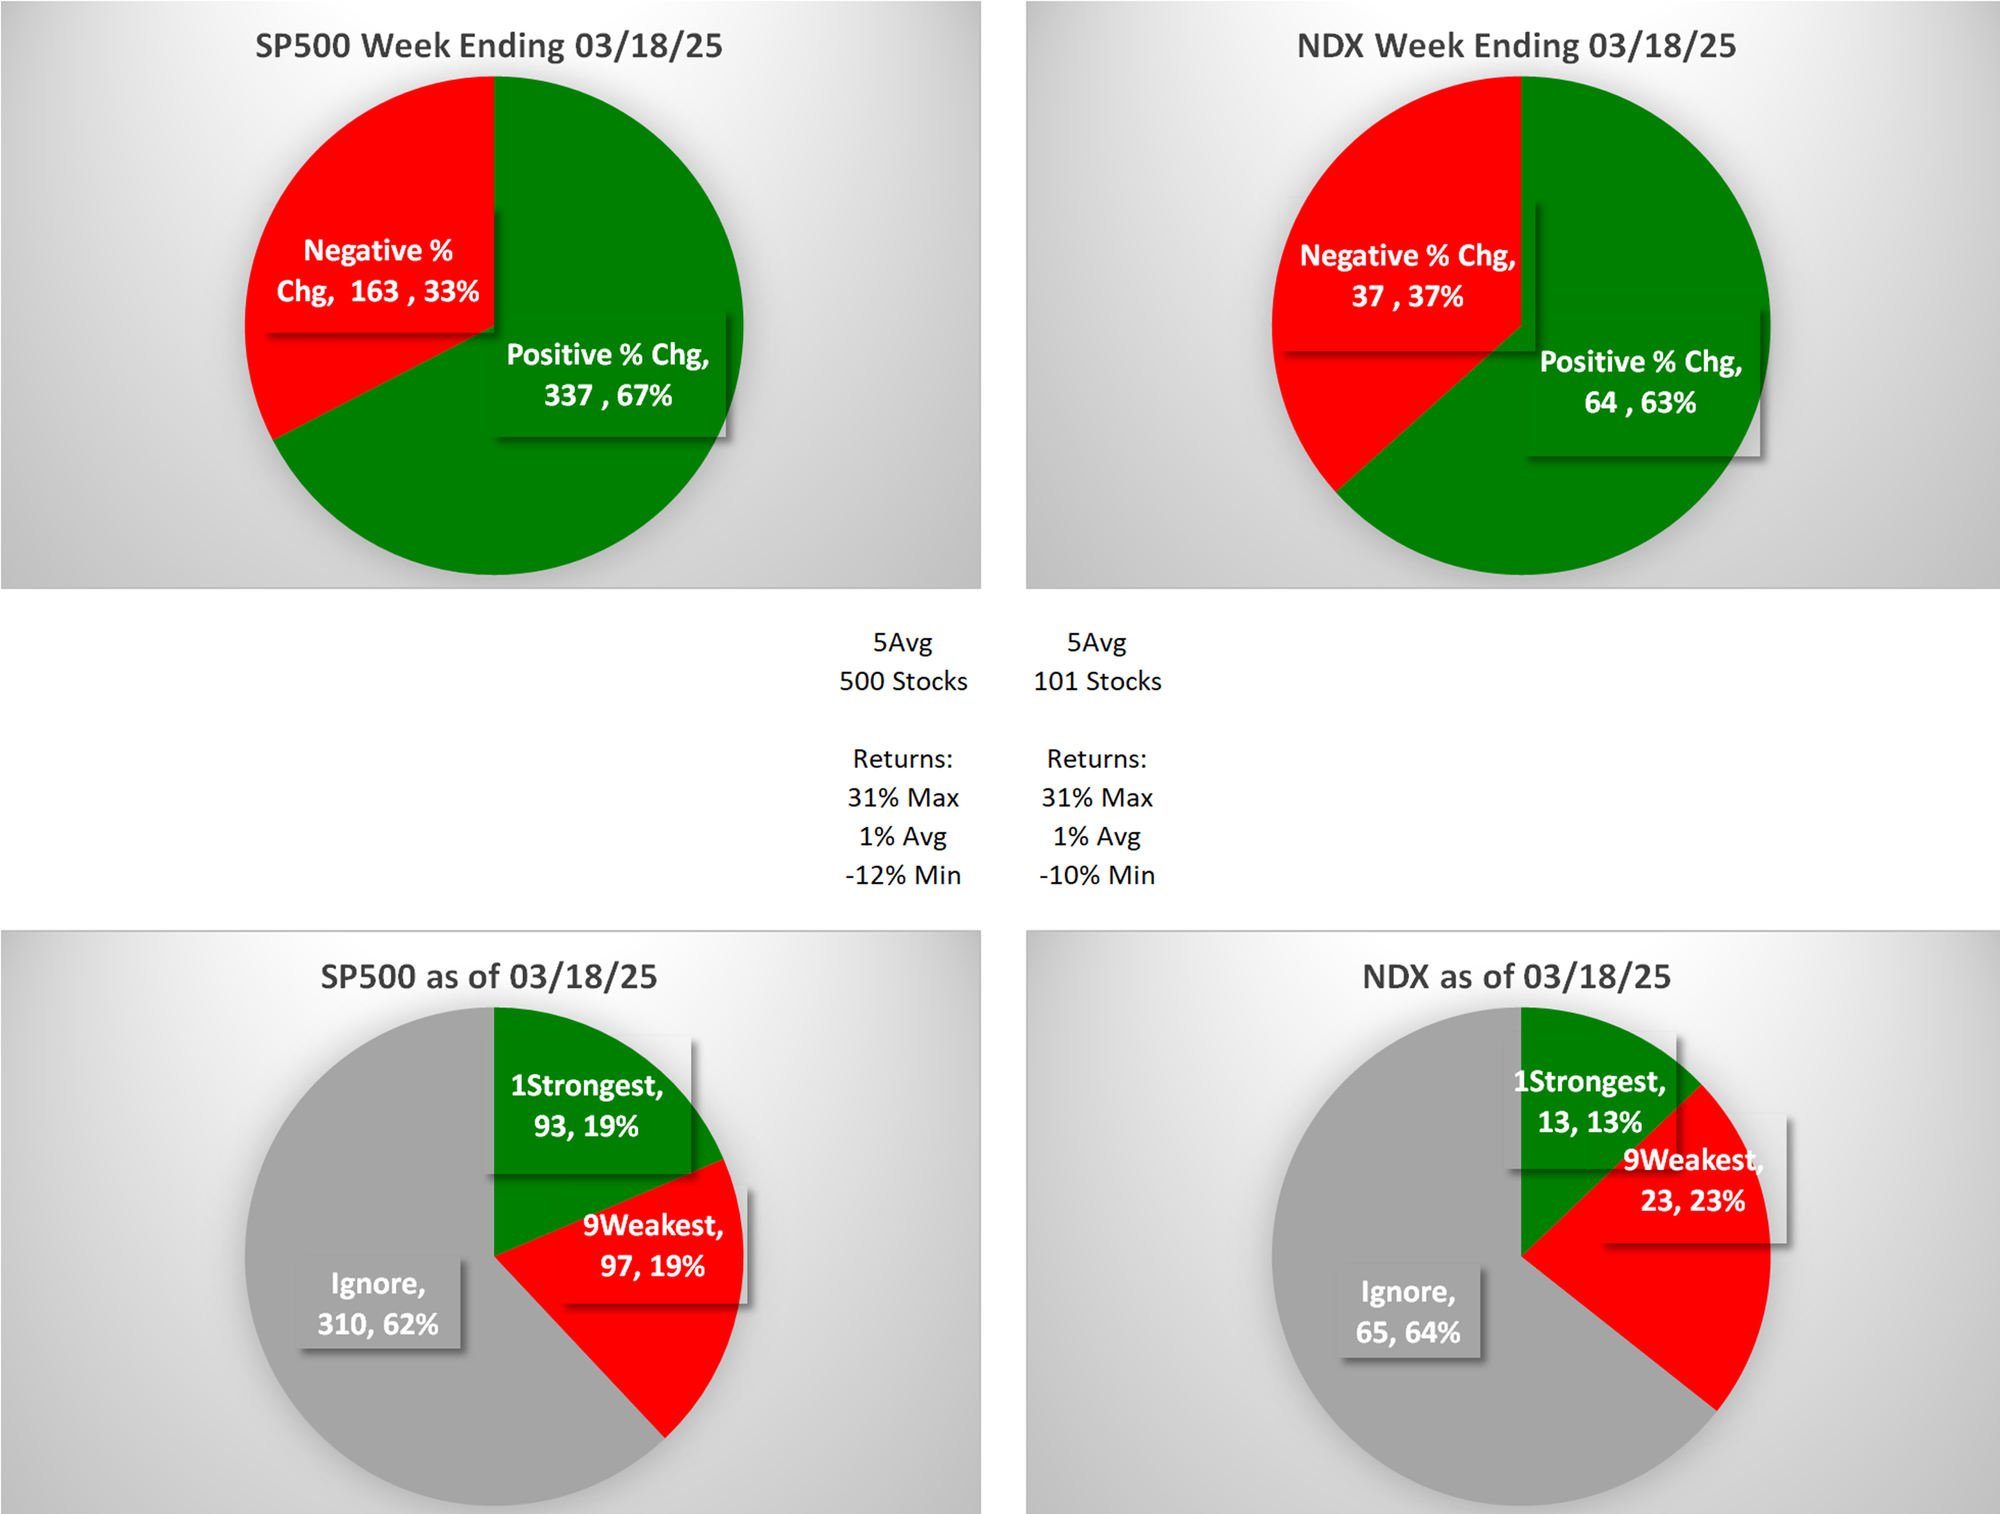
The following shows the comparison between the two indexes and their prior performance of the following:
- Positive:Negative Stocks
- Stocks rated 1Strongest vs. 9Weakest vs. Other (all ratings from 2Very Strong through 8Very Weak)
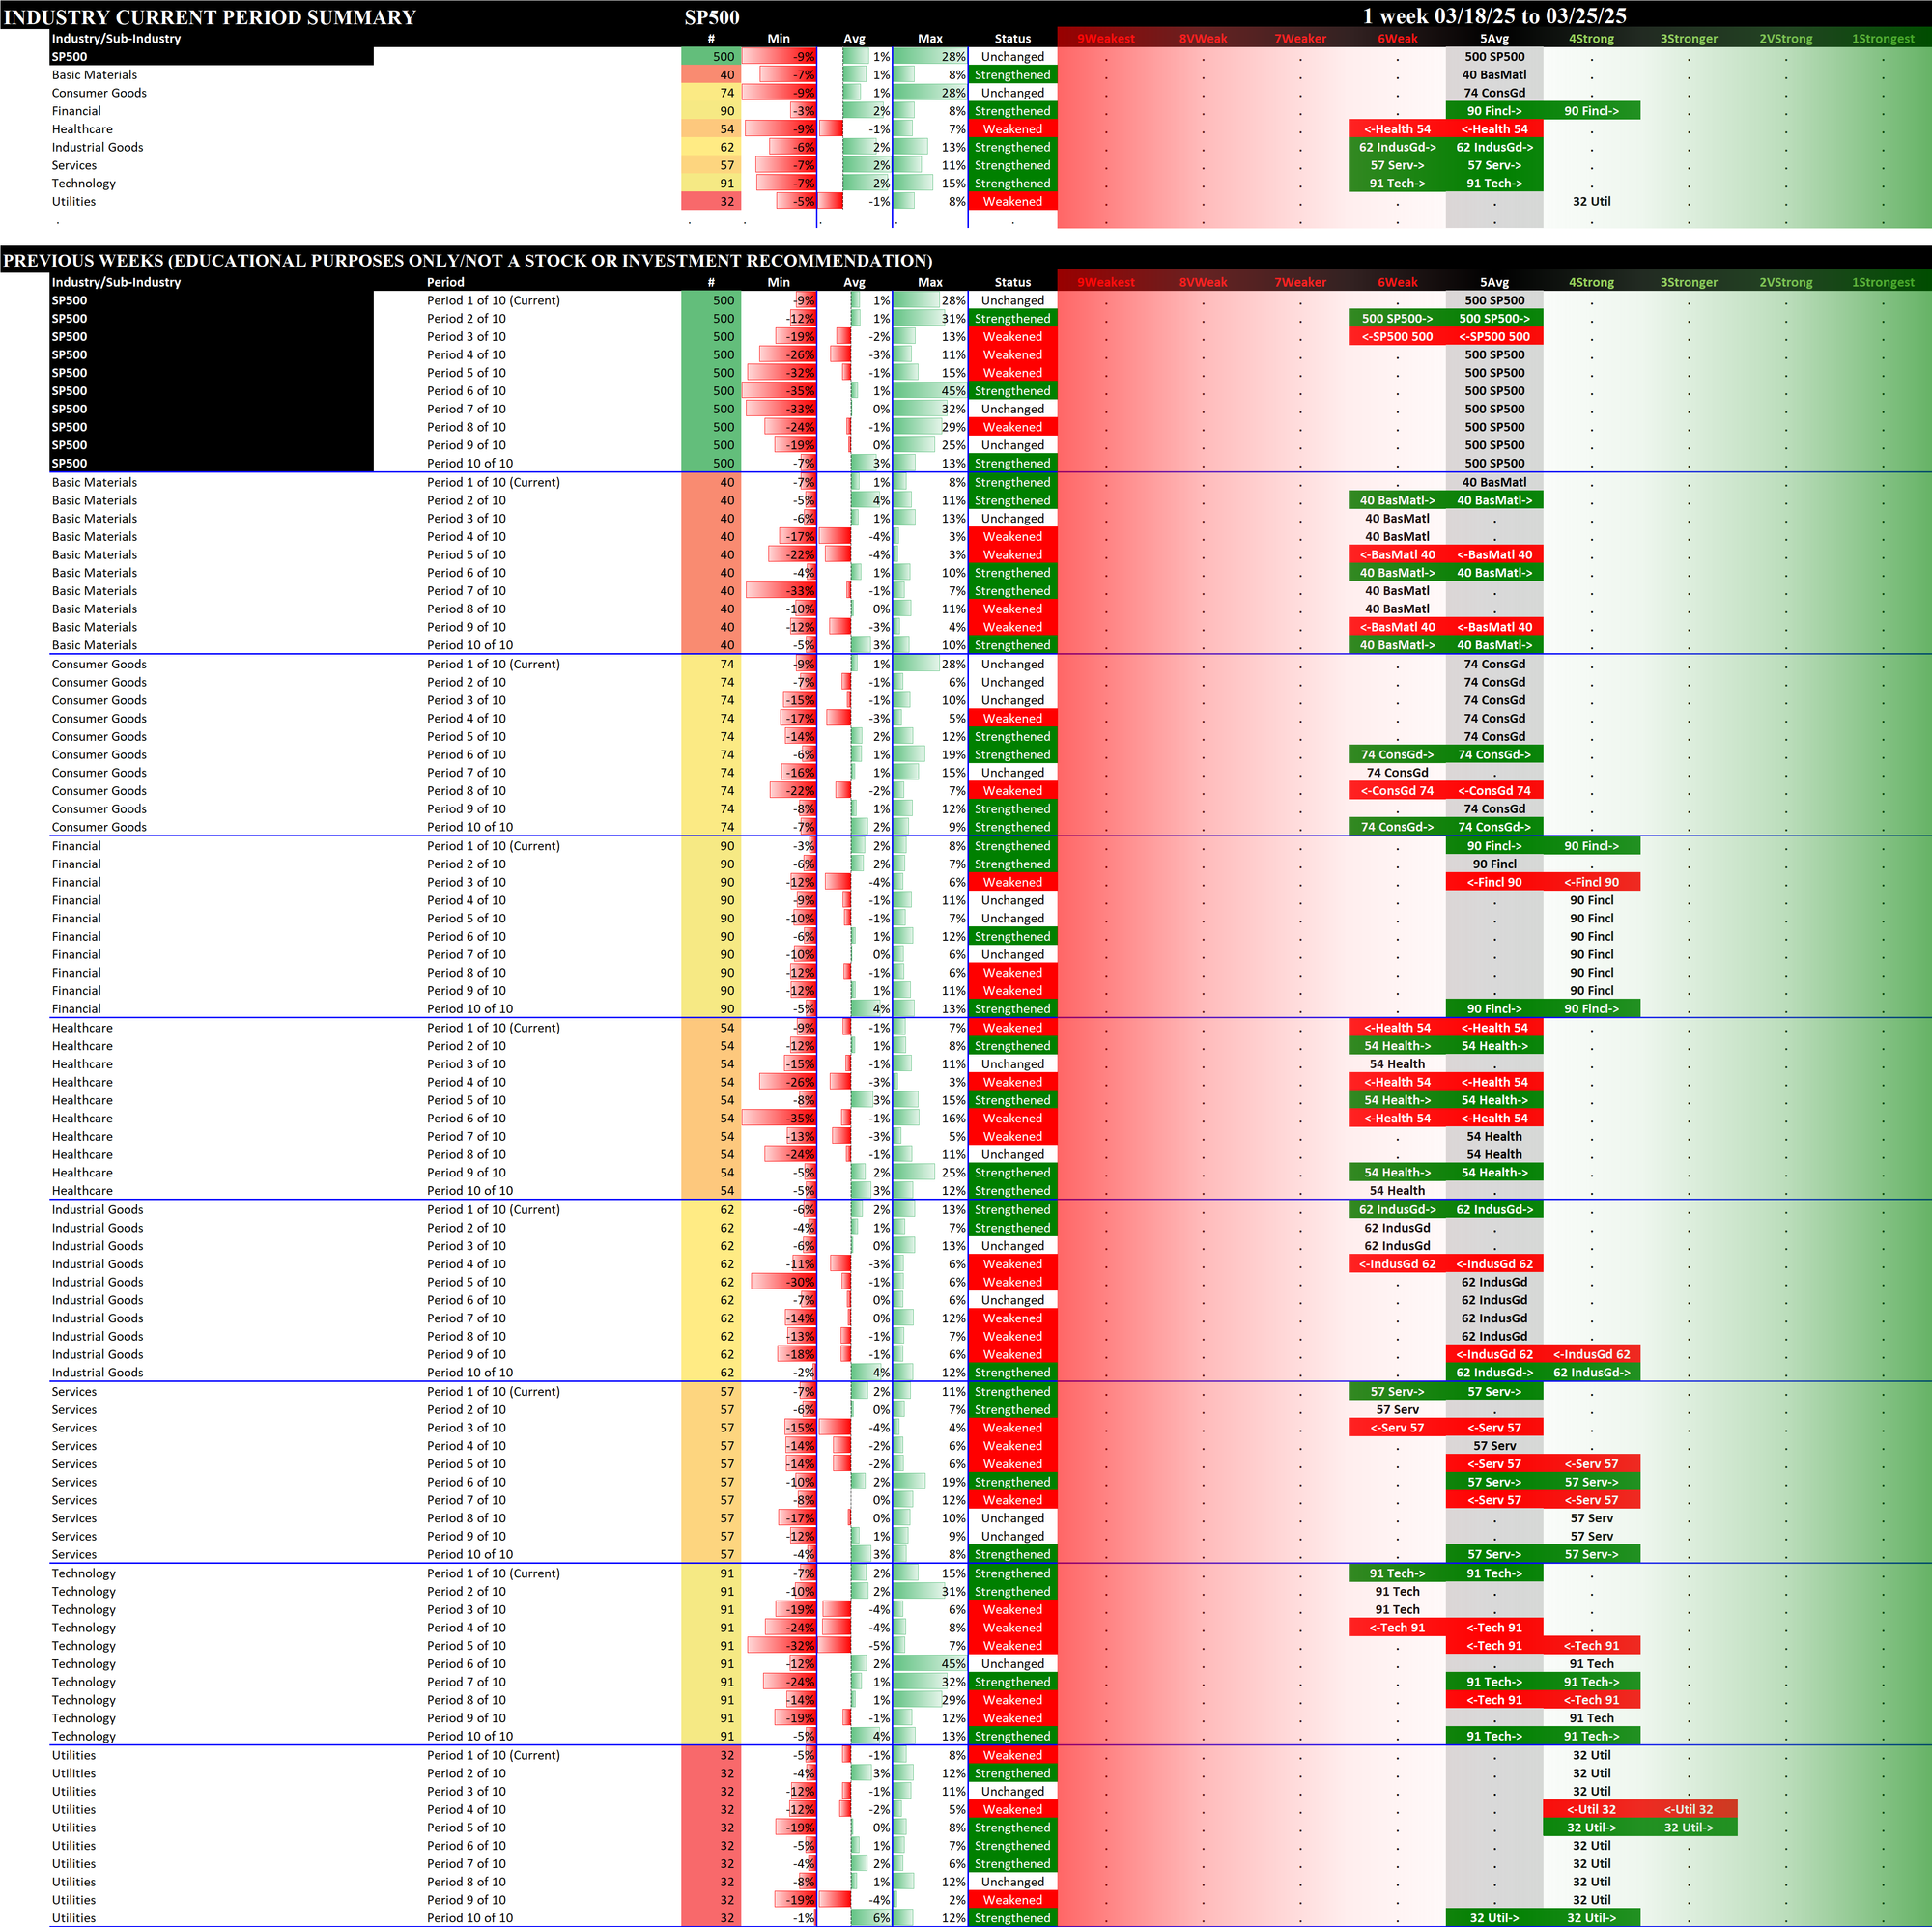
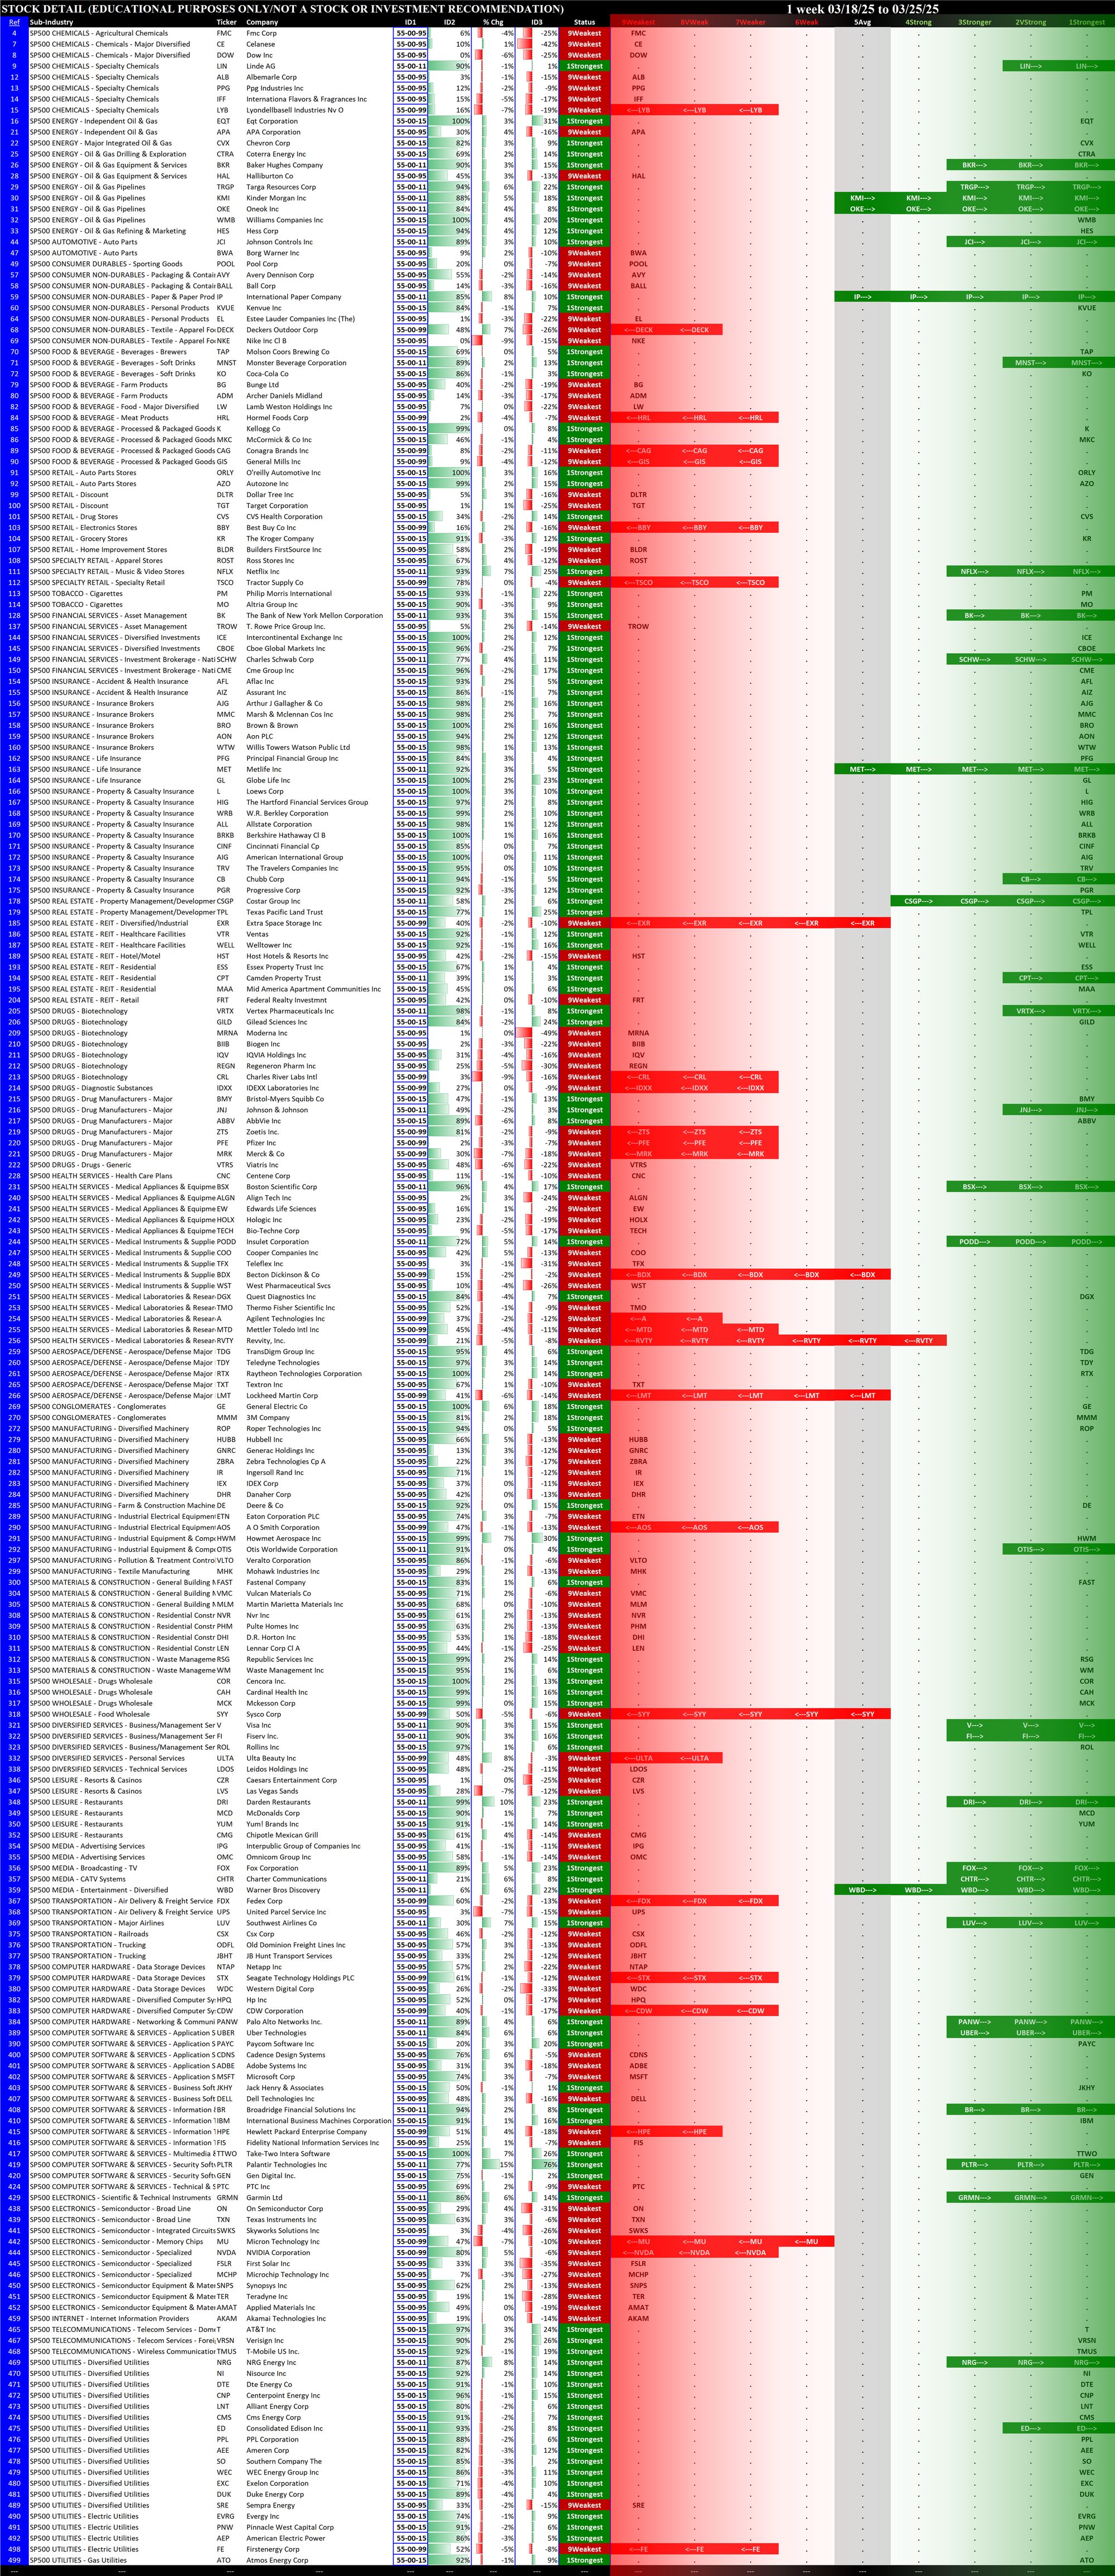
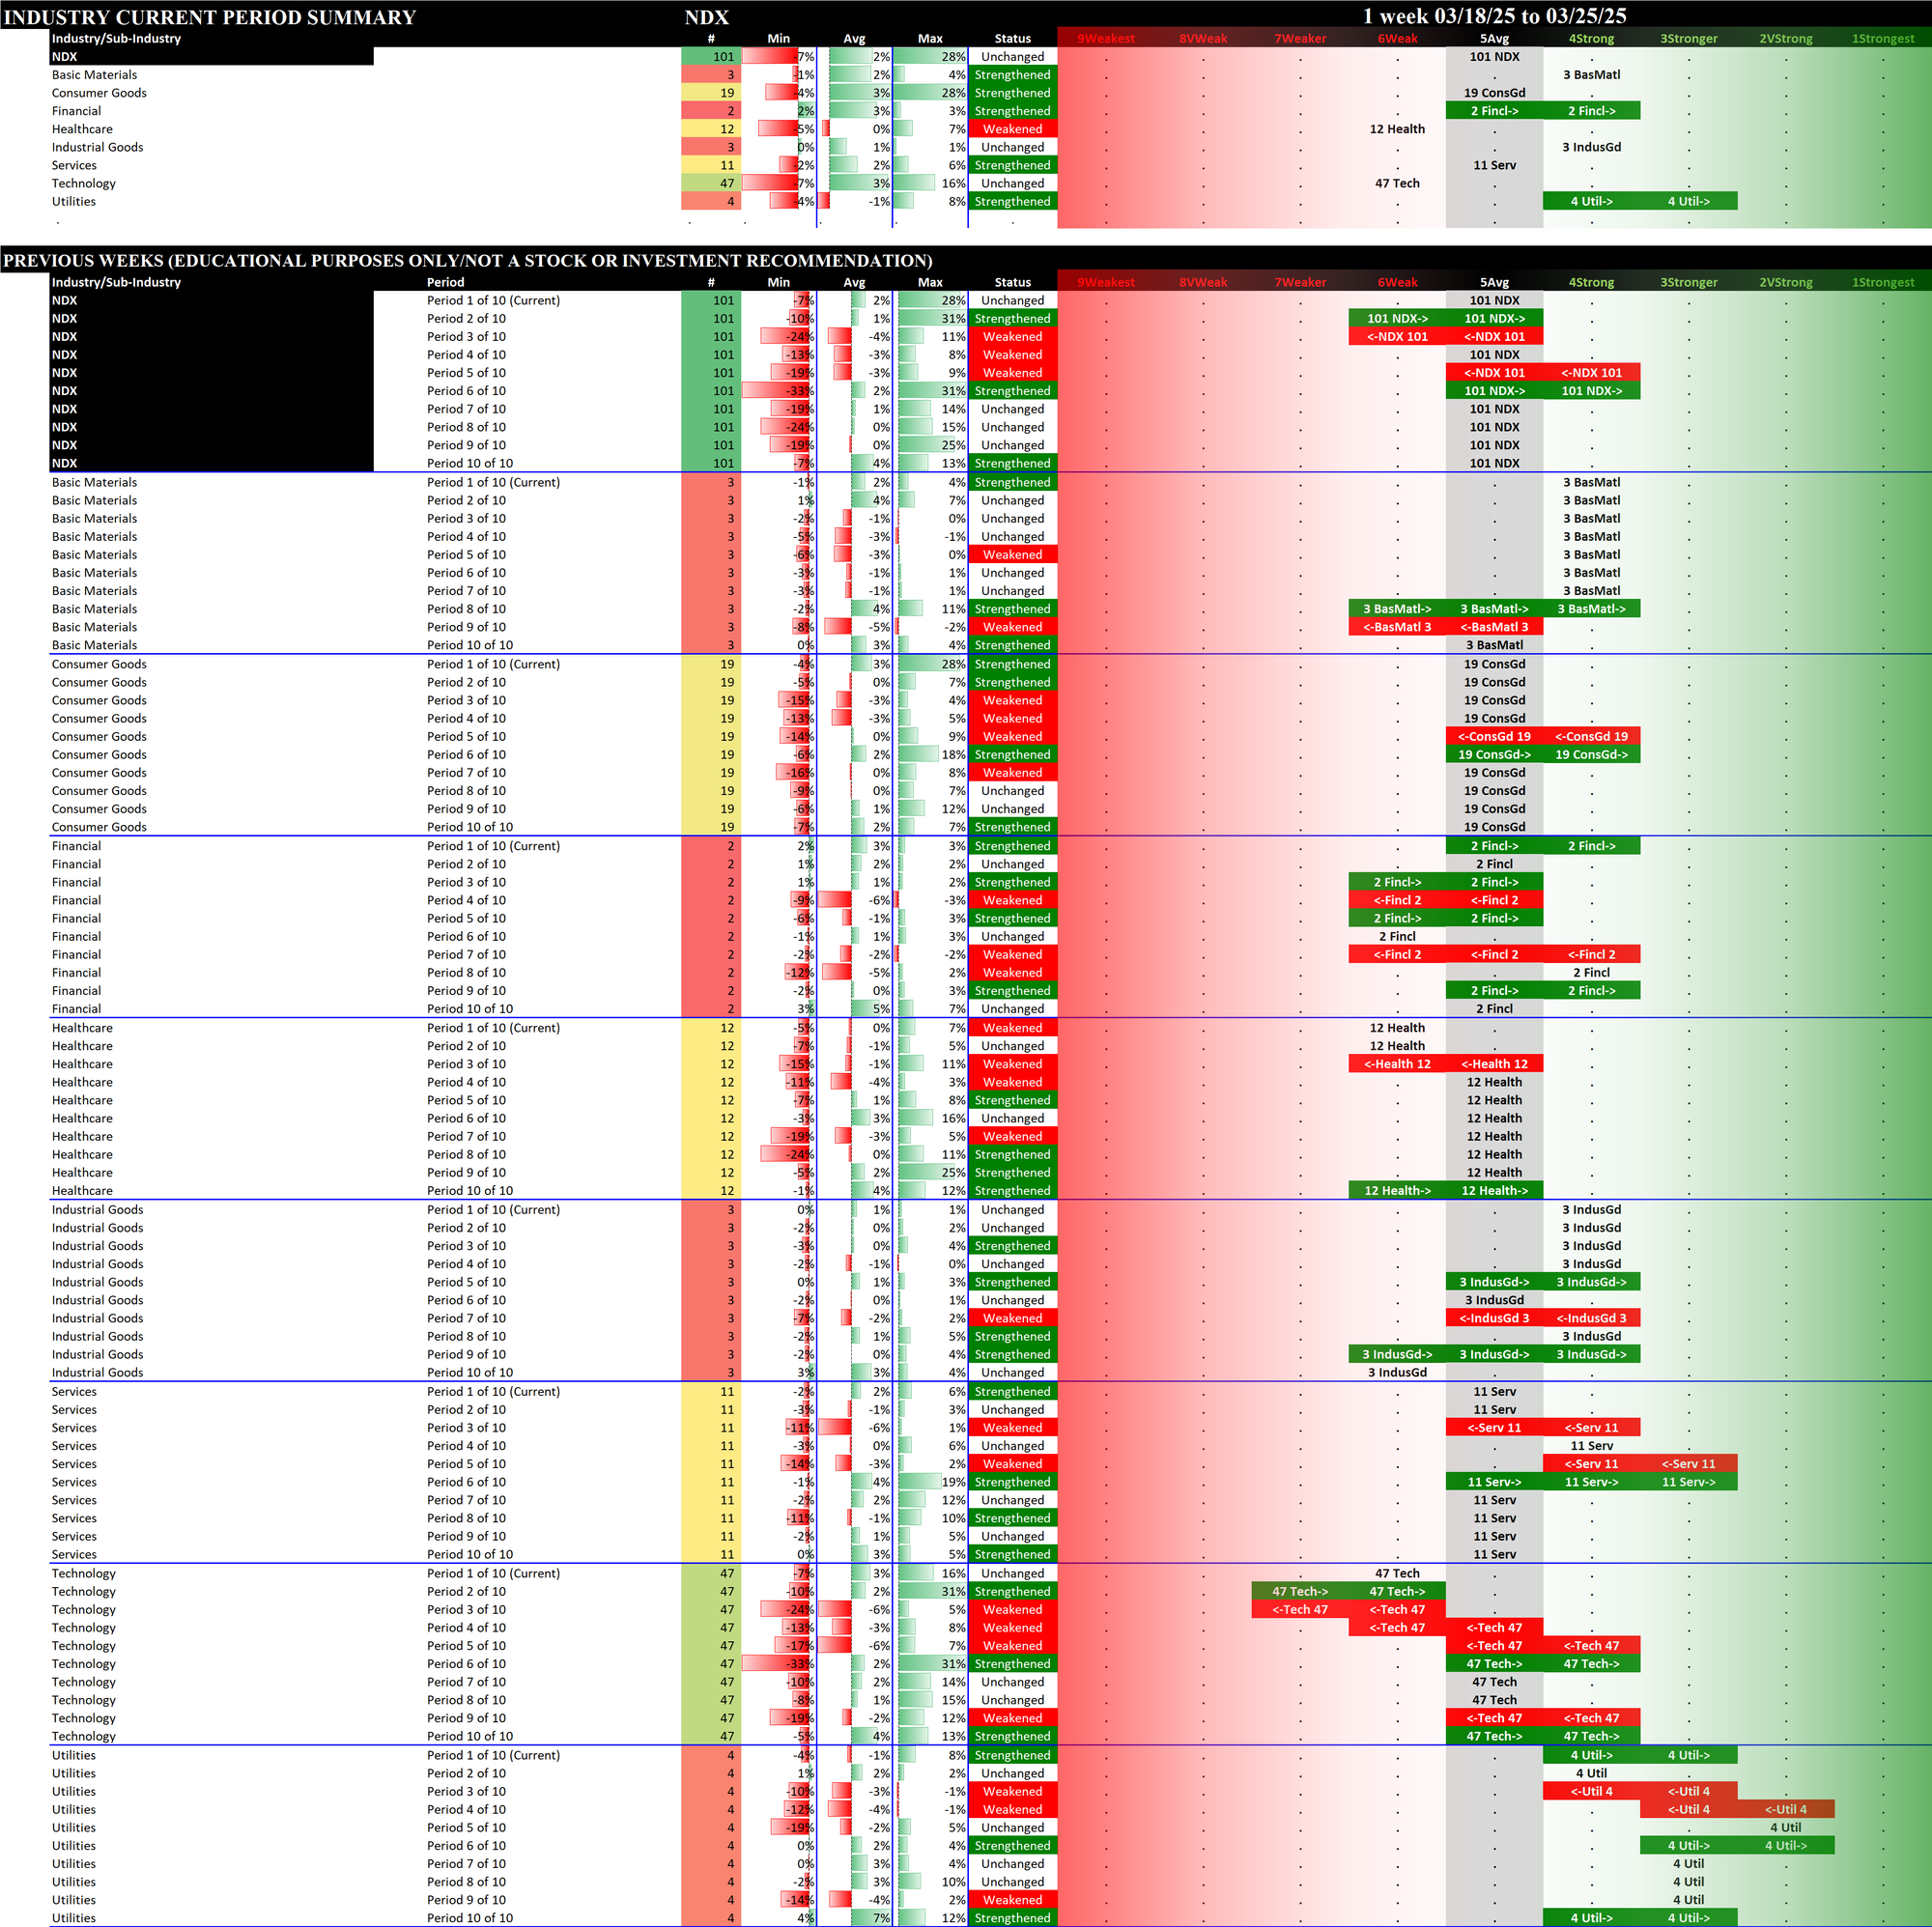
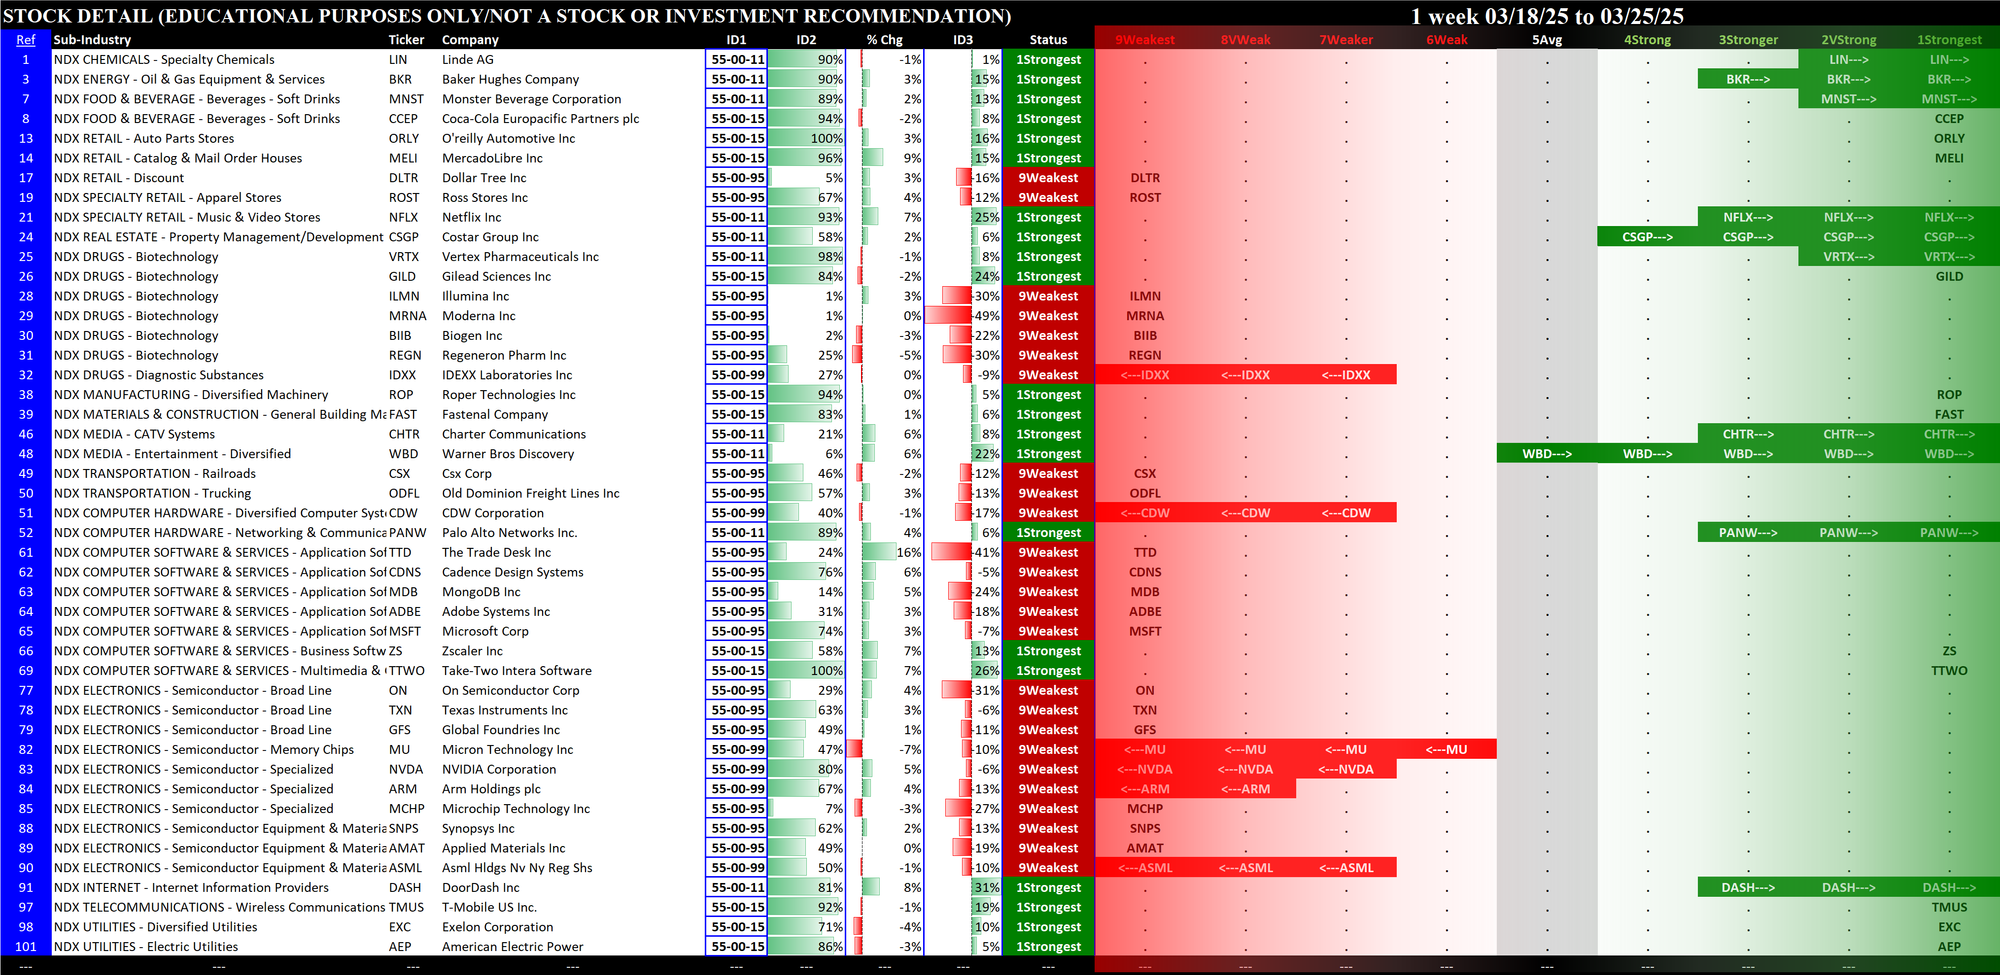
All stocks in each index rated 1Strongest or 9Weakest are listed in the section below named "Indexes - Component Sectors, 1Strongest / 9Weakest Stocks" which provides detail for each index.
Current Week Pies - Week Ending 03/25/25
Previous Week Pies - Week Ending 03/18/25
III. Indexes - Component Sectors, 1Strongest / 9Weakest Stocks
S&P 500 - Week Ending 03/25/25
Nasdaq 100 - Week Ending 03/25/25
IV. Stocks at 5+ Year Highs and Lows
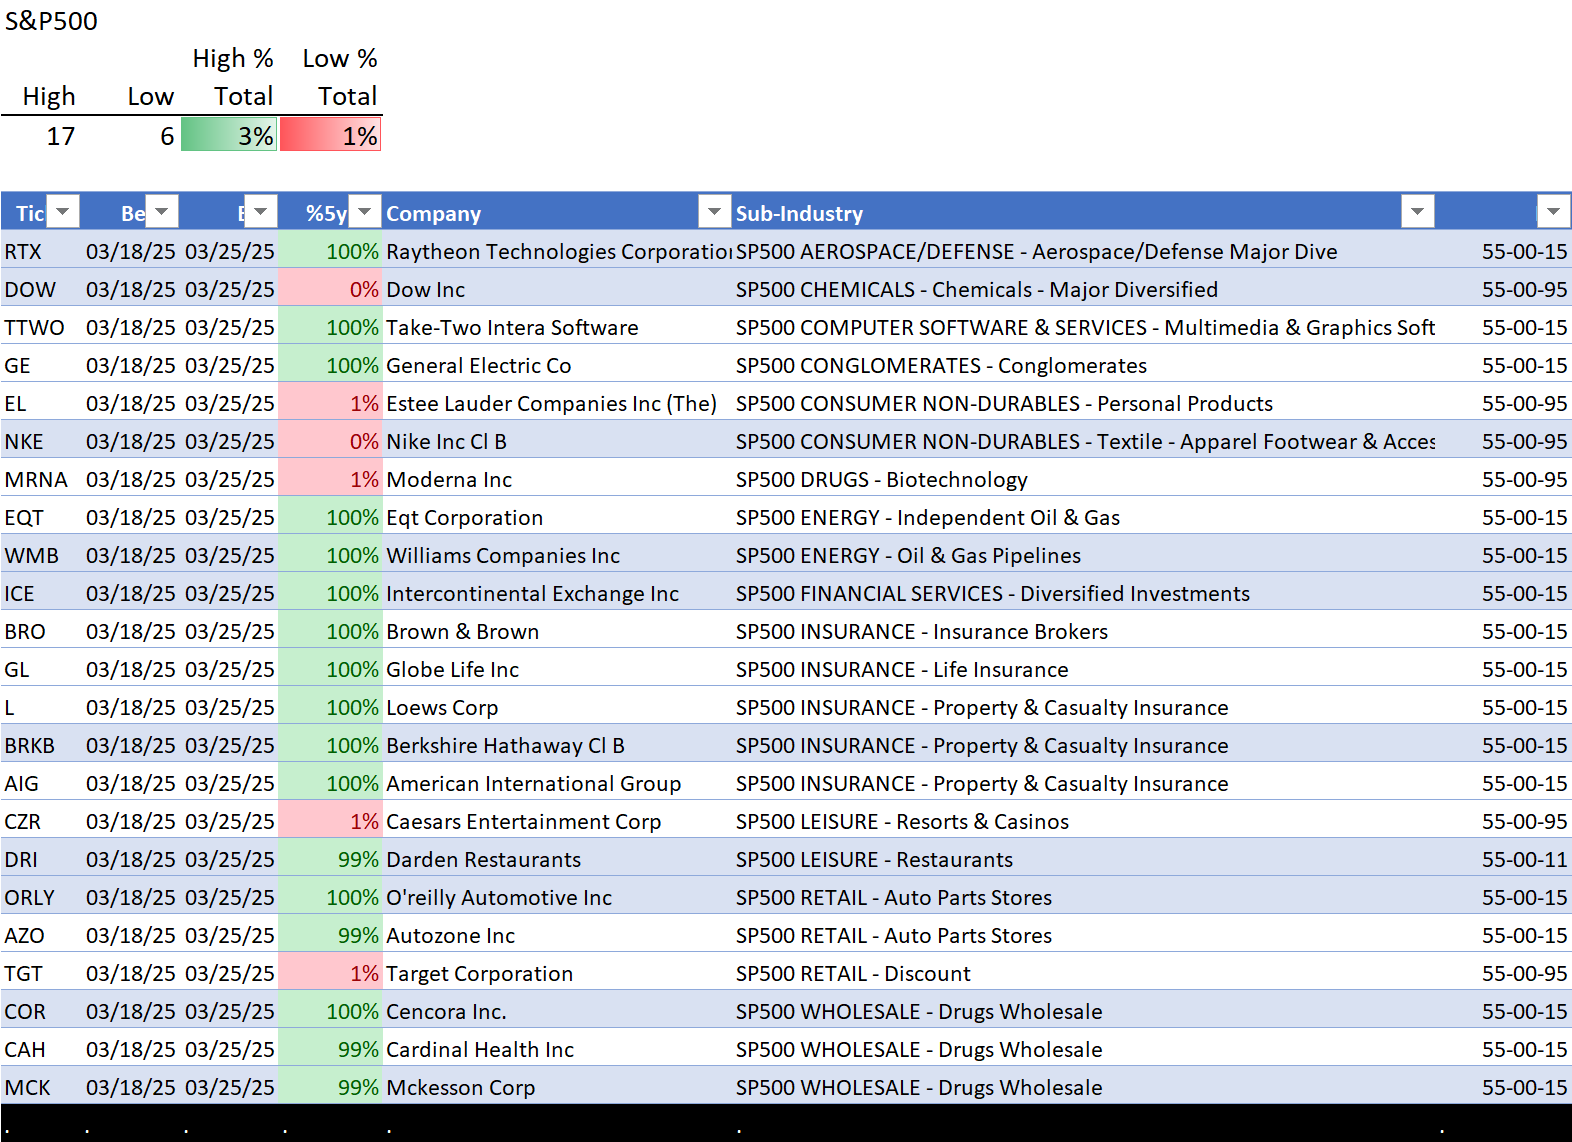
The following section provides details regarding multi-year highs and lows for the two indexes.
Current Week - Week Ending 03/25/25
For the week ending Tuesday, March 25, 2025 the S&P500 had 17 multi-year highs and 6 multi-year lows. The Nasdaq 100 had a ratio of 2:2.

Previous Week - Week Ending 03/18/25
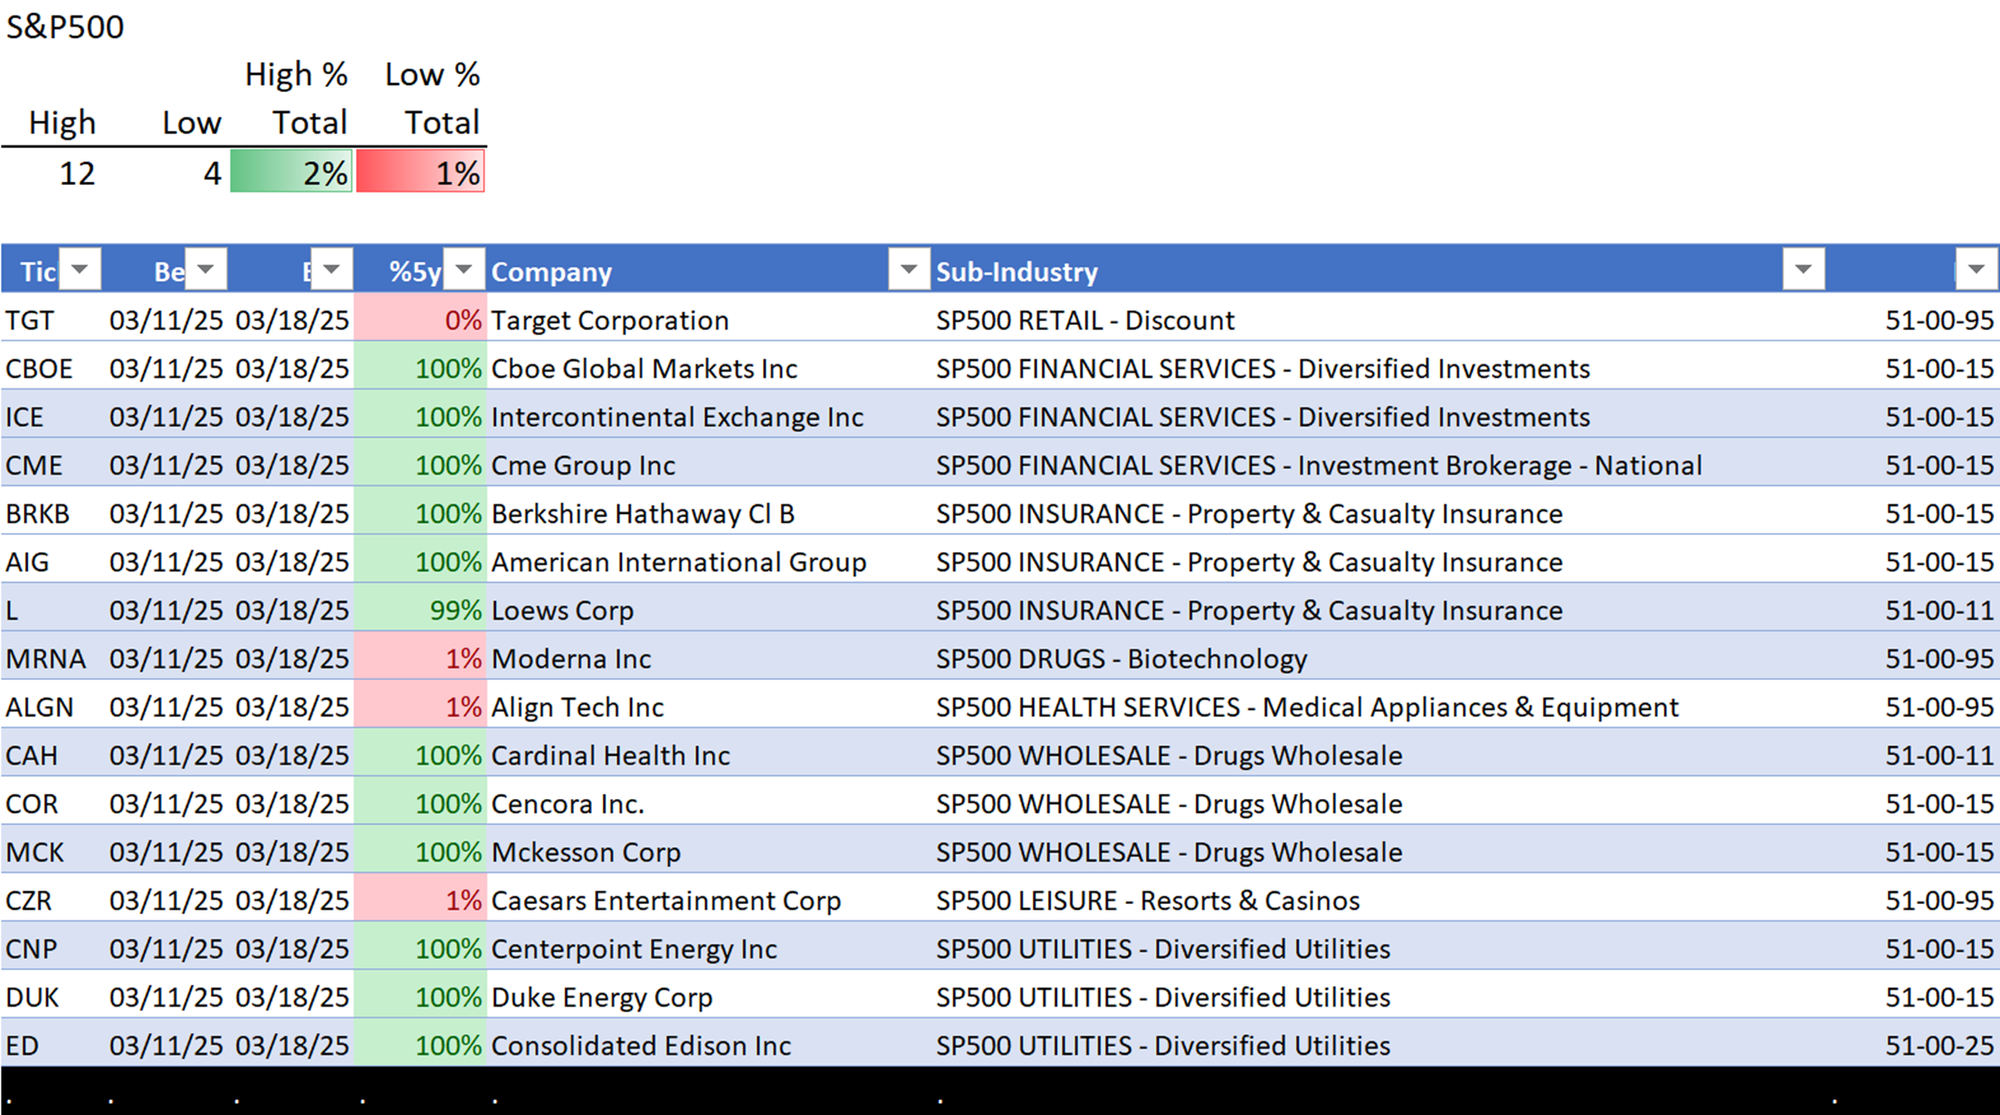
For the week ending Tuesday, March 18, 2025 the S&P500 had 12 multi-year highs (including BRKB/Berkshire Hathaway) and 4 multi-year lows (including MRNA/Moderna and TGT/Target Corporation). The Nasdaq 100 had a ratio of 0:2.
