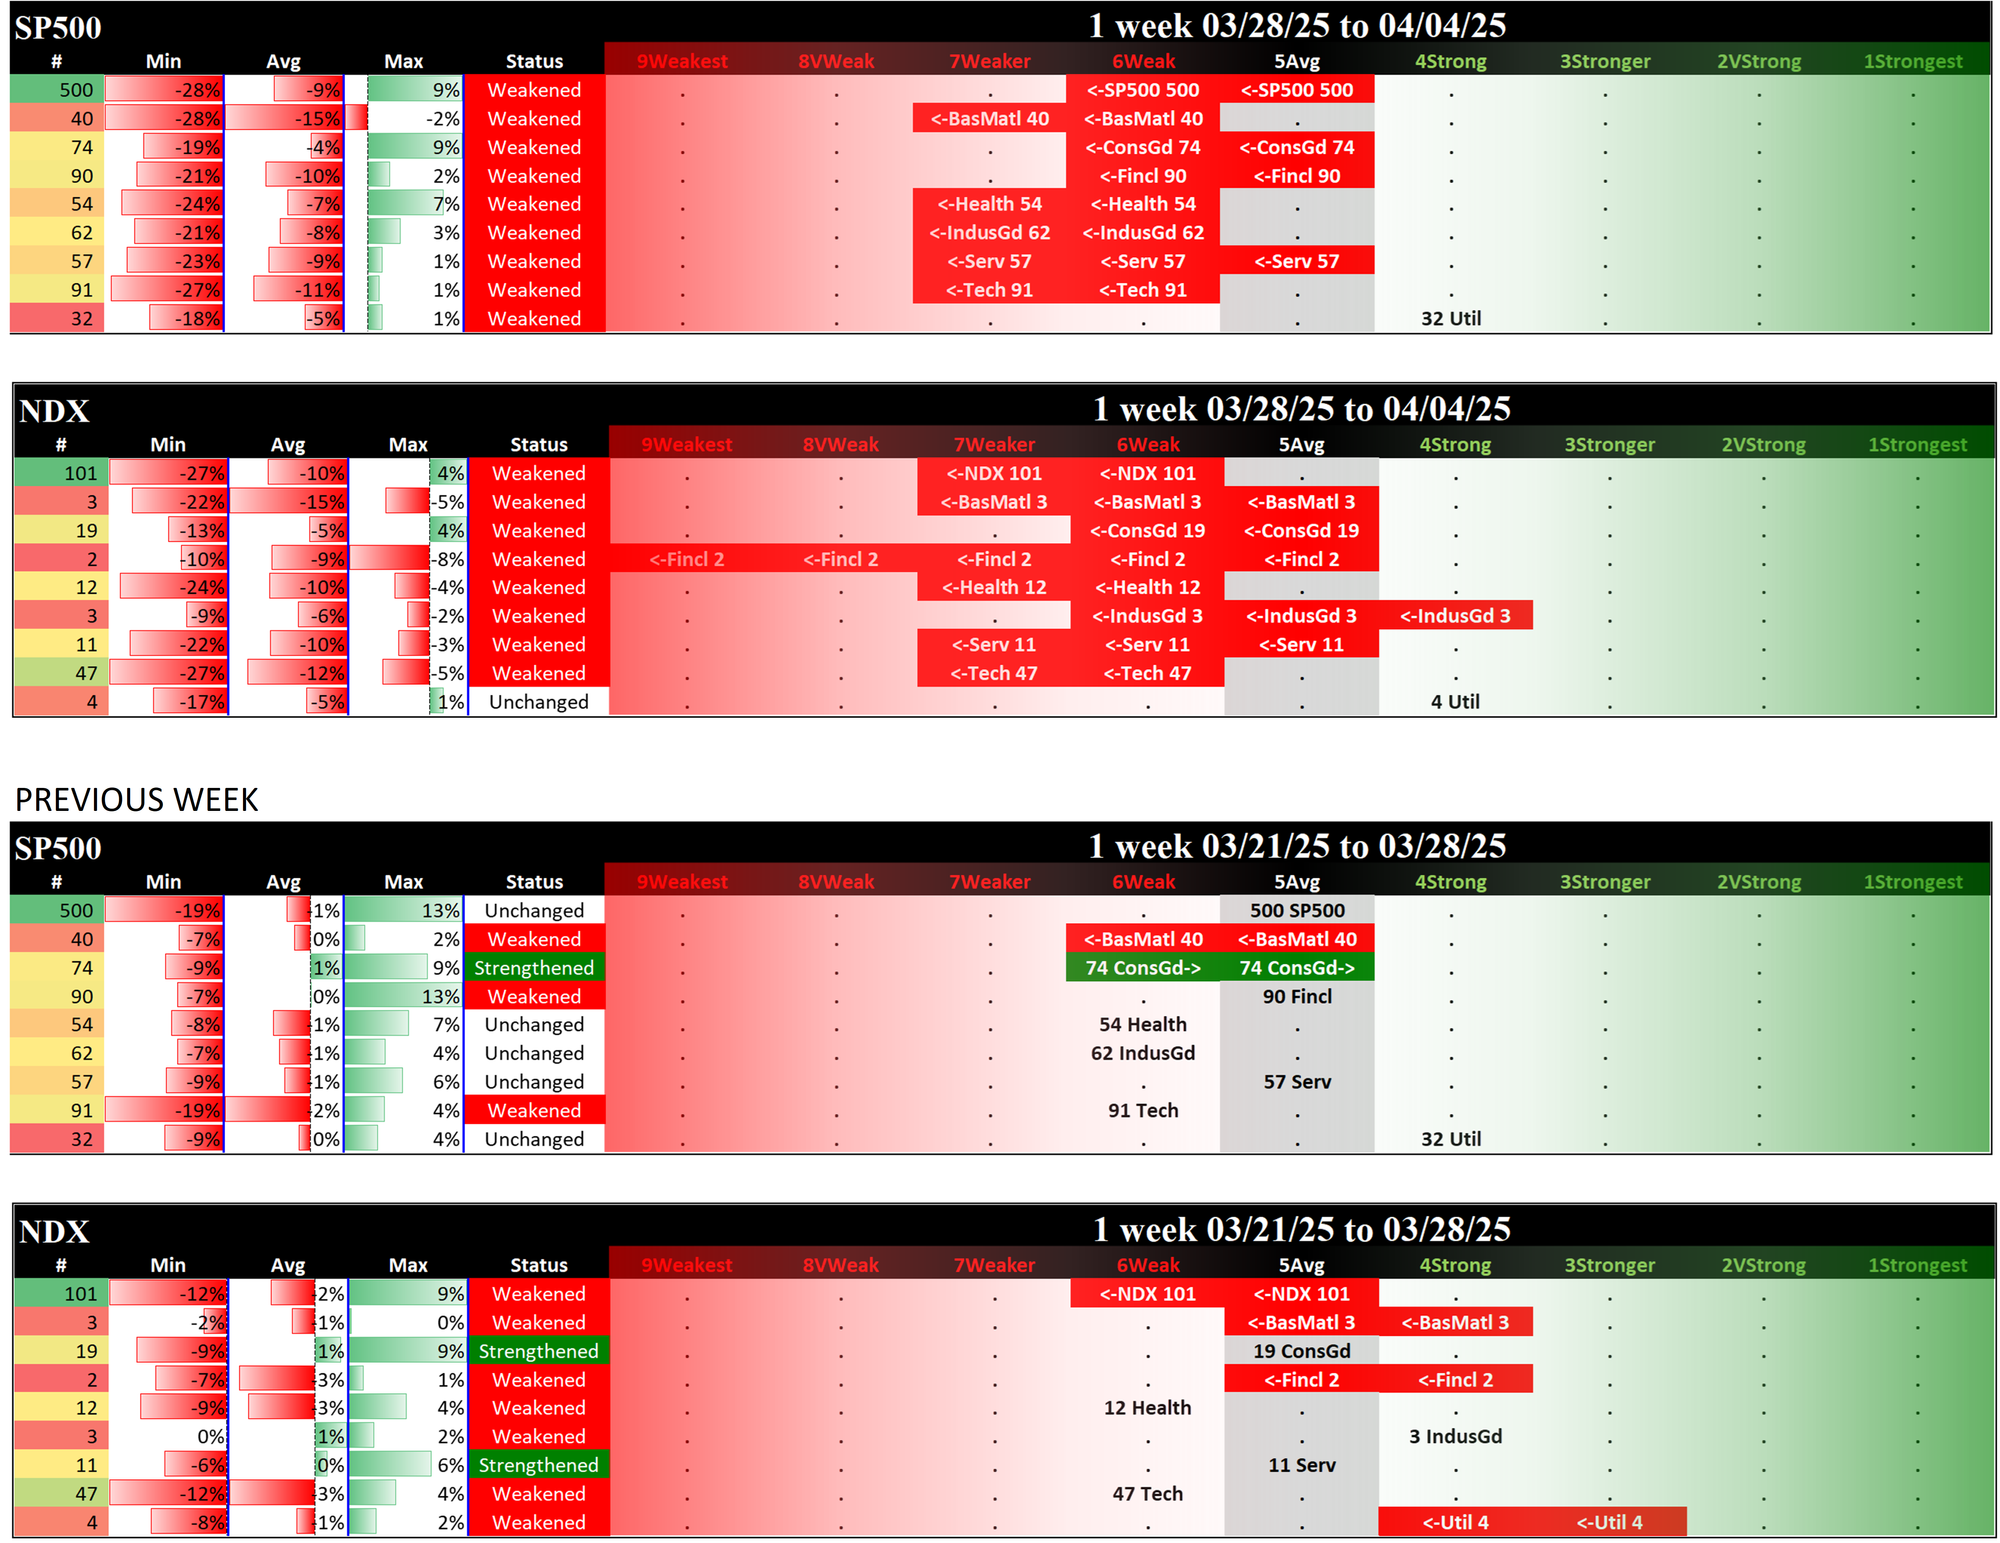
Indexes Fri 2025-04-04: SP500 6Weak (Weakened/-1), NDX 7Weaker (Weakened/-1)
This post provides the following information.
I. Background
II. What Do The Pies Say?
III. Indexes - Component Sectors, 1Strongest / 9Weakest Stocks
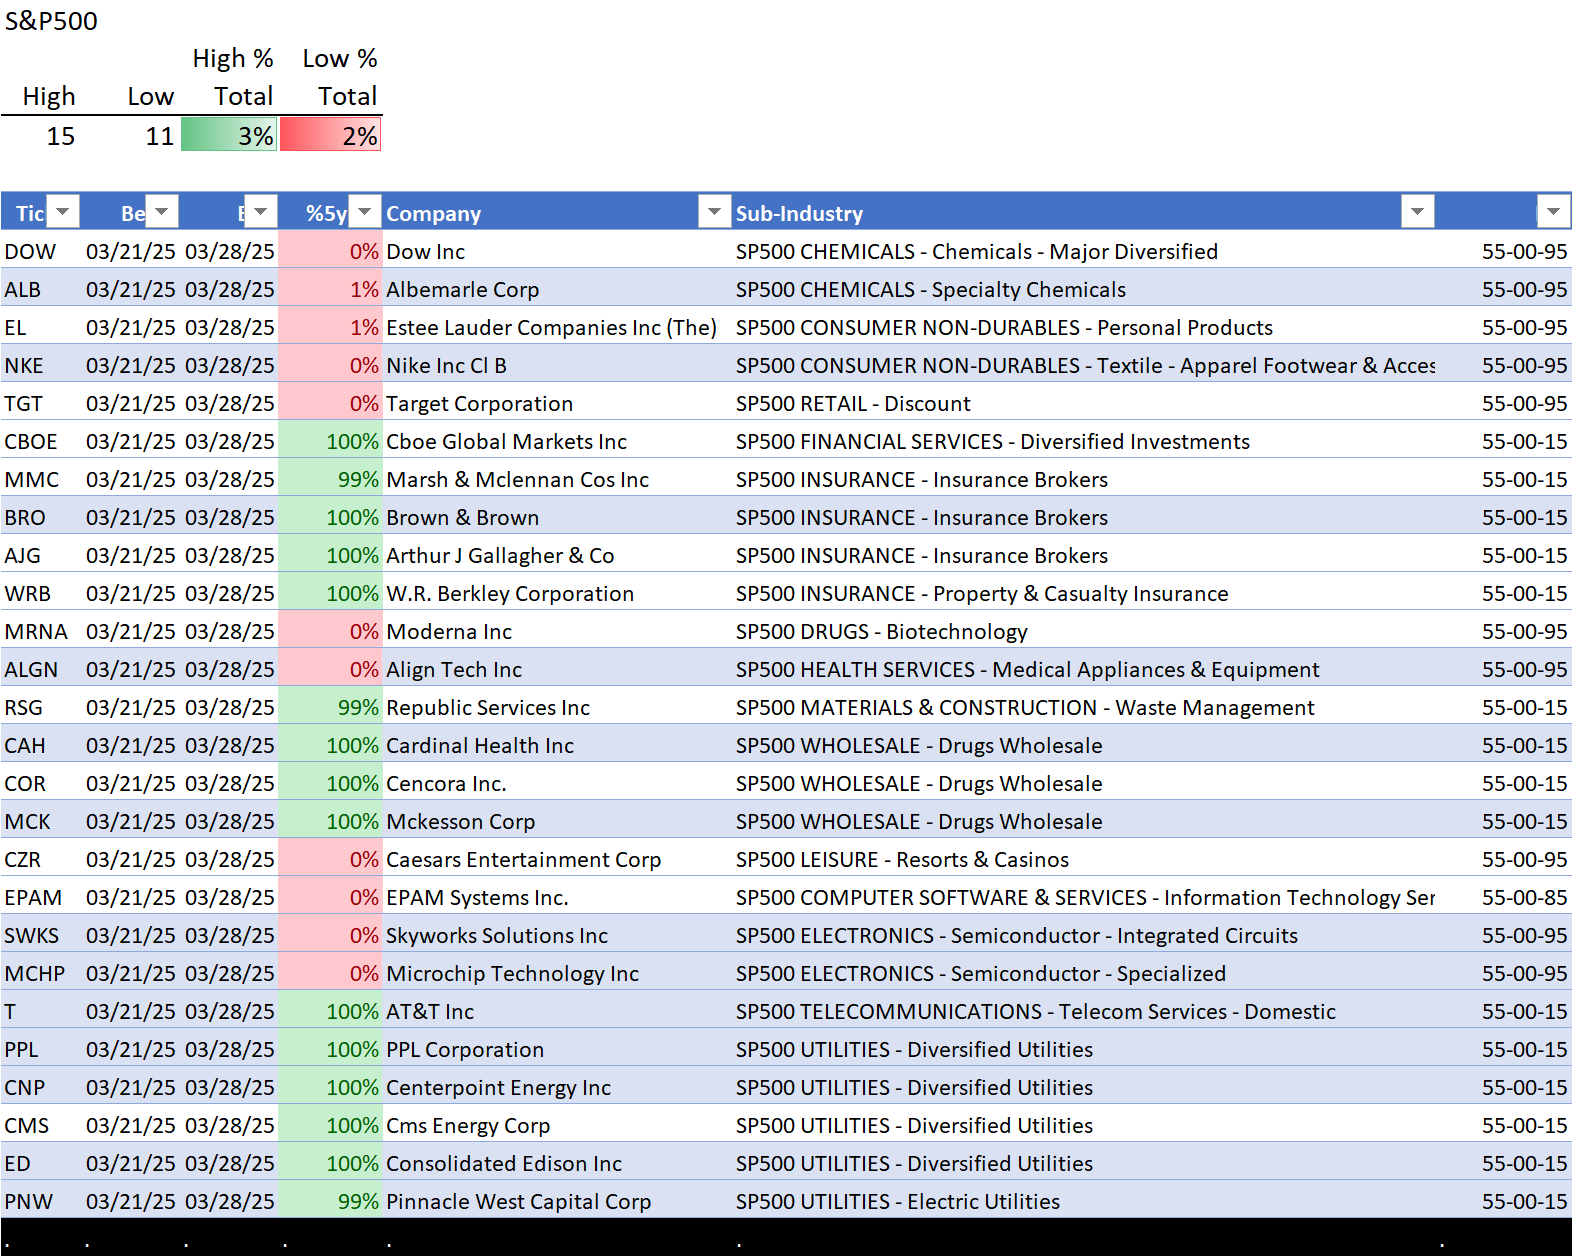
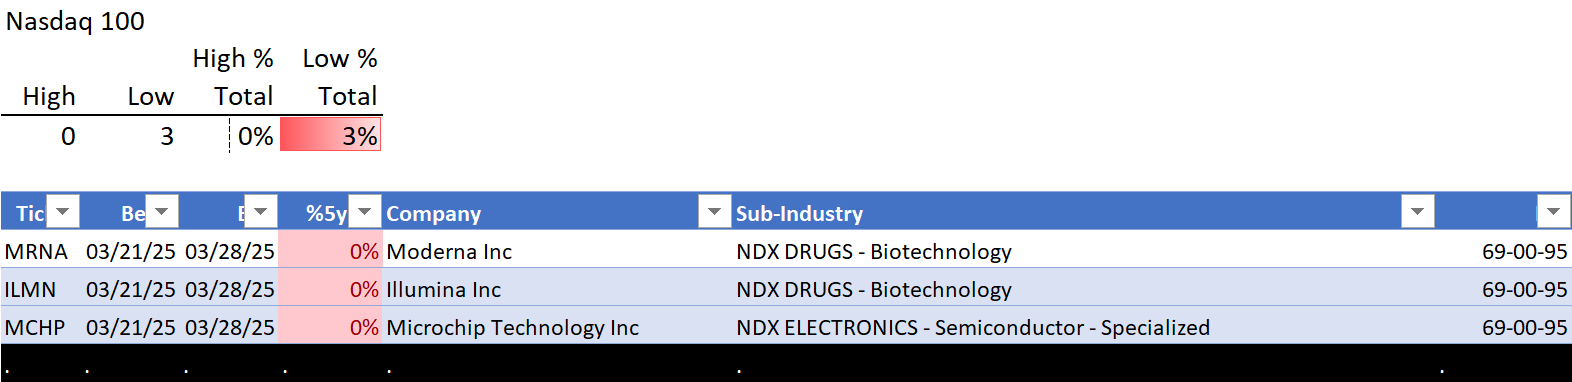
IV. Stocks at 5+ Year Highs and Lows
Last Friday's Indexes report is available here.
I. Background
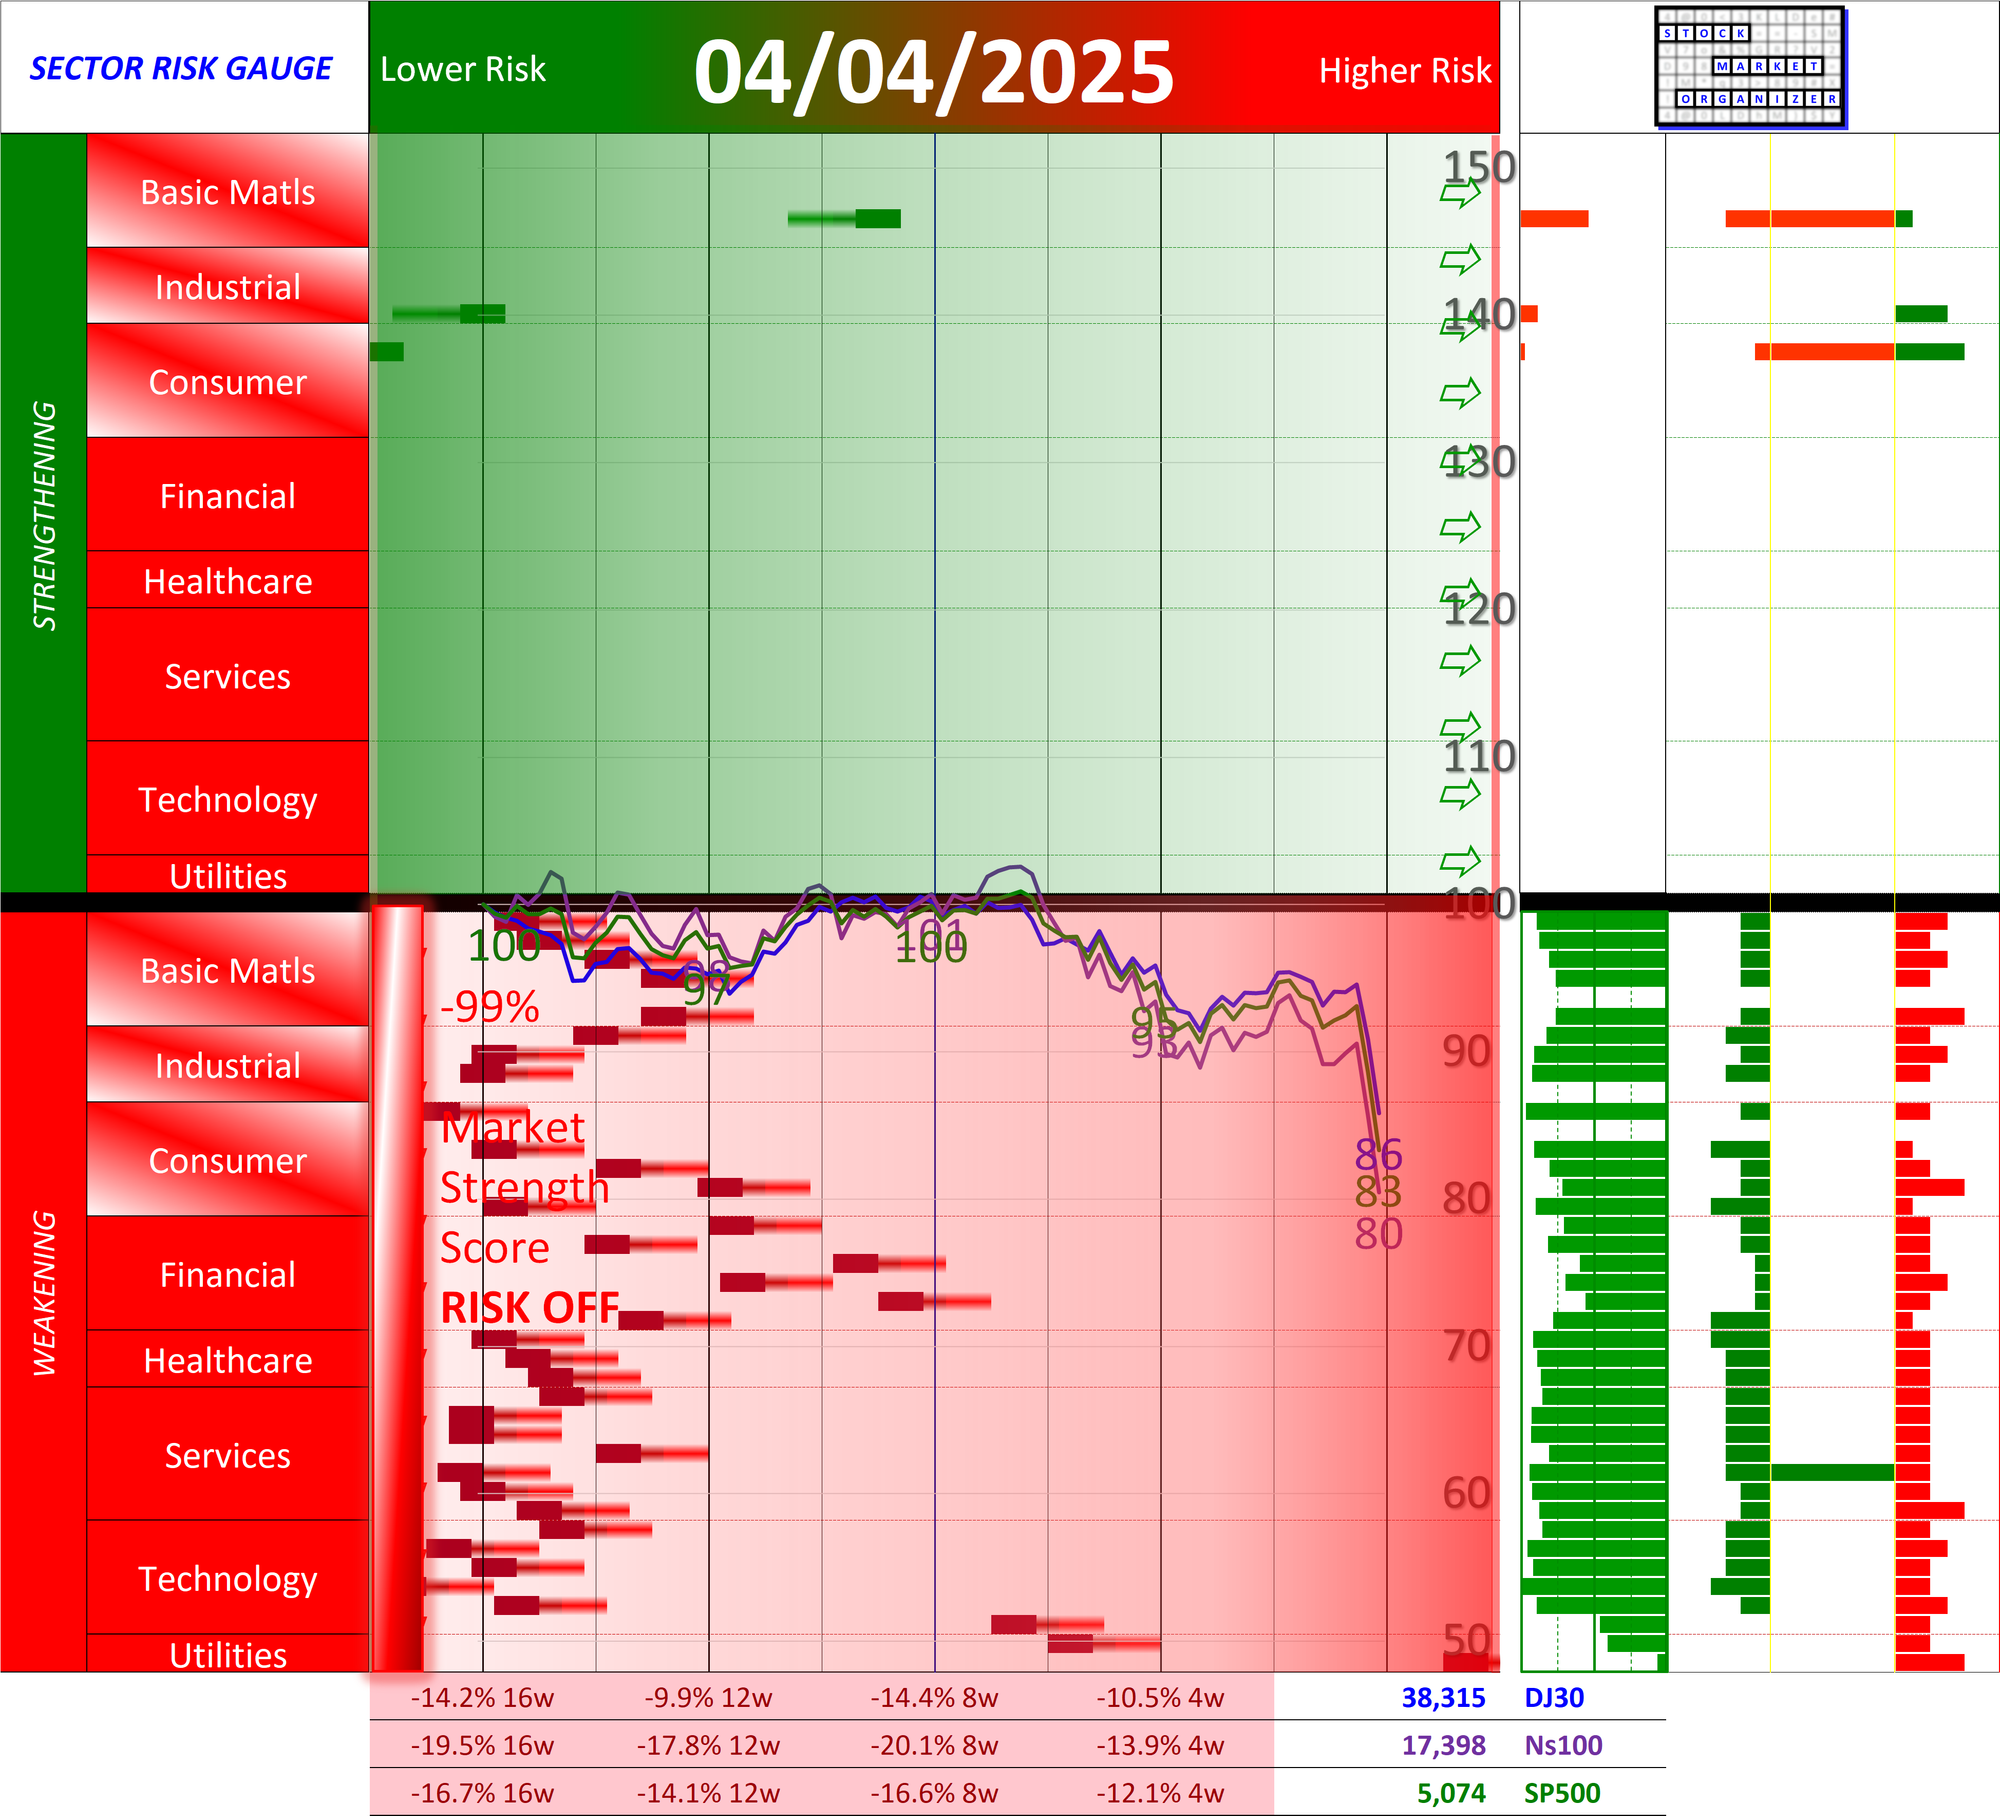
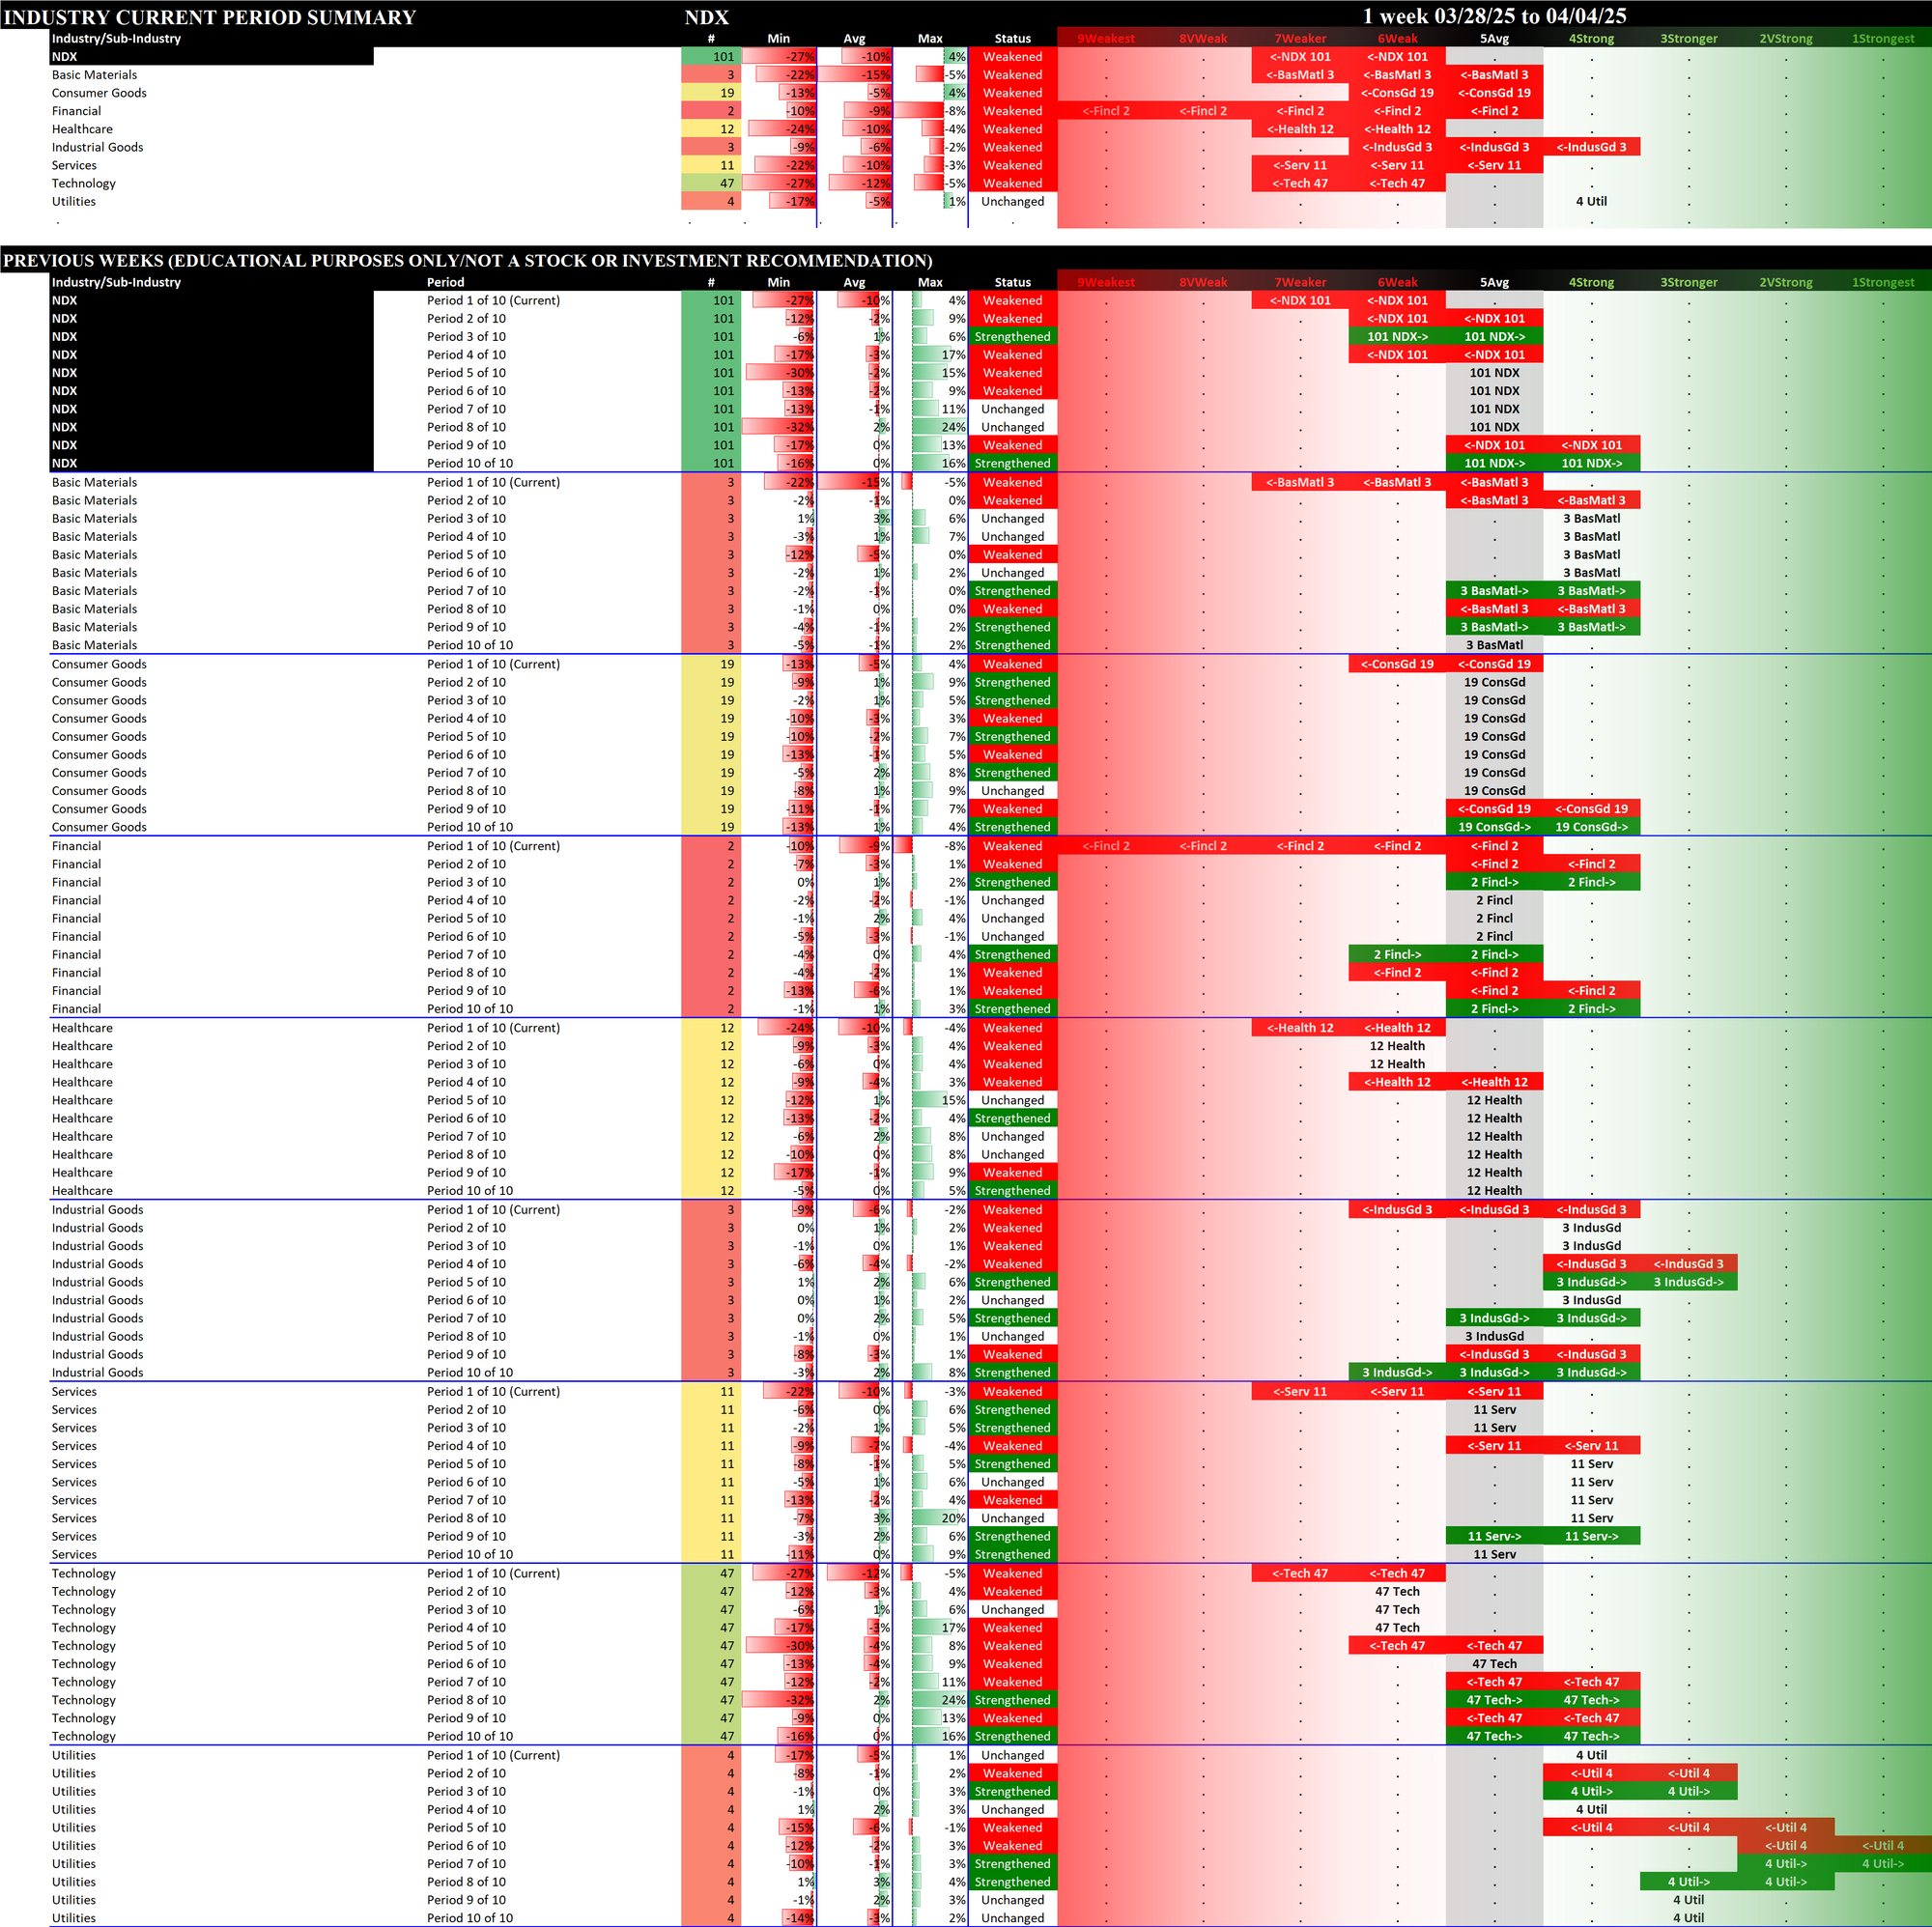
This analysis provides a Stock Market Organizer summary view of the S&P 500 and Nasdaq 100 for the week ended Friday, 04/04/25. This means this is a stock-by-stock strength analysis of the component stocks for each index, aggregated upward in level to the sector and index levels.
This purposely excludes the Dow Industrials. This analysis is more impactful the more the stocks analyzed. In turn, I pay minimal attention to the strength scores calculated for the NDX sectors, except for Technology which has 47 stocks.
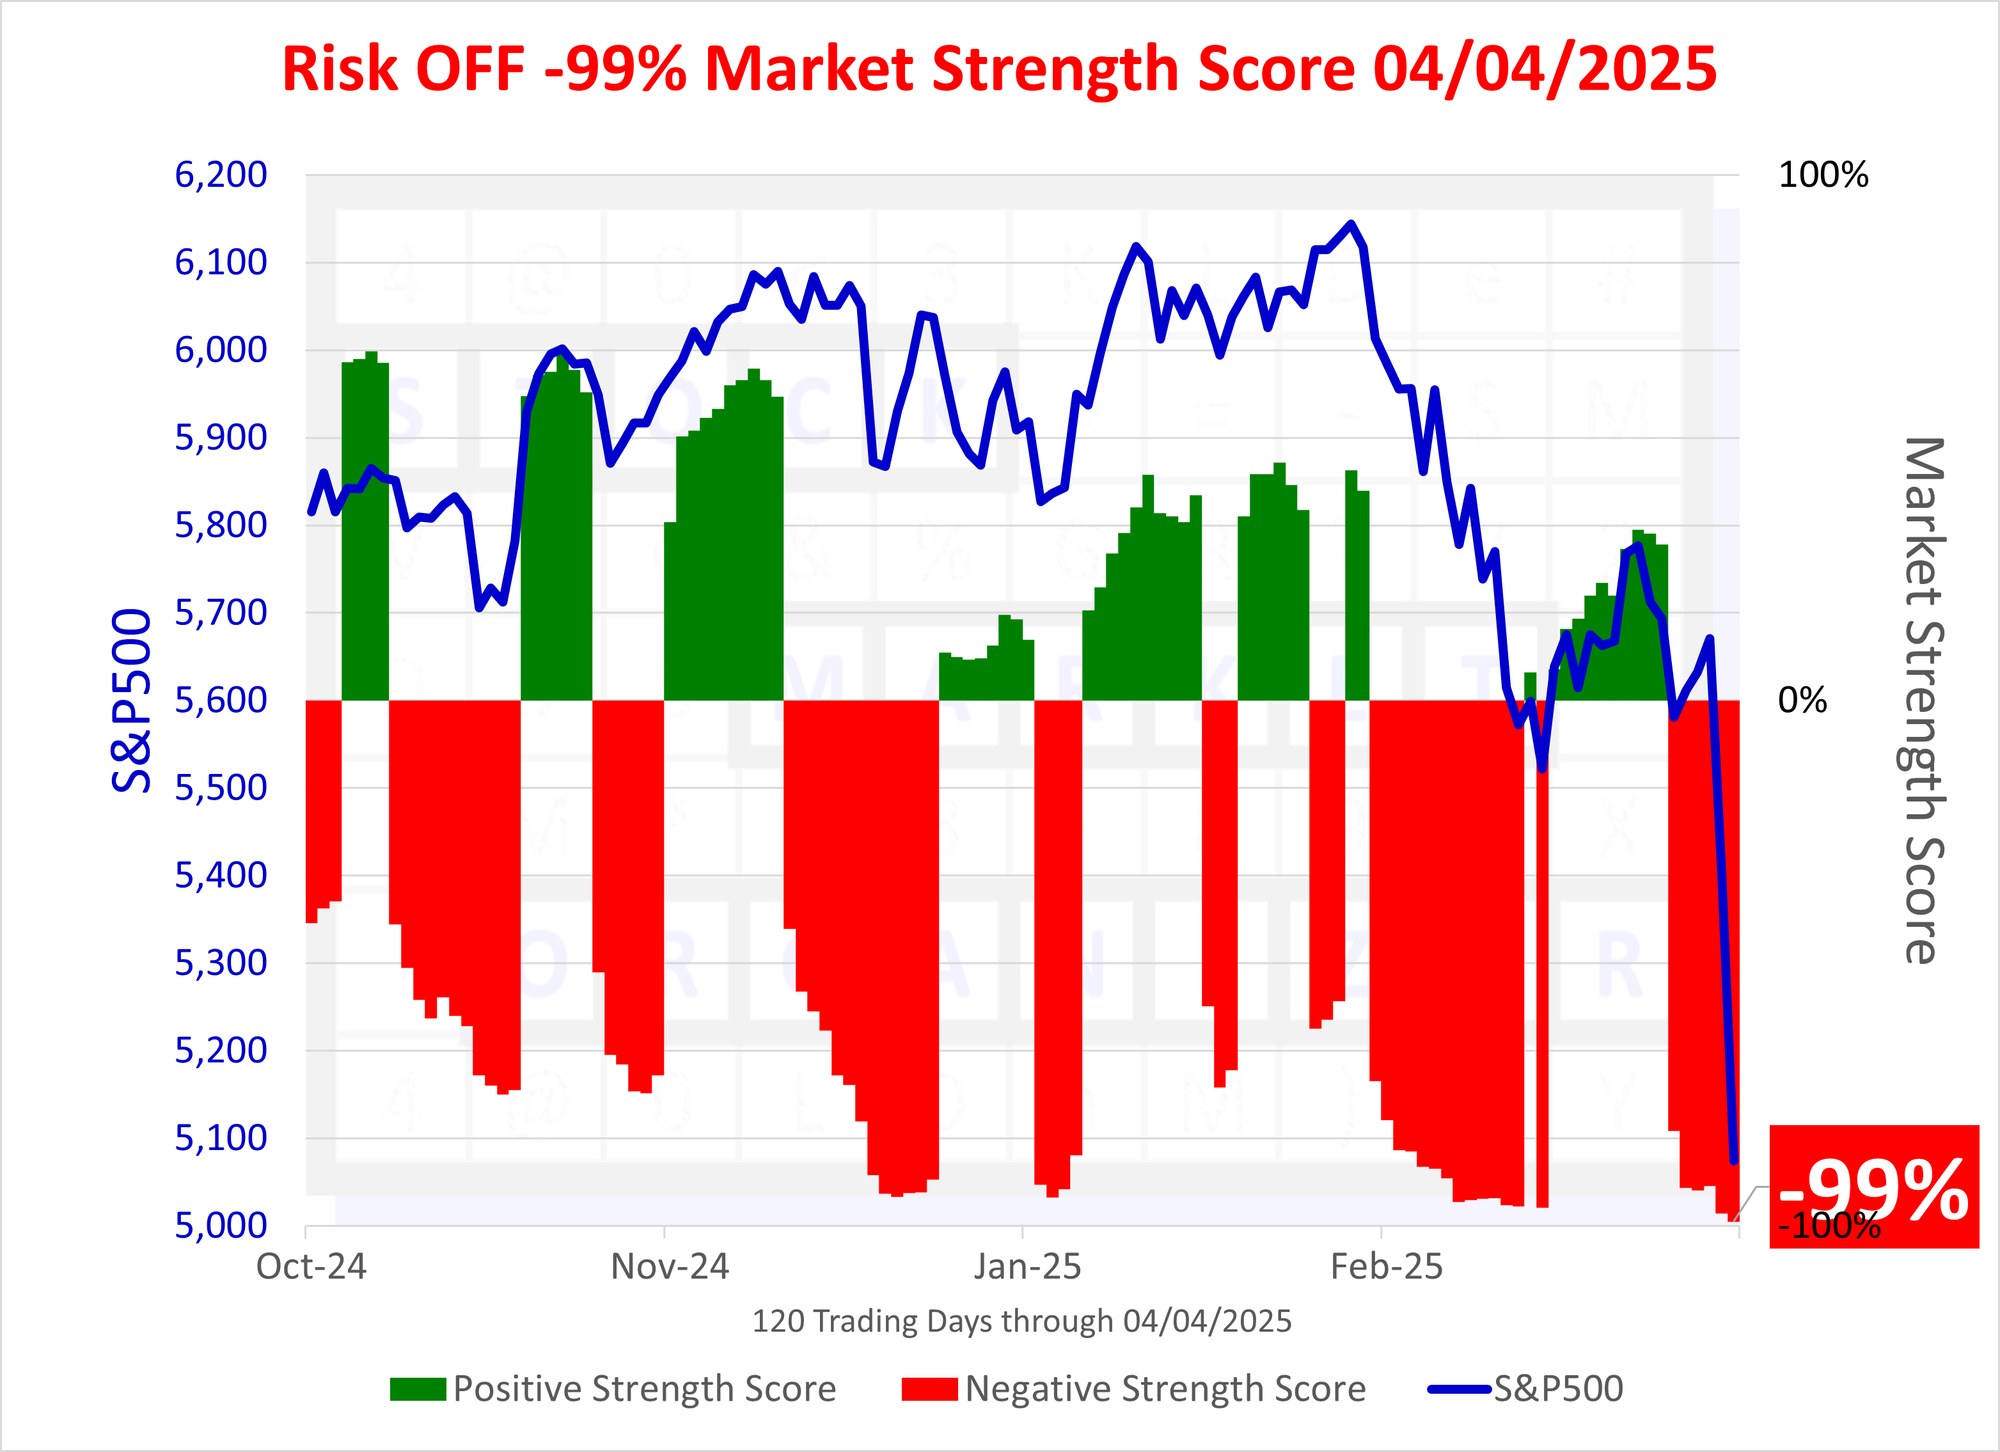
Today's Market Strength Score and Sector Risk Gauge reflect an extreme -99% reading, just below the lowest possible -100% score:
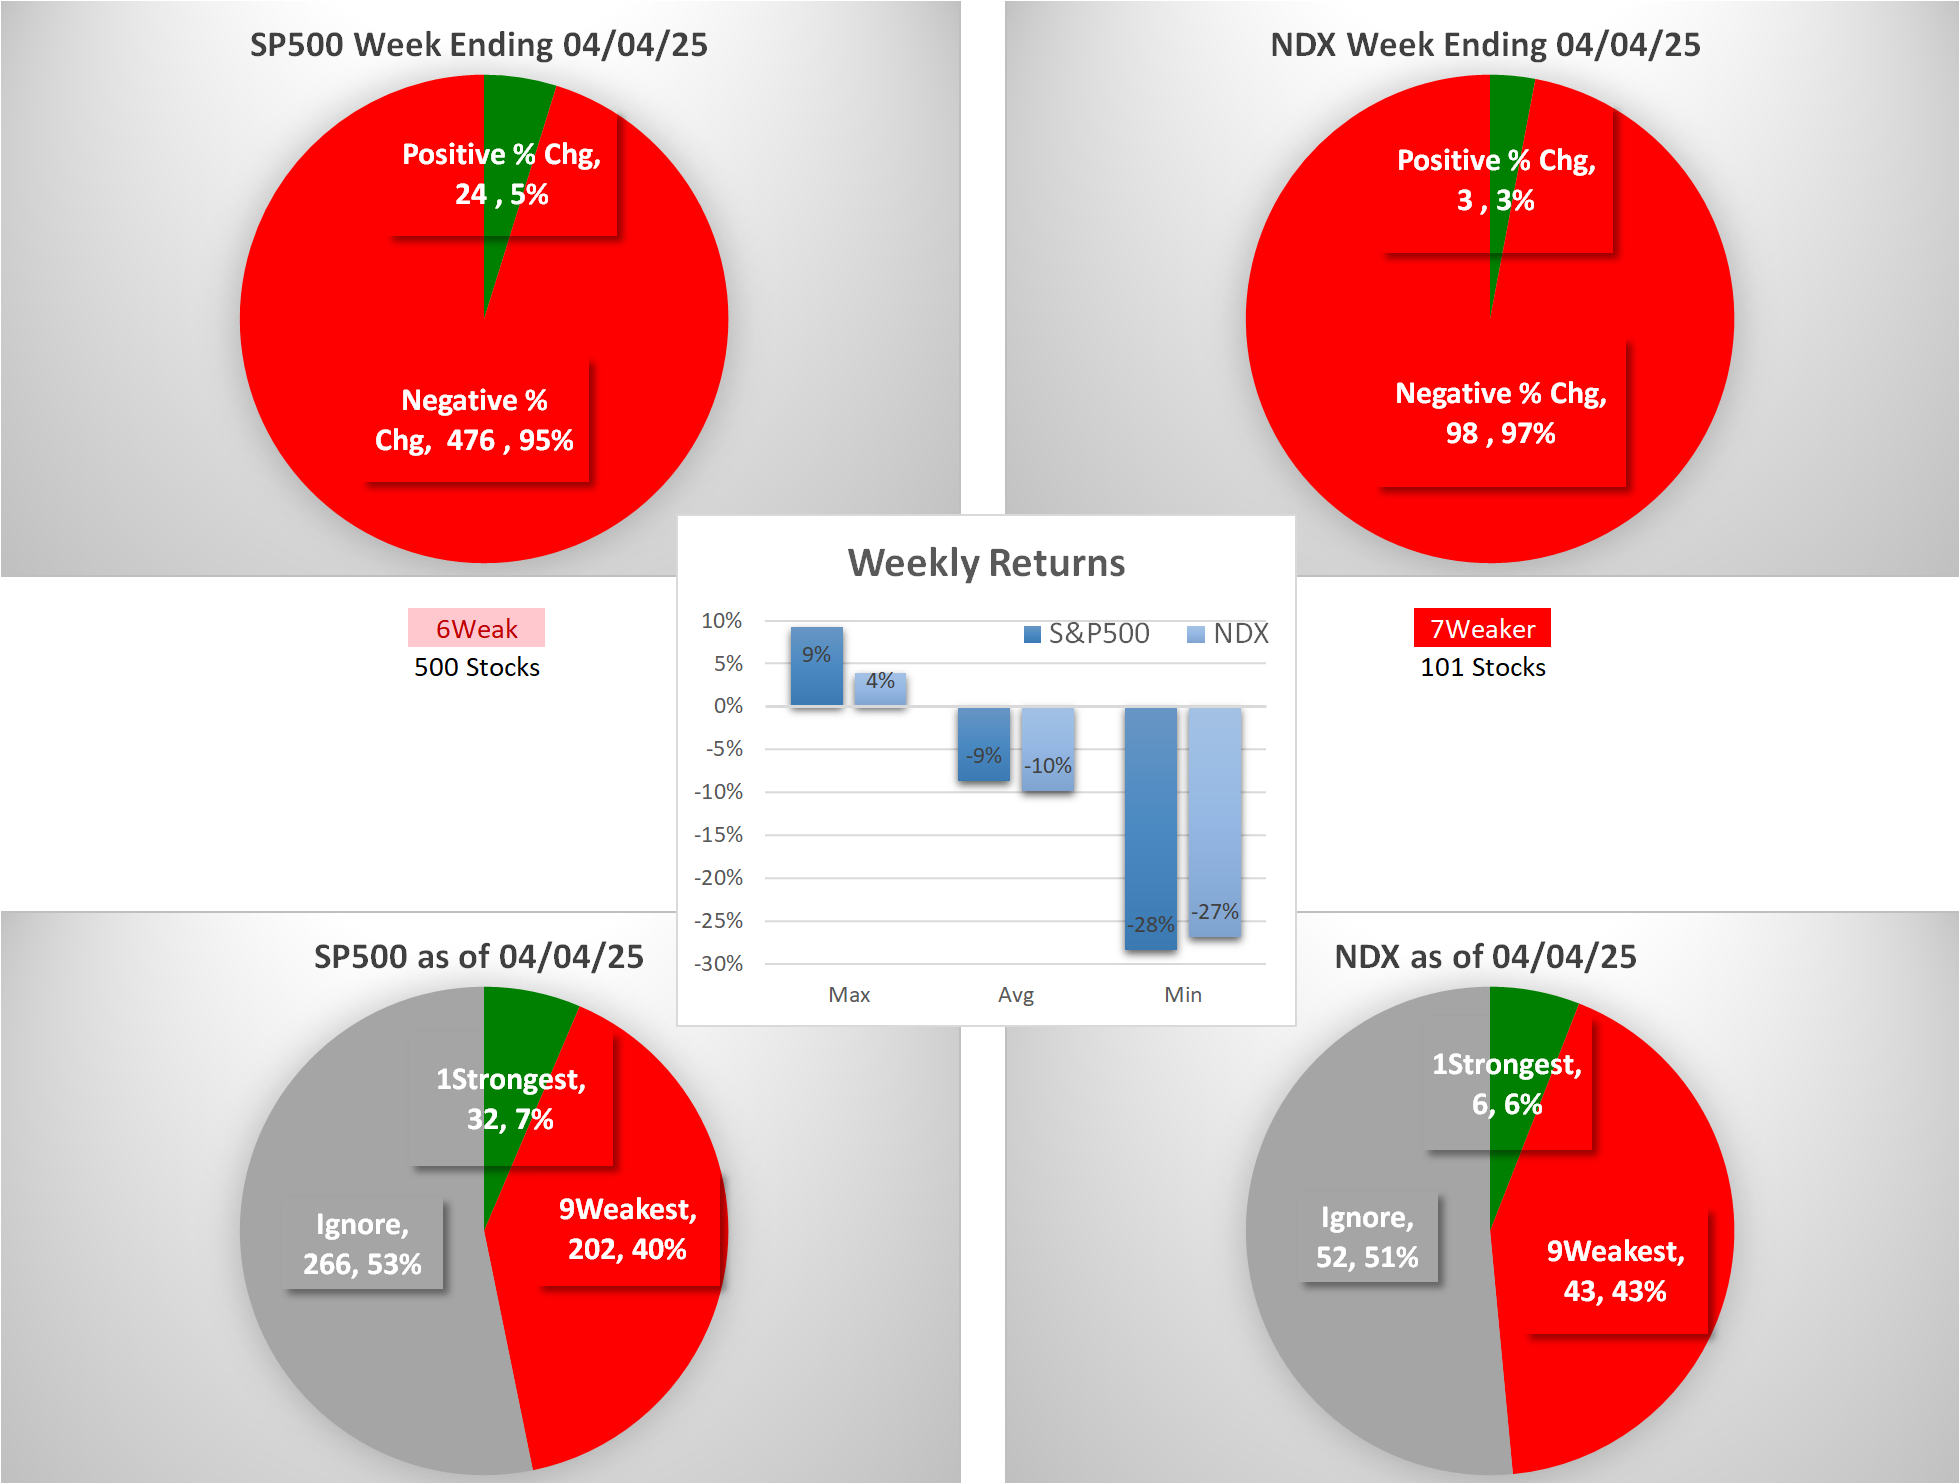
II. What Do The Pies Say?
The following shows the comparison between the two indexes and their prior performance of the following:
- Positive:Negative Stocks
- Stocks rated 1Strongest vs. 9Weakest vs. Other (all ratings from 2Very Strong through 8Very Weak)
All stocks in each index rated 1Strongest or 9Weakest are listed in the section below named "Indexes - Component Sectors, 1Strongest / 9Weakest Stocks" which provides detail for each index.
Current Week Pies - Week Ending 04/04/25
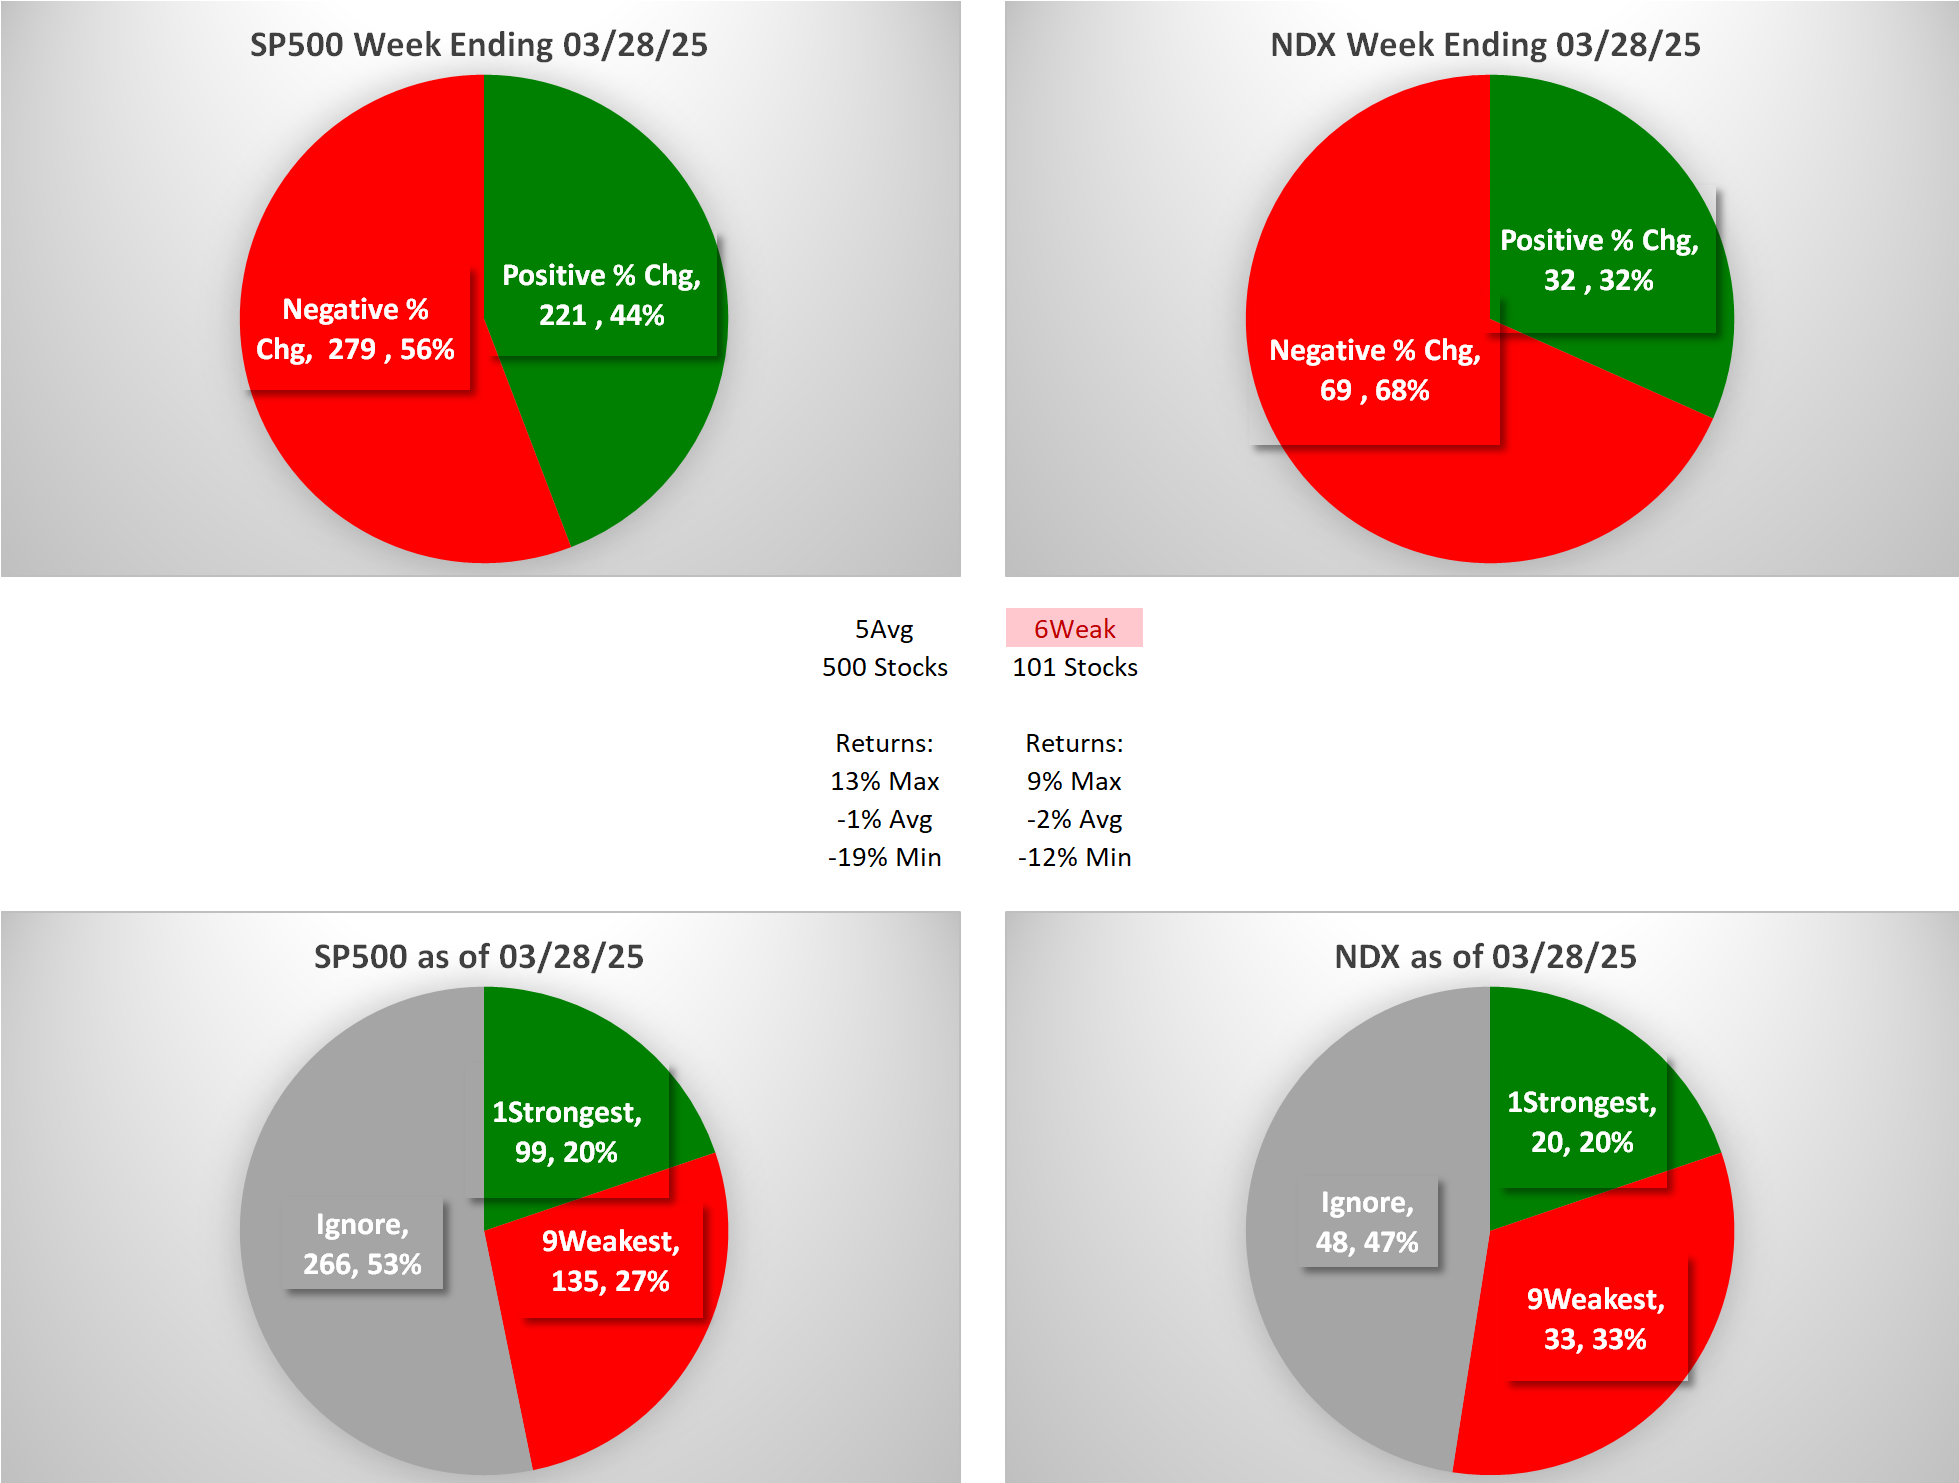
Previous Week Pies - Week Ending 03/28/25
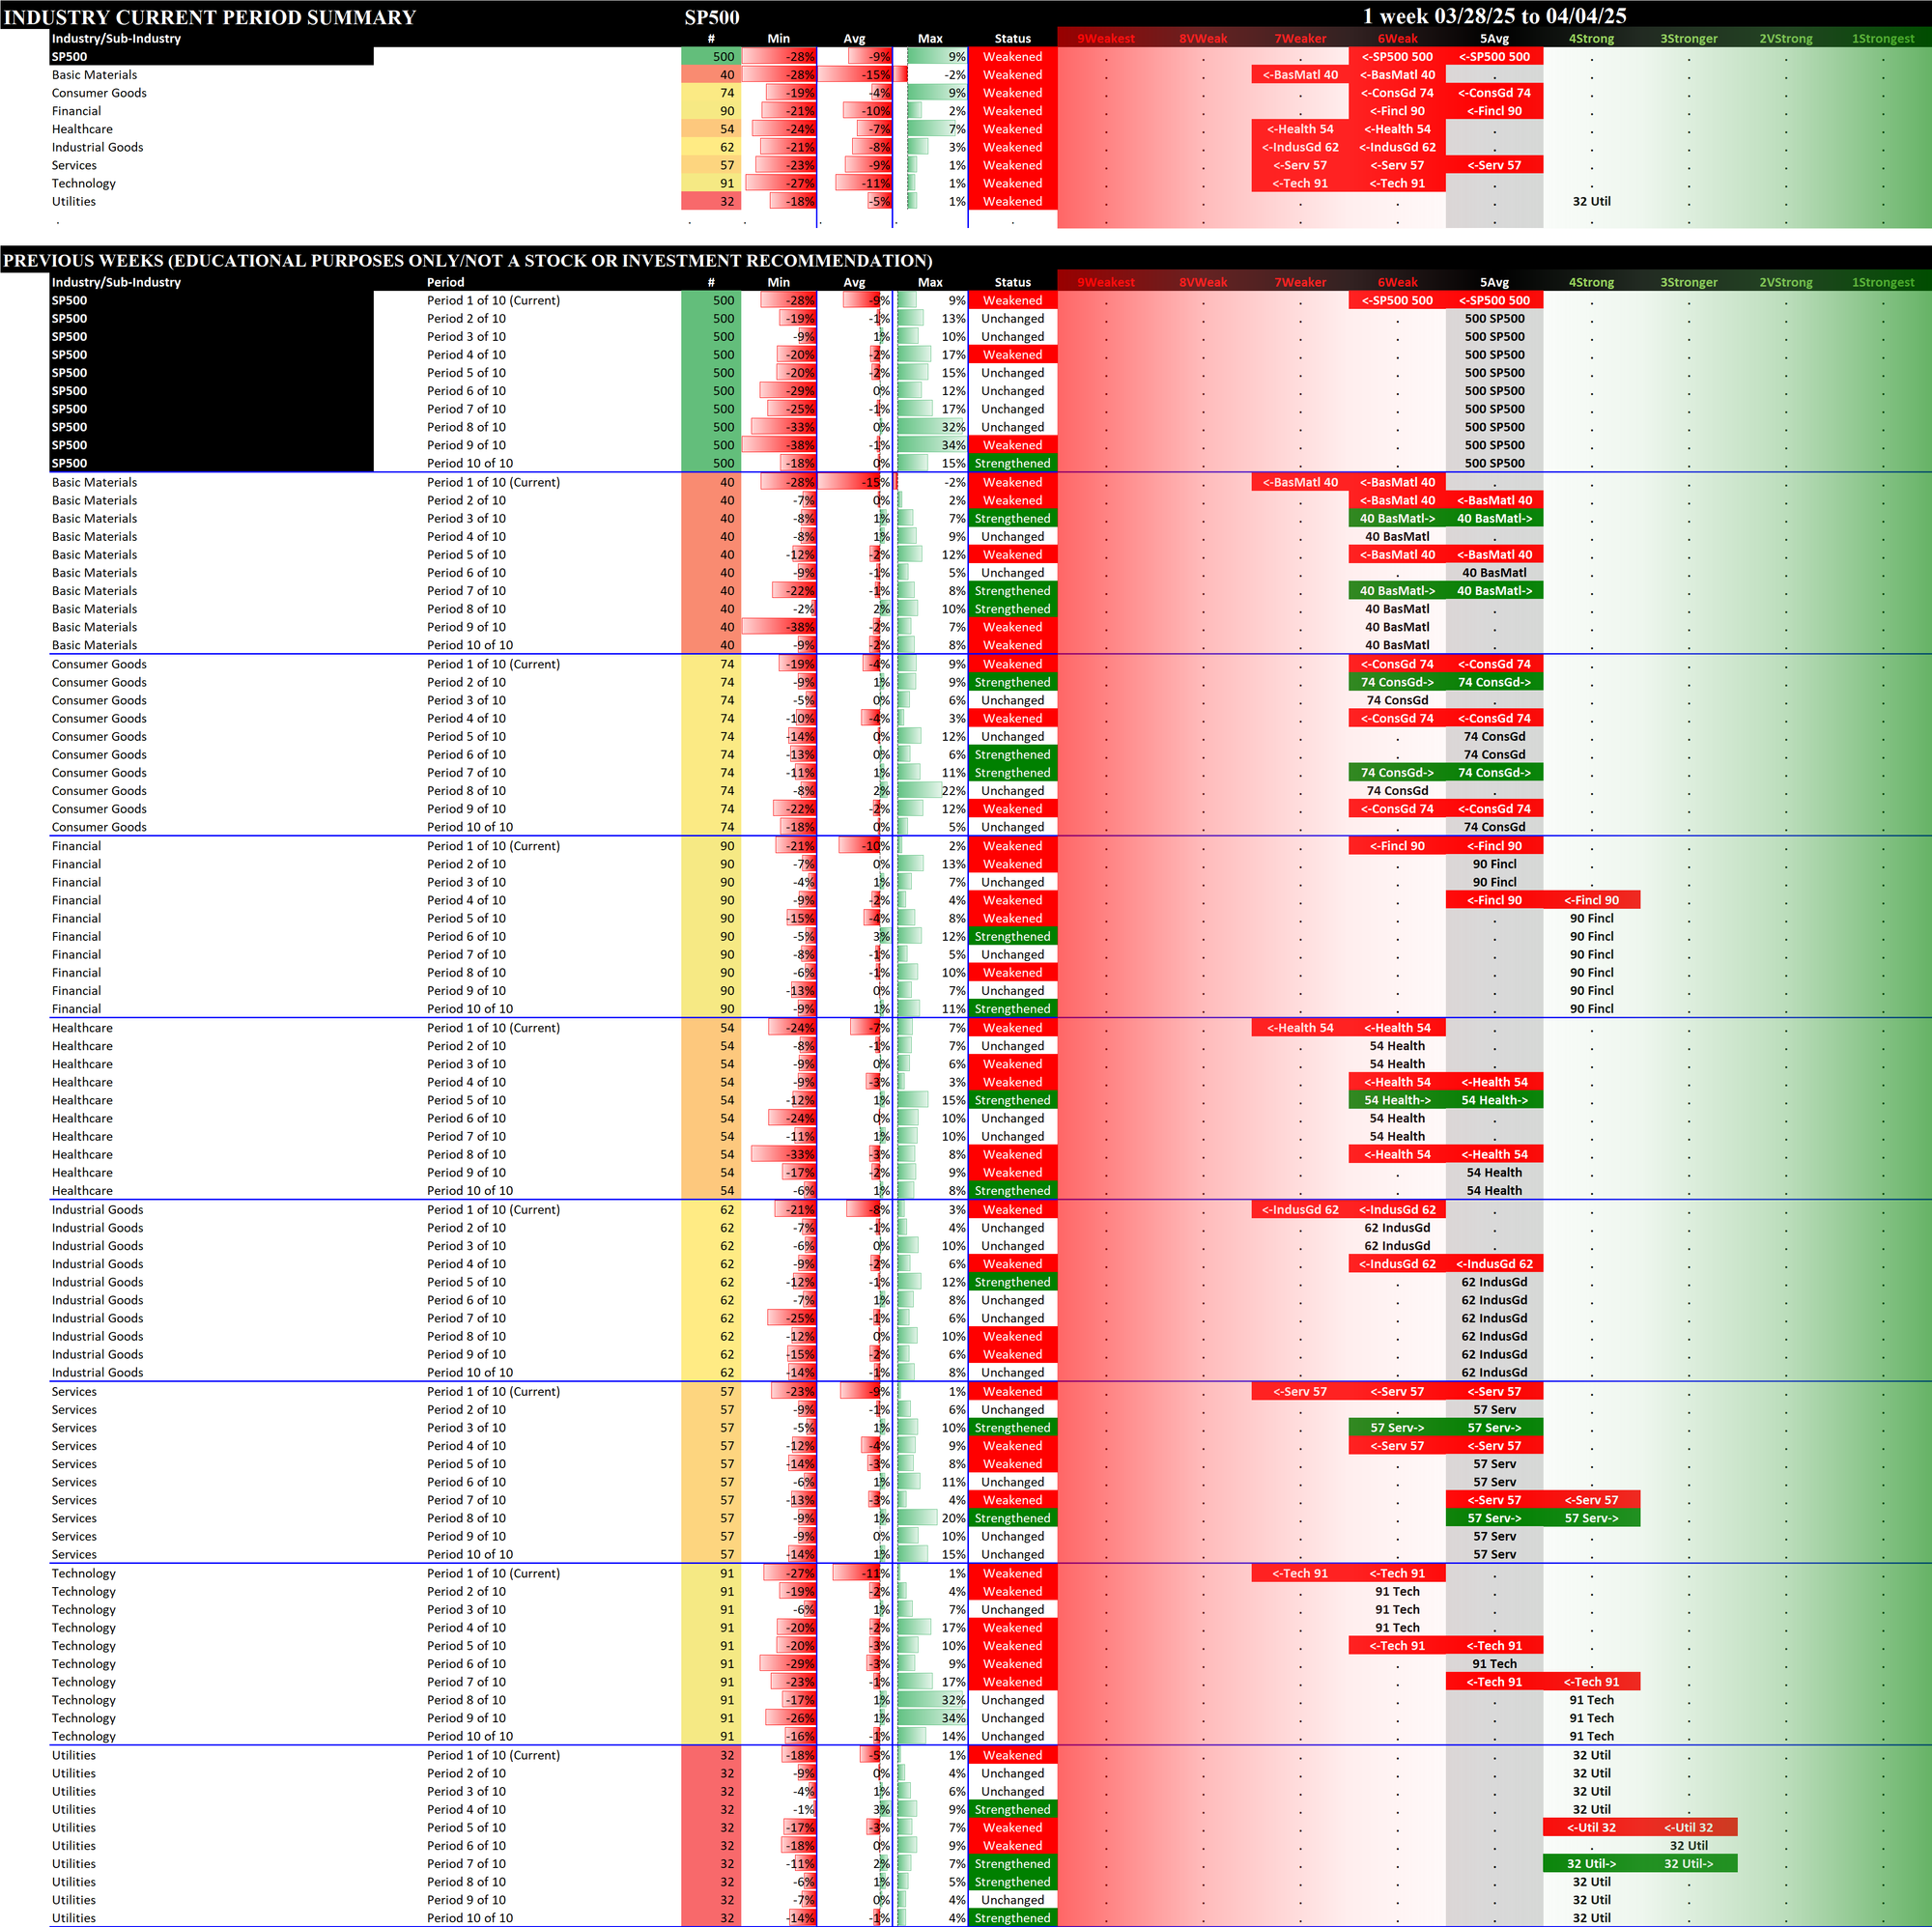
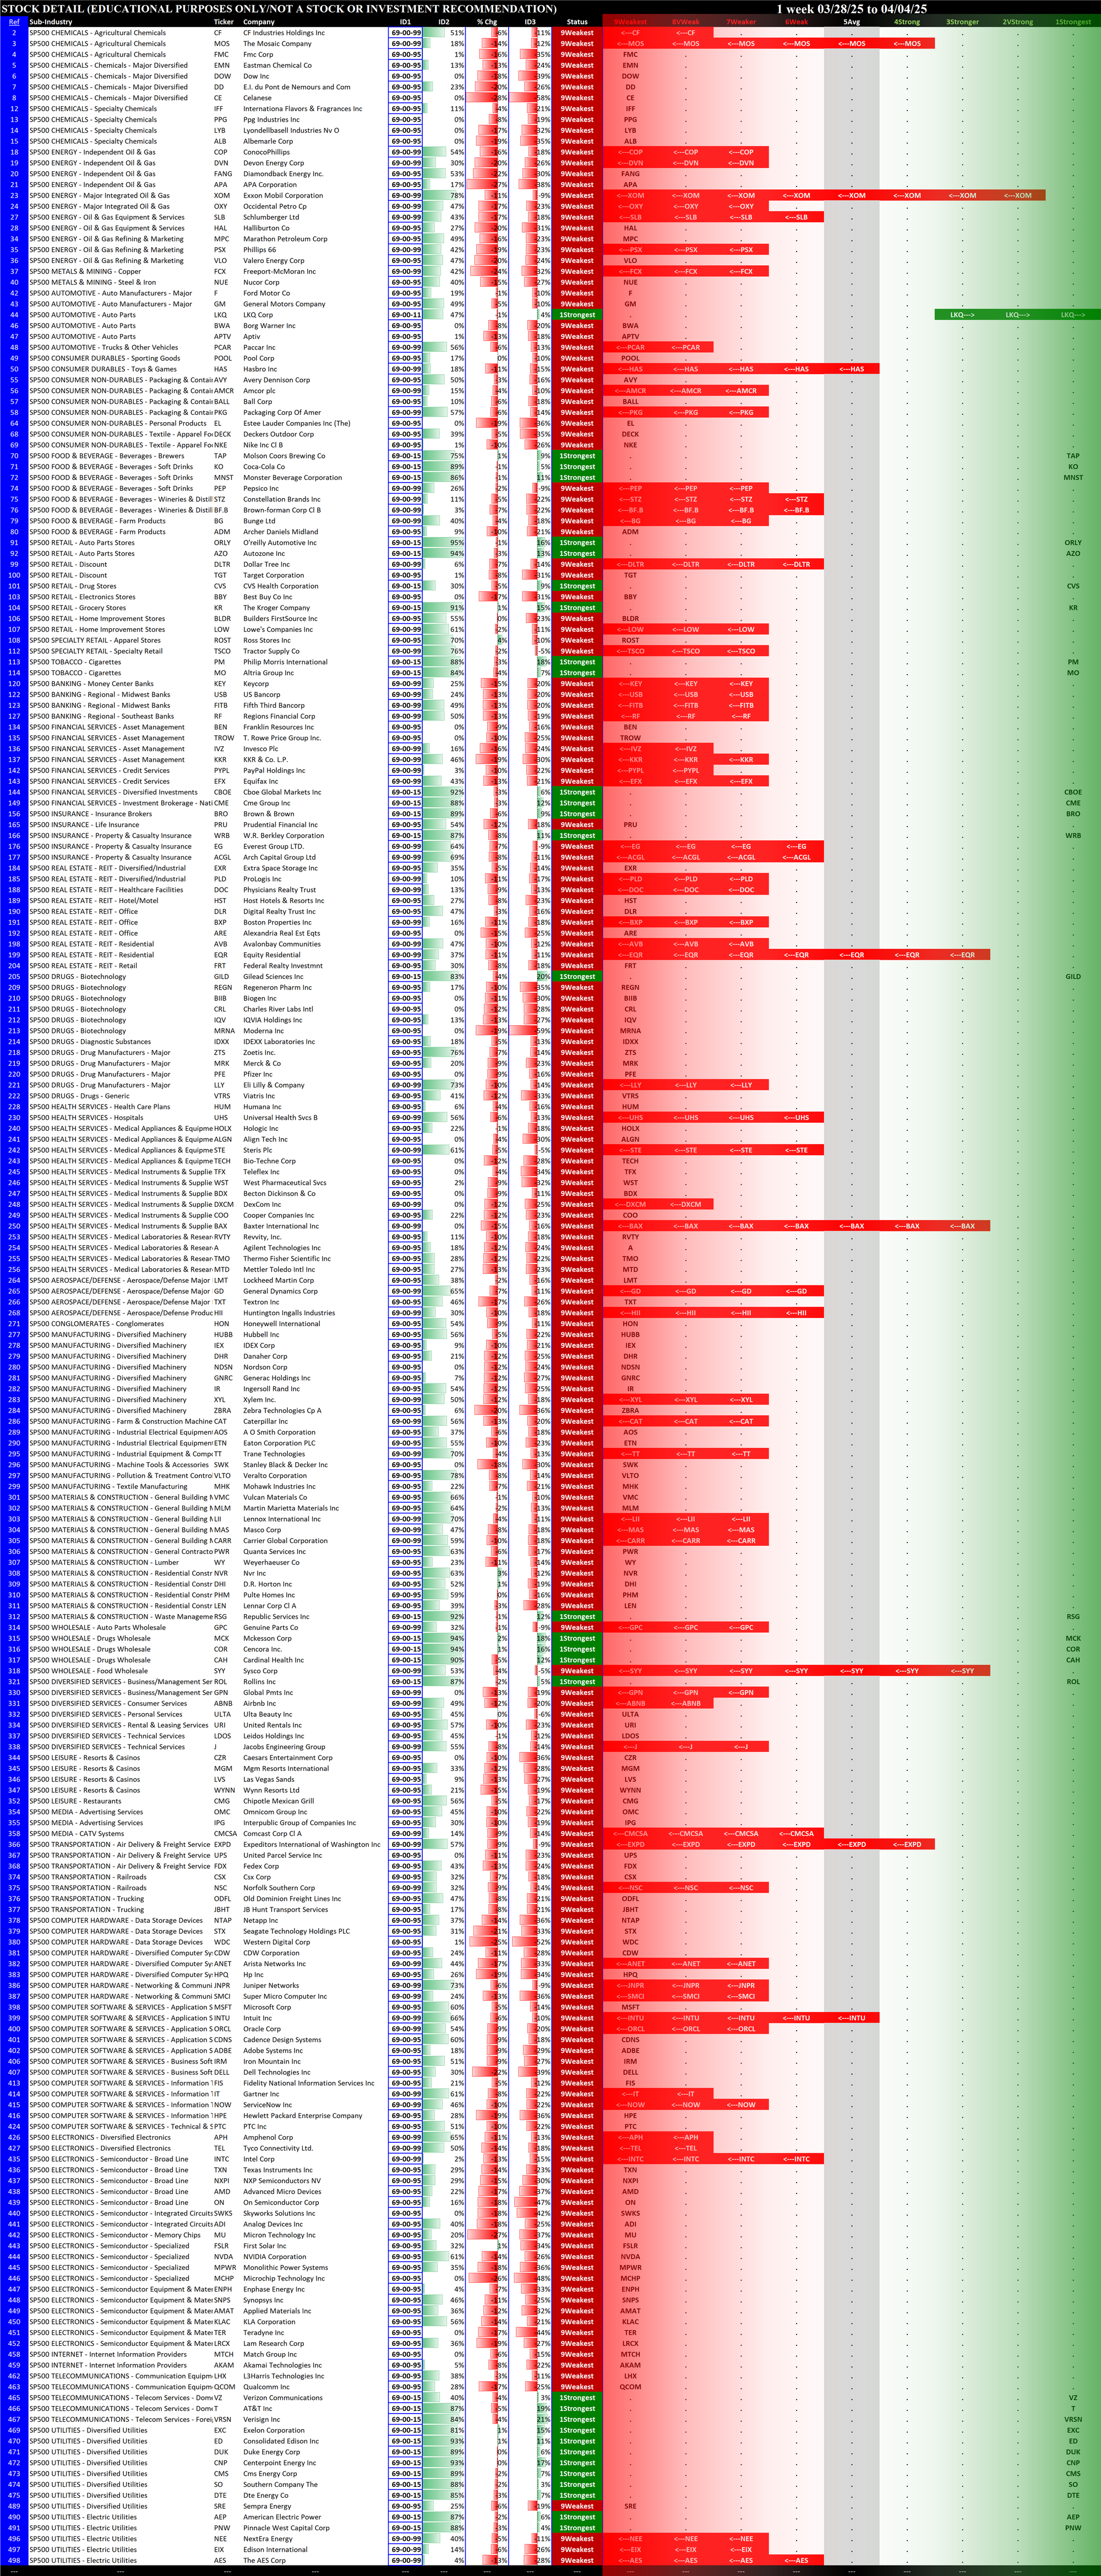
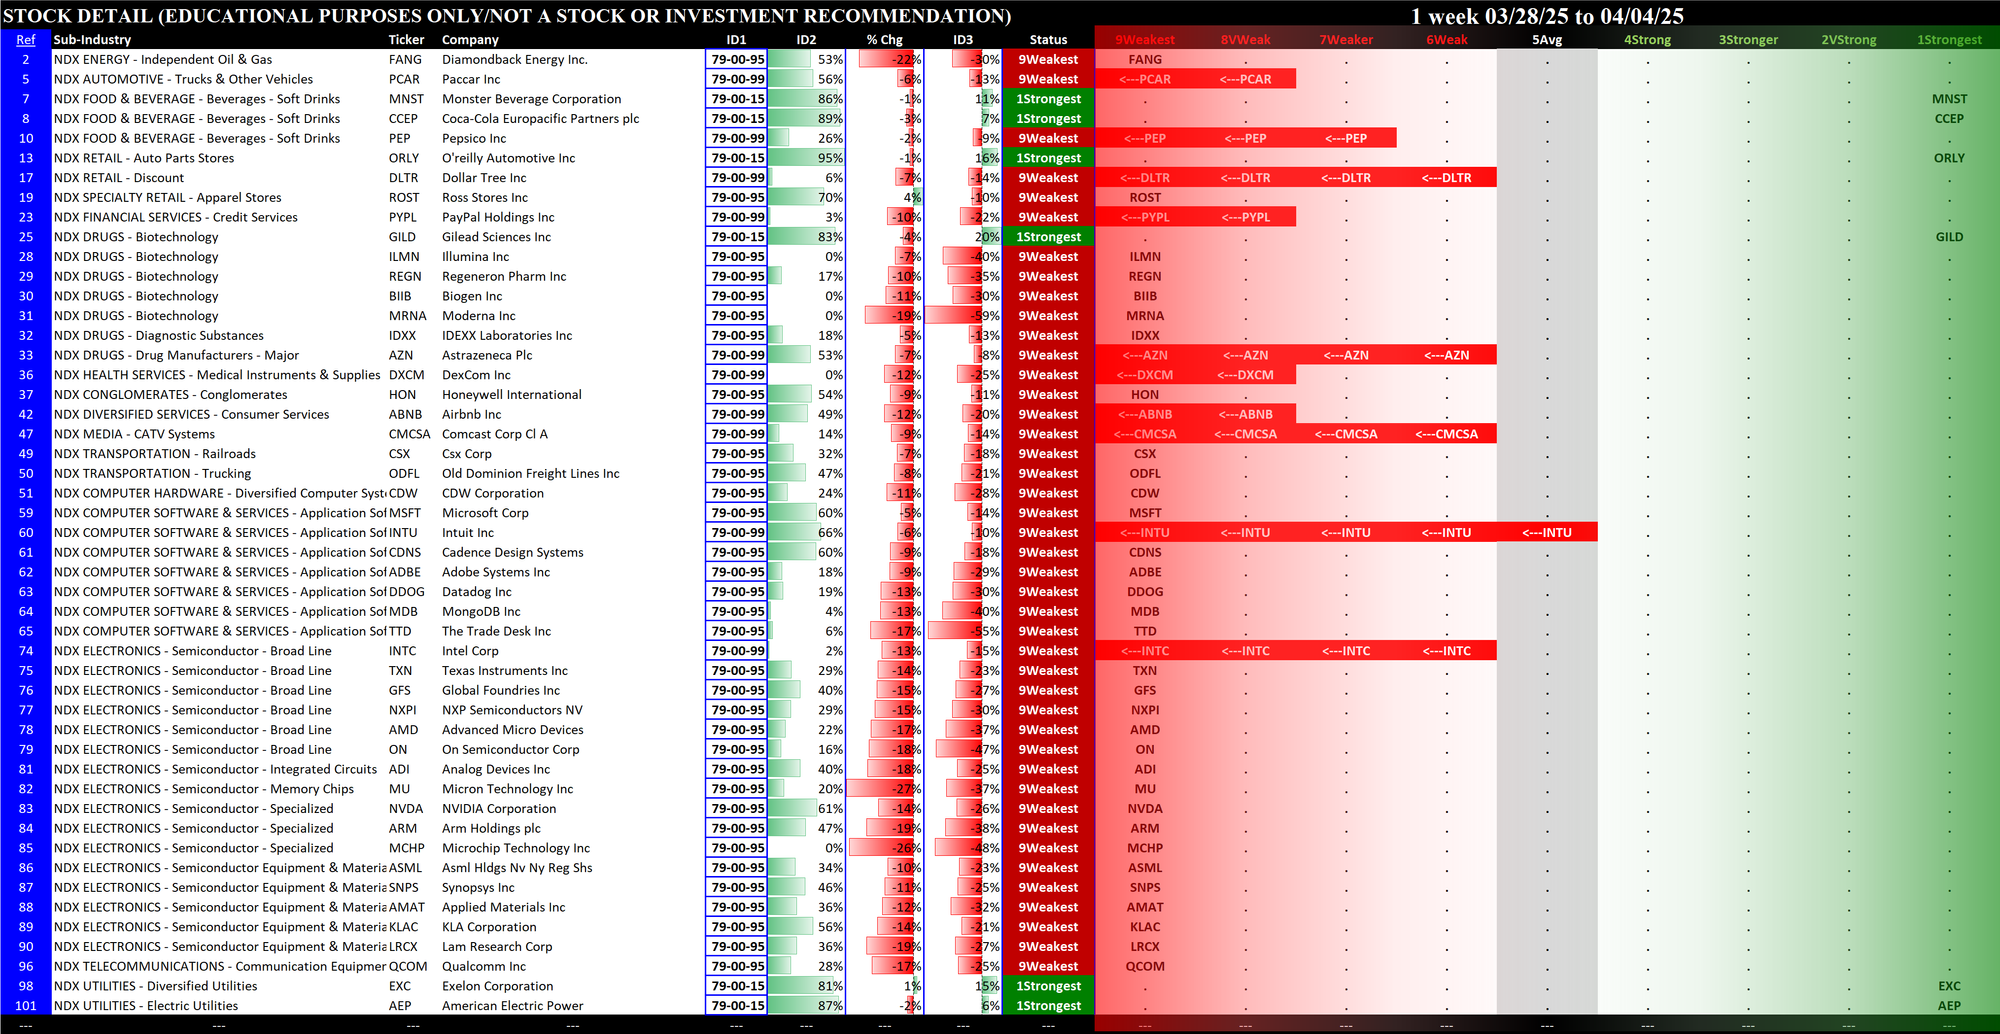
III. Indexes - Component Sectors, 1Strongest / 9Weakest Stocks
S&P 500 - Week Ending 04/04/25
Nasdaq 100 - Week Ending 04/04/25
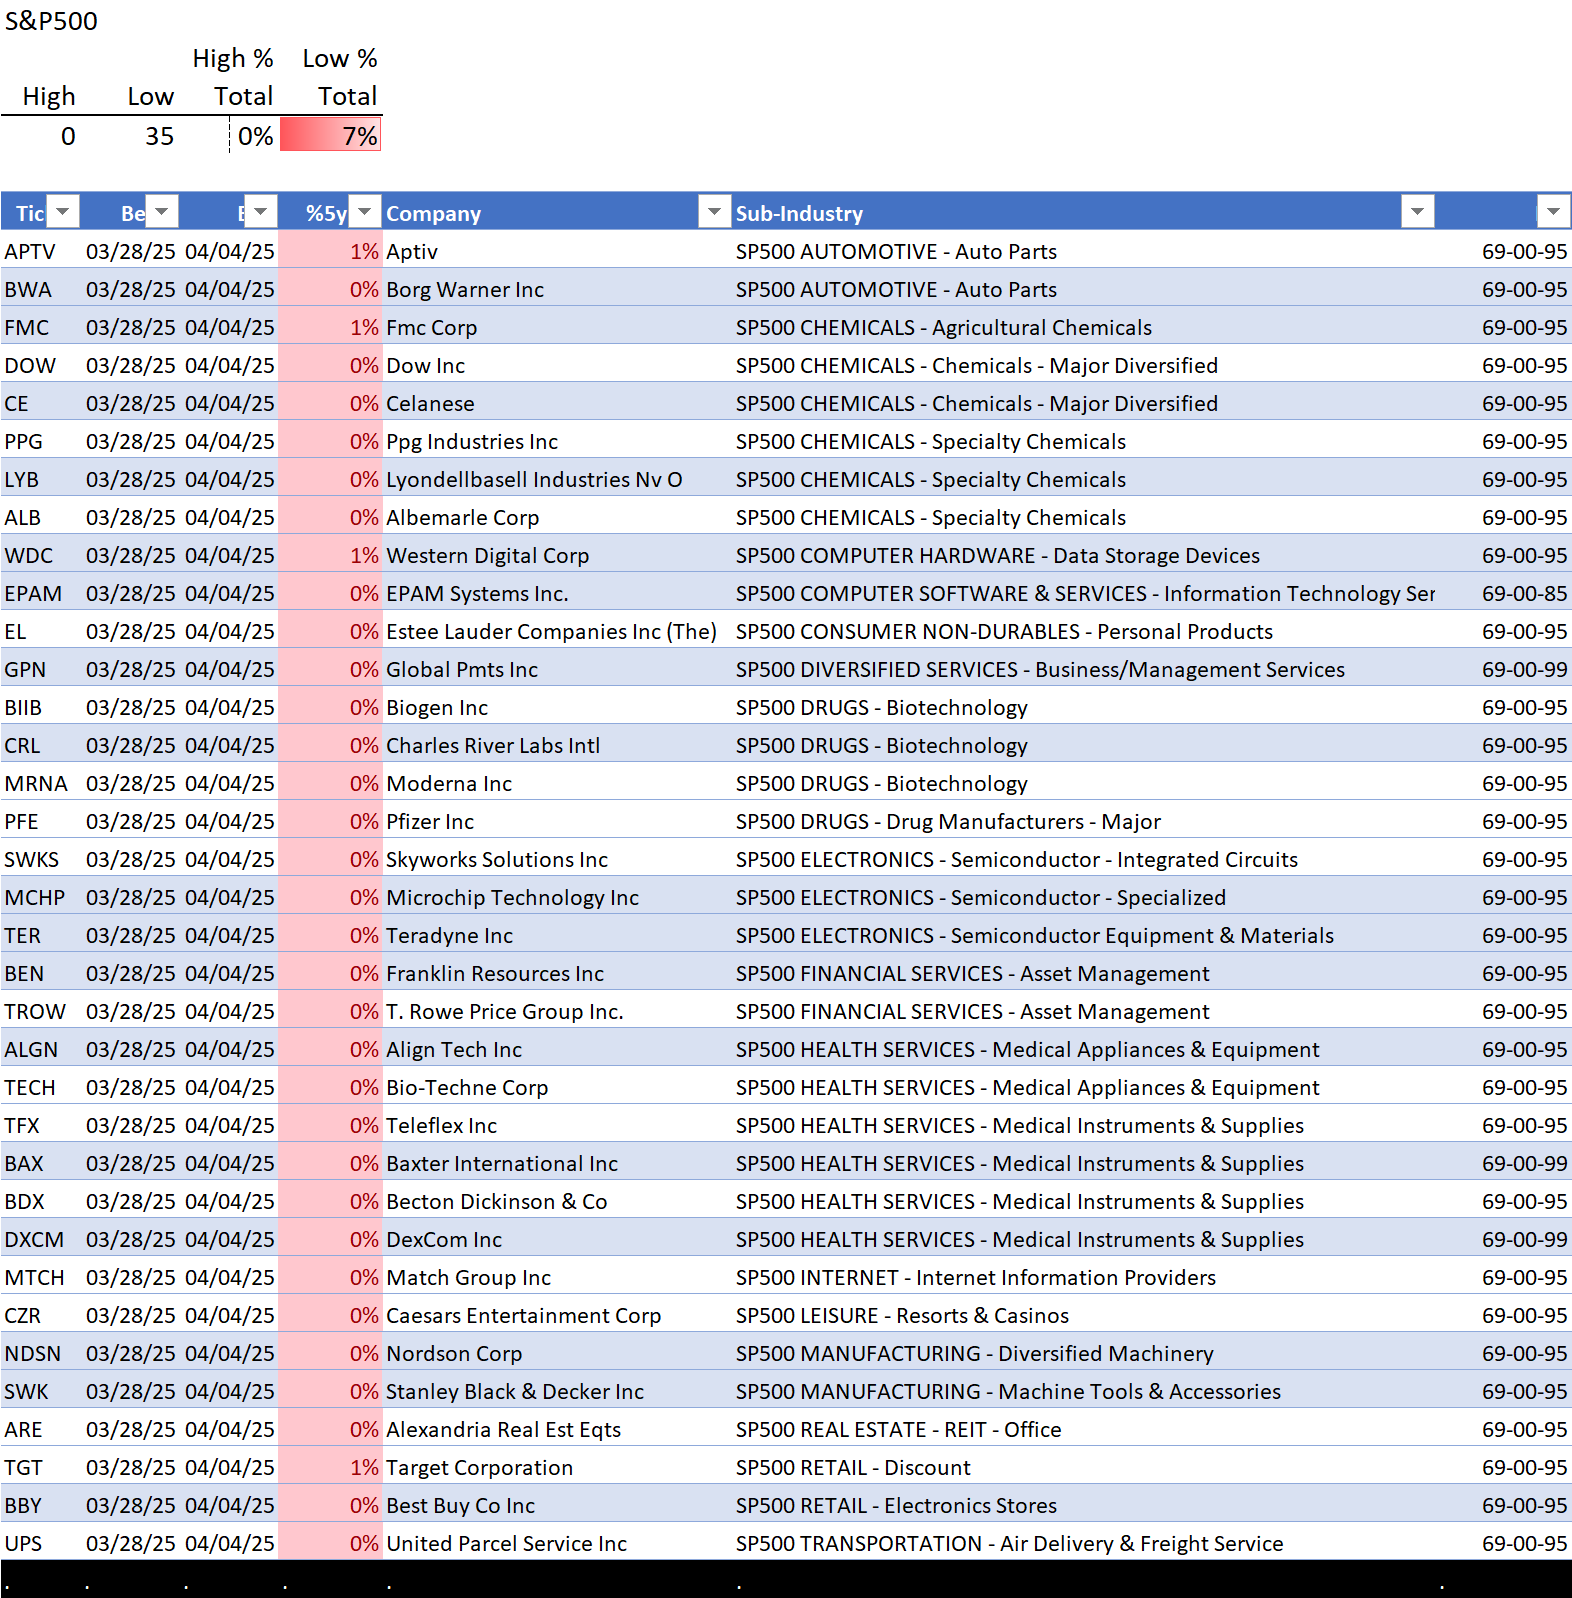
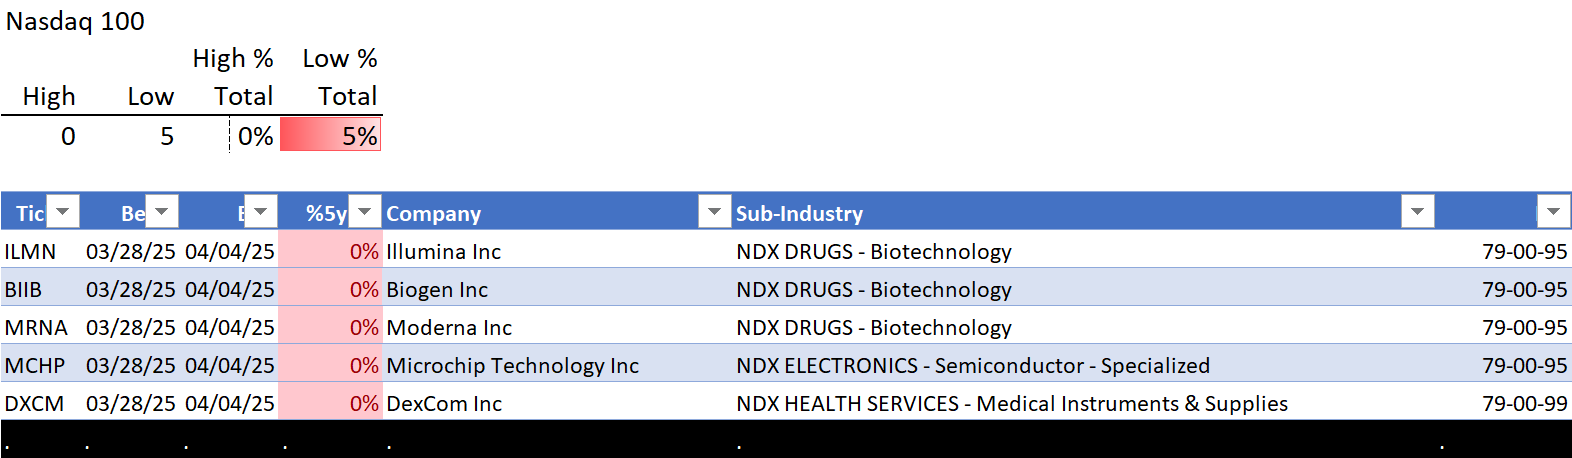
IV. Stocks at 5+ Year Highs and Lows
The following section provides details regarding multi-year highs and lows for the two indexes.
For the week ending Friday, April 4, 2025 there were 0 multi-year highs and 35 multi-year lows for the S&P500. The Nasdaq 100 had a ratio of 0:5.
Friday, March 28, 2025 there were 15 multi-year highs and 11 multi-year lows for the S&P500. The Nasdaq 100 had a ratio of 0:3.
Current Week - Week Ending 04/04/25
Previous Week - Week Ending 03/28/25