Health Services 2023-09-18: Unchanged at WEAK strength rating (6th strongest of 9 levels), previous move was DOWN
SUMMARY
Performance
Bottom Line: weakened 2 strength levels over the past 7 weeks
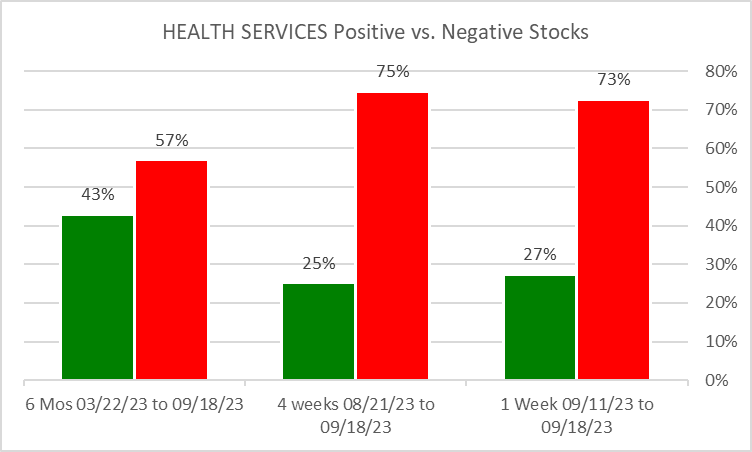
Context: 1 week positive/negative stocks ratio is WEAKER than 6 Months and STRONGER than 4 weeks. Very high proportion of negative stocks.
Other Notes:
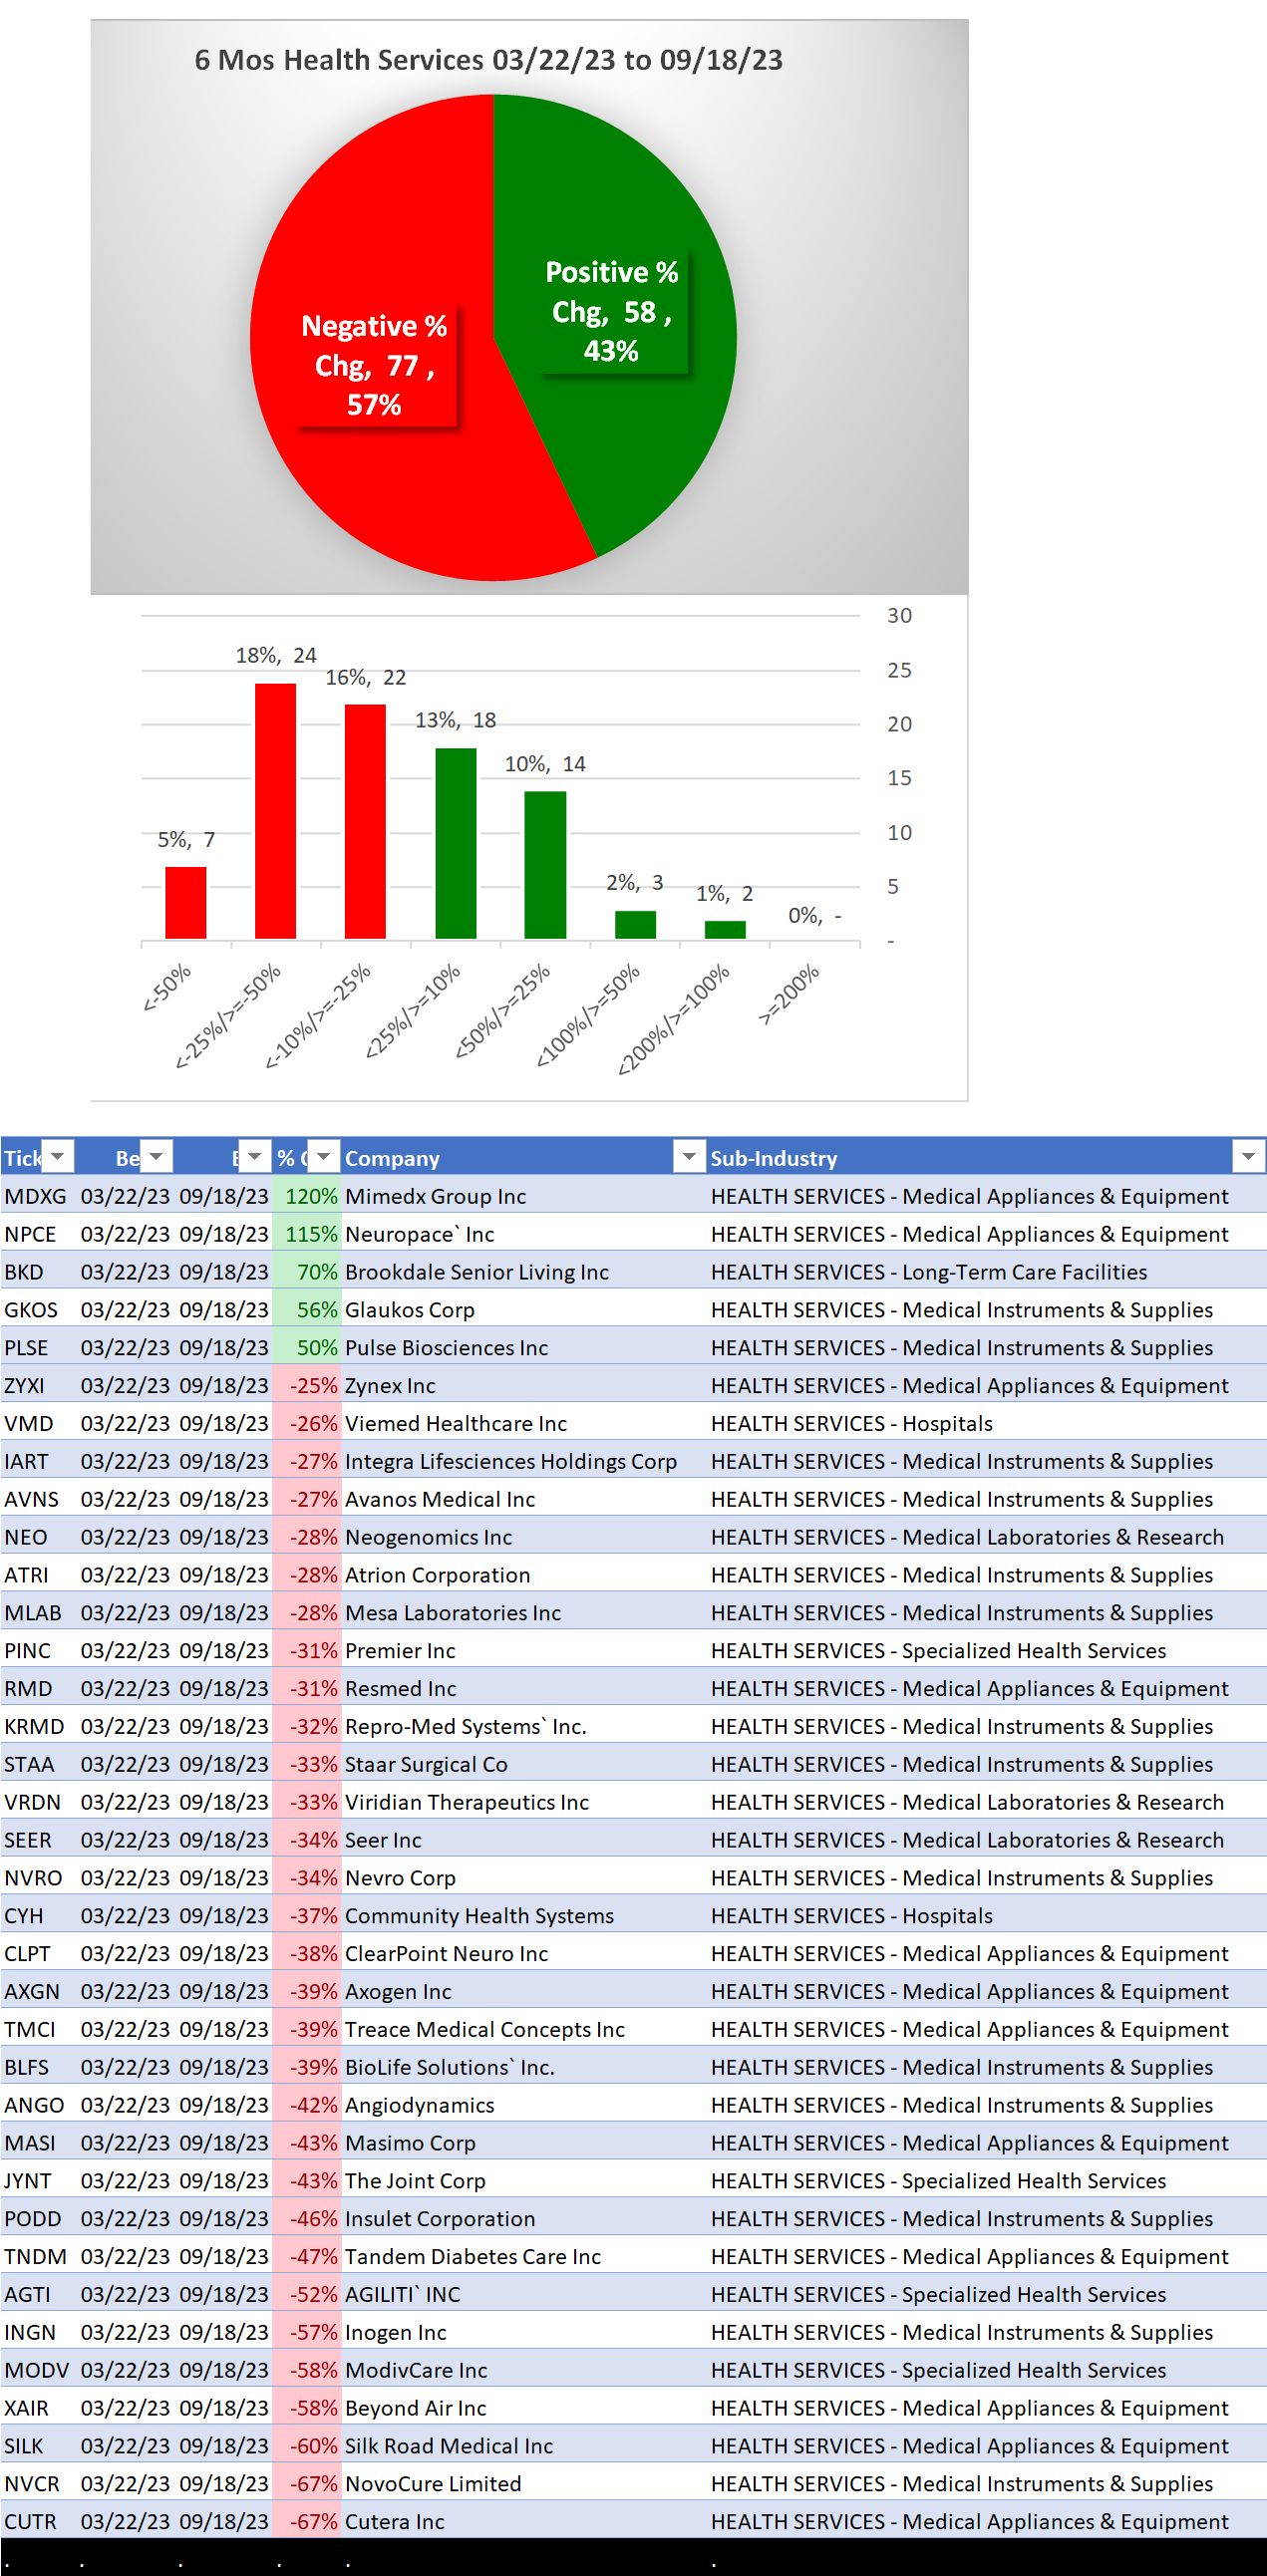
Past 6 months
31 stocks -25% or more (23% of total)
MDXG/Mimedx Group (Medical Appliances & Equipment) 120%
NPCE/Neuropace (Medical Appliances & Equipment) 115%
SILK/Silk Road Medical Inc (Medical Appliances & Equipment) -60%
NVCR/NovoCure Limited (Medical Instruments & Supplies) -67%
CUTR/Cutera Inc (Medical Appliances & Equipment) -67%
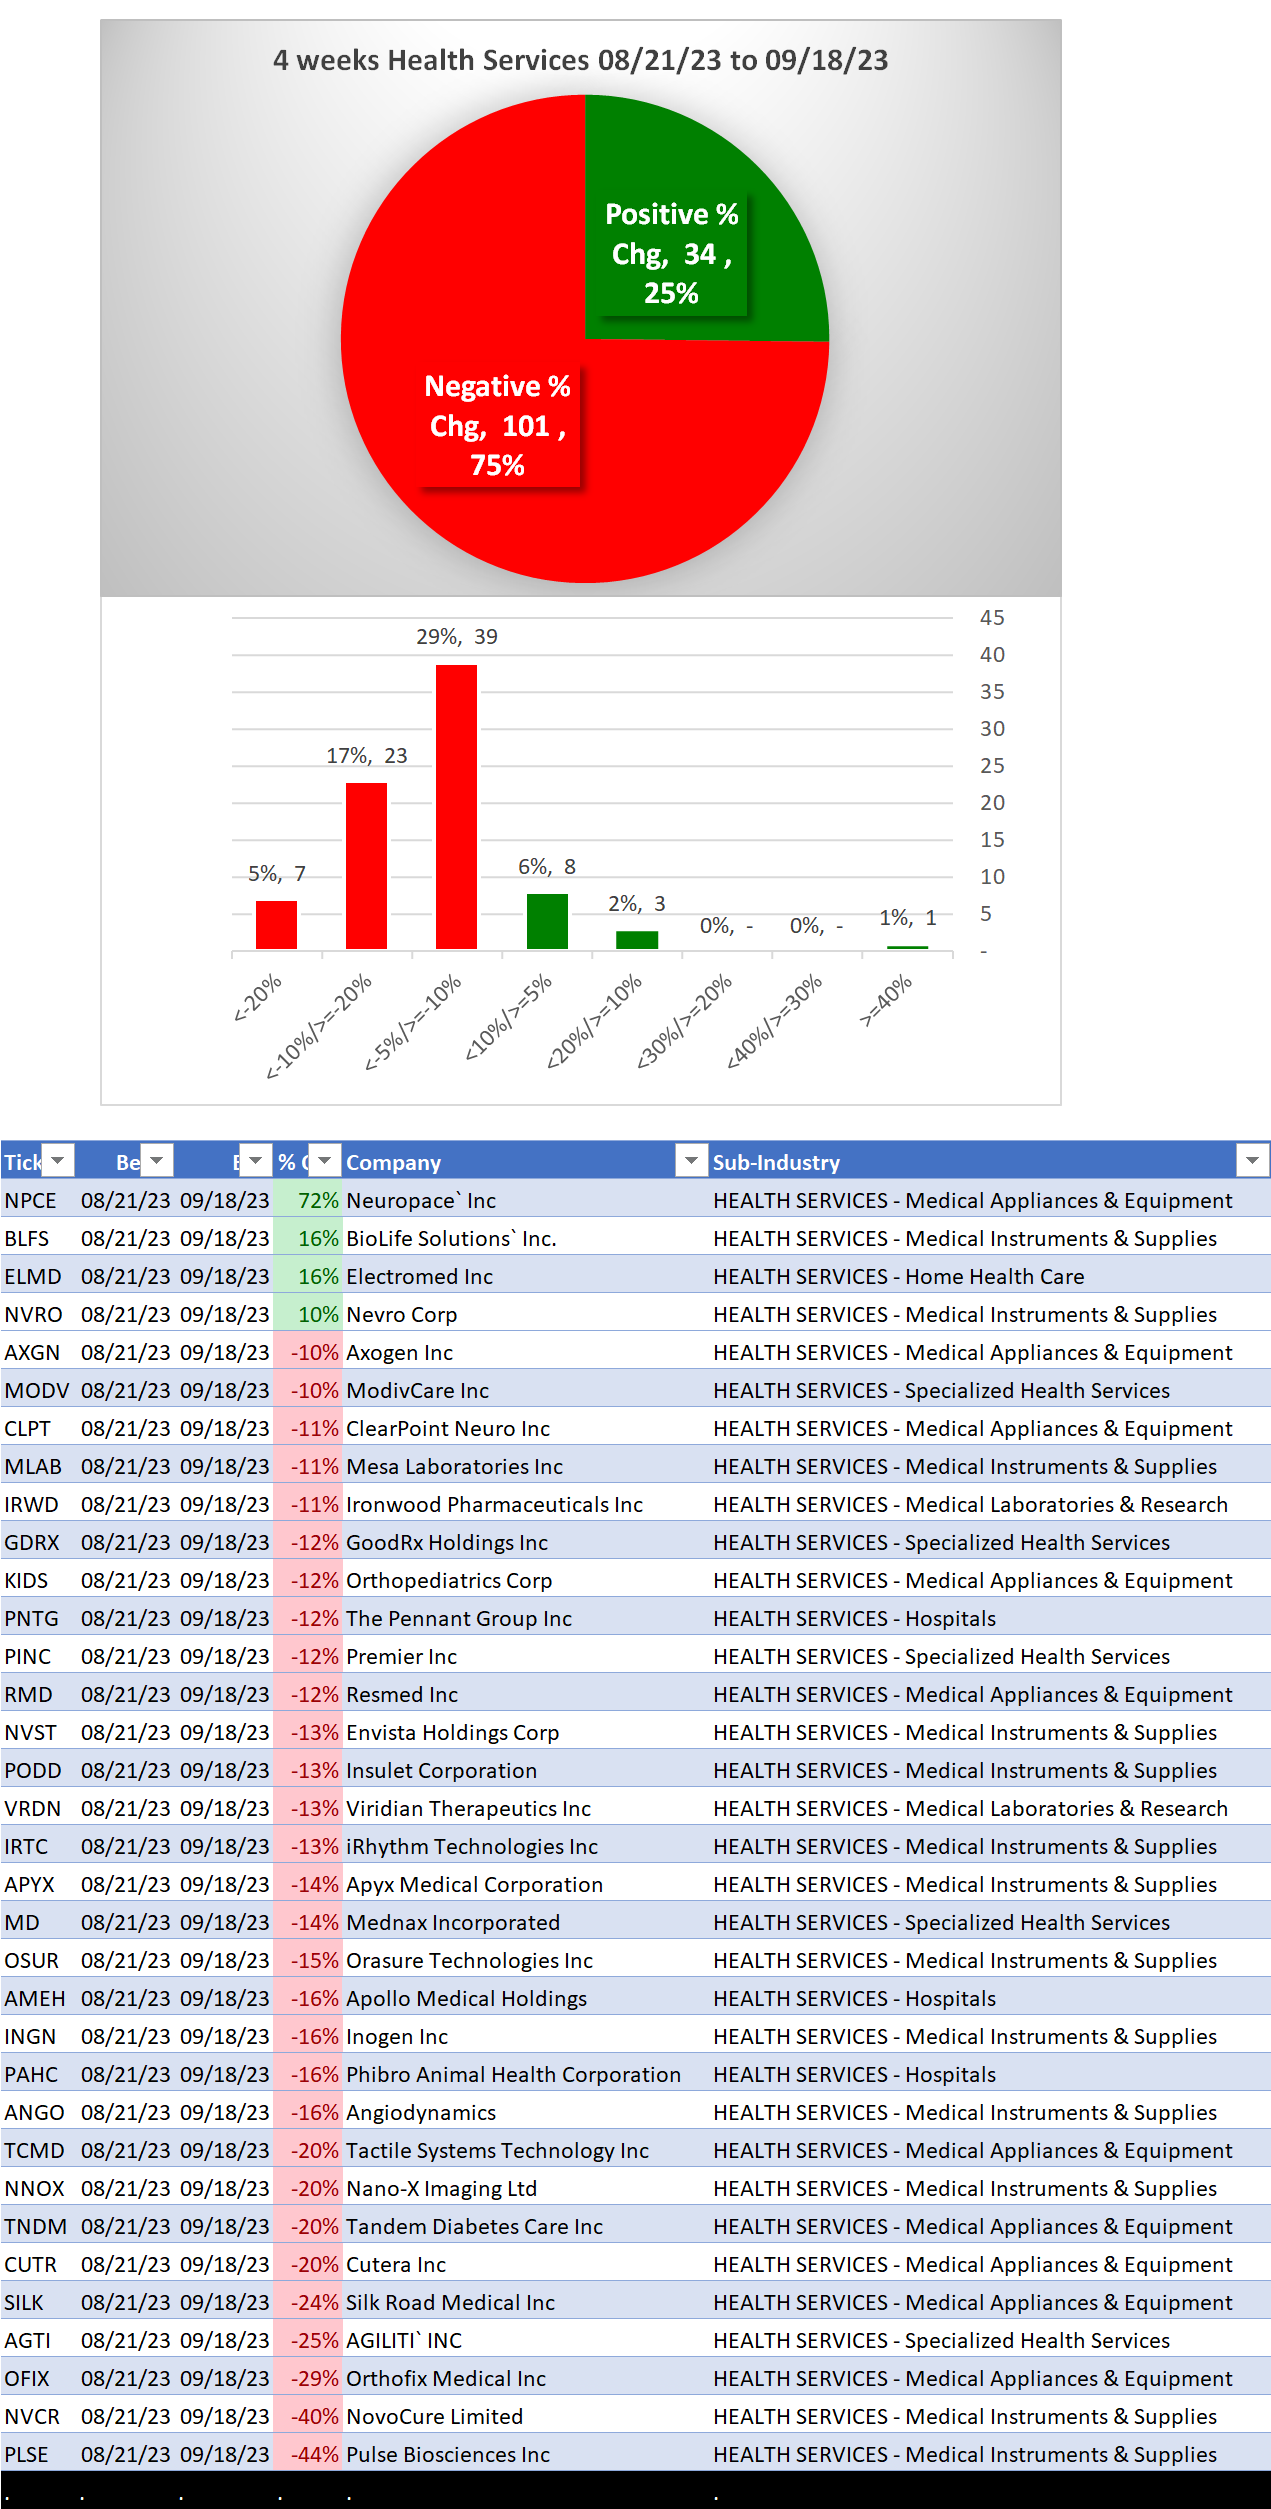
Past 4 weeks
30 stocks -10% or more (22% of total)
NPCE/Neuropace (Medical Appliances & Equipment) 72%
NVCR/NovoCure Limited (Medical Instruments & Supplies) -40%
PLSE/Pulse Biosciences Inc (Medical Instruments & Supplies) -44%
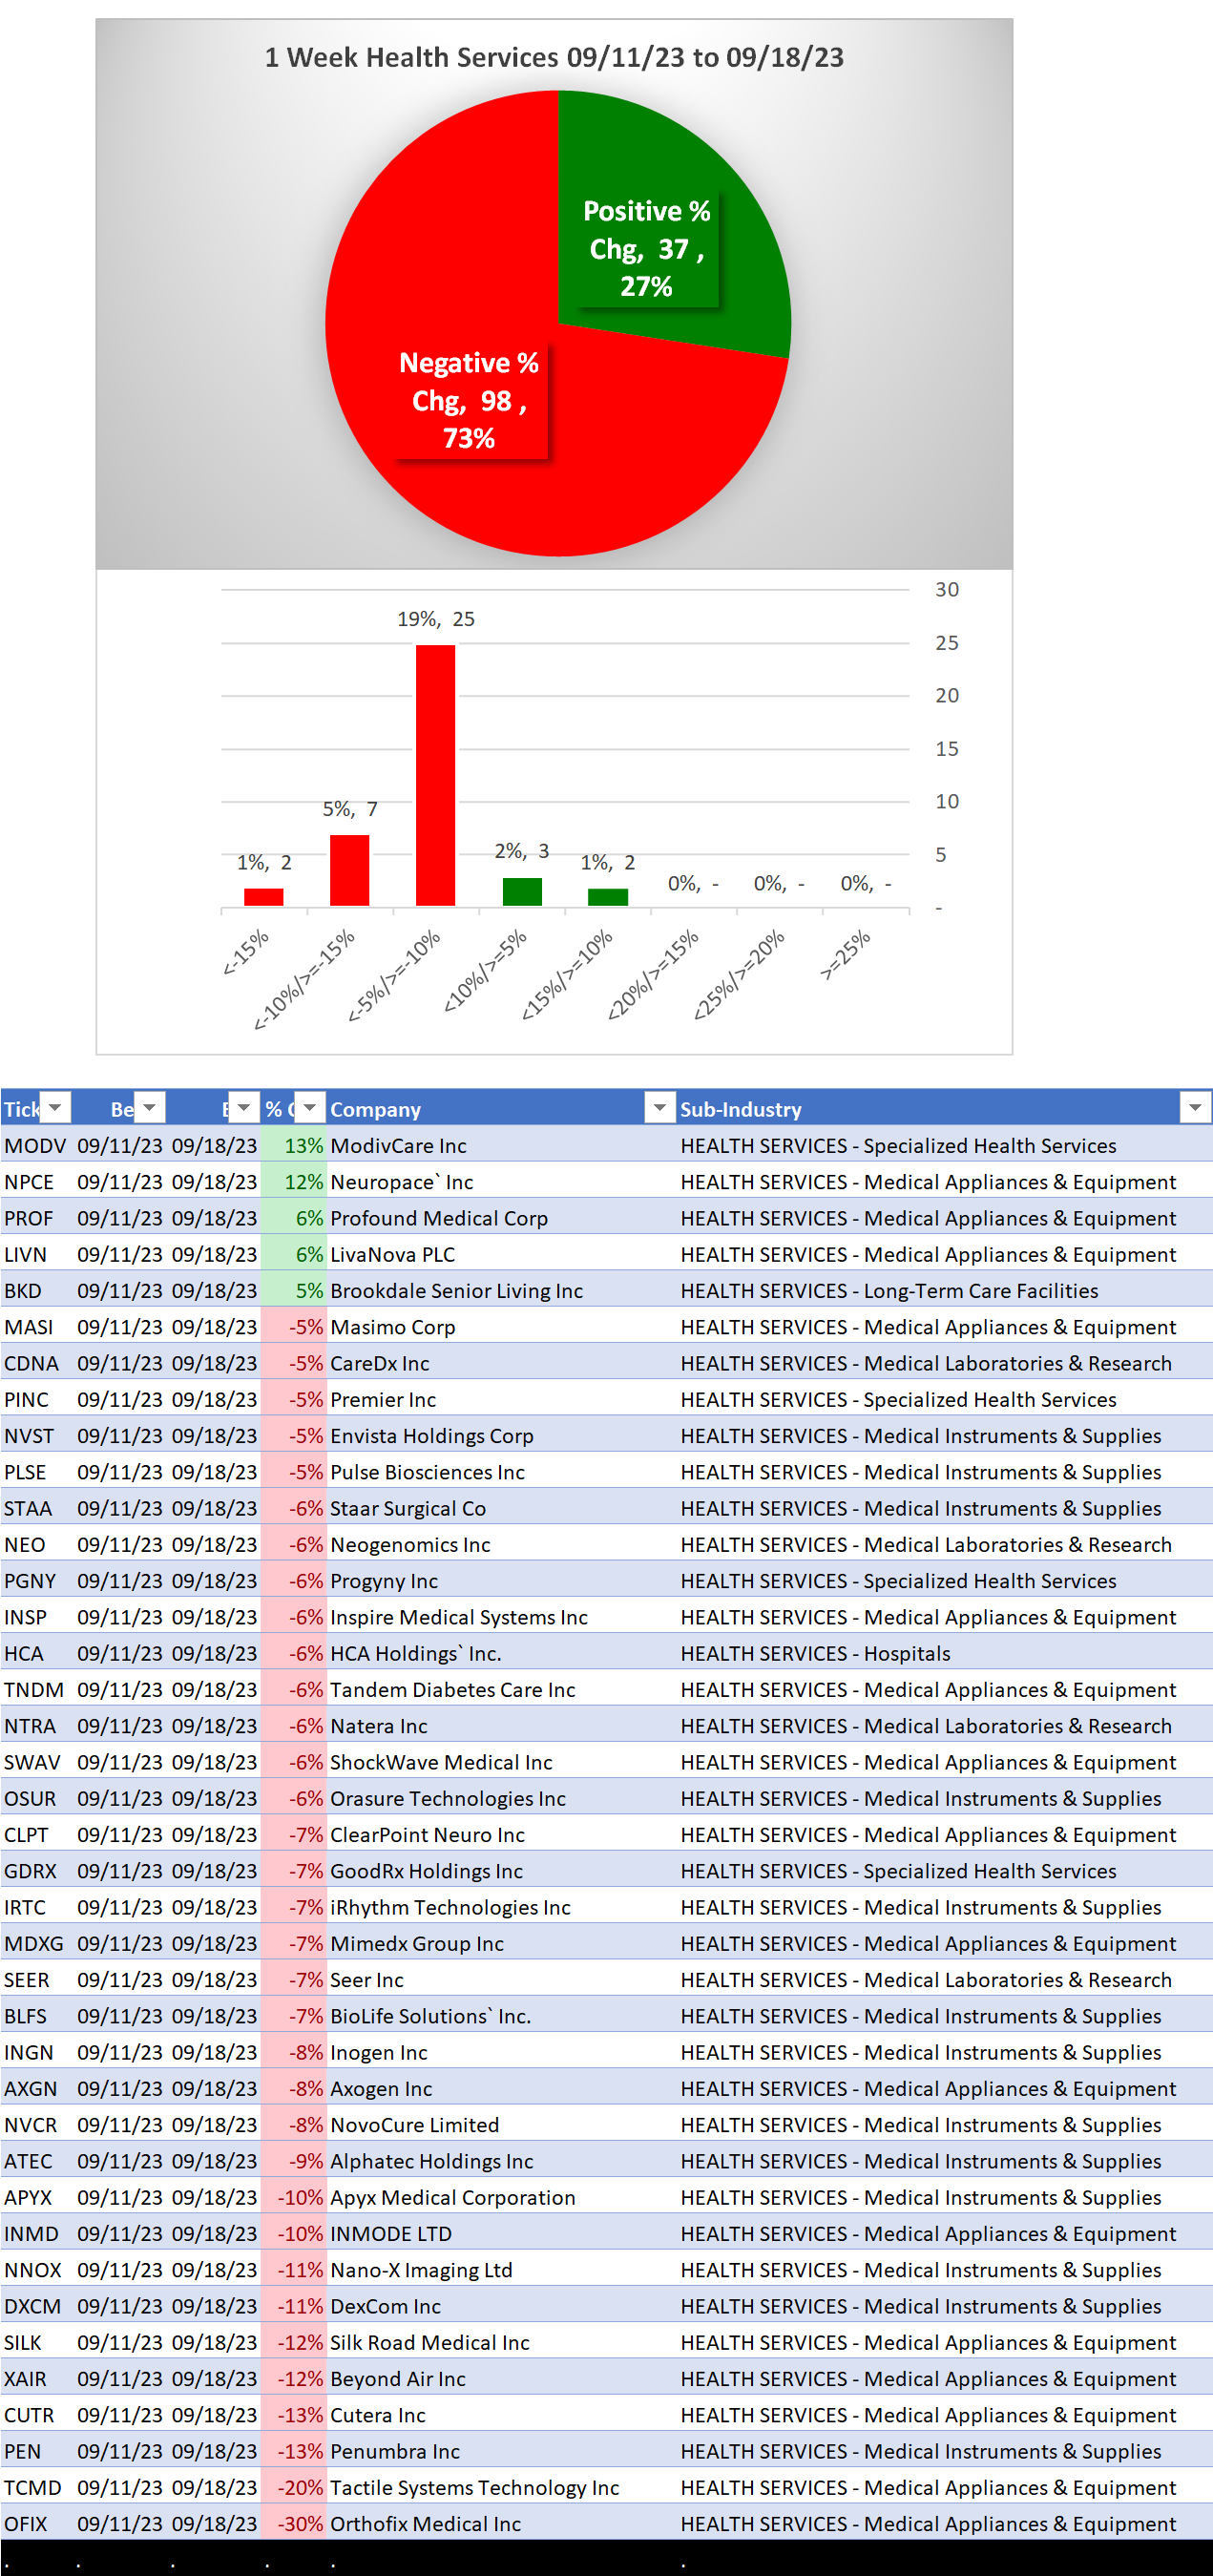
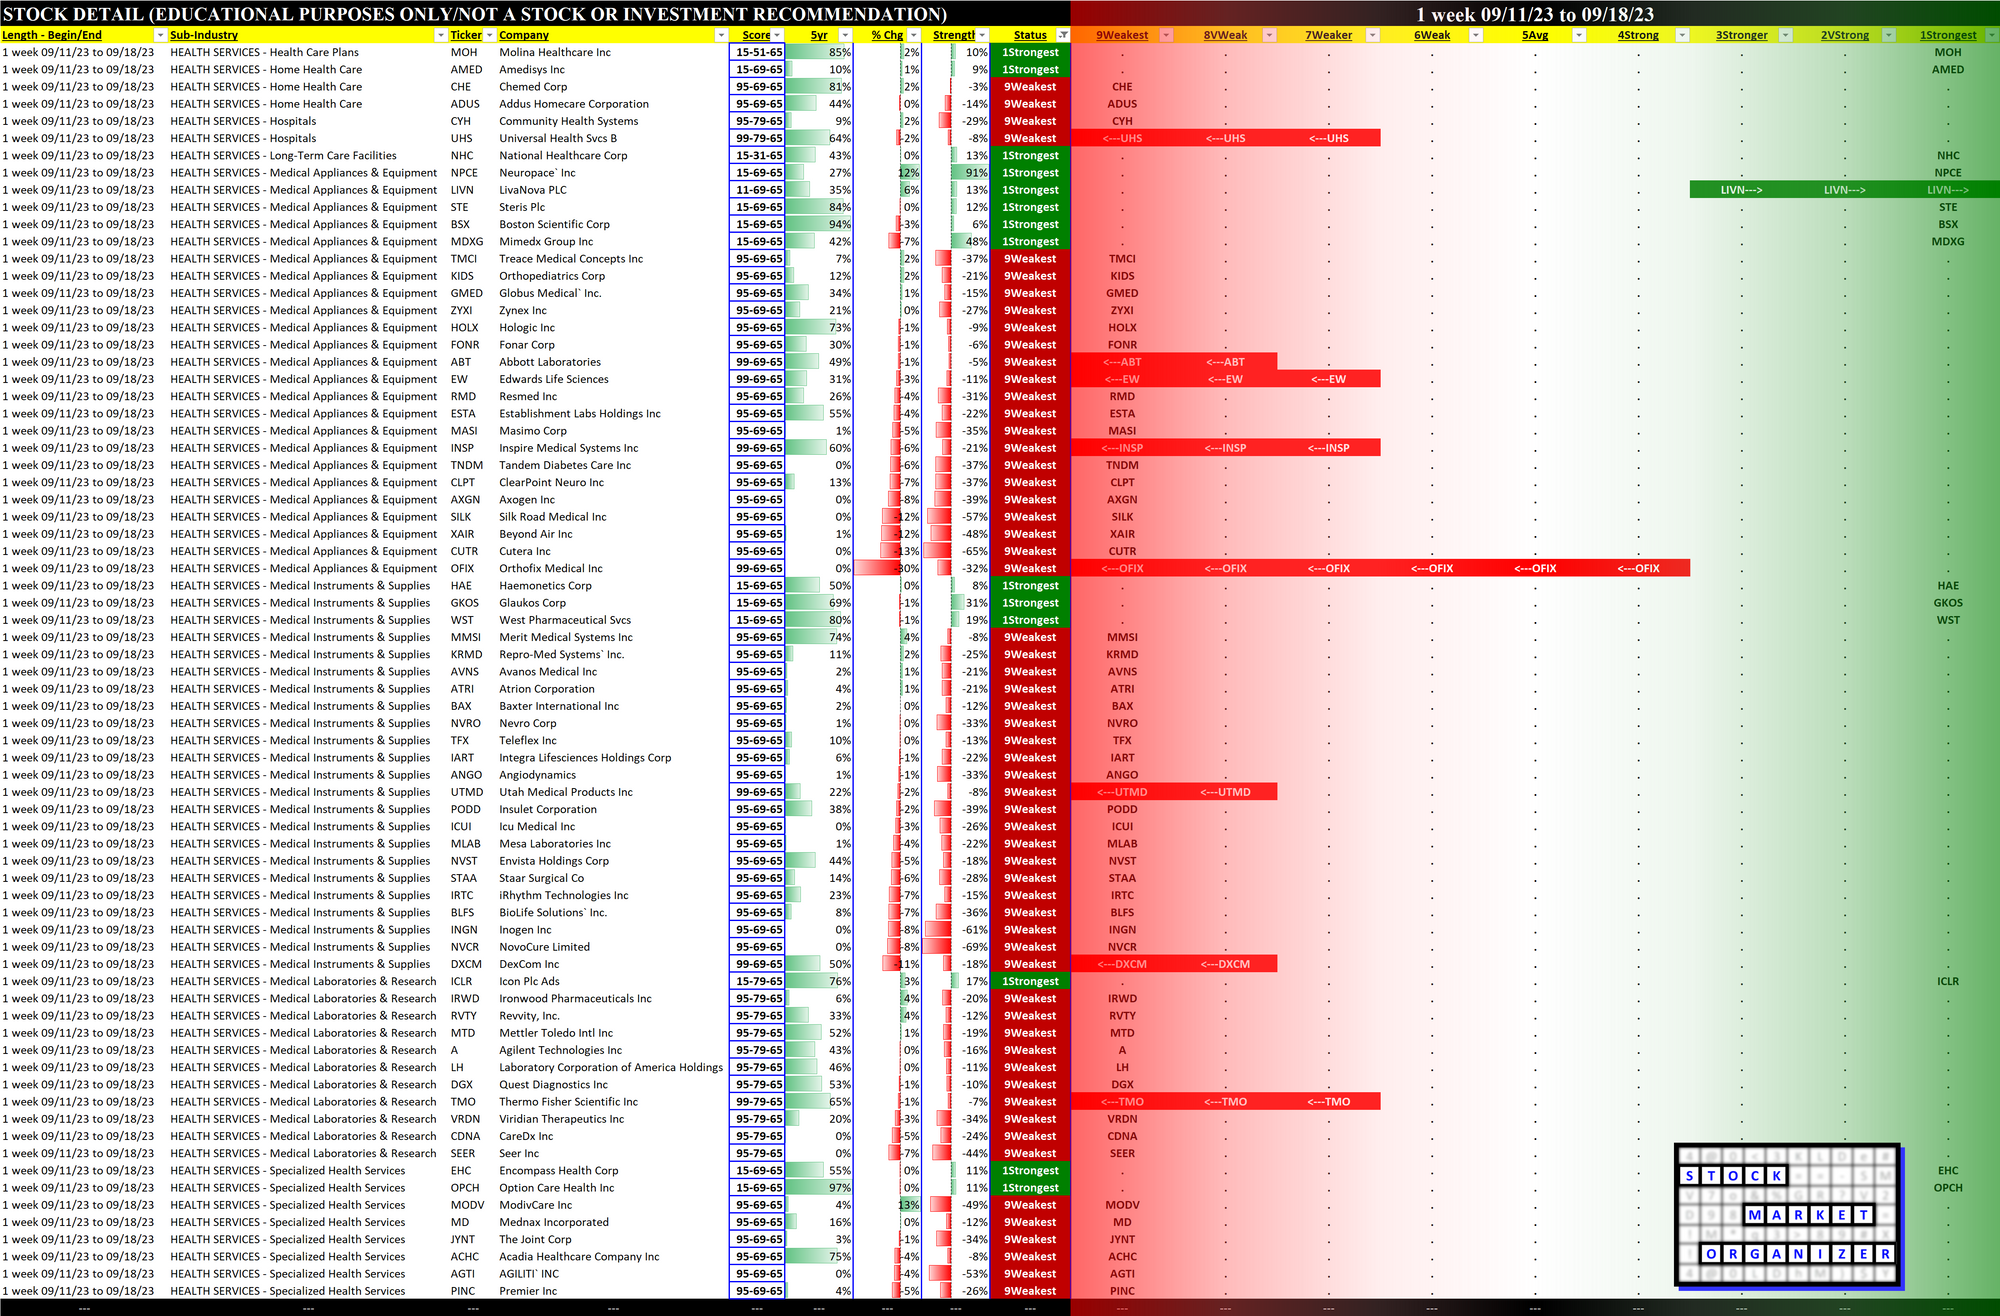
Past 1 week
34 stocks -5% or more (25% of total)
59 stocks rated Weakest (44% of total)
OFIX/Orthofix Medical Inc (Medical Appliances & Equipment) -30%
Background
Material of 8 sub-industries (135 stocks total, average 17 stocks/sub-industry):
46 stocks Medical Appliances & Equipment
38 stocks Medical Instruments & Supplies
15 stocks Medical Laboratories & Research
14 stocks Specialized Health Services
10 Biggest Market Cap stocks:
UNH, TMO, ABT, SYK, MDT, ELV, ISRG, CI, BSX, BDX
DETAIL: 1 Week Performance Review
Status
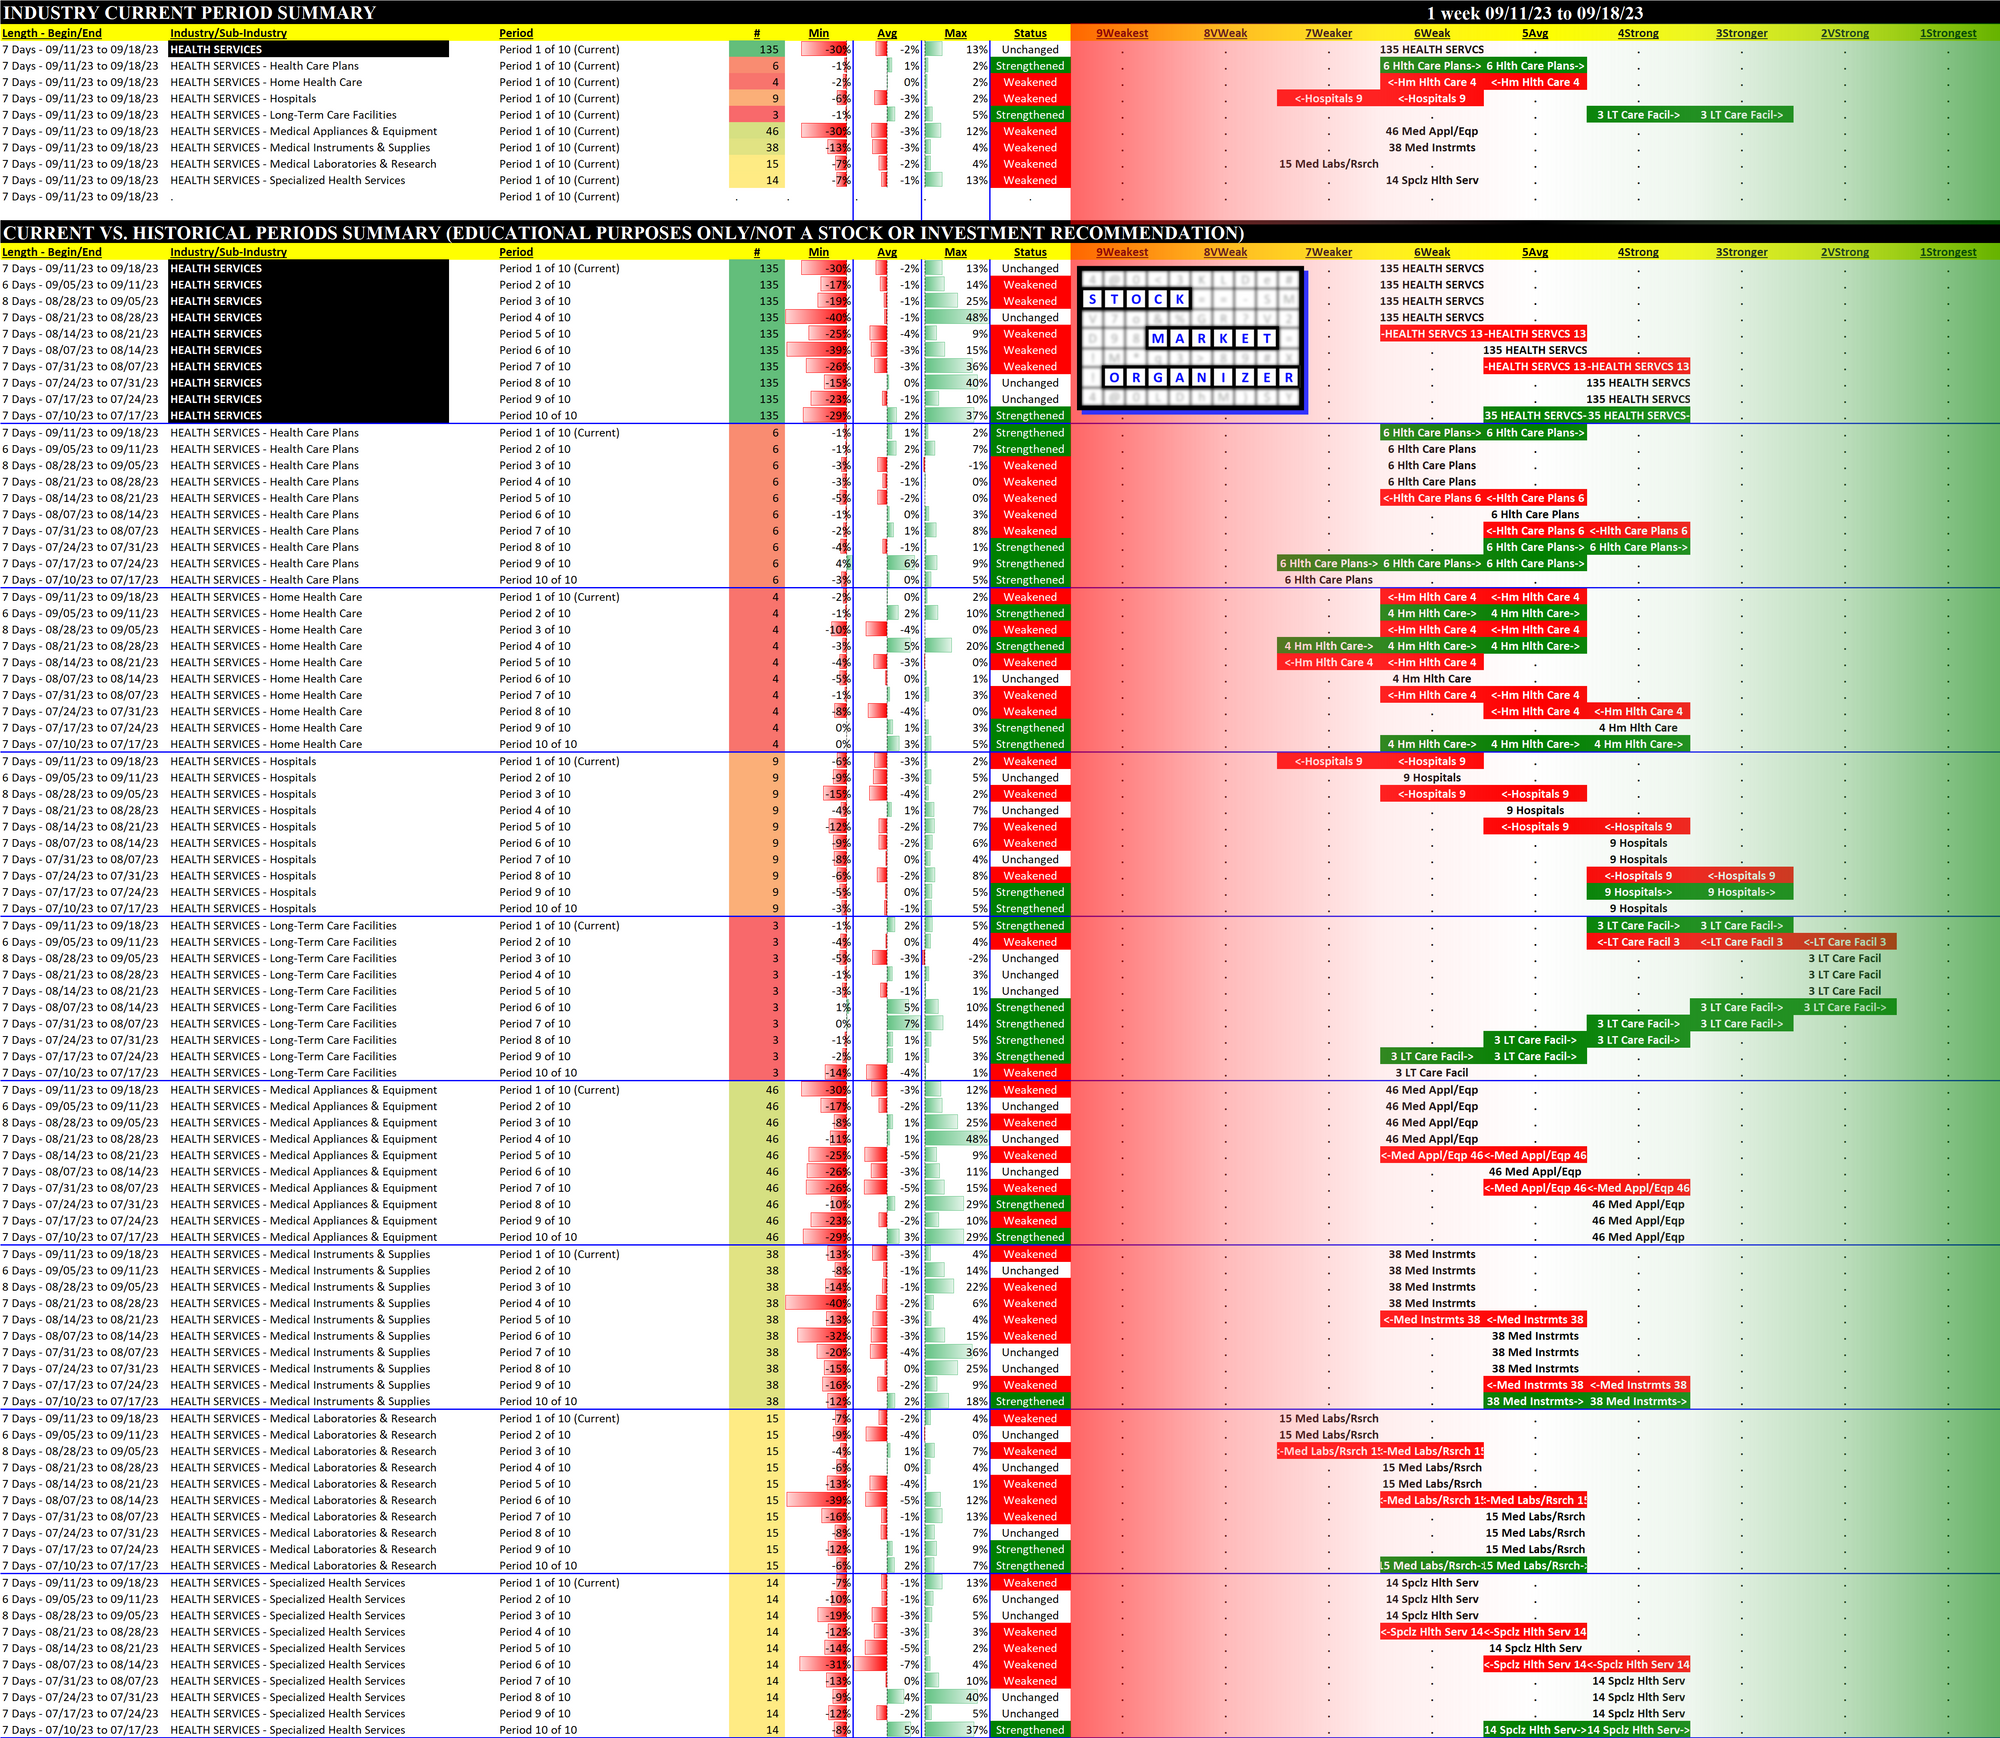
Strengthened: 2/8 sub-industries
Weakened: 2/8 sub-industries
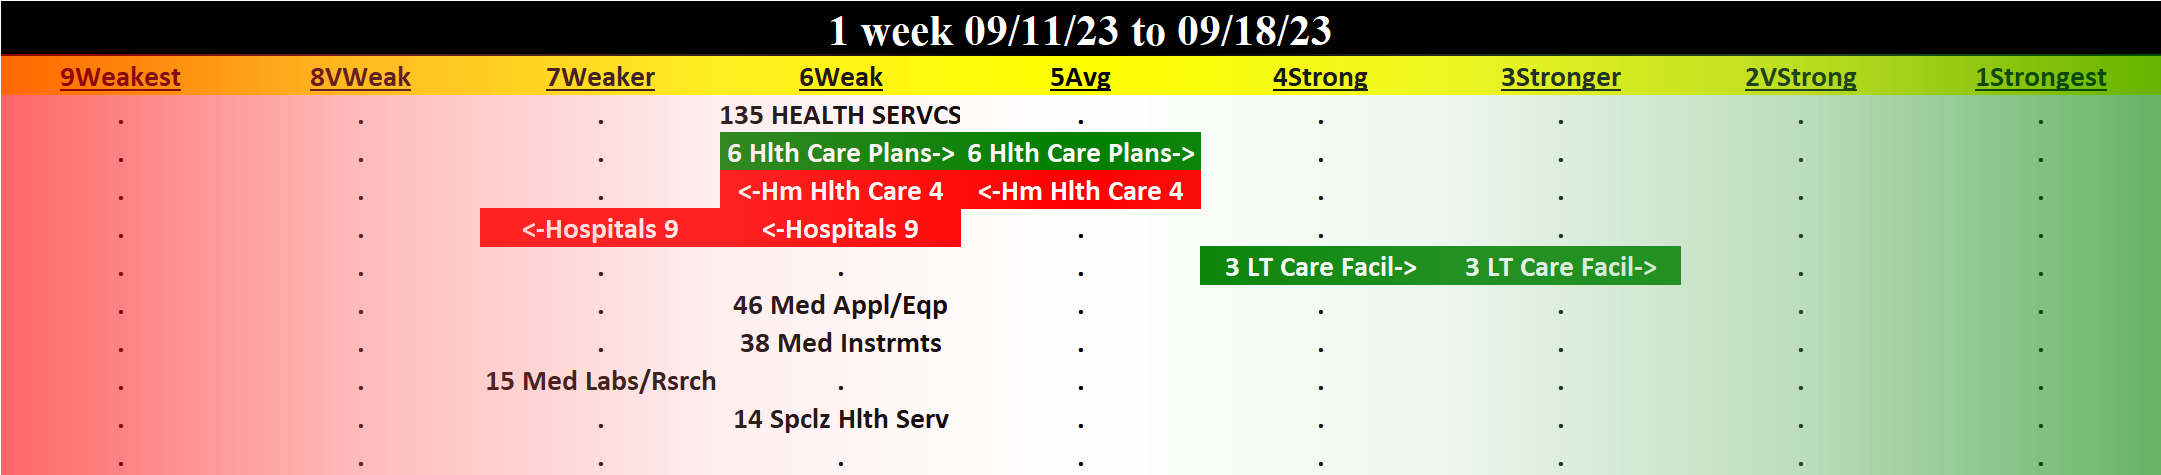
Strongest at Stronger rating/3rd strongest of 9 levels:
3 stocks Long-Term Care Facilities
Weakest at Weaker rating/7th strongest of 9 levels:
9 stocks Hospitals
15 stocks Medical Laboratories & Research
Detail Charts: Sub-Industry and Stock
10-Week Week-by-Week Industry/Sub-industry Strength Comparison
What: recent week-by-week strength changes for the industry and each underlying sub-industry
Why: objective measurement of strengthening and weakening enabling comparison within and across industries and sub-industries
Strongest and Weakest Stocks
What: stocks currently rated Strongest/Weakest (highest/lowest of 9 strength ratings)
Why: most interesting stocks for available capital because
- the Strongest may be meme-stock mania candidates prone to breakouts, and
- the Weakest may be prone to large bottom-fishing/short-covering-driven pops... and may also be primed for bigger and faster falls.
(Not guaranteed and not a recommendation - weak stocks in weakening sub-industries may be better shorts than high-flyers.)
DETAIL: Lookbacks 6 Mos vs. 4 weeks vs. 1 Week
6 Mos Lookback
4 weeks Lookback
1 Week Lookback