Financial Services 2023-09-22: Unchanged at AVERAGE strength rating (5th strongest of 9 levels), previous move was DOWN
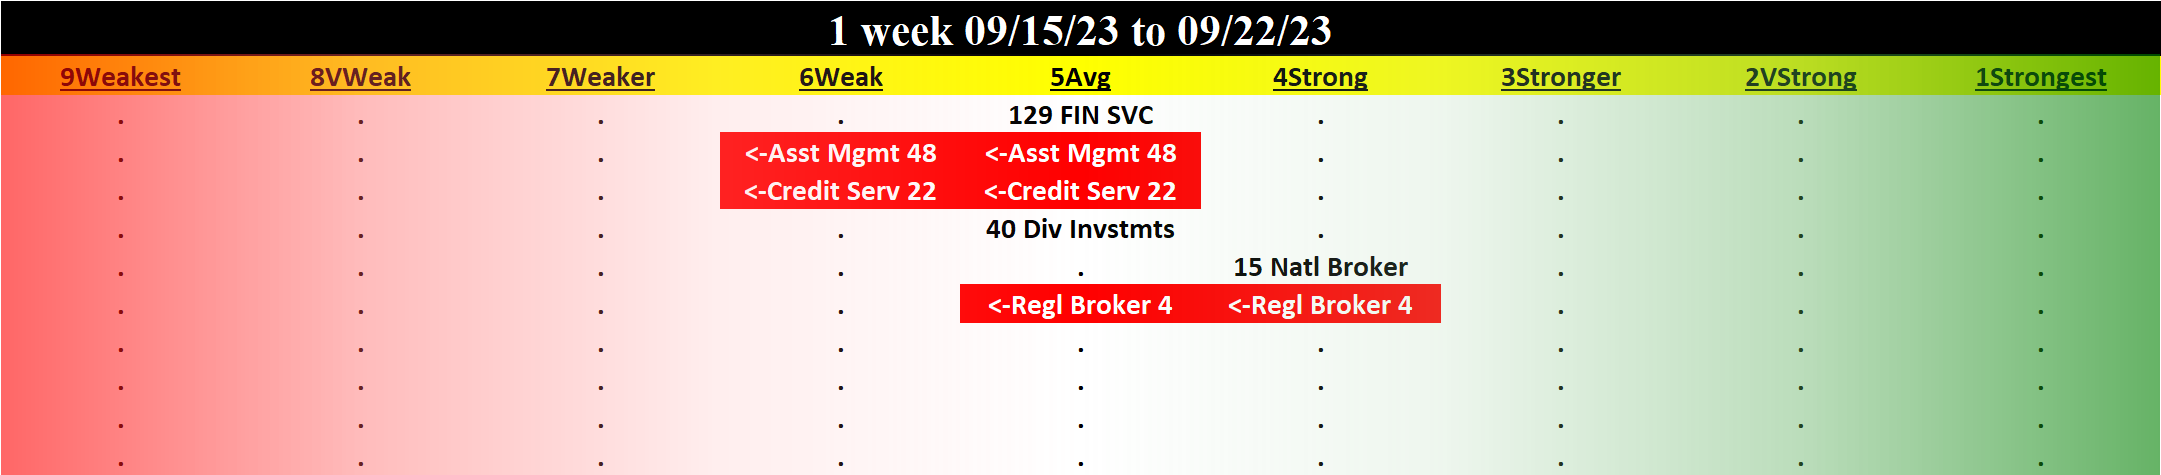
TABLE OF CONTENTS
- INDUSTRY OVERVIEW
1A. Performance
1B. Background - SUB-INDUSTRIES AND STOCKS DETAIL
2A. Sub-Industries Overview
2B. Sub-Industries 10-Week Strengthening Analysis
2C. Stocks 1 Week Strongest and Weakest - STRENGTH BY LOOKBACK PERIOD (with Best/Worst stocks)
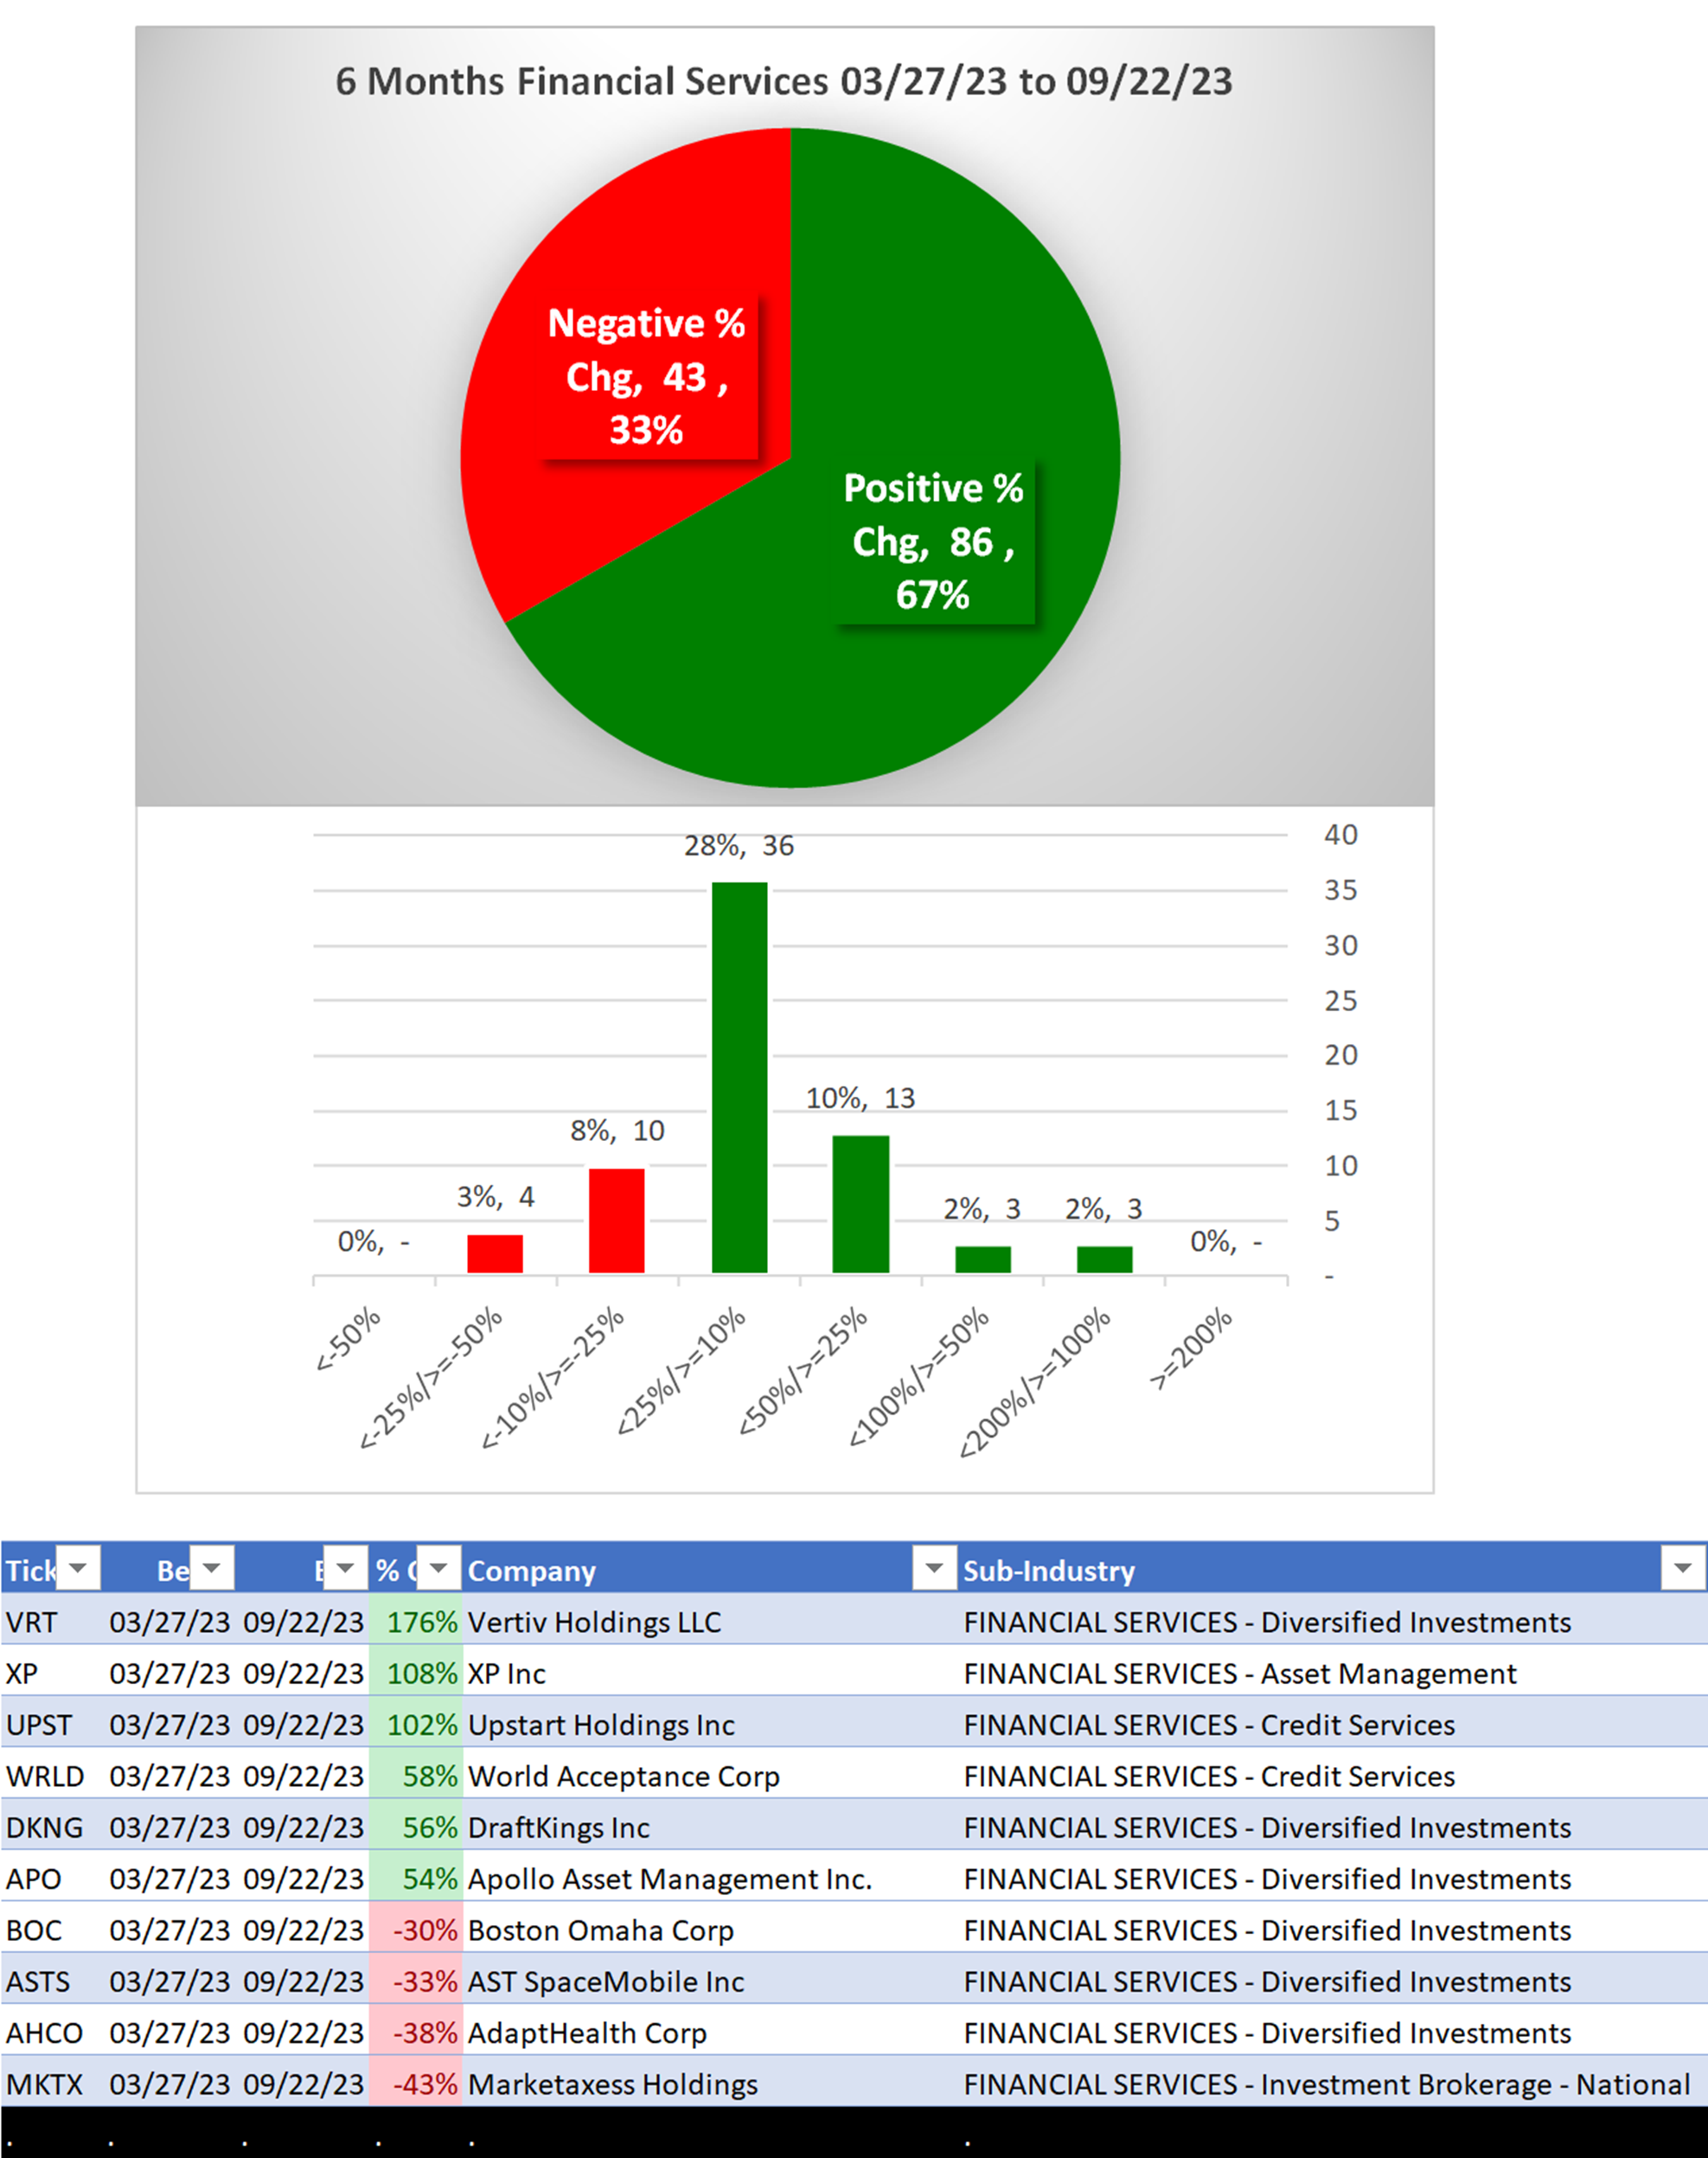
3A. Lookback 6 Months
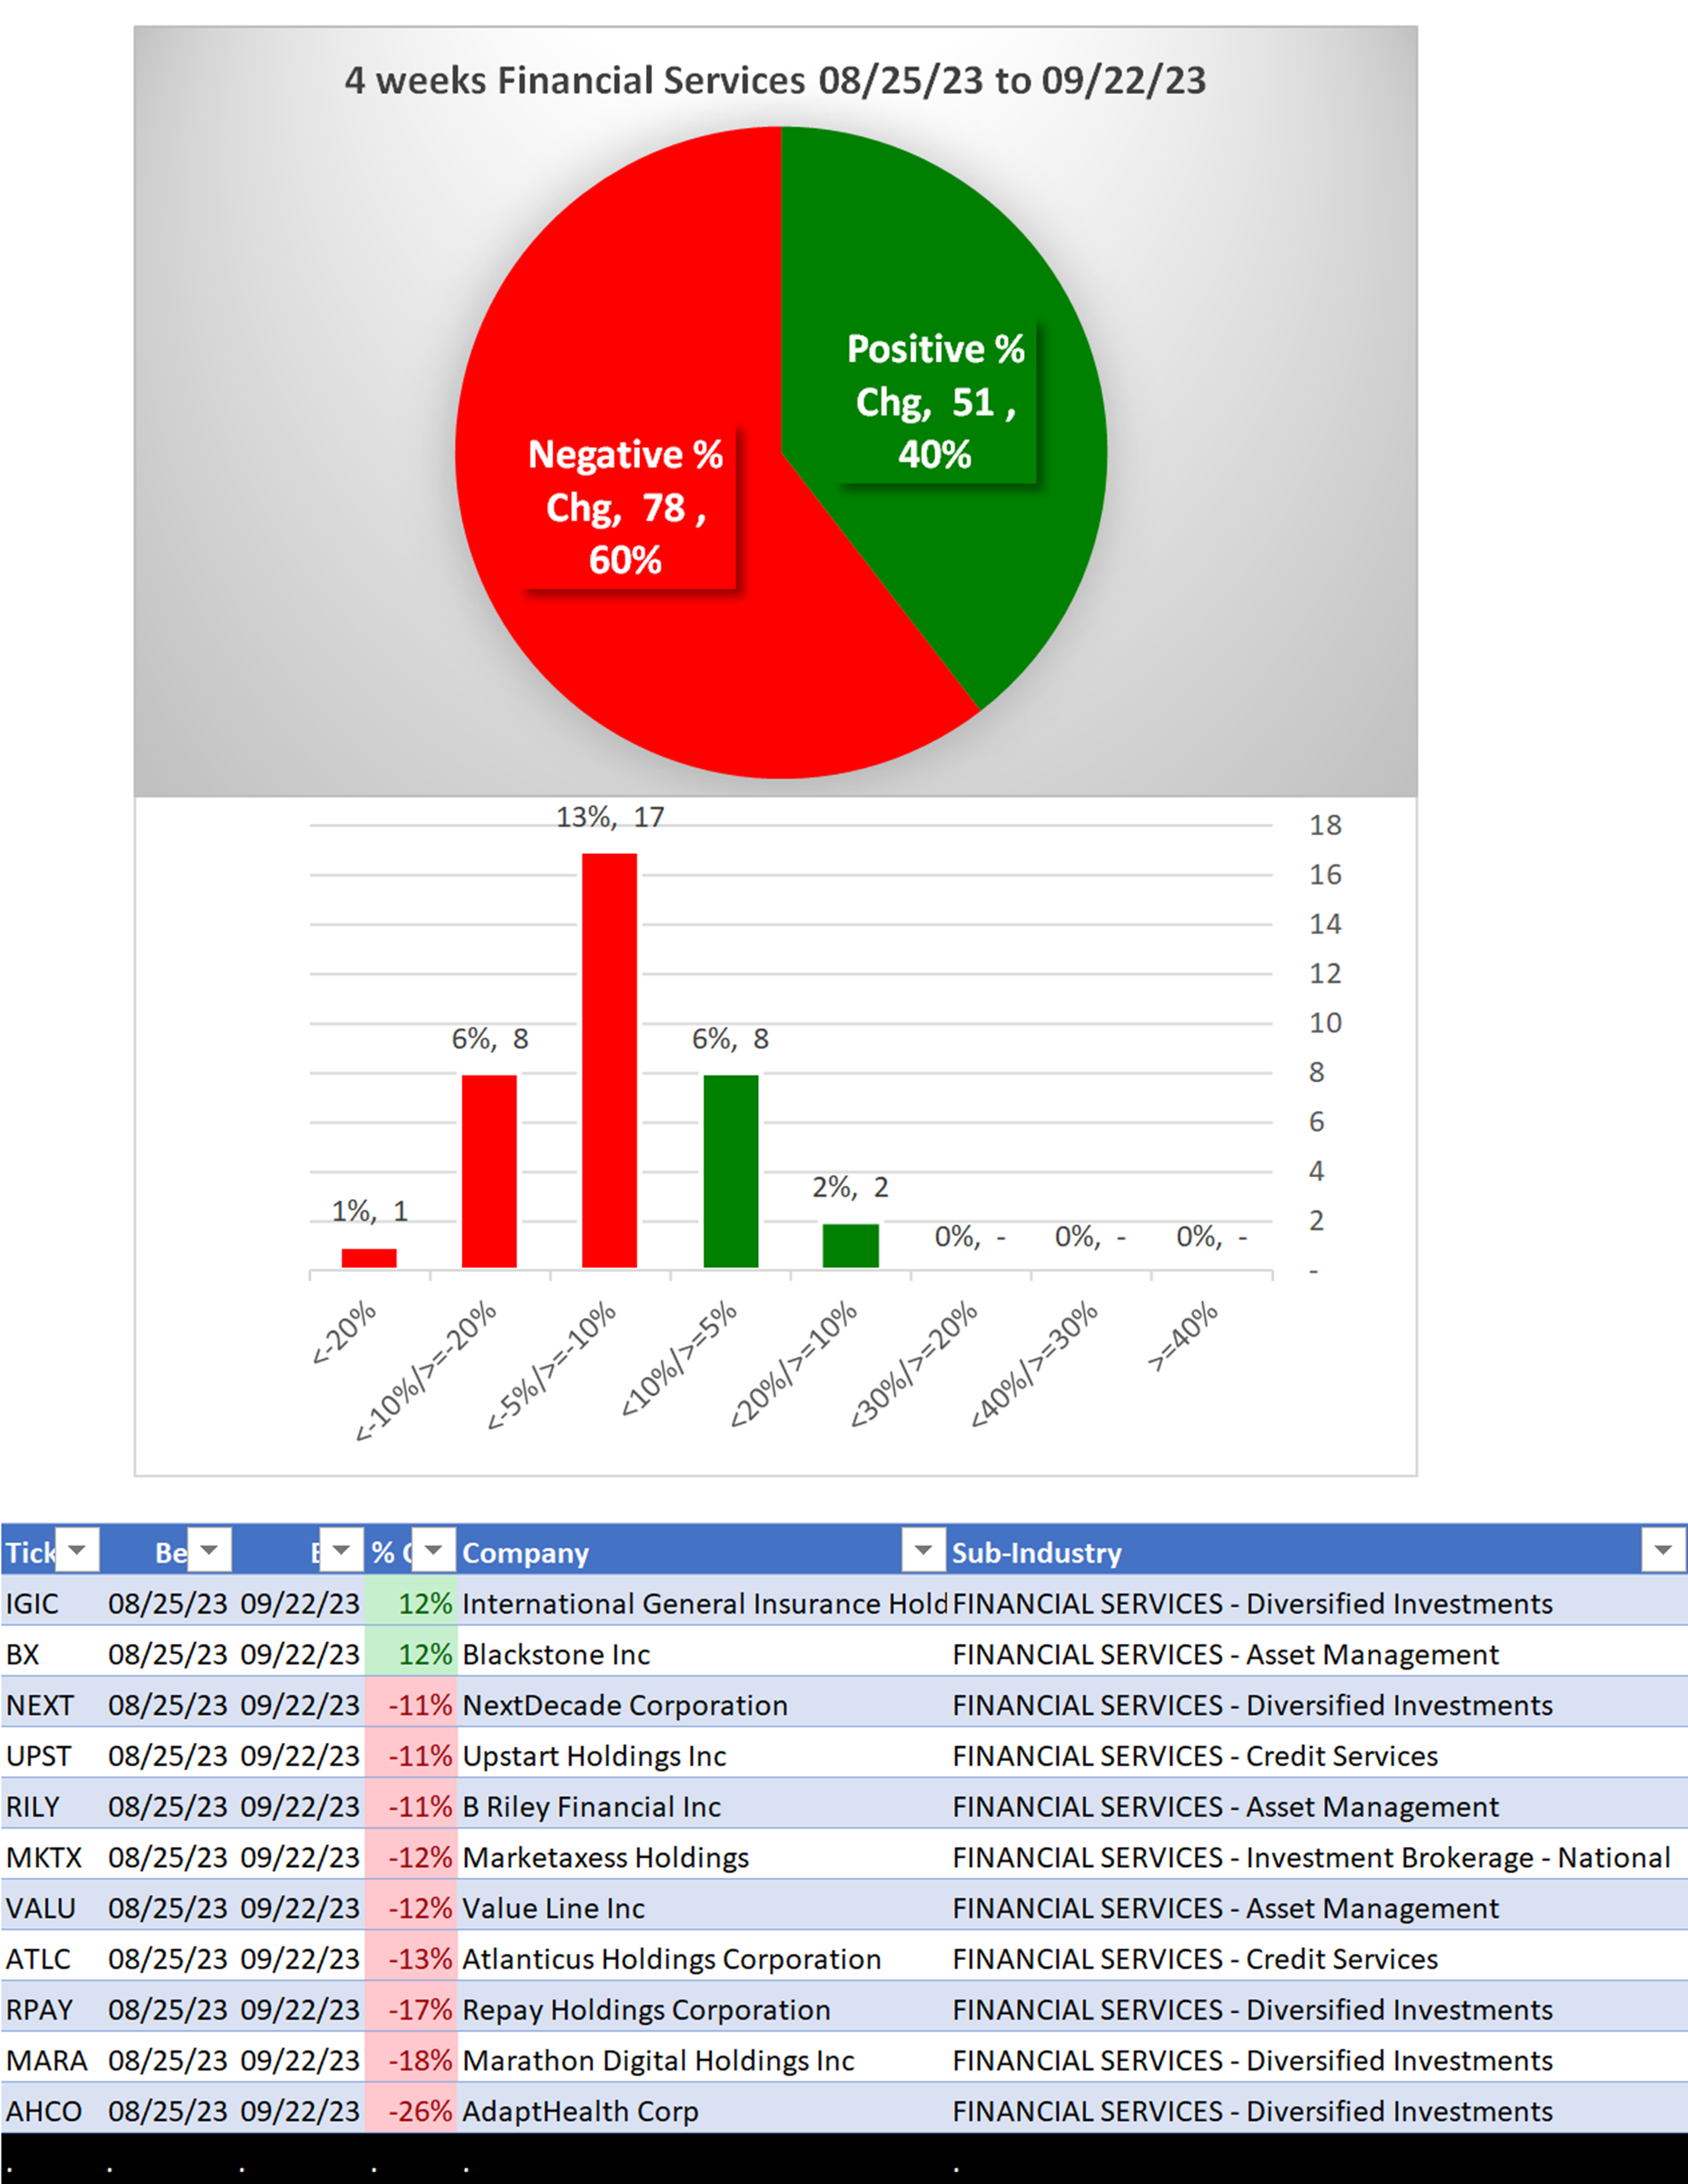
3B. Lookback 4 weeks
3C. Lookback 1 Week
1. INDUSTRY OVERVIEW
1A. Performance
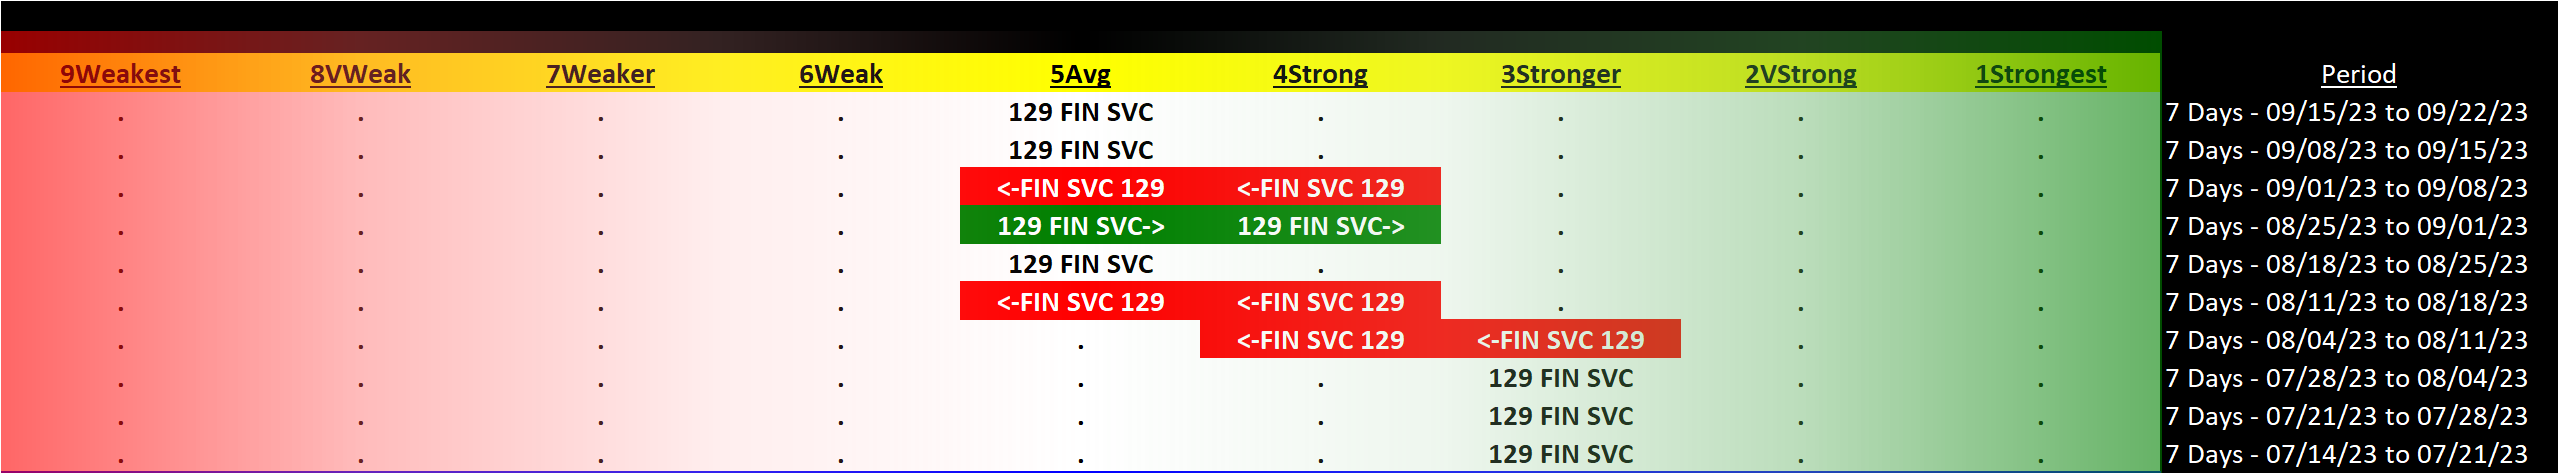
Past 10 Weeks Strengthening/Weakening week-by-week, per the following chart:
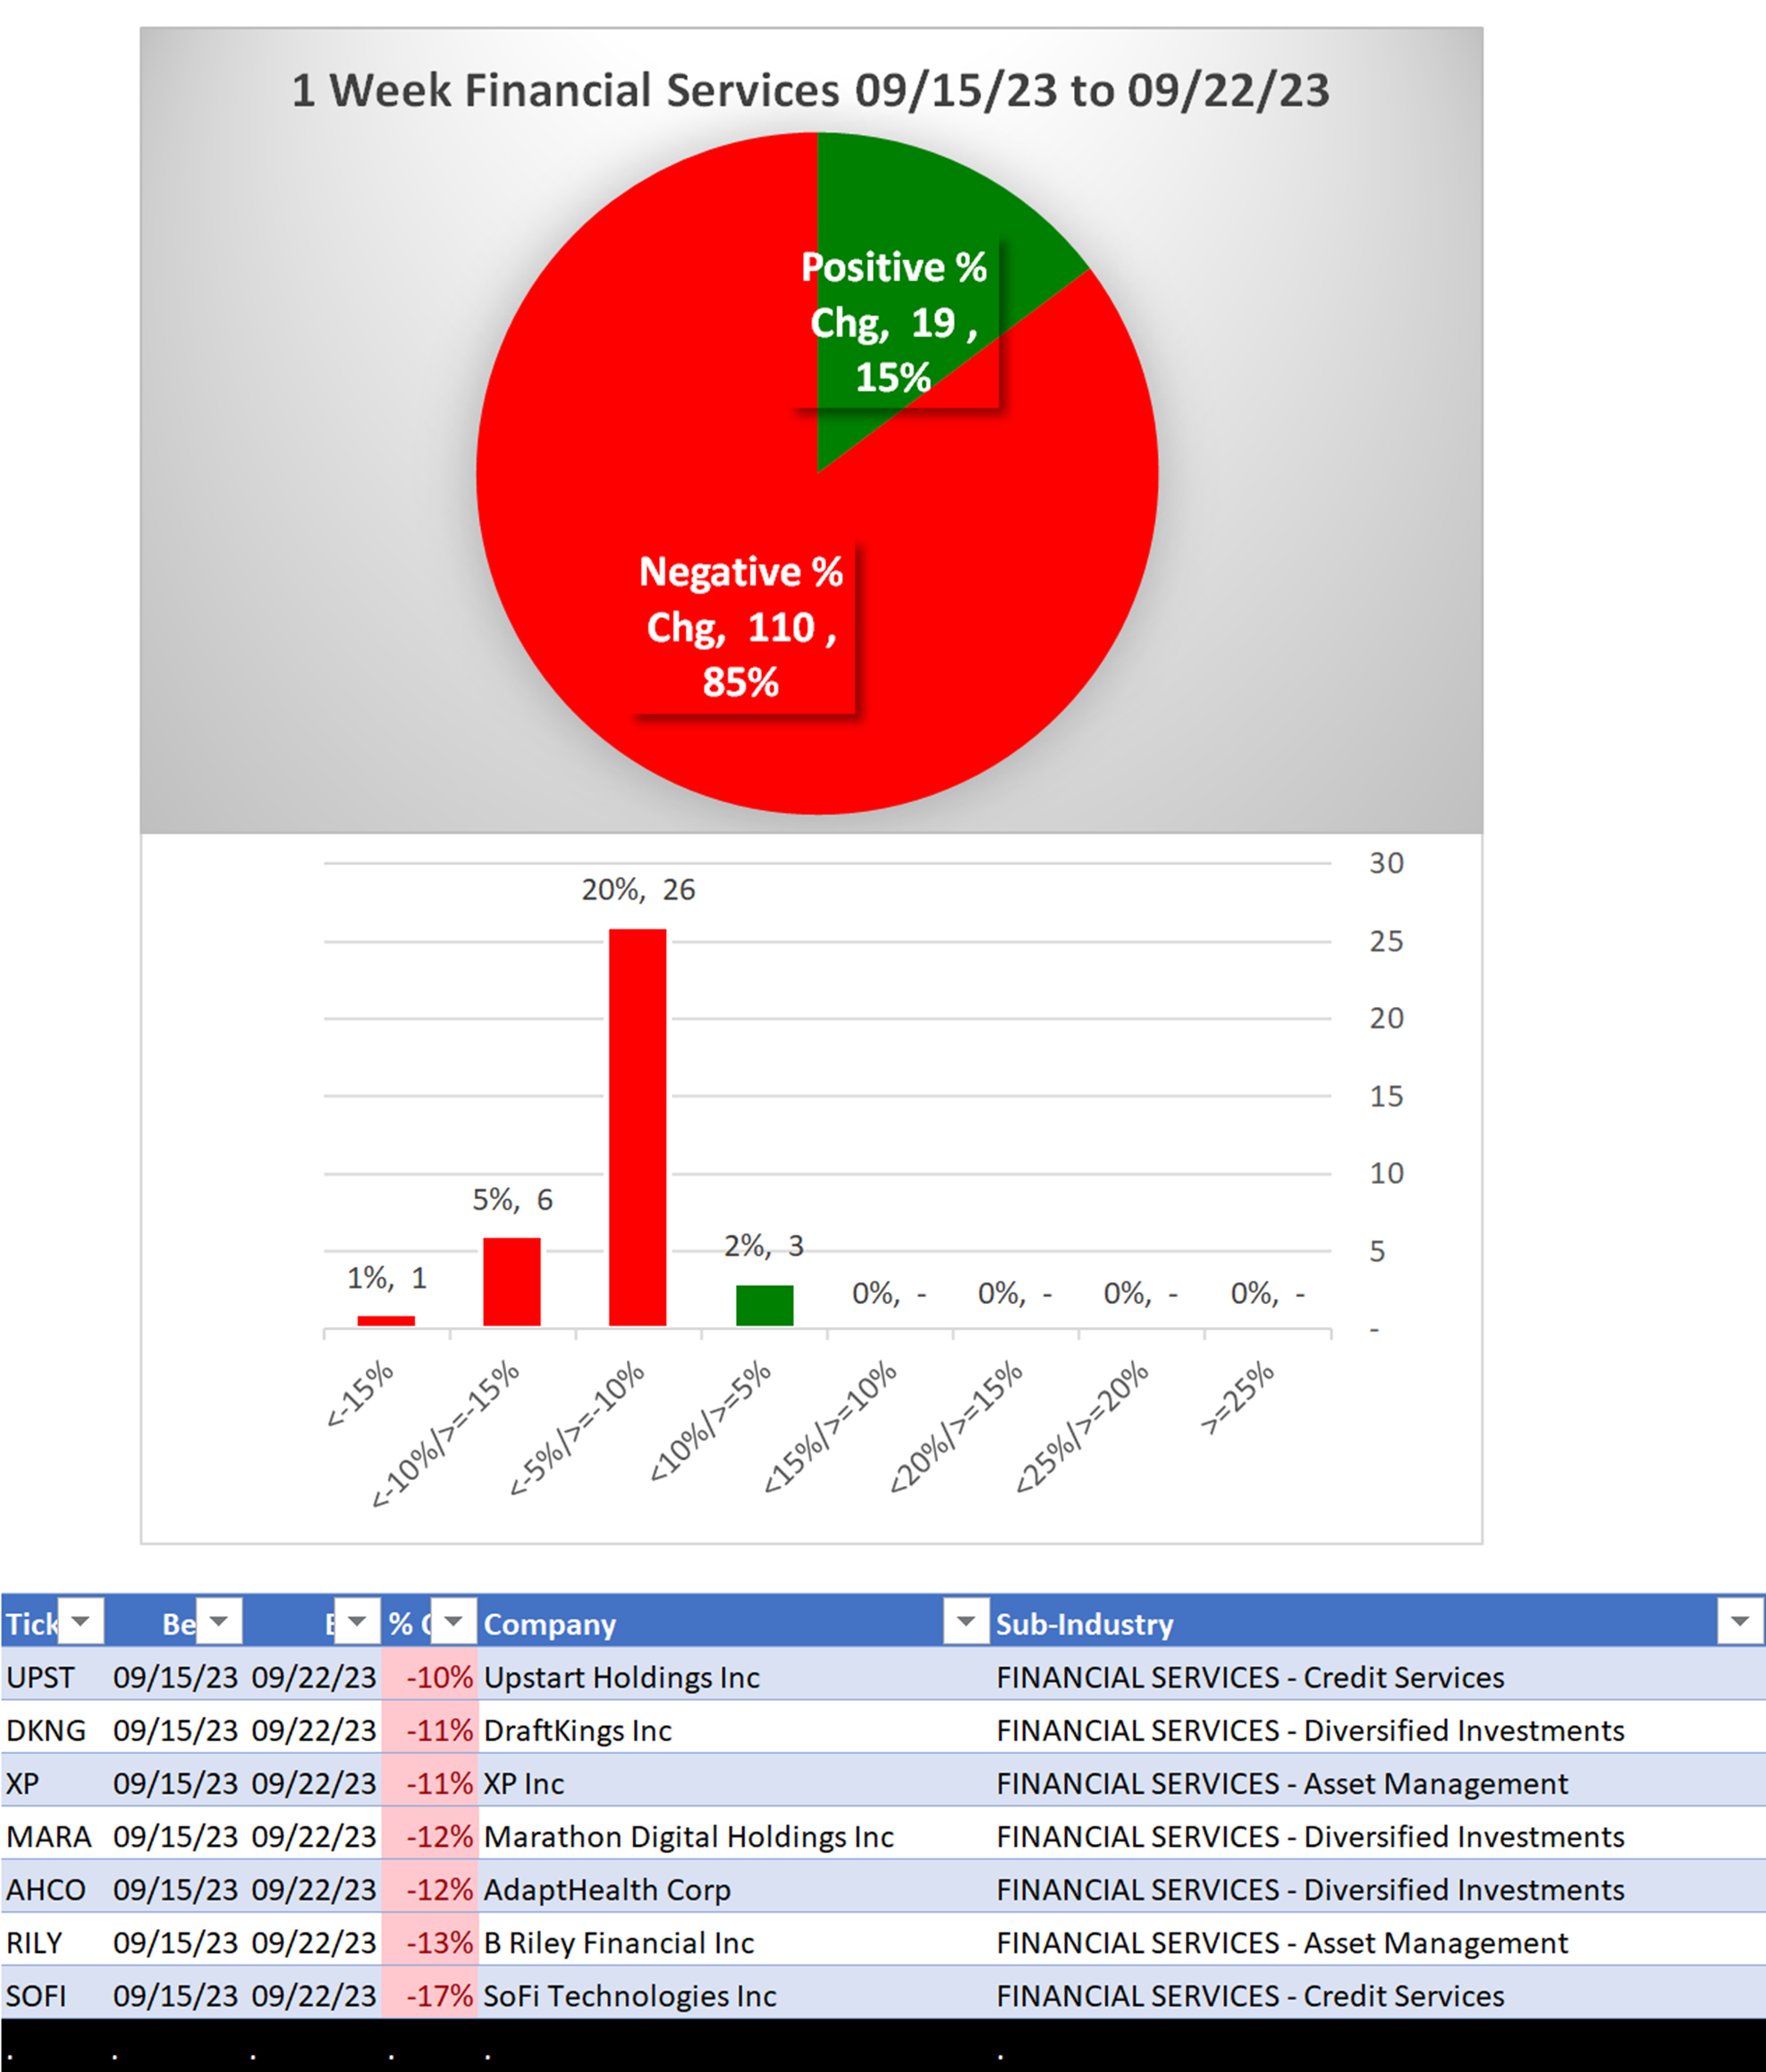
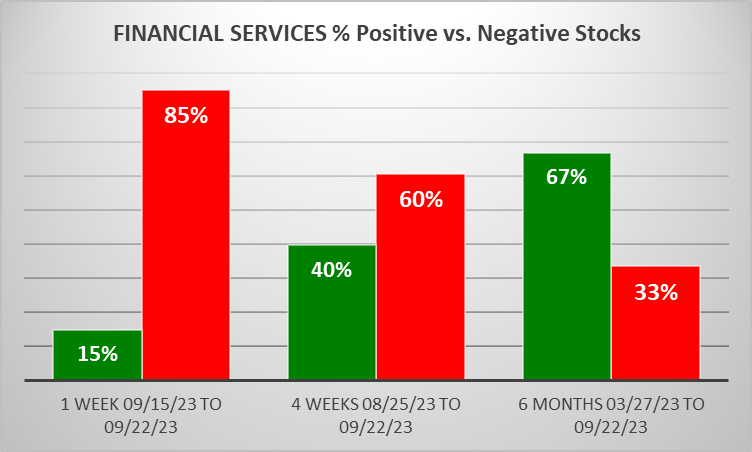
WEAKENING 1 Week vs. Mid- and Longer-Term // 1 week positive/negative stocks ratio is LOWER than both 4 weeks and 6 Months, per the following chart:
1B. Background
Largest of 5 sub-industries (129 stocks, average 26):
- Asset Management (48 stocks)
- Diversified Investments (40 stocks)
- Credit Services (22 stocks)
Top 10 by Market Capitalization:
MS/Morgan Stanley, AXP/American Express Co, GS/Goldman Sachs Group Inc, SCHW/Charles Schwab Corp, BLK/Blackrock Incorporated, BX/Blackstone Inc, CME/Cme Group Inc, PYPL/PayPal Holdings Inc, ICE/Intercontinental Exchange Inc, KKR/KKR & Co. L.P.
2. SUB-INDUSTRIES AND STOCKS DETAIL
2A. Sub-Industries Overview
Strengthened: 0/5 sub-industries
Weakened: 3/5 sub-industries
STRONGEST at Strong rating/4th strongest of 9 levels:
- Investment Brokerage - National (15 stocks)
WEAKEST at Weak rating/6th strongest of 9 levels:
- Asset Management (48 stocks)
- Credit Services (22 stocks)
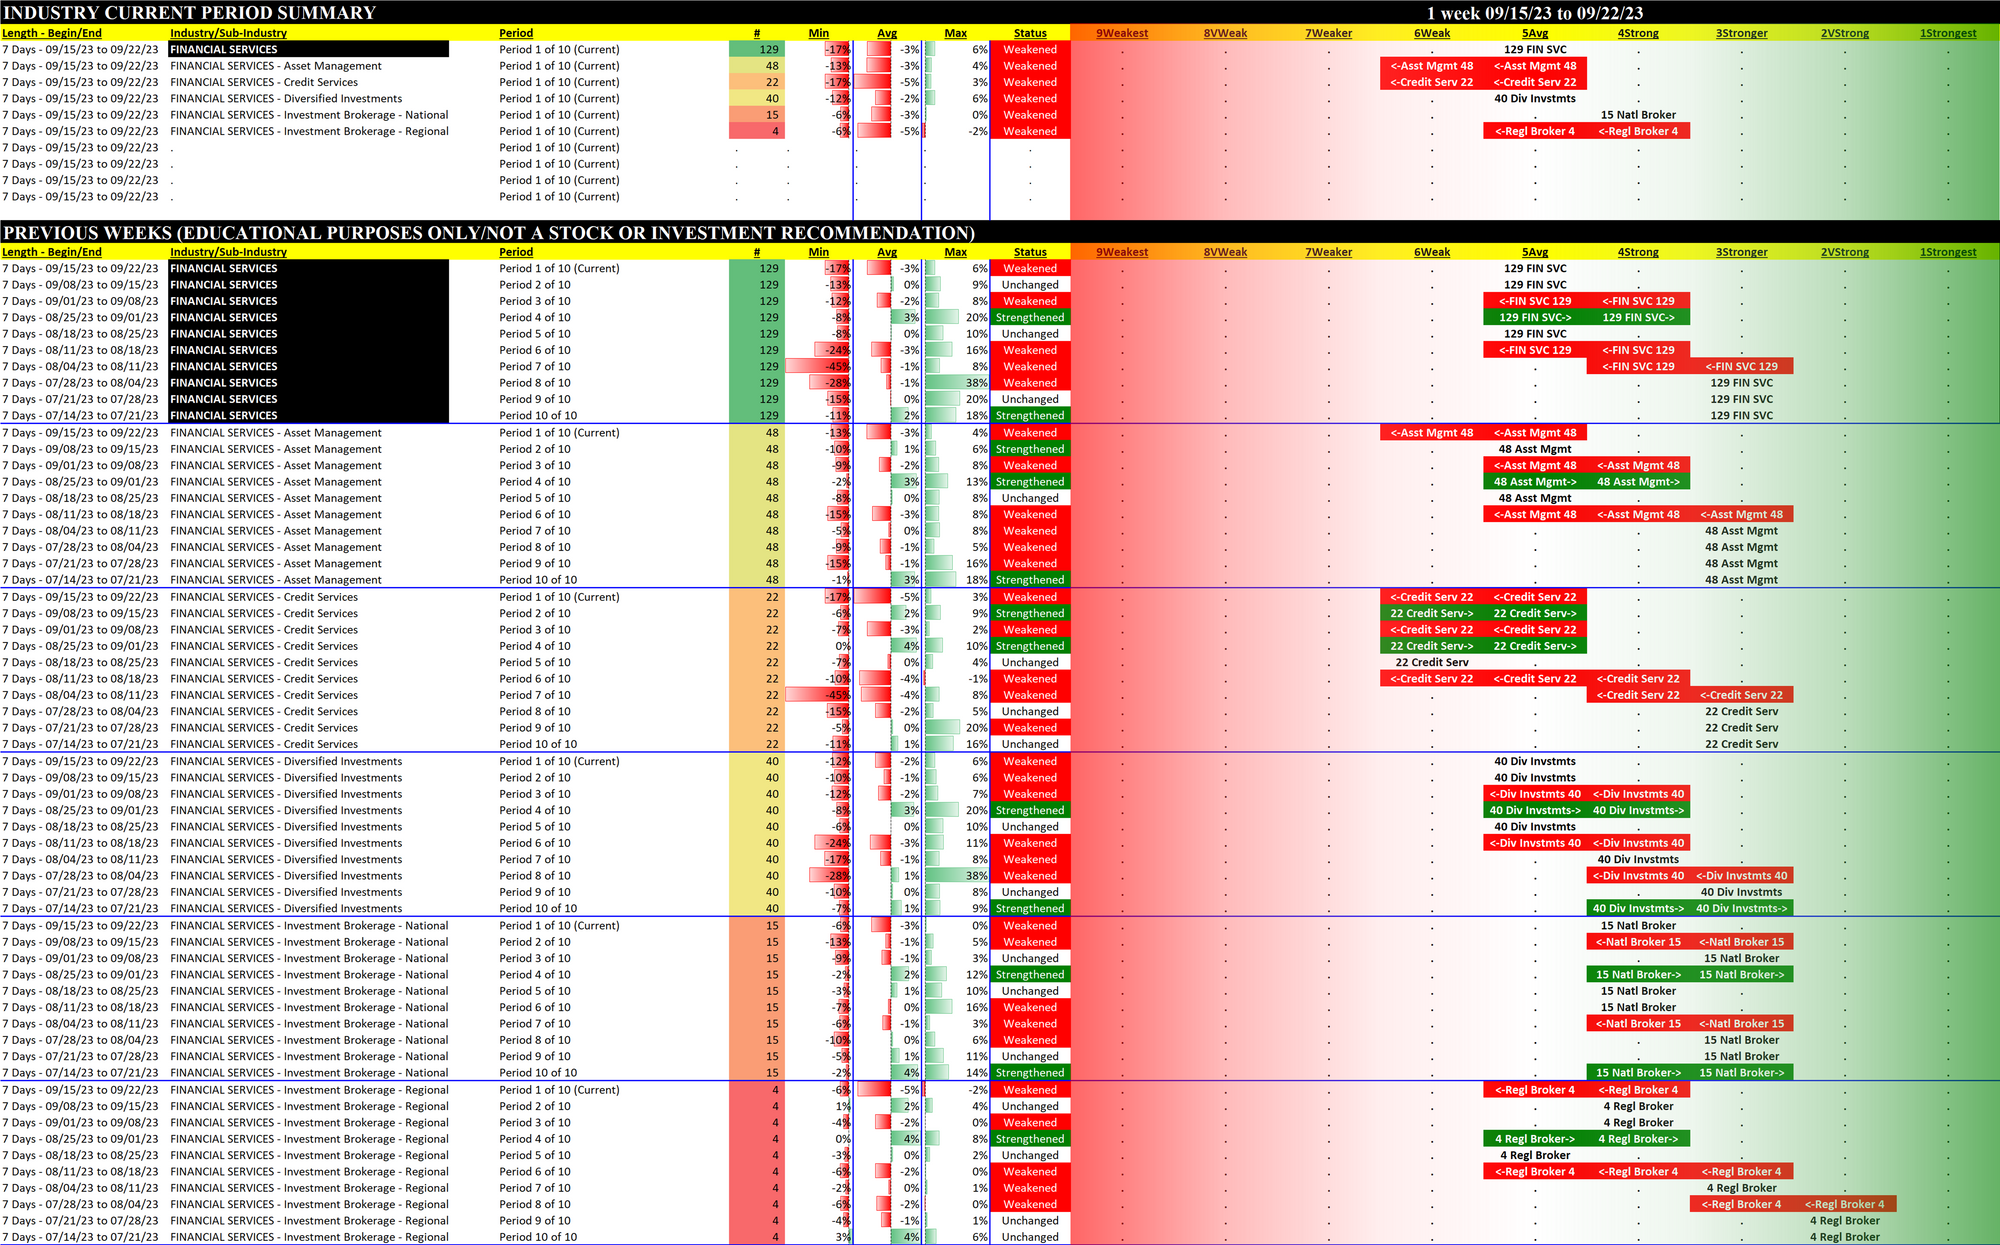
2B. Sub-Industries 10-Week Strengthening Analysis
What: recent week-by-week strength changes for the industry and each underlying sub-industry
Why: objective measurement of strengthening and weakening enabling comparison within and across industries and sub-industries
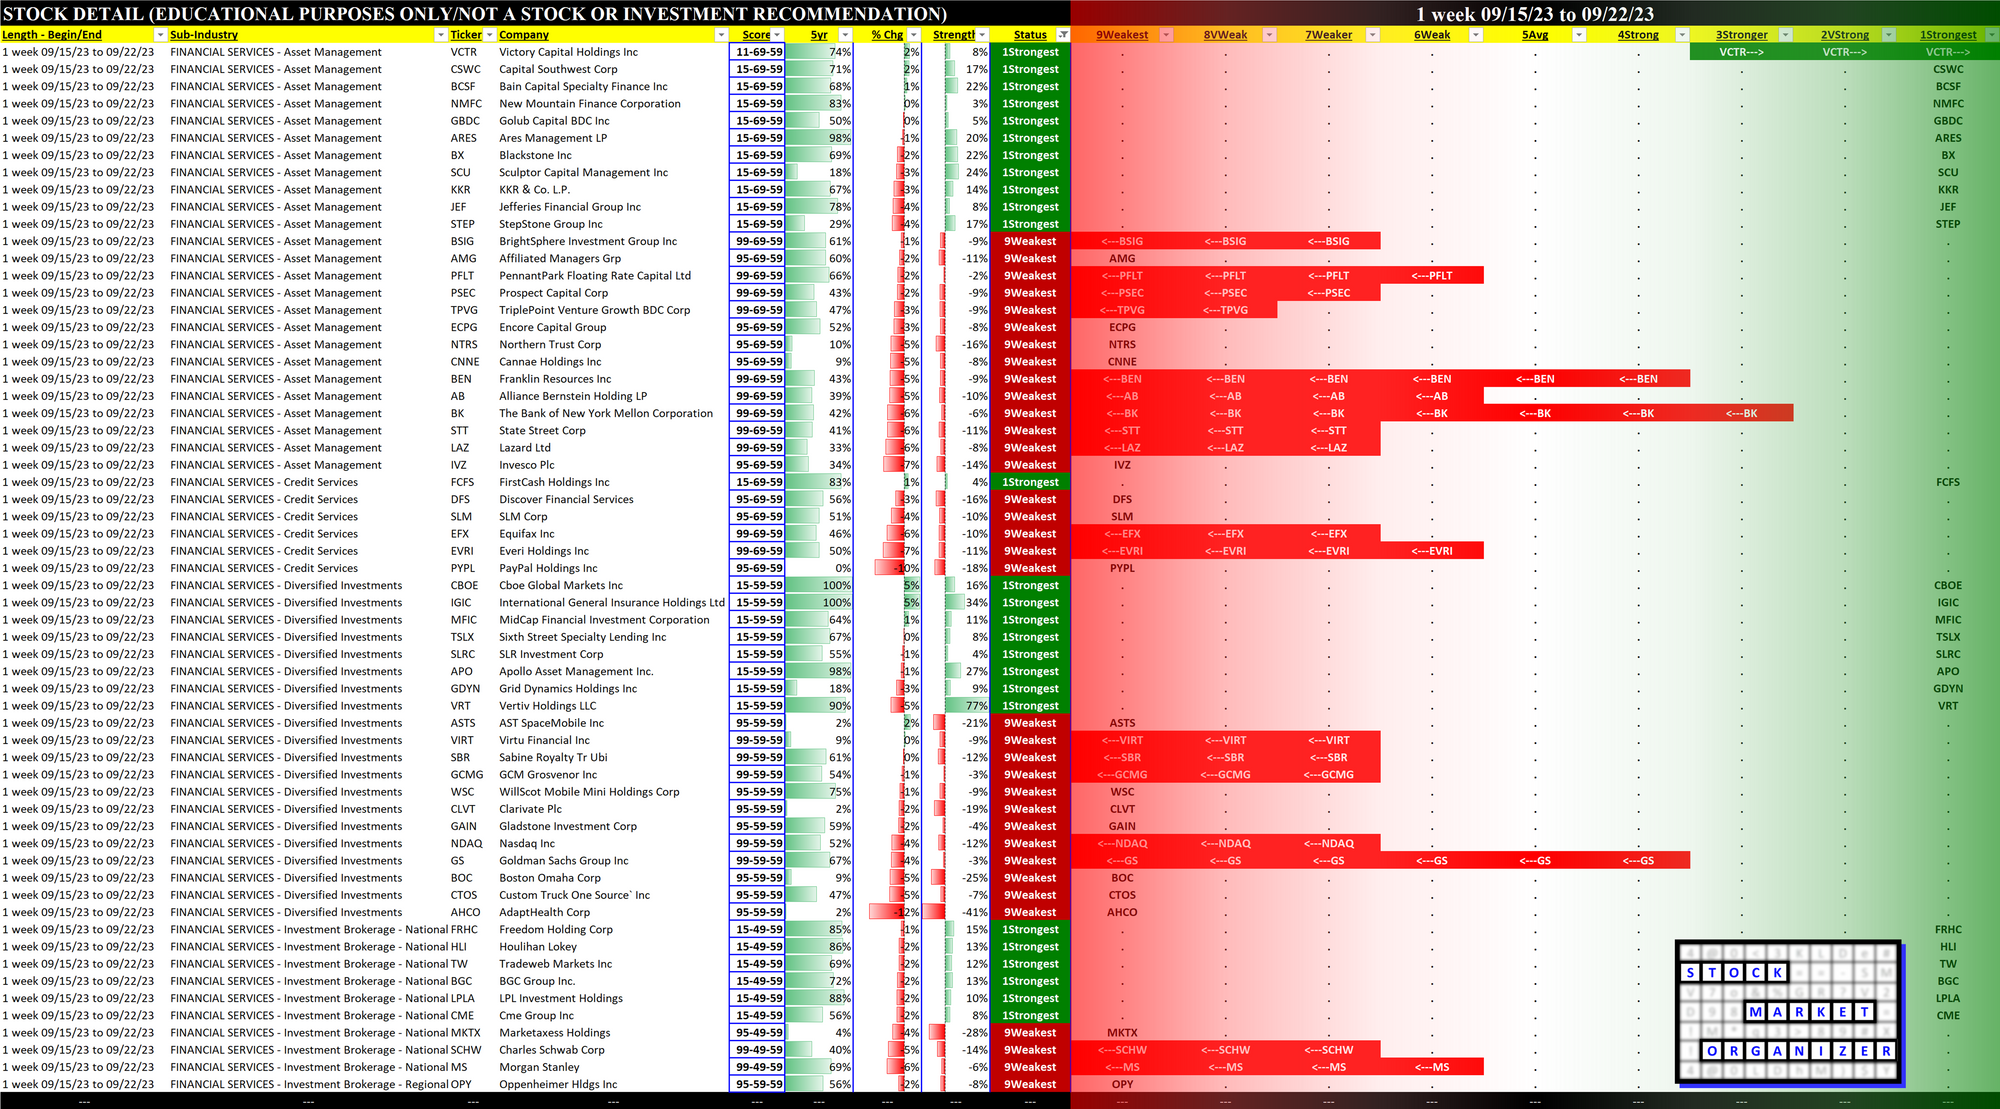
2C. Stocks 1 Week Strongest and Weakest
What: stocks currently rated Strongest/Weakest (highest/lowest of 9 strength ratings)
Why: most interesting stocks for available capital because
- the Strongest have the least amount of overhead supply to dampen breakouts while
- the Weakest may be prone to volatility, subject to big pops from bottom-fishing and short-covering BUT ALSO to bigger and faster falls.
(Not guaranteed and not a recommendation - weak stocks in weakening sub-industries may be better shorts than high-flyers.)
3. STRENGTH BY LOOKBACK PERIOD (with Best/Worst stocks)
3A. Lookback 6 Months
3B. Lookback 4 weeks
3C. Lookback 1 Week