Energy 2023-12-19: UP +1 to AVERAGE strength rating (5th strongest of 9 levels), previous move was DOWN
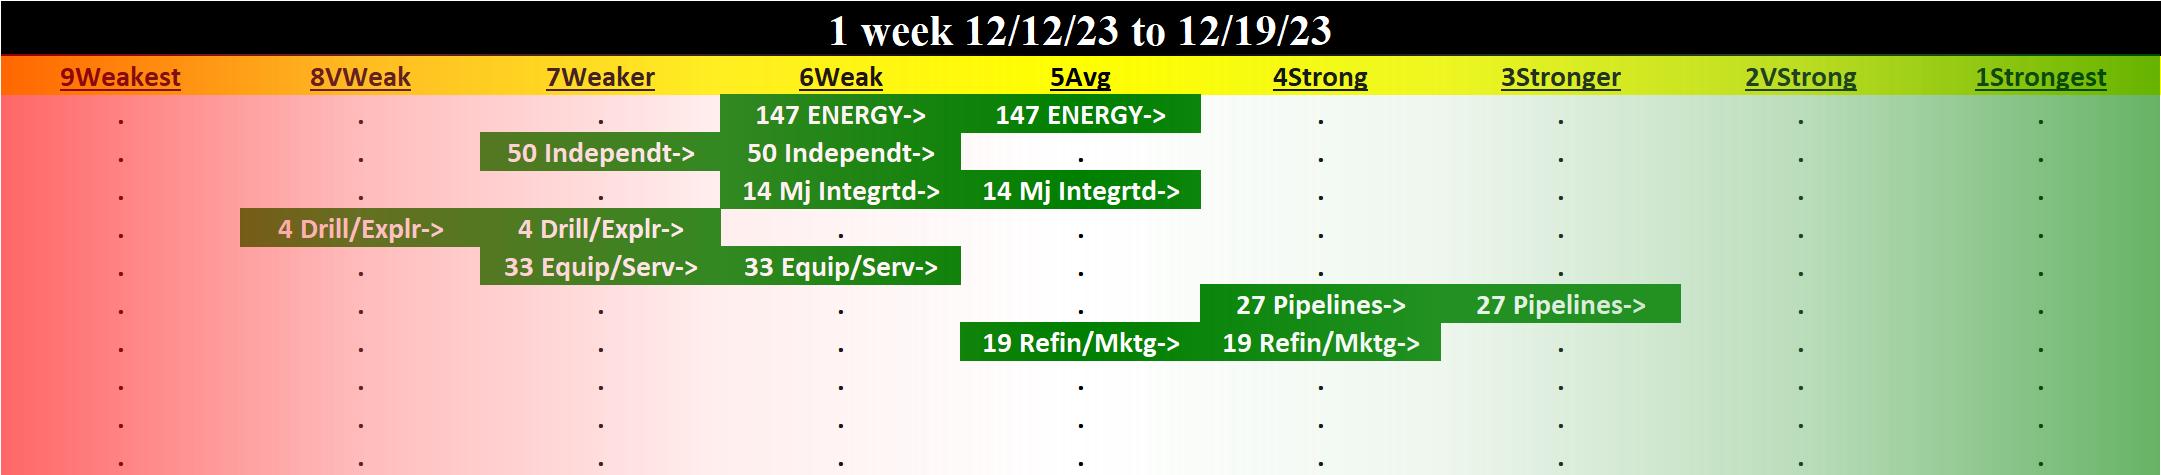
Energy comes to life, 1 week 96% positive stocks, 6/6 sub-industries strengthened, 20% stocks >10%.
Full details at downloadable file linked below.
What are you seeing here and why do you care? Partial listing:
🔹 An objective measurement of industry strengthening and weakening so you can objectively compare strength and weakness across/within industries and sub-industries.
🔹 A listing of stocks rated Strongest and Weakest (highest/lowest strength of 9 levels) by sub-industry, saving you significant time finding stocks that may be prone to making bigger moves faster. Stronger stocks have less overhead resistance, Weaker stocks are prone to “pops” from bargain hunting and short-covering yet due to preceding weakness are also prone to falling far and fast.
Background
Largest of 6 sub-industries (147 stocks, average 25):
- Independent Oil & Gas (50 stocks)
- Oil & Gas Equipment & Services (33 stocks)
- Oil & Gas Pipelines (27 stocks)
- Oil & Gas Refining & Marketing (19 stocks)
- Major Integrated Oil & Gas (14 stocks)
Top 10 Market Cap stocks: XOM/Exxon Mobil Corporation, CVX/Chevron Corp, TTE/TotalEnergies SE, COP/ConocoPhillips, BP/BP P.L.C., PBR/Petroleo Brasileiro S.A. Petrobras ADS, EQNR/Equinor ASA, SLB/Schlumberger Ltd, CNQ/Canadian Natural Res Ltd, EOG/Eog Resources Inc.
Details
🔹 21% Strongest Stocks, 23% Weakest Stocks.
🔹 STRENGTHENING 1 Week vs. Mid- and Longer-Term // 1 week positive/negative stocks ratio is HIGHER than both 4 weeks and 3 Months (96%/50%/37% positive)
🔹 Sub-industry Overview:
STRONGEST at Stronger rating/3rd strongest of 9 levels:
- Oil & Gas Pipelines (27 stocks)
WEAKEST at Weaker rating/7th strongest of 9 levels:
- Oil & Gas Drilling & Exploration (4 stocks)
🔹 Lookback Periods Comparison:
3 Months: 4% stocks >+20% and 10% stocks <-20%.
___UP most:
YPF +35% (Mj Integrtd)
AROC +31% (Equip/Serv)
SMLP +30% (Pipelines)
GLP +26% (Refin/Mktg)
SUN +22% (Refin/Mktg)
___DOWN most:
POET -75% (Drill/Explr)
BPT -58% (Independt)
NINE -42% (Equip/Serv)
NBR -32% (Equip/Serv)
PBT -31% (Independt)
4 weeks: 7% stocks >+10% and 5% stocks <-10%.
___UP most:
NINE +22% (Equip/Serv)
GLP +21% (Refin/Mktg)
KLXE +17% (Equip/Serv)
YPF +17% (Mj Integrtd)
BORR +16% (Equip/Serv)
___DOWN most:
SJT -24% (Independt)
SSL -17% (Mj Integrtd)
POET -17% (Drill/Explr)
PBT -16% (Independt)
CRK -15% (Independt)
1 Week: 20% stocks >+10% and 0% stocks <-10%.
___UP most:
KLXE +22% (Equip/Serv)
CPE +21% (Independt)
NINE +21% (Equip/Serv)
BORR +18% (Equip/Serv)
VET +18% (Independt)
___DOWN most:
DKL -6% (Pipelines)
SJT -5% (Independt)
CLMT -4% (Refin/Mktg)
EC -3% (Mj Integrtd)
DTM -1% (Pipelines)