Energy 2023-10-10: UP +1 to STRONG strength rating (4th strongest of 9 levels), previous move was DOWN
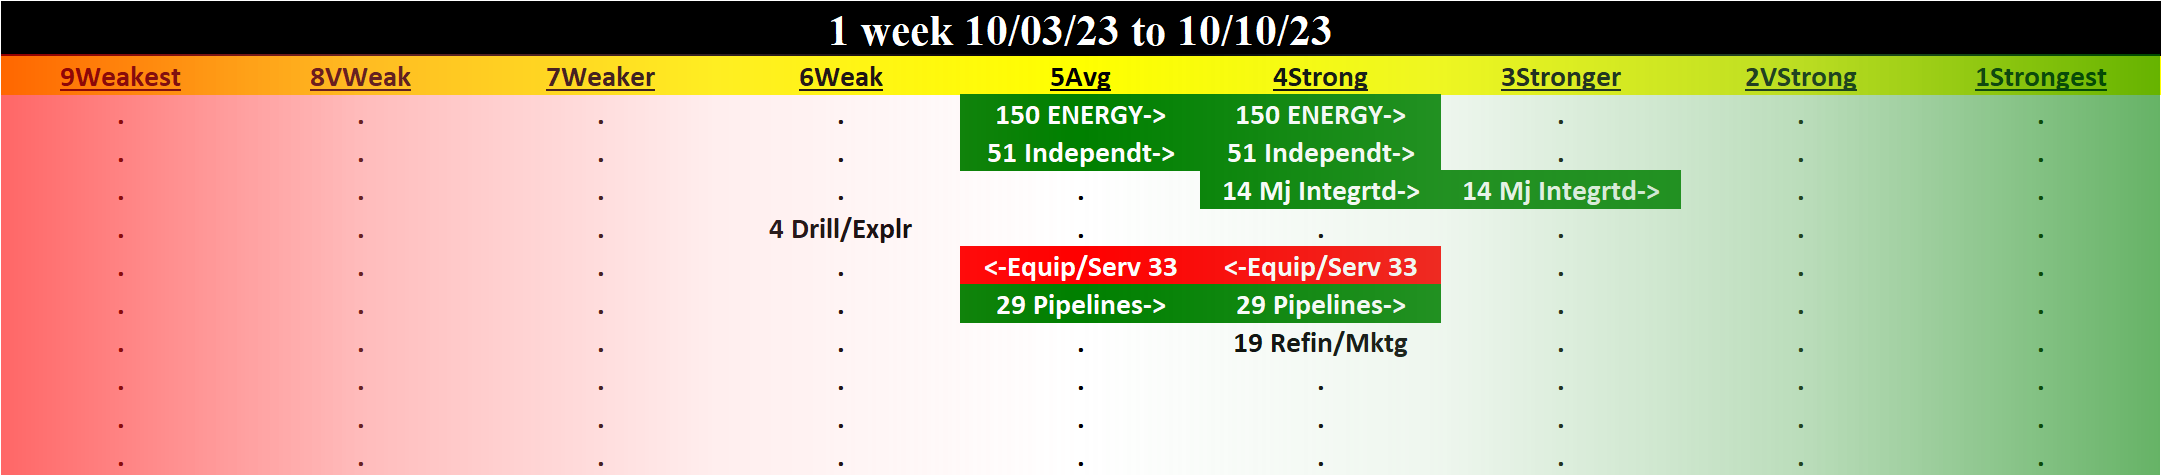
TABLE OF CONTENTS
- INDUSTRY OVERVIEW
1A. Performance
1B. Background - SUB-INDUSTRIES AND STOCKS DETAIL
2A. Sub-Industries Overview
2B. Sub-Industries 10-Week Strengthening Analysis
2C. Stocks 1 Week Strongest and Weakest - STRENGTH BY LOOKBACK PERIOD (with Best/Worst stocks)
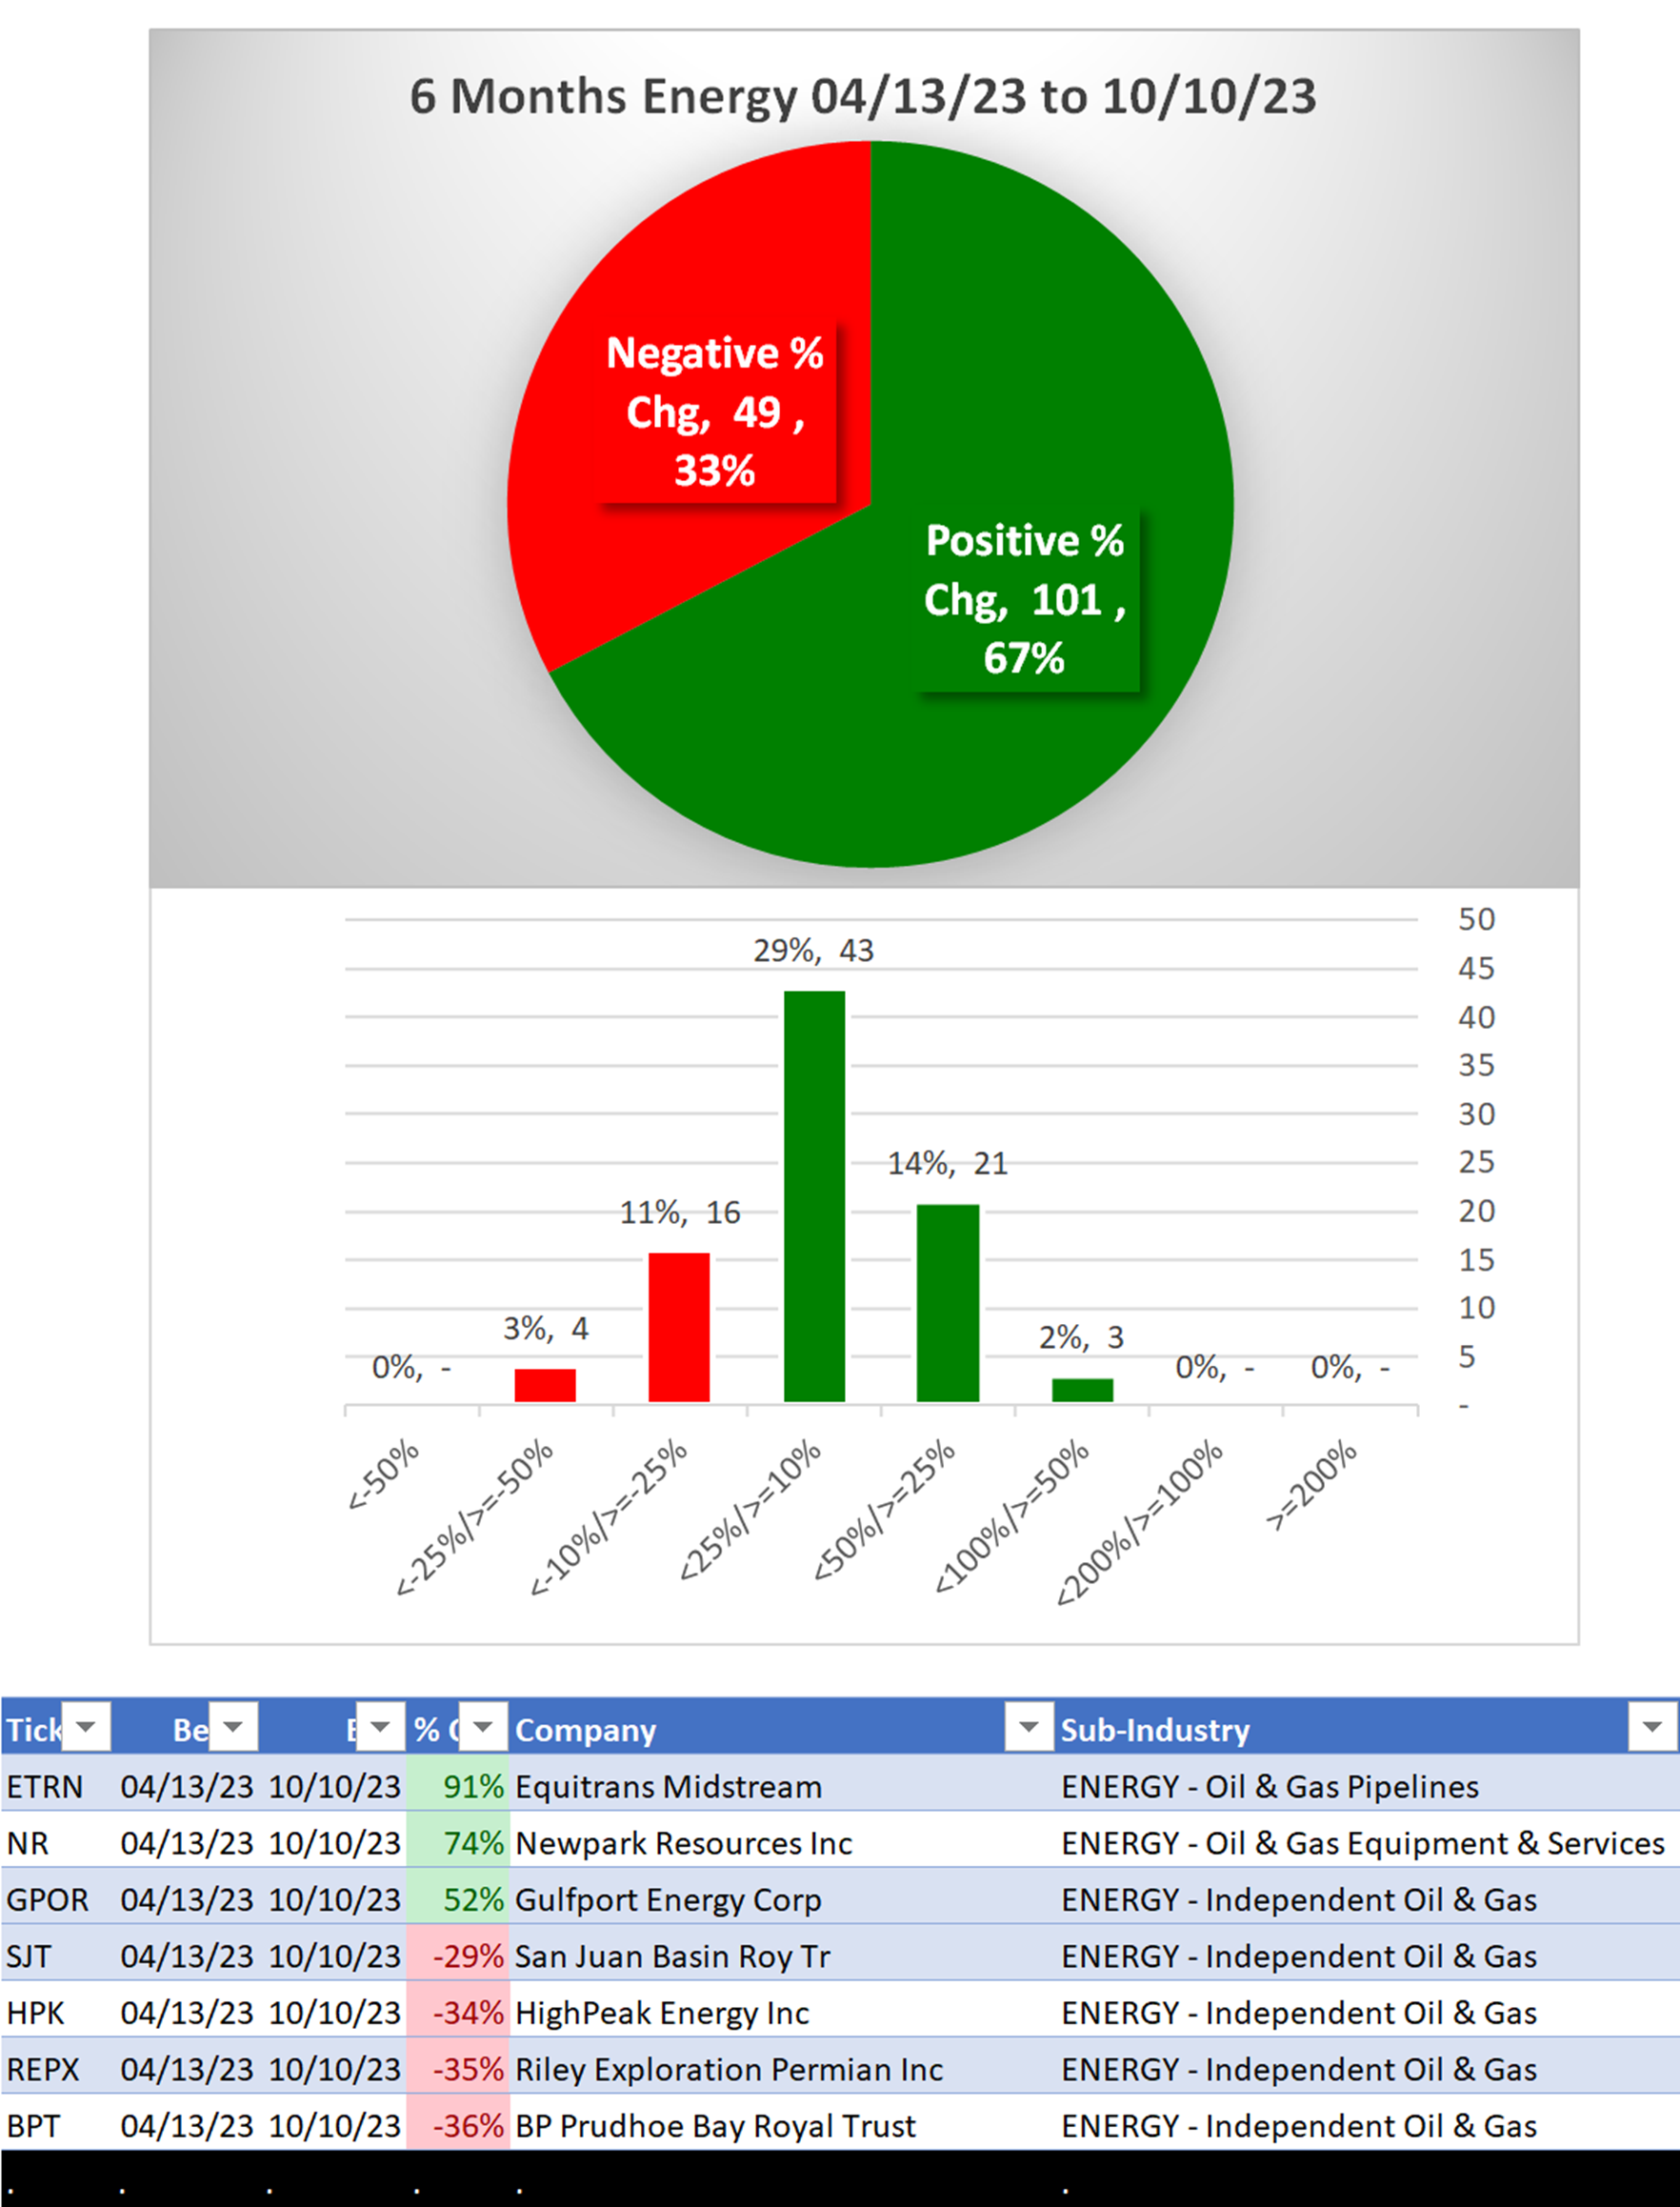
3A. Lookback 6 Months
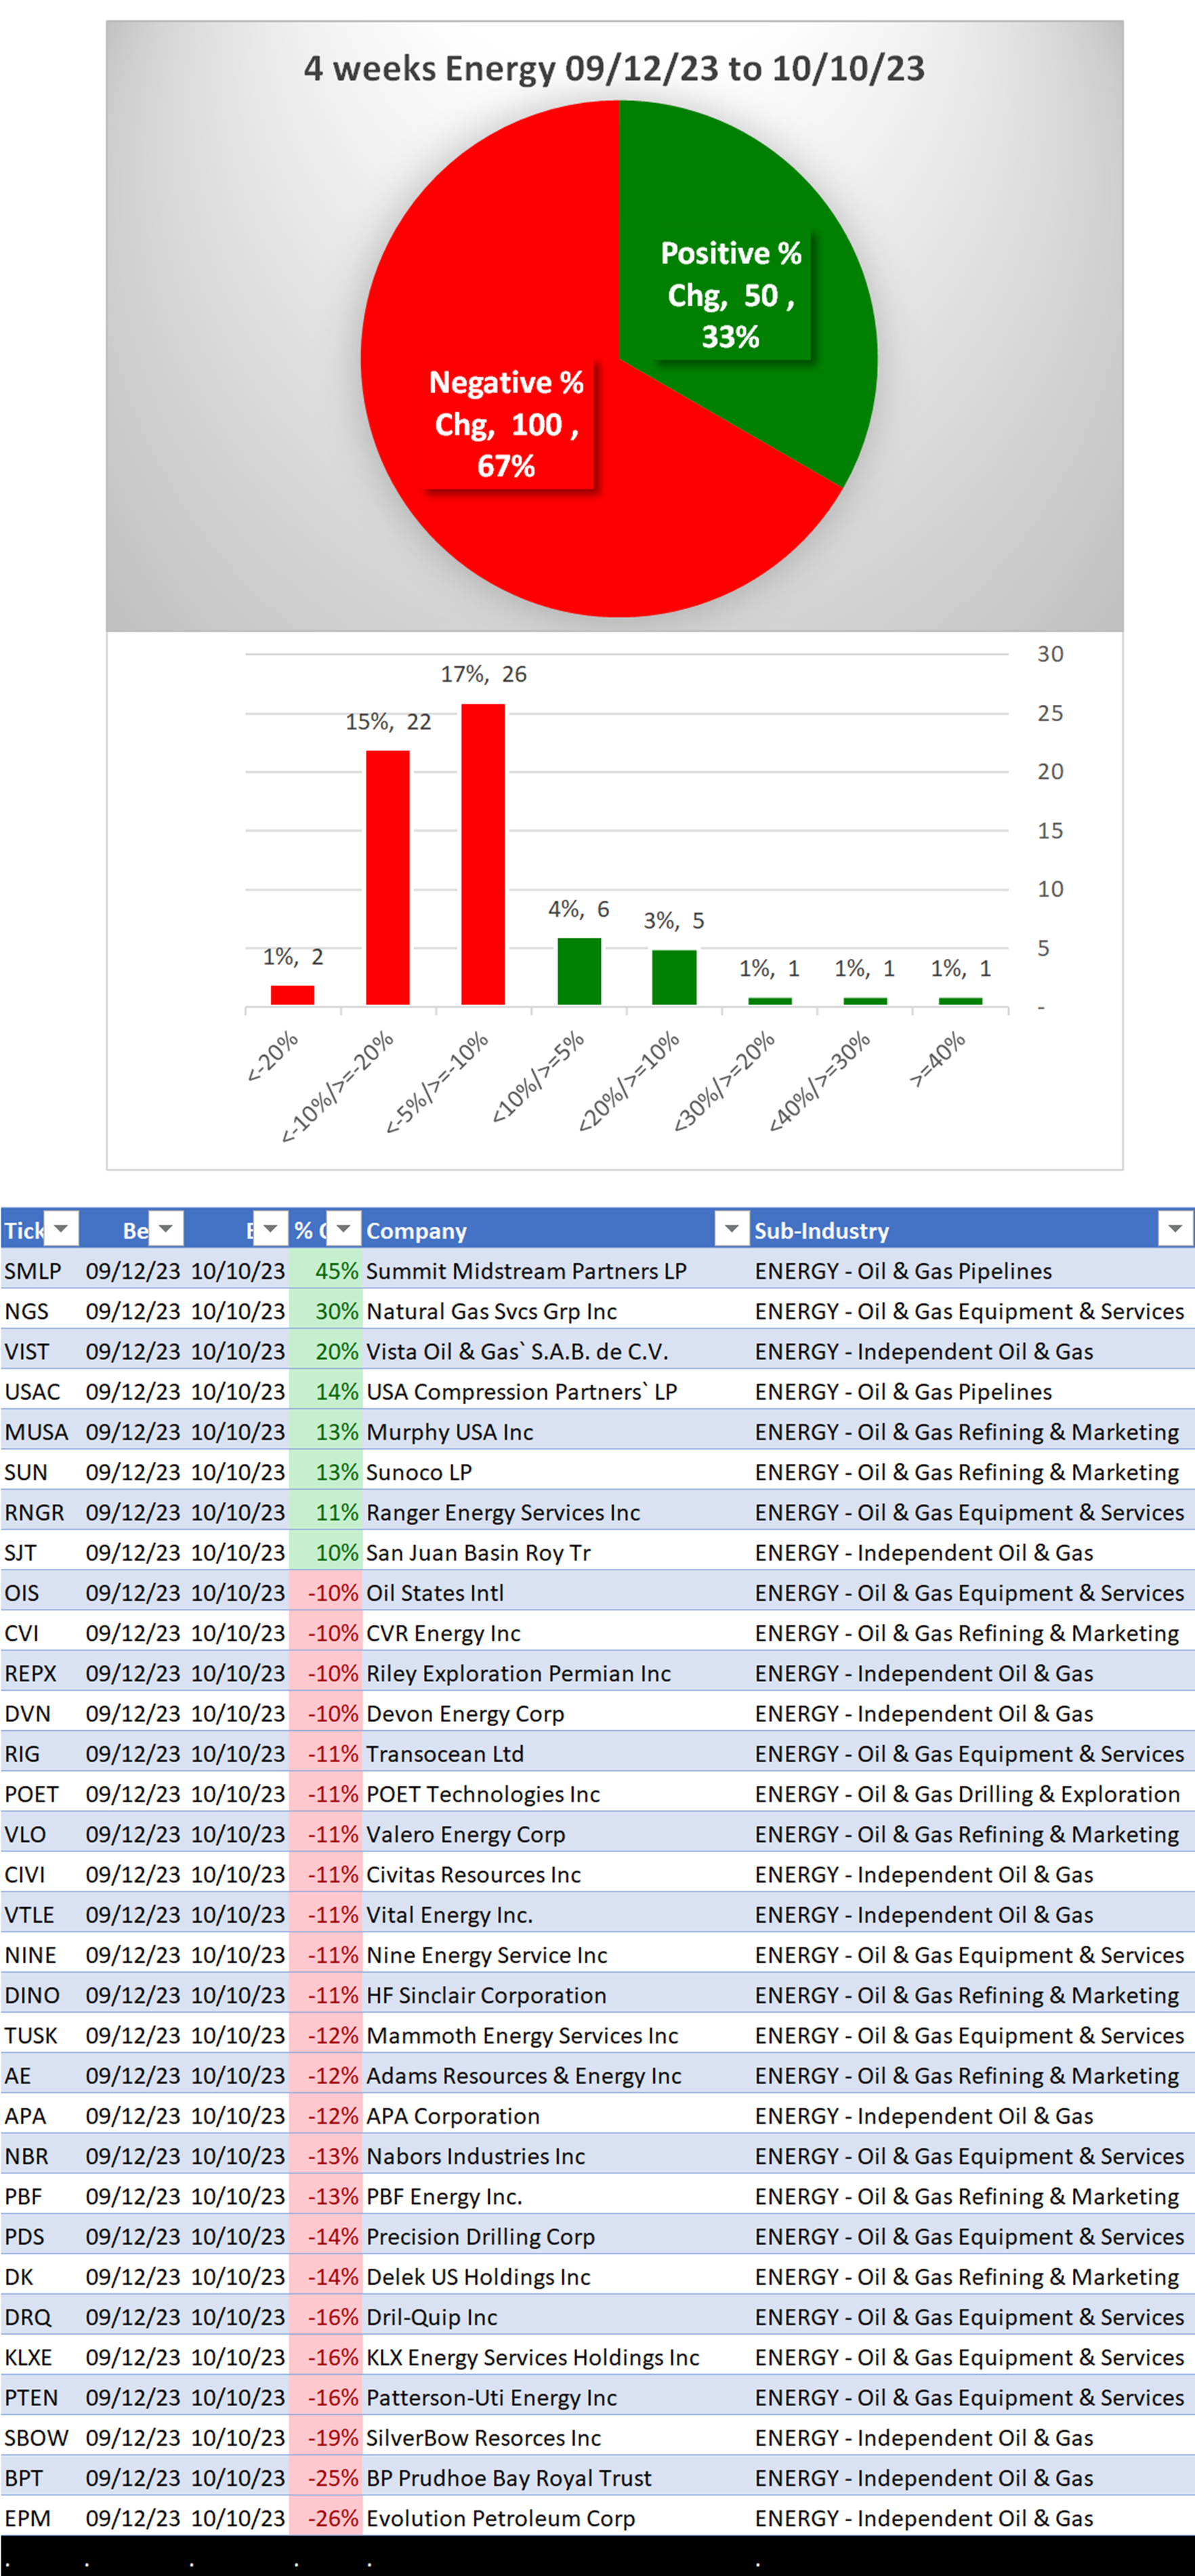
3B. Lookback 4 weeks
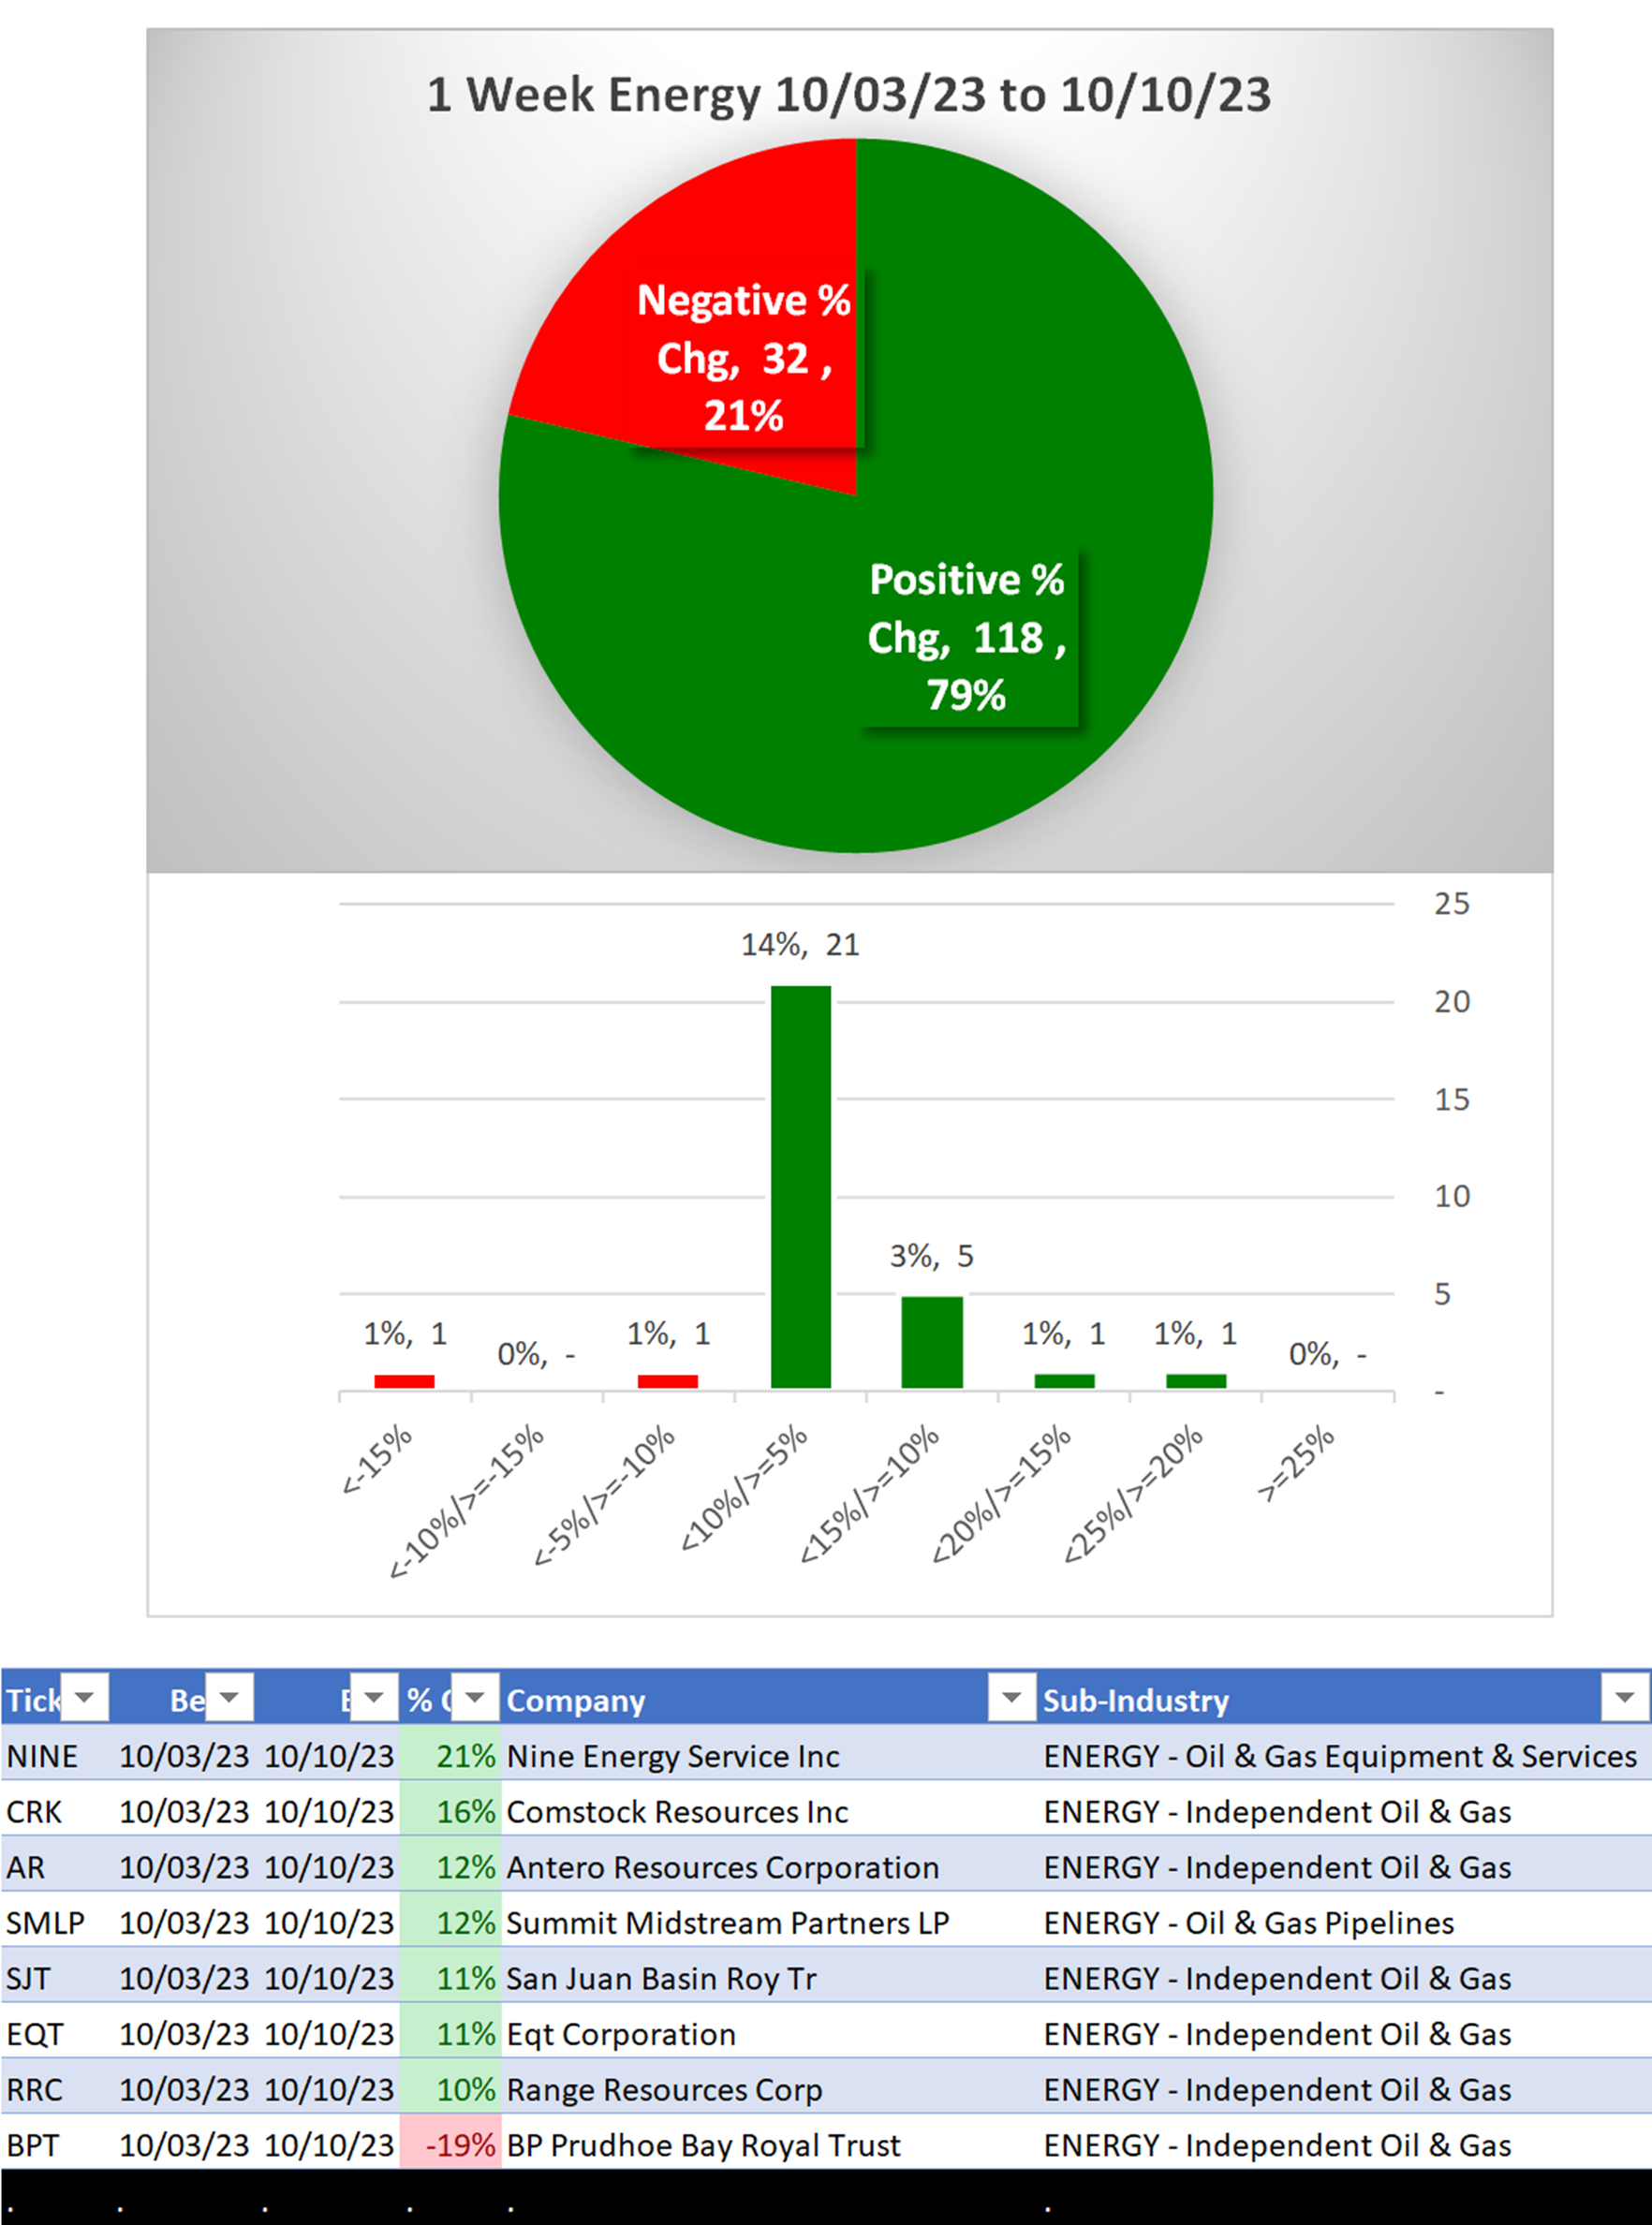
3C. Lookback 1 Week
1. INDUSTRY OVERVIEW
1A. Performance
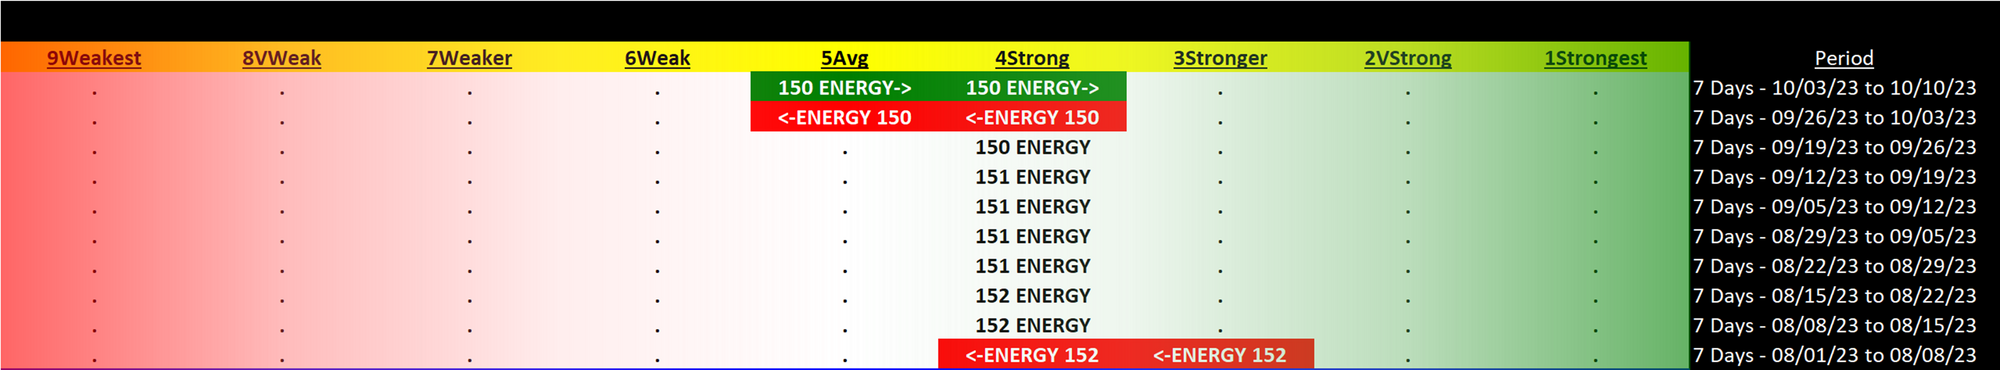
Past 10 Weeks Strengthening/Weakening week-by-week, per the following chart:
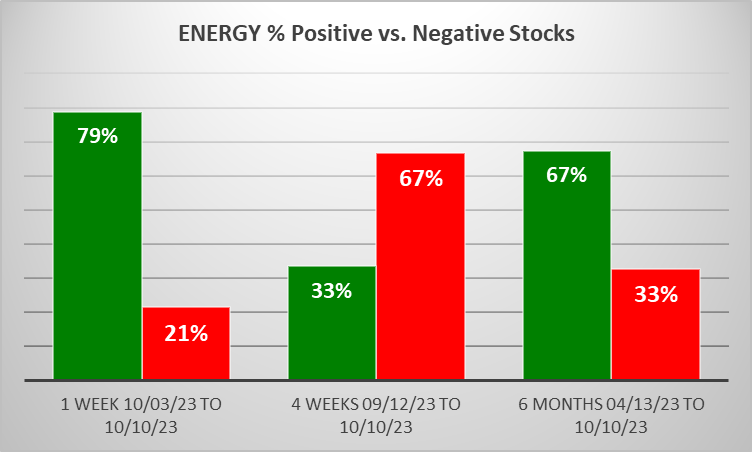
STRENGTHENING 1 Week vs. Mid- and Longer-Term // 1 week positive/negative stocks ratio is HIGHER than both 4 weeks and 6 Months, per the following chart:
1B. Background
Largest of 6 sub-industries (150 stocks, average 25):
- Independent Oil & Gas (51 stocks)
- Oil & Gas Equipment & Services (33 stocks)
- Oil & Gas Pipelines (29 stocks)
- Oil & Gas Refining & Marketing (19 stocks)
- Major Integrated Oil & Gas (14 stocks)
Top 10 by Market Capitalization:
XOM/Exxon Mobil Corporation, CVX/Chevron Corp, TTE/TotalEnergies SE, COP/ConocoPhillips, BP/BP P.L.C., PBR/Petroleo Brasileiro S.A. Petrobras ADS, SLB/Schlumberger Ltd, EQNR/Equinor ASA, EOG/Eog Resources Inc, CNQ/Canadian Natural Res Ltd
2. SUB-INDUSTRIES AND STOCKS DETAIL
2A. Sub-Industries Overview
Strengthened: 3/6 sub-industries
Weakened: 1/6 sub-industries
STRONGEST at Stronger rating/3rd strongest of 9 levels:
- Major Integrated Oil & Gas (14 stocks)
WEAKEST at Weak rating/6th strongest of 9 levels:
- Oil & Gas Drilling & Exploration (4 stocks)
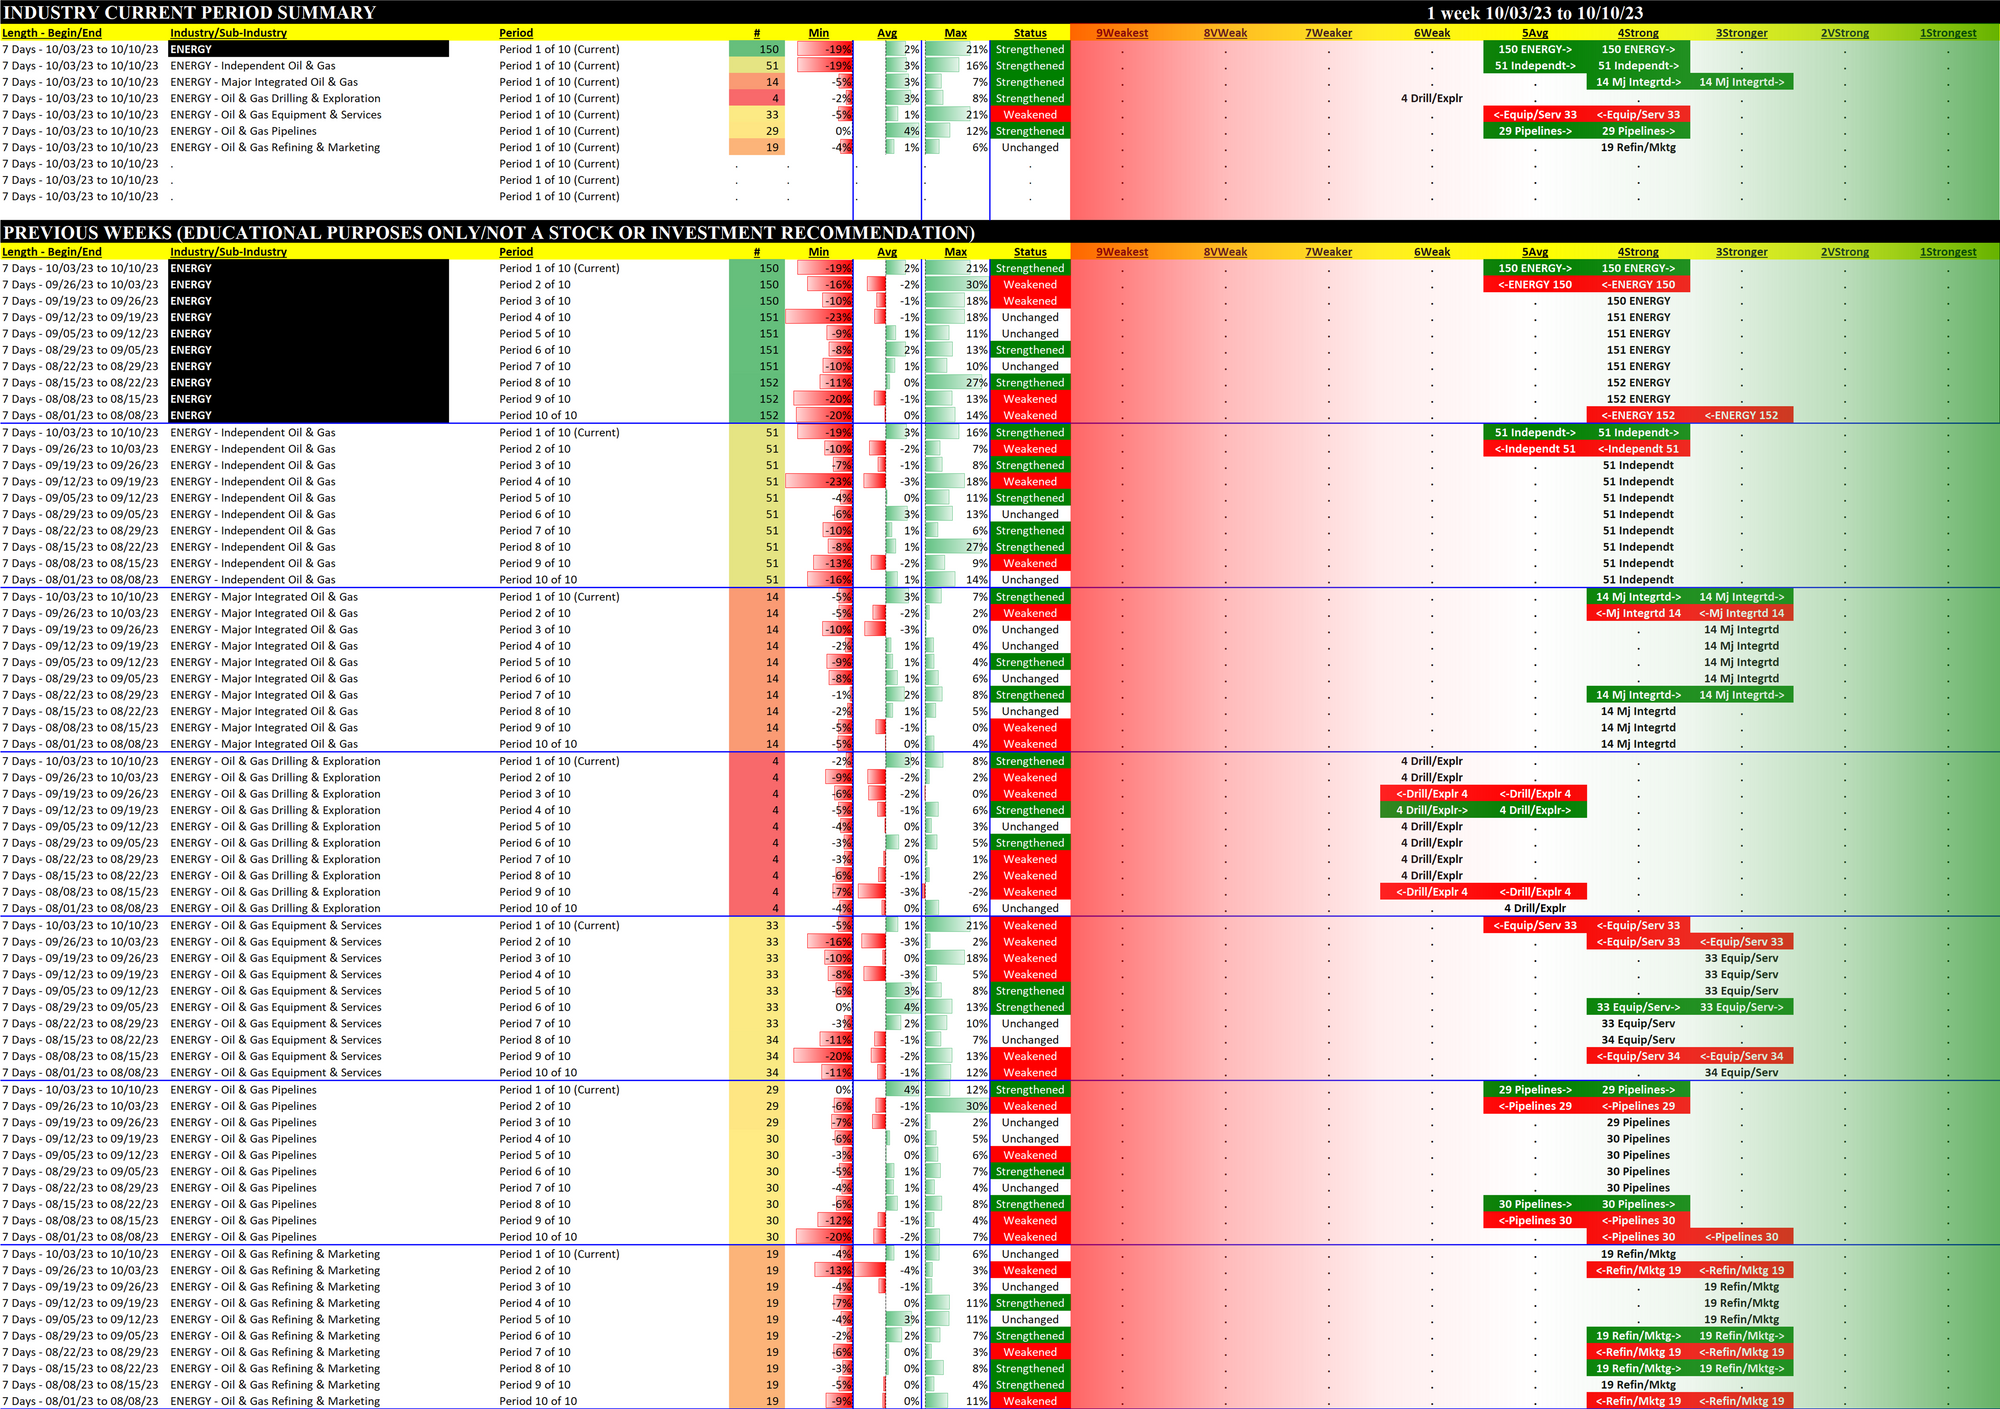
2B. Sub-Industries 10-Week Strengthening Analysis
What: recent week-by-week strength changes for the industry and each underlying sub-industry
Why: objective measurement of strengthening and weakening enabling comparison within and across industries and sub-industries
2C. Stocks 1 Week Strongest and Weakest
What: stocks currently rated Strongest/Weakest (highest/lowest of 9 strength ratings)
Why: most interesting stocks for available capital because
- the Strongest have the least amount of overhead supply to dampen breakouts while
- the Weakest may be prone to volatility, subject to big pops from bottom-fishing and short-covering BUT ALSO to bigger and faster falls.
(Not guaranteed and not a recommendation - weak stocks in weakening sub-industries may be better shorts than high-flyers.)
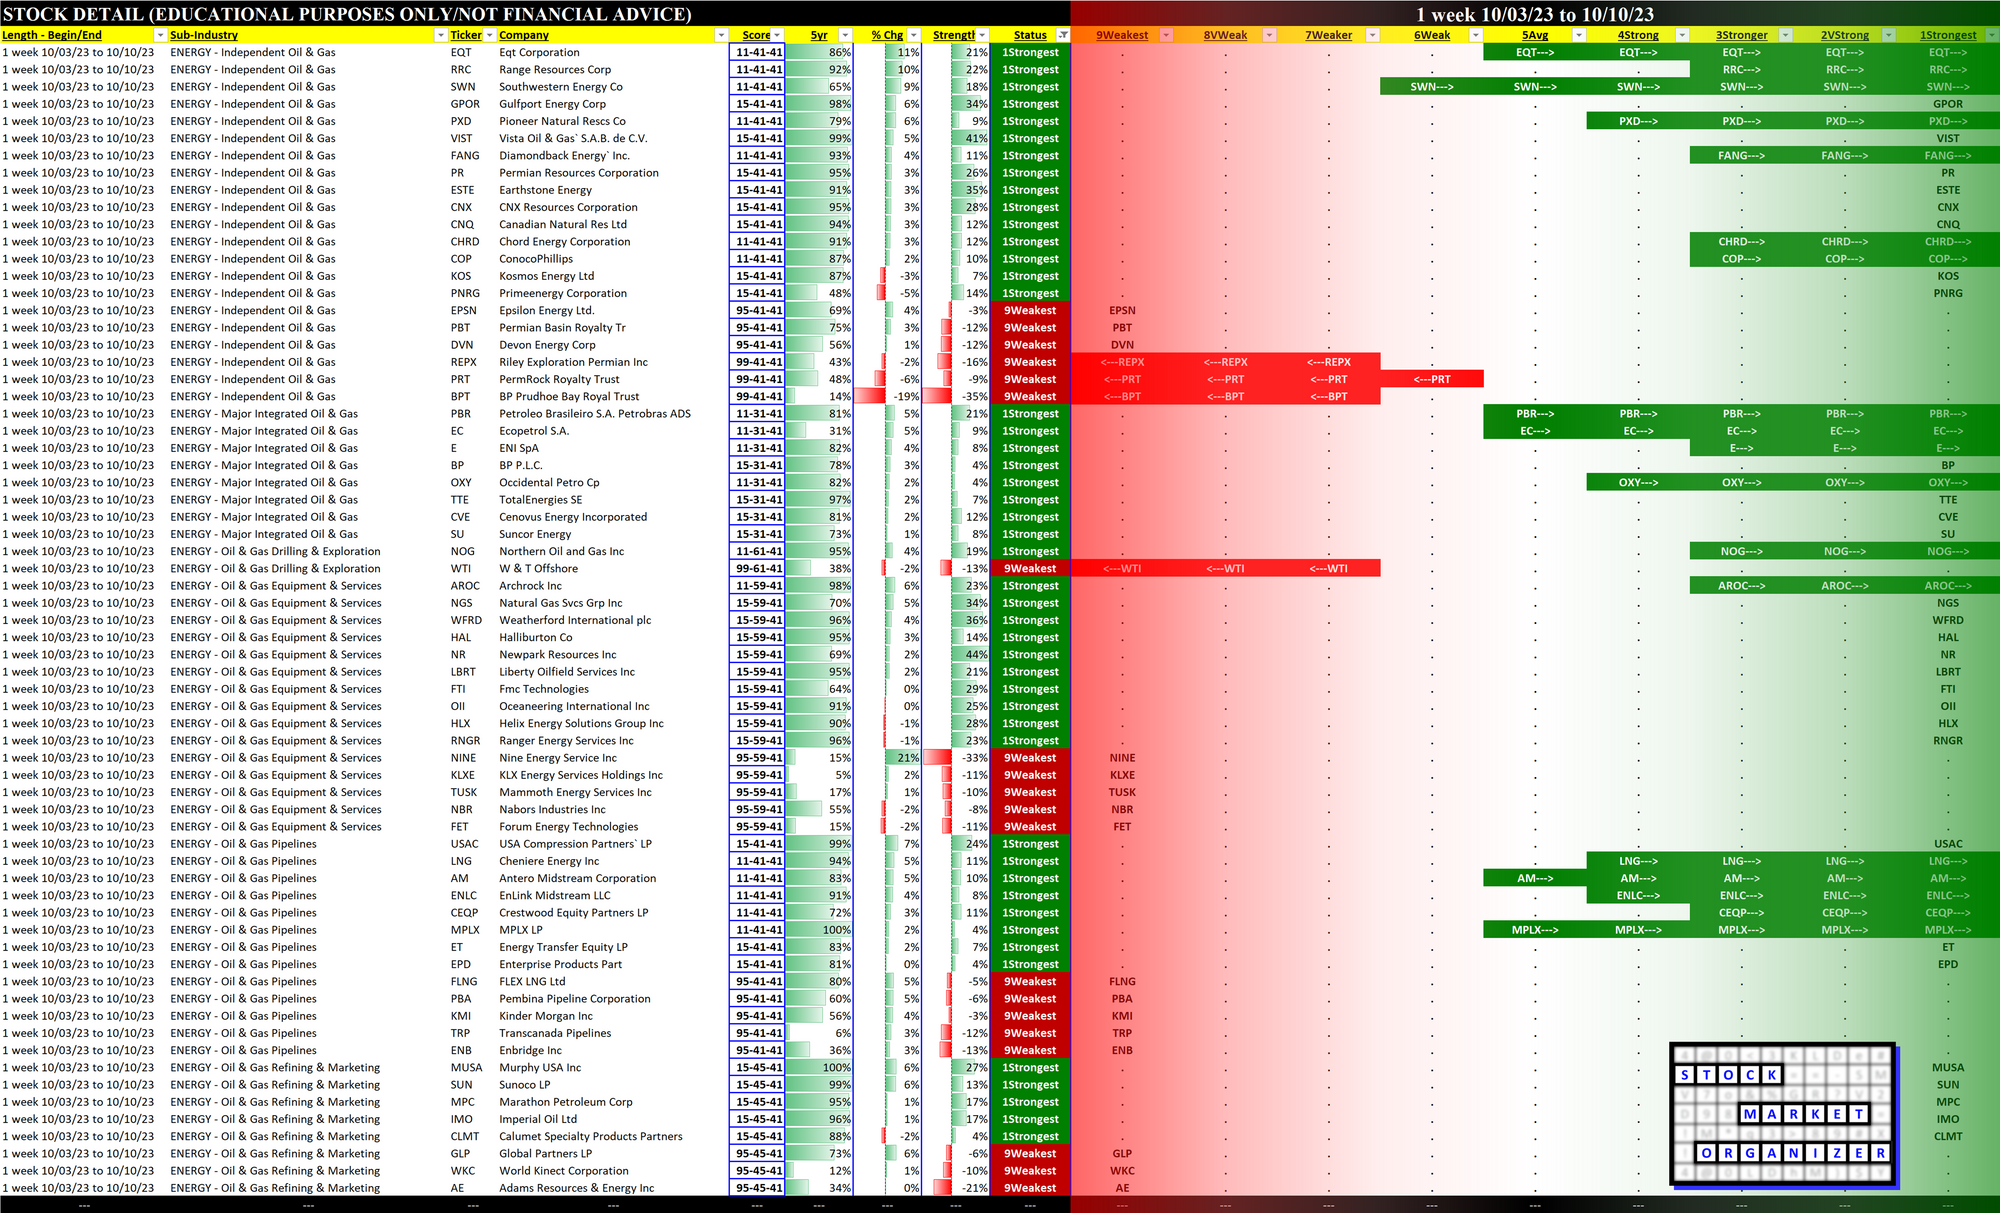
Strongest to Weakest stocks ratio is 47:20 (31% and 13% of total) 10/03/23 to 10/10/23.
3. STRENGTH BY LOOKBACK PERIOD (with Best/Worst stocks)
3A. Lookback 6 Months
3B. Lookback 4 weeks
3C. Lookback 1 Week