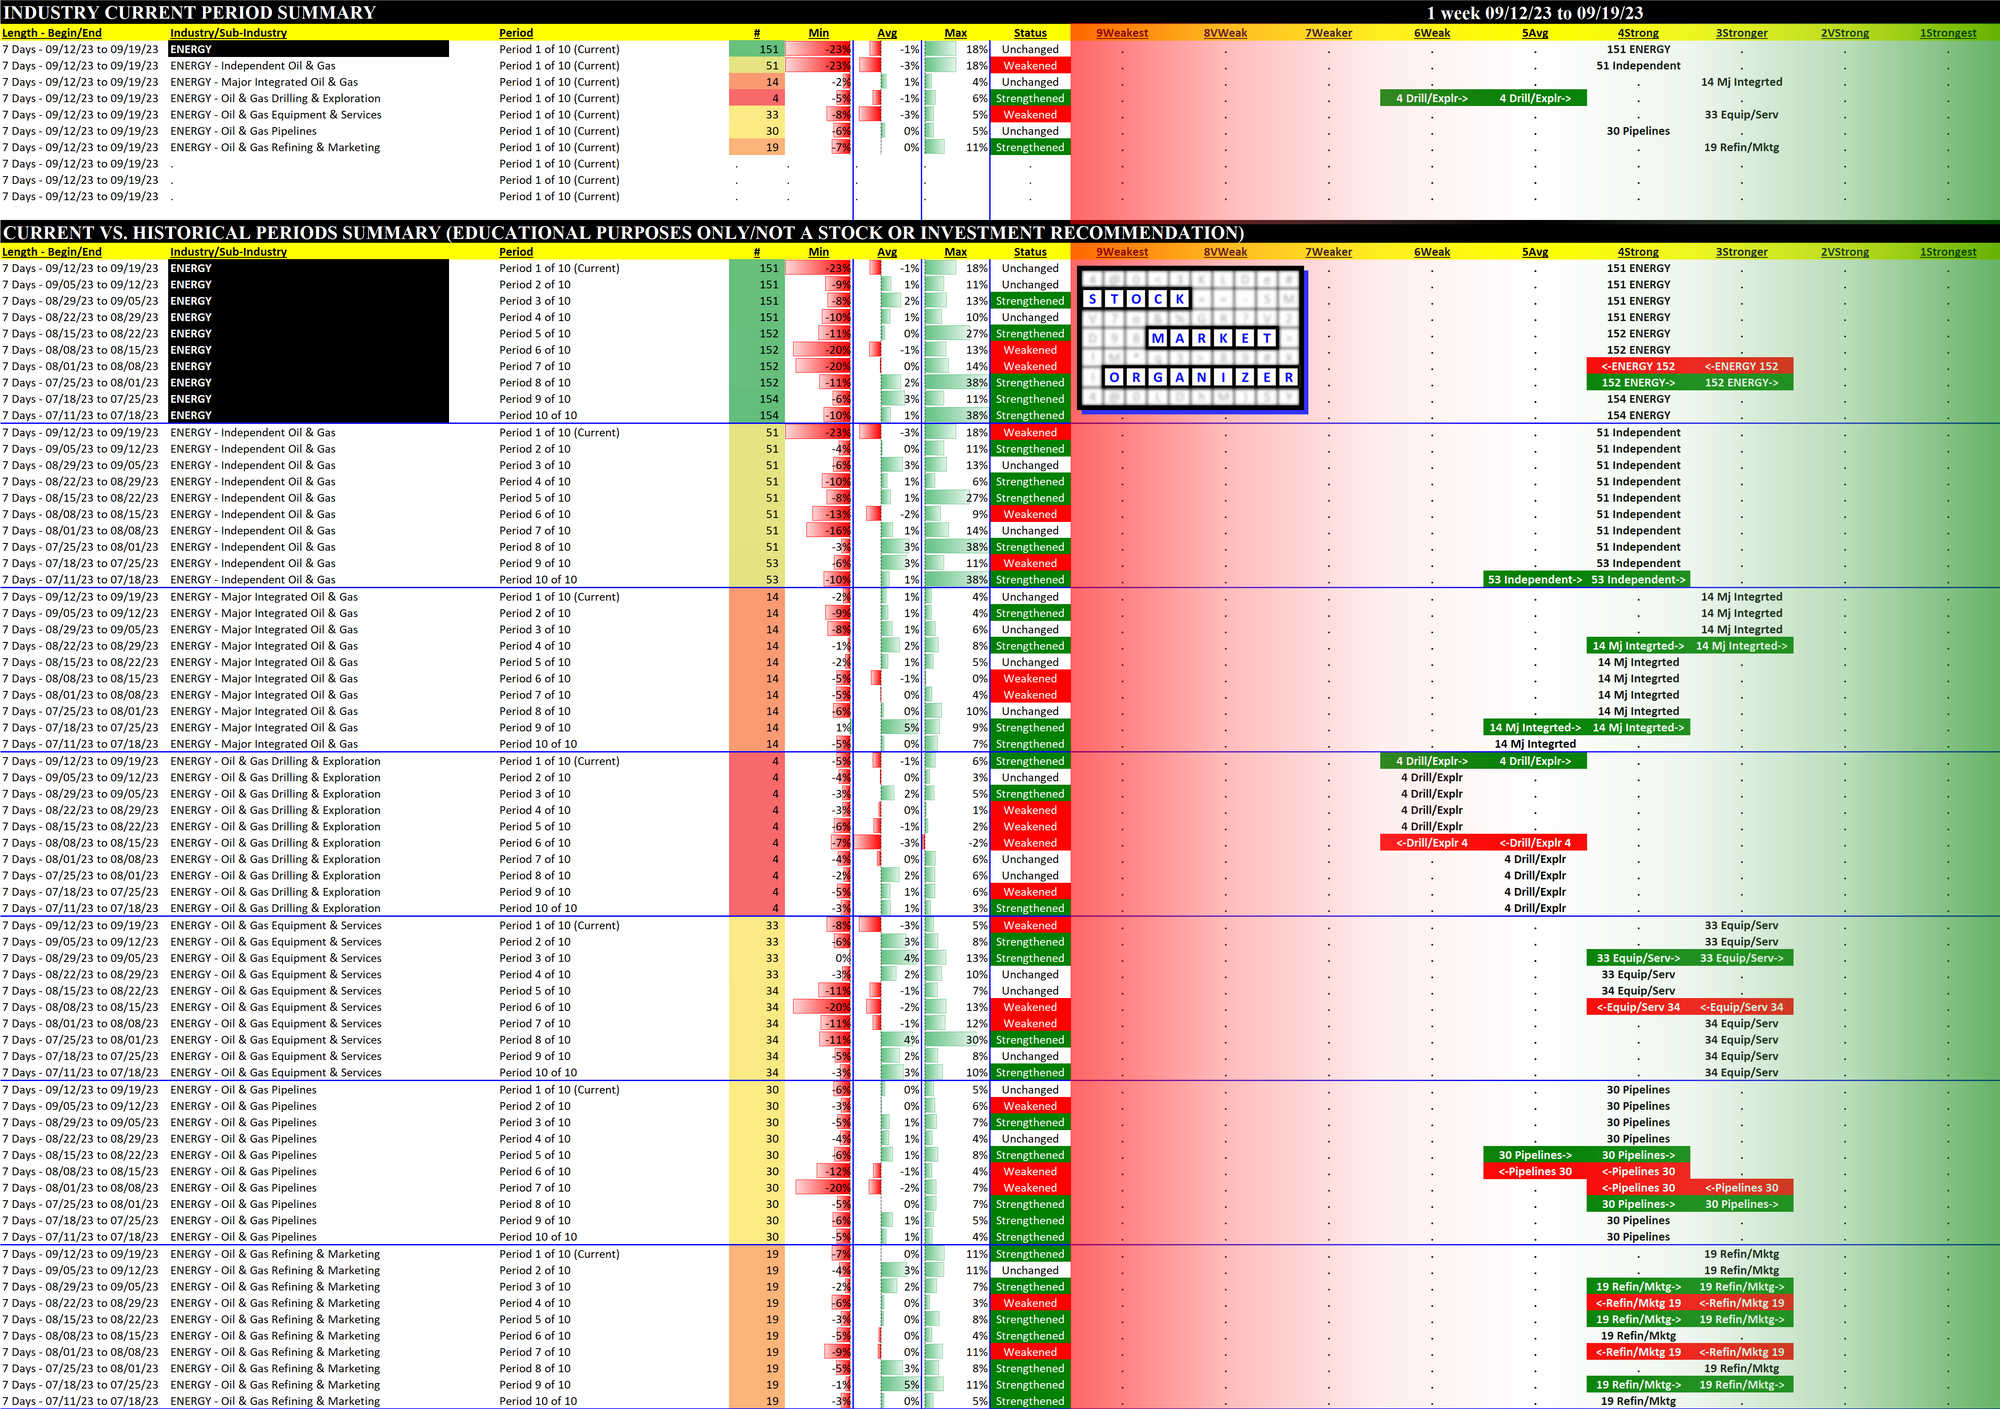
Energy 2023-09-19: Unchanged at STRONG strength rating (4th strongest of 9 levels), previous move was DOWN
SUMMARY
Performance
Bottom Line: has remained Strong or better for 10 weeks
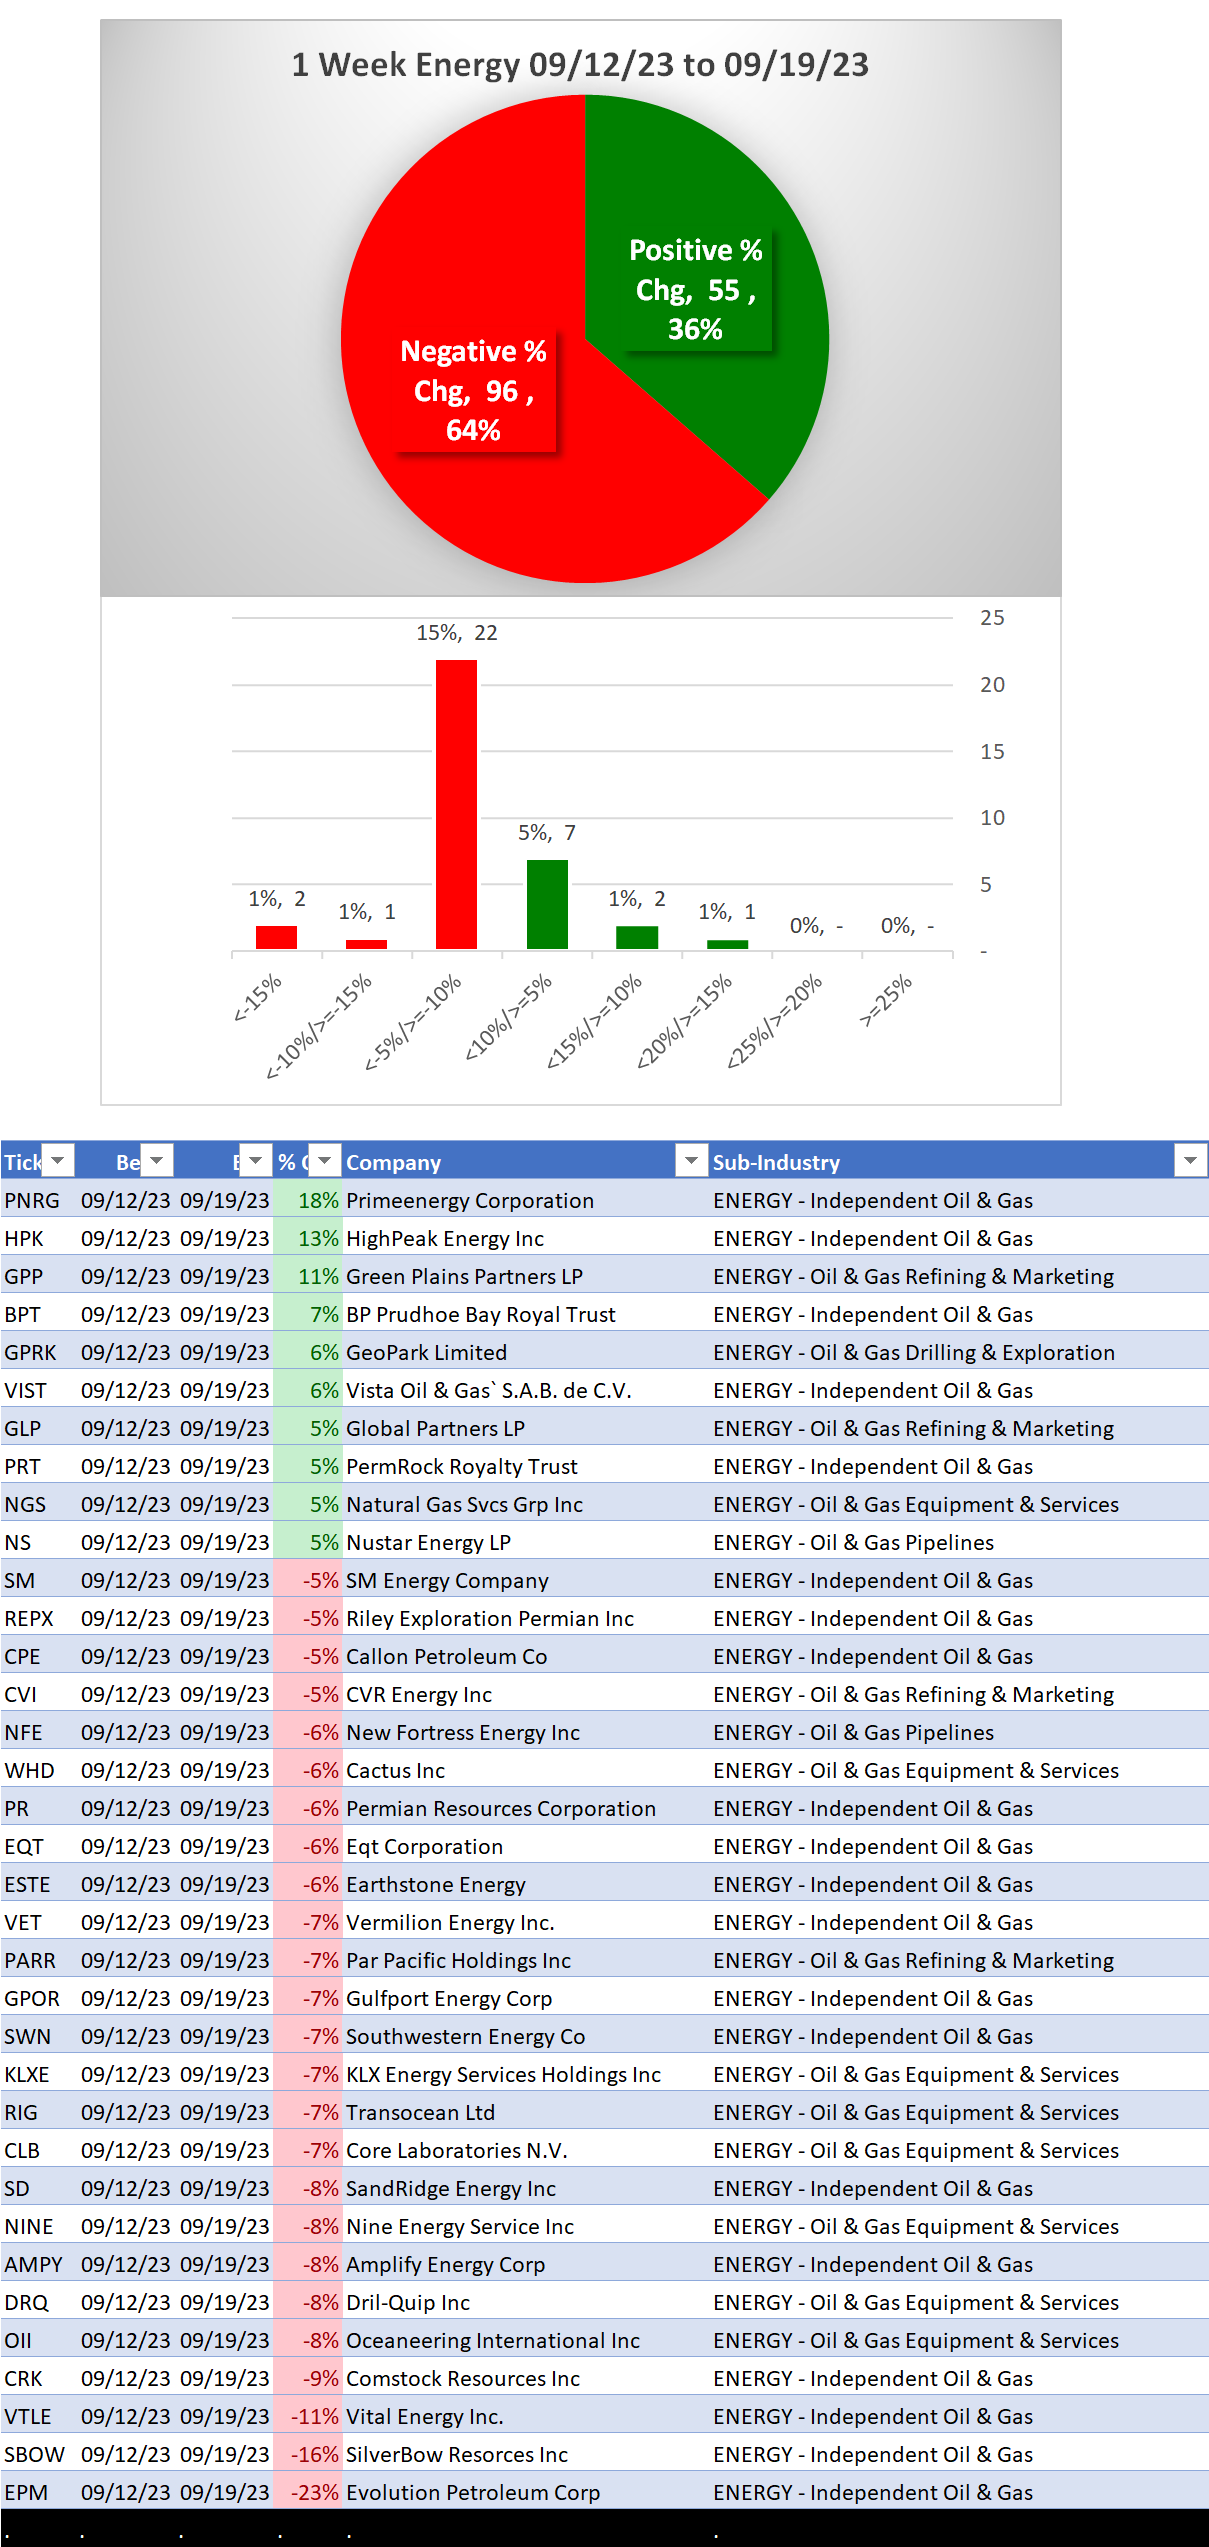
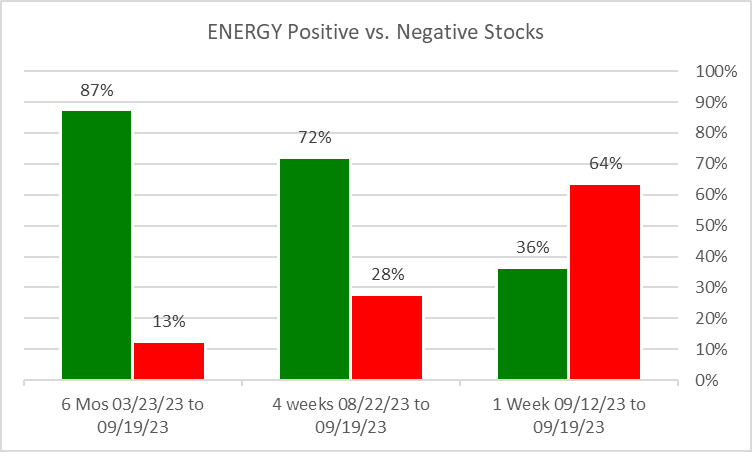
Context: weakening short term vs. mid-term and longer-term. Positive stocks 1 week are half what they have been for the past 4 weeks.
Other Notes:
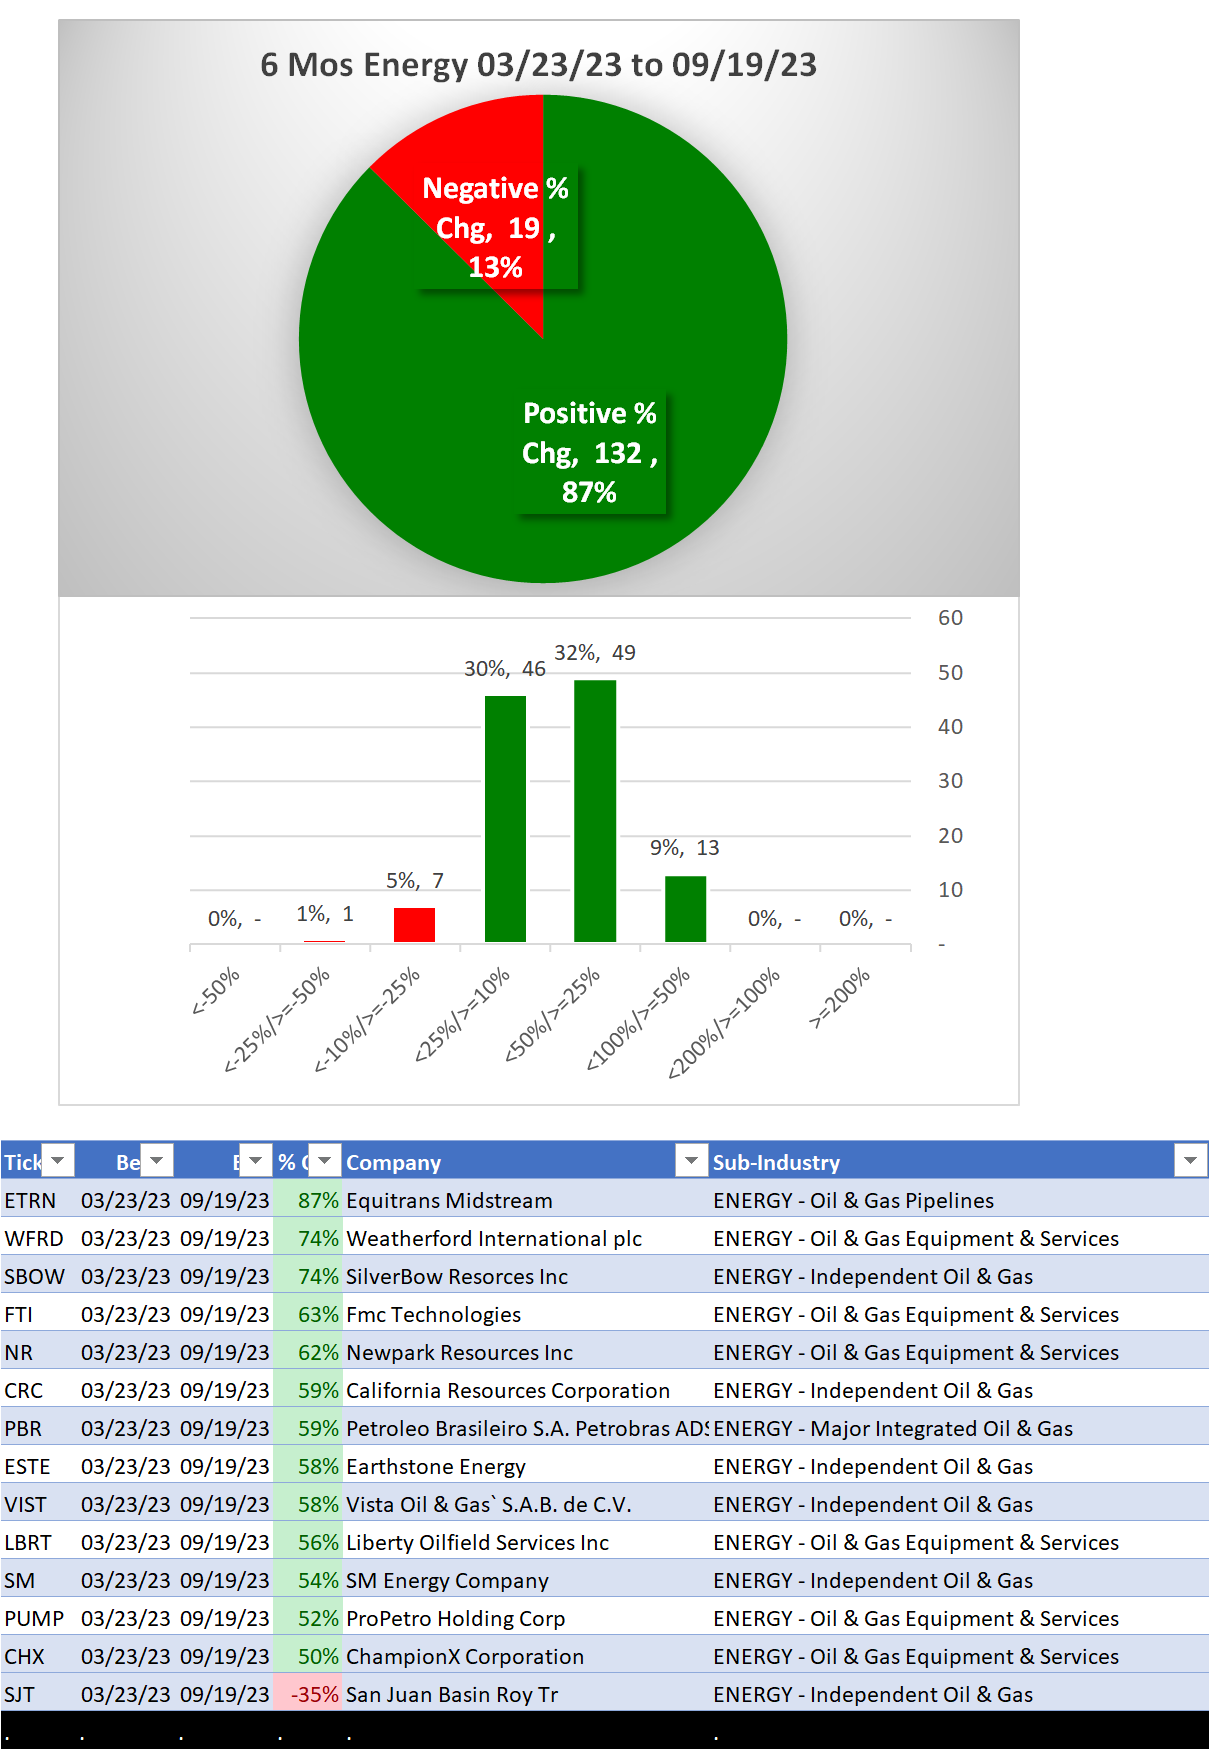
6 months
ETRN/Equitrans Midstream (Oil & Gas Pipelines) +87%
WFRD/Weatherford International plc (Oil & Gas Equipment & Services) +74%
SBOW/SilverBow Resorces Inc (Independent Oil & Gas) +74%
SJT/San Juan Basin Roy Tr (Independent Oil & Gas) -35%
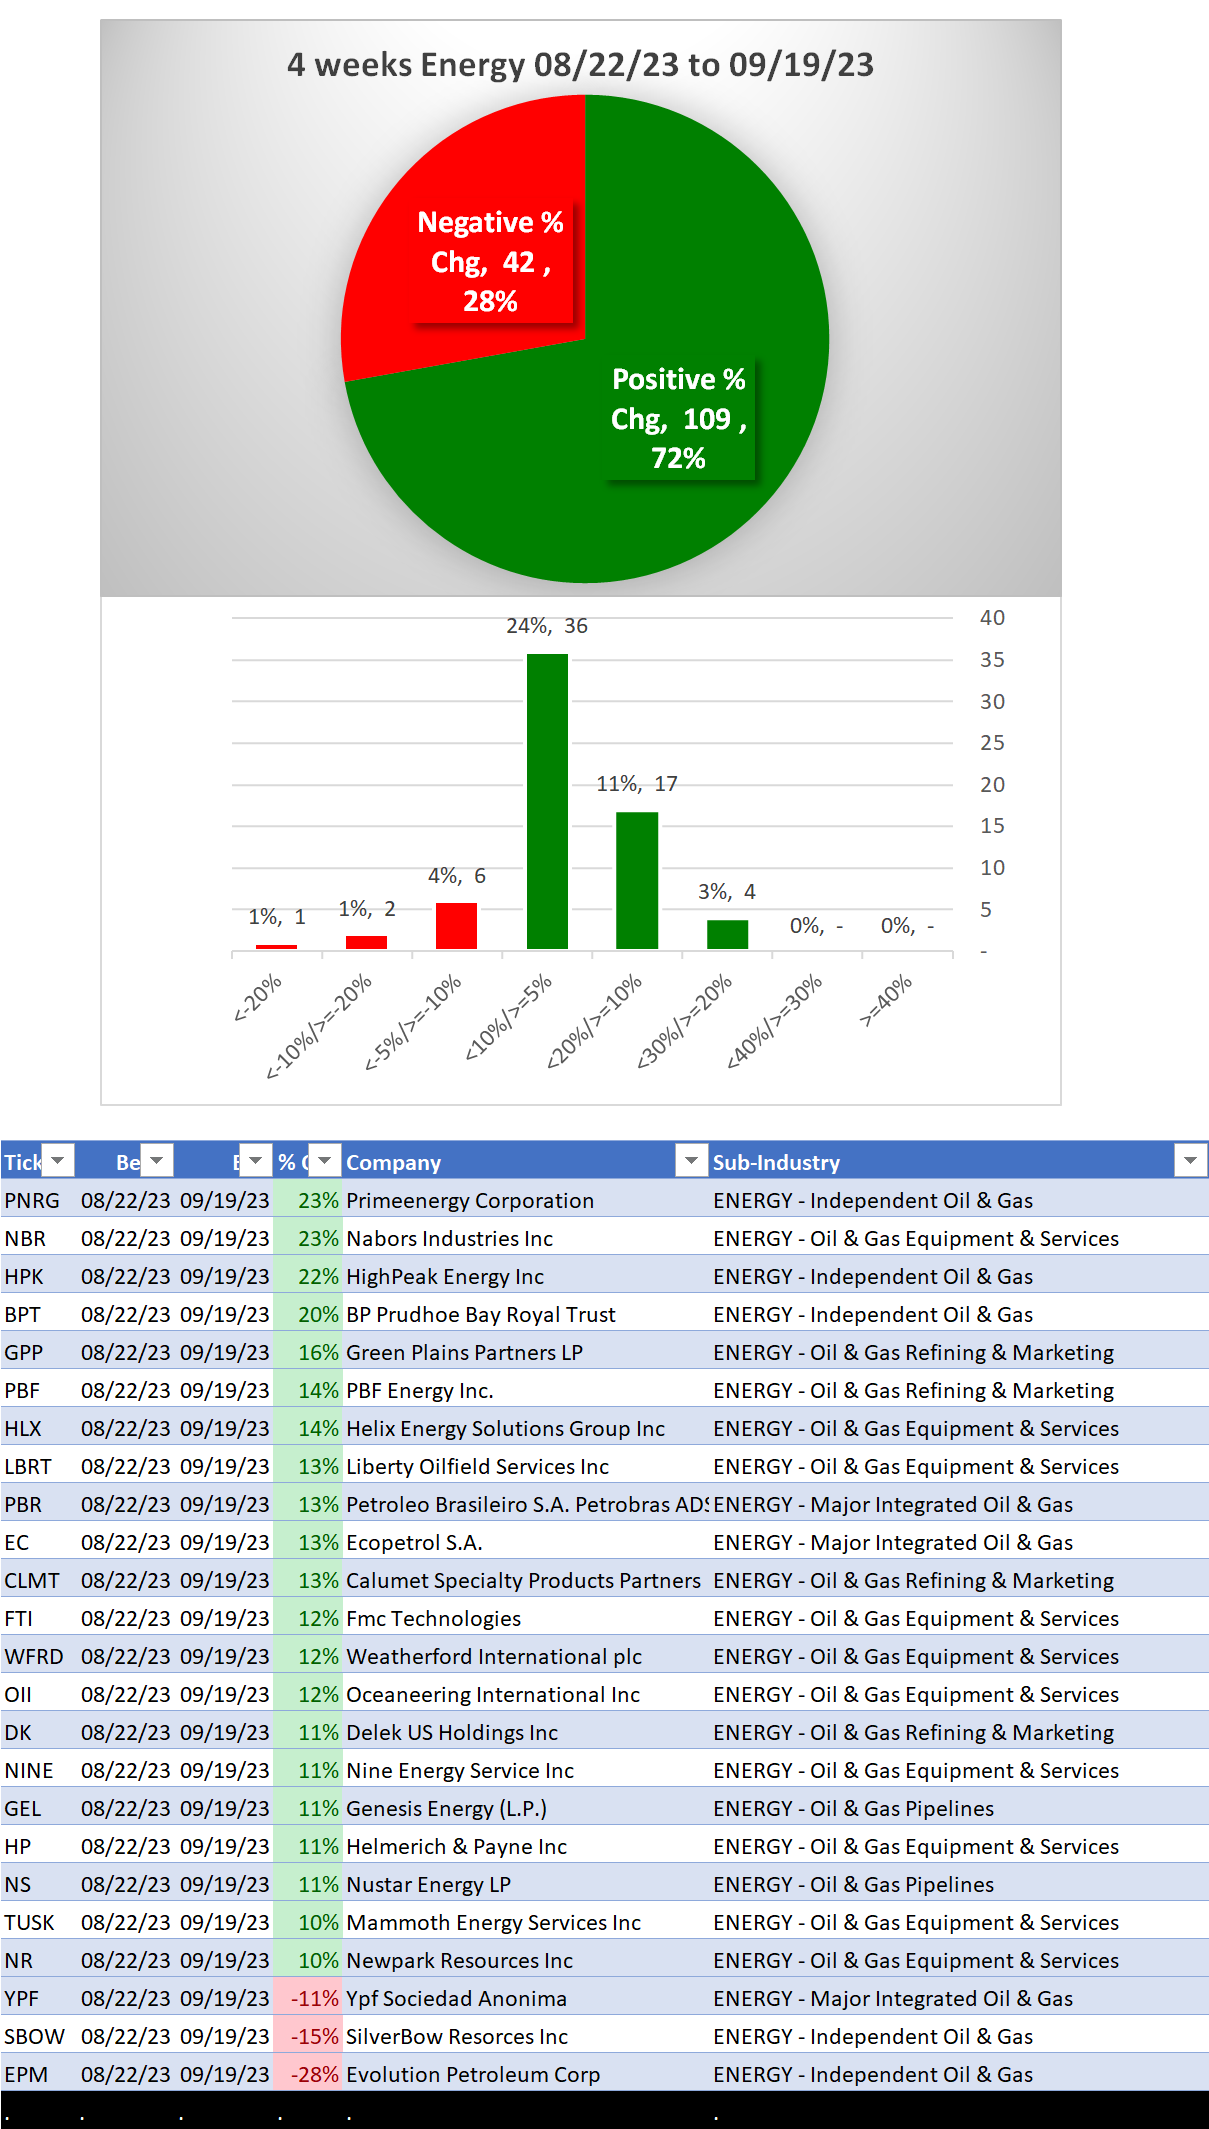
4 Weeks
PNRG/Primeenergy Corporation (Independent Oil & Gas) +23%
NBR/Nabors Industries Inc (Oil & Gas Equipment & Services) +23%
HPK/HighPeak Energy Inc (Independent Oil & Gas) +22%
BPT/BP Prudhoe Bay Royal Trust (Independent Oil & Gas) +20%
SBOW/SilverBow Resorces Inc (Independent Oil & Gas) -15%
EPM/Evolution Petroleum Corp (Independent Oil & Gas) -28%
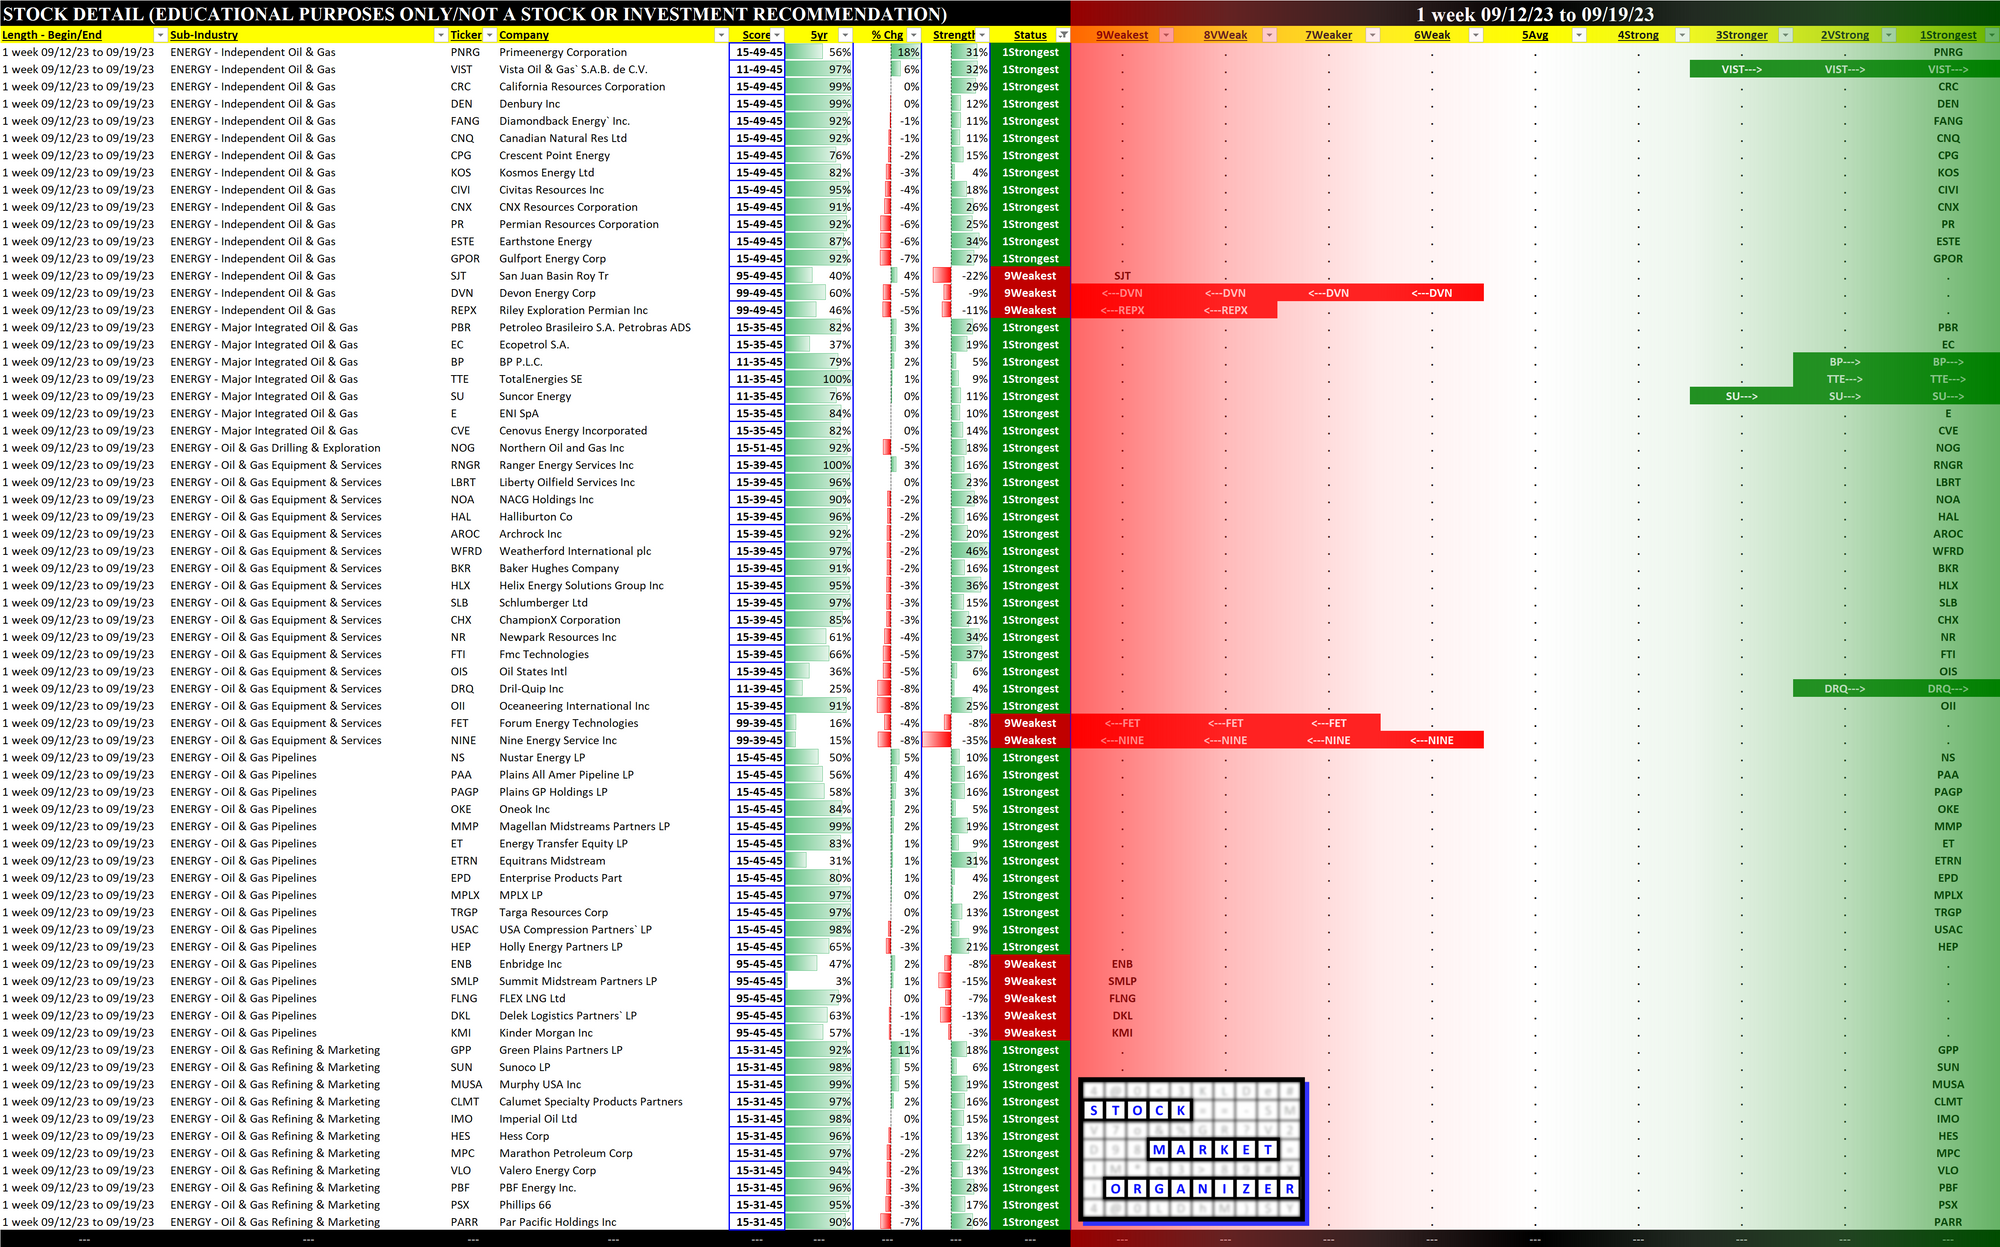
1 Week
59 Strongest stocks (39% of total)
PNRG/Primeenergy Corporation (Independent Oil & Gas) +18%
HPK/HighPeak Energy Inc (Independent Oil & Gas) +13%
GPP/Green Plains Partners LP (Oil & Gas Refining & Marketing) +11%
SBOW/SilverBow Resorces Inc (Independent Oil & Gas) -16%
EPM/Evolution Petroleum Corp (Independent Oil & Gas) -23%
Background
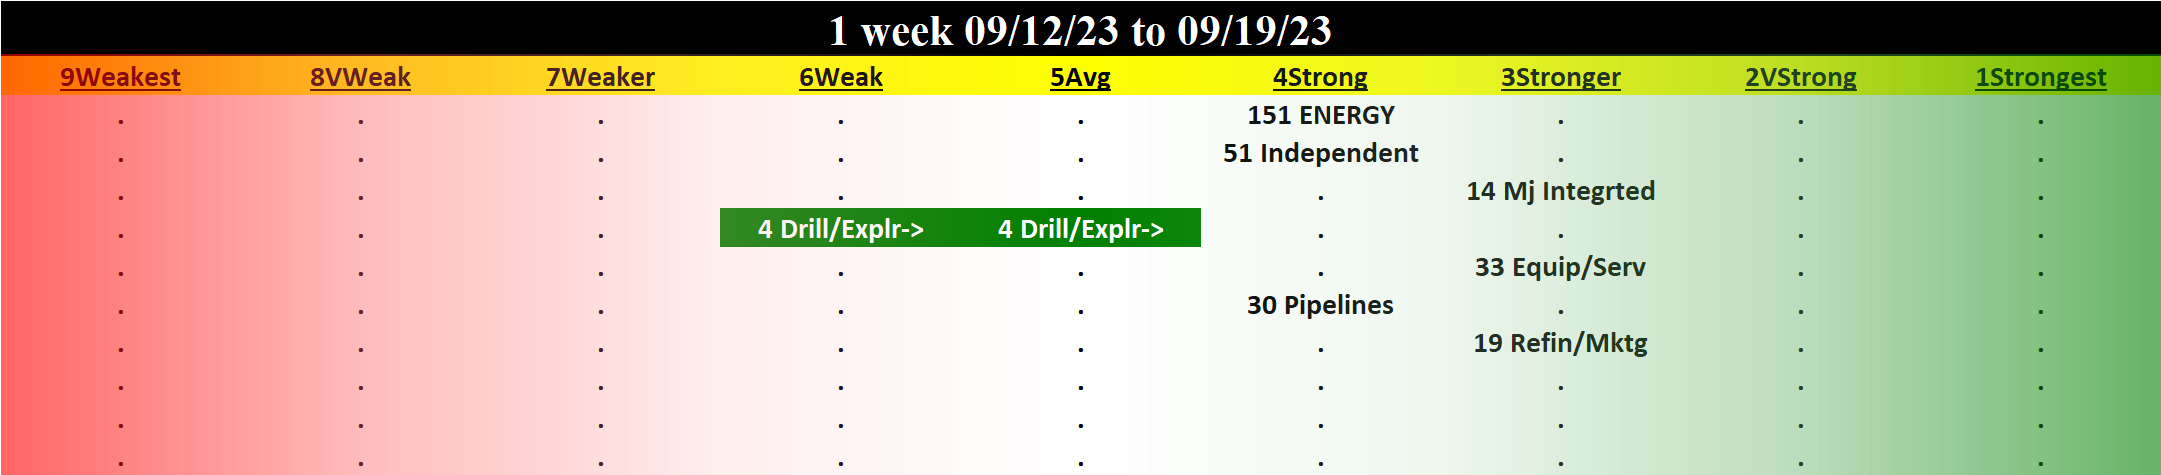
Material of 6 sub-industries (151 stocks total, average 25 stocks/sub-industry):
51 stocks Independent Oil & Gas
33 stocks Oil & Gas Equipment & Services
30 stocks Oil & Gas Pipelines
19 stocks Oil & Gas Refining & Marketing
14 stocks Major Integrated Oil & Gas
10 Biggest Market Cap stocks: XOM, CVX, TTE, COP, BP, PBR, SLB, EQNR, EOG, CNQ
DETAIL: 1 Week Performance Review
Status
Strengthened: 1/6 sub-industries
Weakened: 0/6 sub-industries
Strongest at Stronger rating/3rd strongest of 9 levels:
Major Integrated Oil & Gas
Oil & Gas Equipment & Services
Oil & Gas Refining & Marketing
Weakest at Average rating/5th strongest of 9 levels:
Oil & Gas Drilling & Exploration
Detail Charts: Sub-Industry and Stock
10-Week Week-by-Week Industry/Sub-industry Strength Comparison
What: recent week-by-week strength changes for the industry and each underlying sub-industry
Why: : objective measurement of strengthening and weakening enabling comparison within and across industries and sub-industries
Strongest and Weakest Stocks
What: stocks currently rated Strongest/Weakest (highest/lowest of 9 strength ratings)
Why: most interesting stocks for available capital because
- the Strongest may be meme-stock mania candidates prone to breakouts, and
- the Weakest may be prone to large bottom-fishing/short-covering-driven pops... and may also be primed for bigger and faster falls.
(Not guaranteed and not a recommendation - weak stocks in weakening sub-industries may be better shorts than high-flyers.)
DETAIL: Lookbacks 6 Mos vs. 4 weeks vs. 1 Week
6 Mos Lookback
4 weeks Lookback
1 Week Lookback