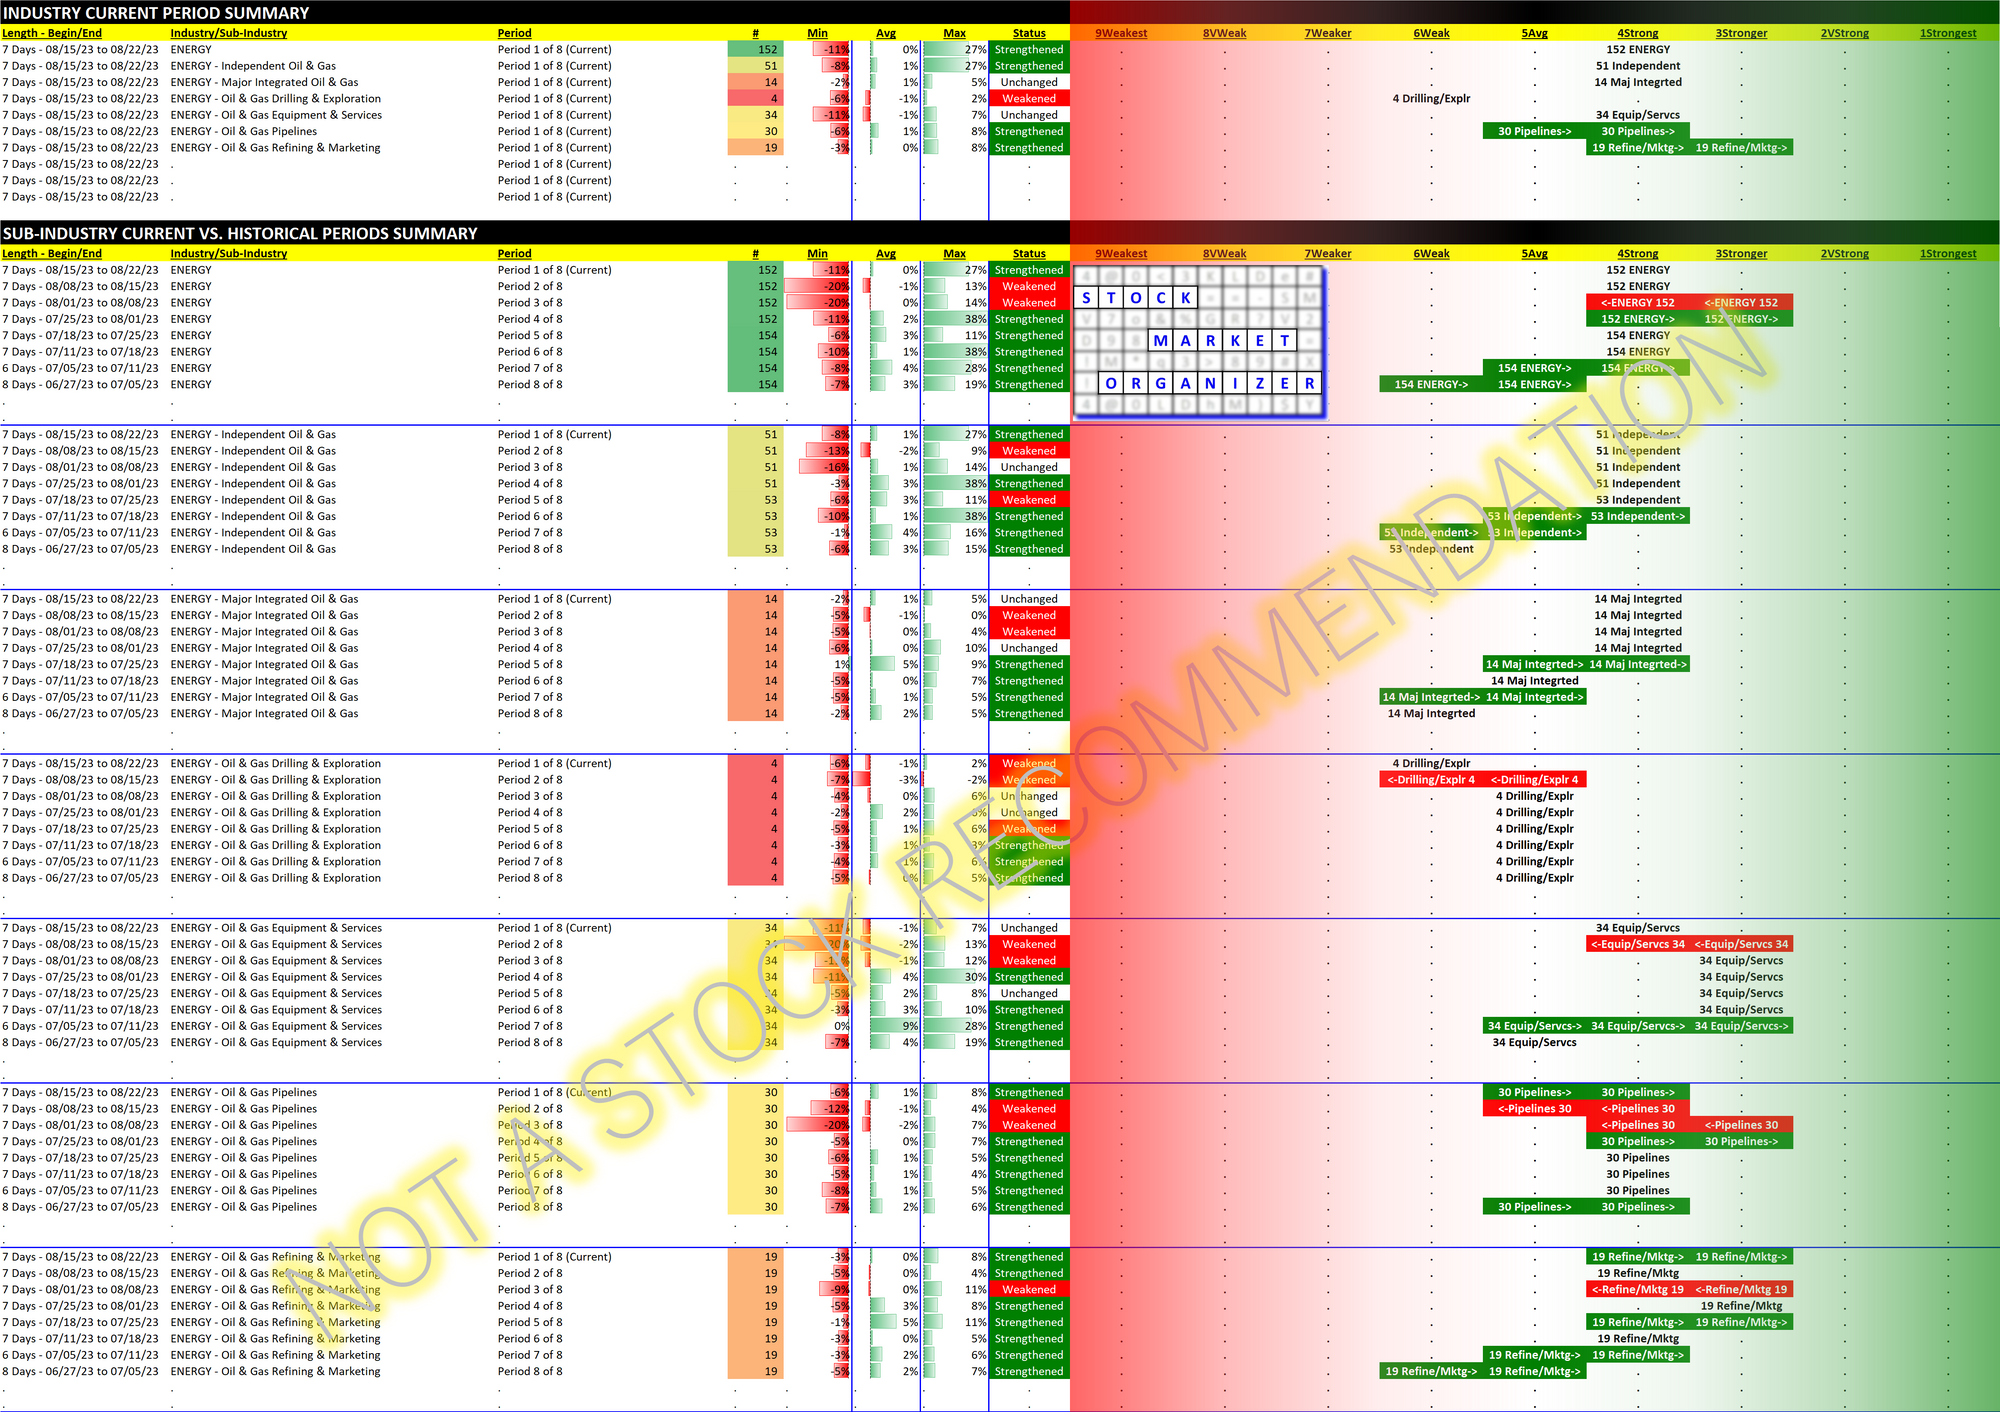
Energy 2023-08-22: Unchanged at "STRONG" strength rating (4th strongest of 9 levels), previous move was DOWN

Here's my review of Energy for the trading week ending 2023-08-15.
Then, I wrote the following:
One week of weakness has dribbled into two. Over the trading week ending 8/15/23, 48 of these 152 Energy stocks rose while 104 fell. For the previous trading week ending 8/8/23, 81 rose and 71 fell. The weakness became more pronounced during this past week.
The decline has ceased for the moment with the industry flat for the just-completed trading week. About half the industry was positive during the week, underscoring the industry's flat nature overall.
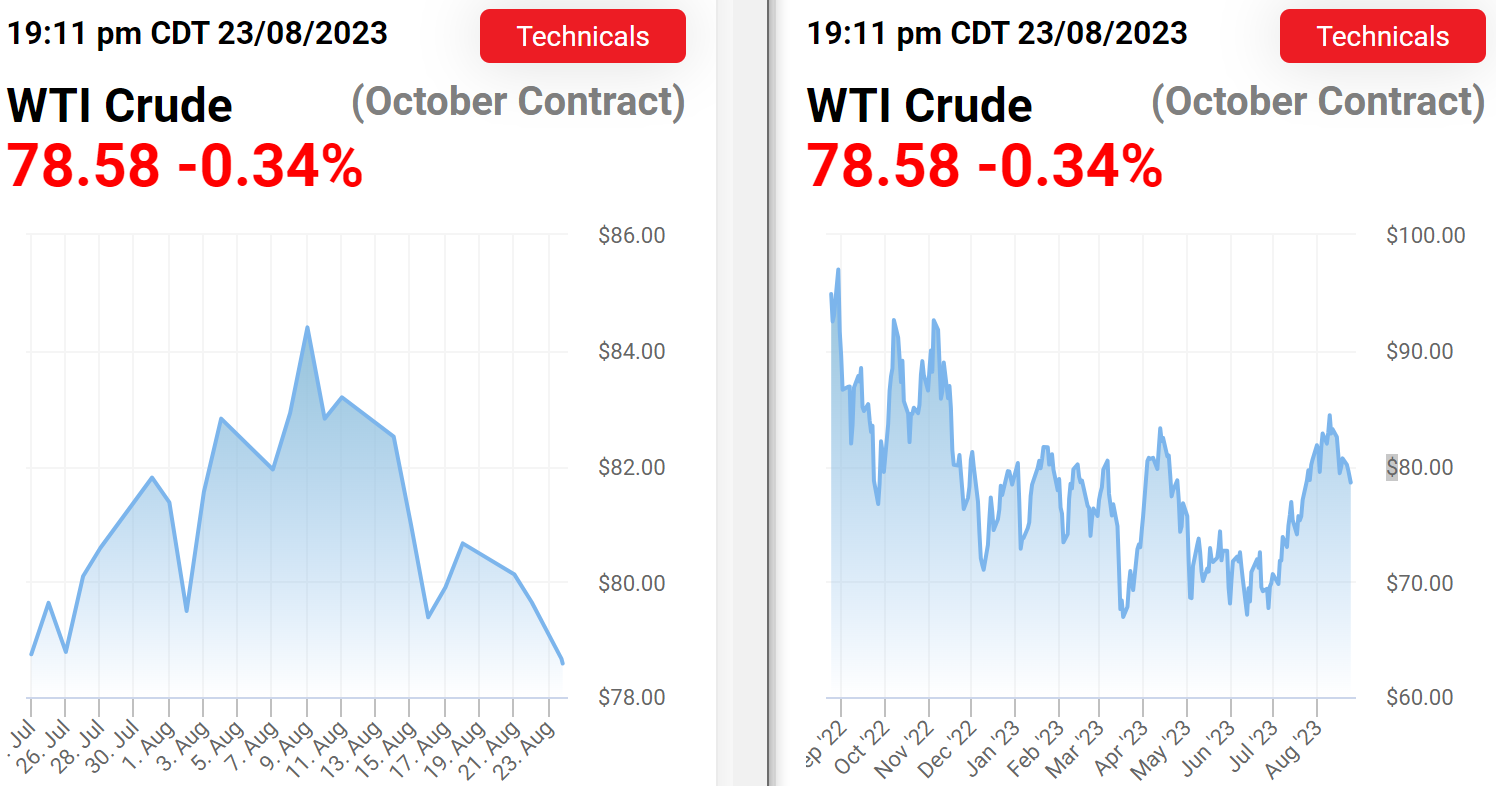
For reference, here are 1-month and 1-year oil price charts:
The industry was led by ESTE/Earthstone Energy +27% for the week. It has a Strongest rating within the Independent Oil & Gas sub-industry which strengthened slightly during the week and whose last move was UP. Why did this happen? Because of the other double-digit gainer during the week - PR/Permian Resources Corporation +10%. PR announced 2 days ago it was buying ESTE in a $4.5 billion acquisition.
ESTE had been strengthening for the past two months, jumping 16% Monday 8/21/23 after enjoying a 35% gain from 5/31/23 through 8/18/23. Interestingly, PR had increased 38% itself 5/31/23 through 8/18/23 and has increased 4% since then. This bucks the typical trend of a buyer's price declining.
On the other side of the ledger, BORR/Borr Drilling Limited was -11% and is -19% from 8/1/23.
Leaders and Laggards
Current strongest and weakest stocks are shown below. These are of most interest as the downtrodden are prone to large (if perhaps temporary) pops while the strongest have been leading the charge for their sub-industries.
