Electronics 2023-10-05: Unchanged at WEAK strength rating (6th strongest of 9 levels), previous move was DOWN
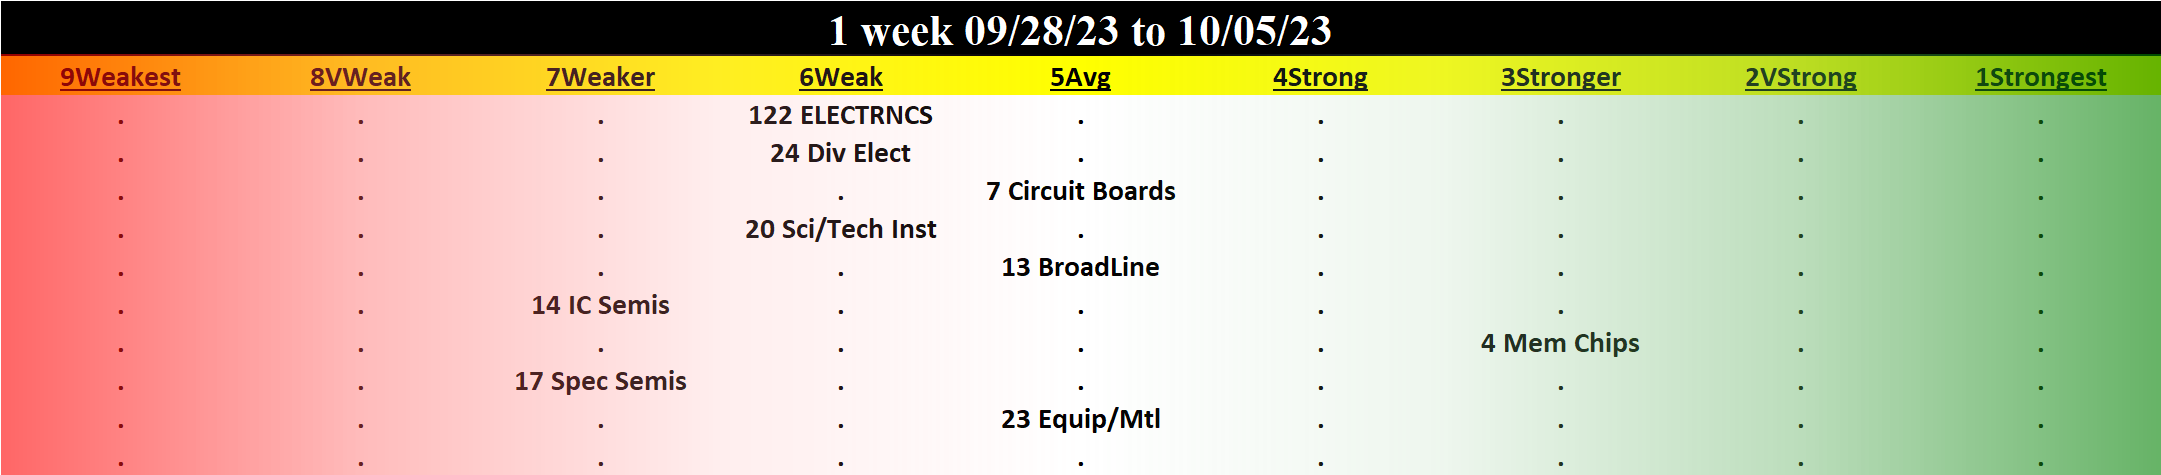
TABLE OF CONTENTS
- INDUSTRY OVERVIEW
1A. Performance
1B. Background - SUB-INDUSTRIES AND STOCKS DETAIL
2A. Sub-Industries Overview
2B. Sub-Industries 10-Week Strengthening Analysis
2C. Stocks 1 Week Strongest and Weakest - STRENGTH BY LOOKBACK PERIOD (with Best/Worst stocks)
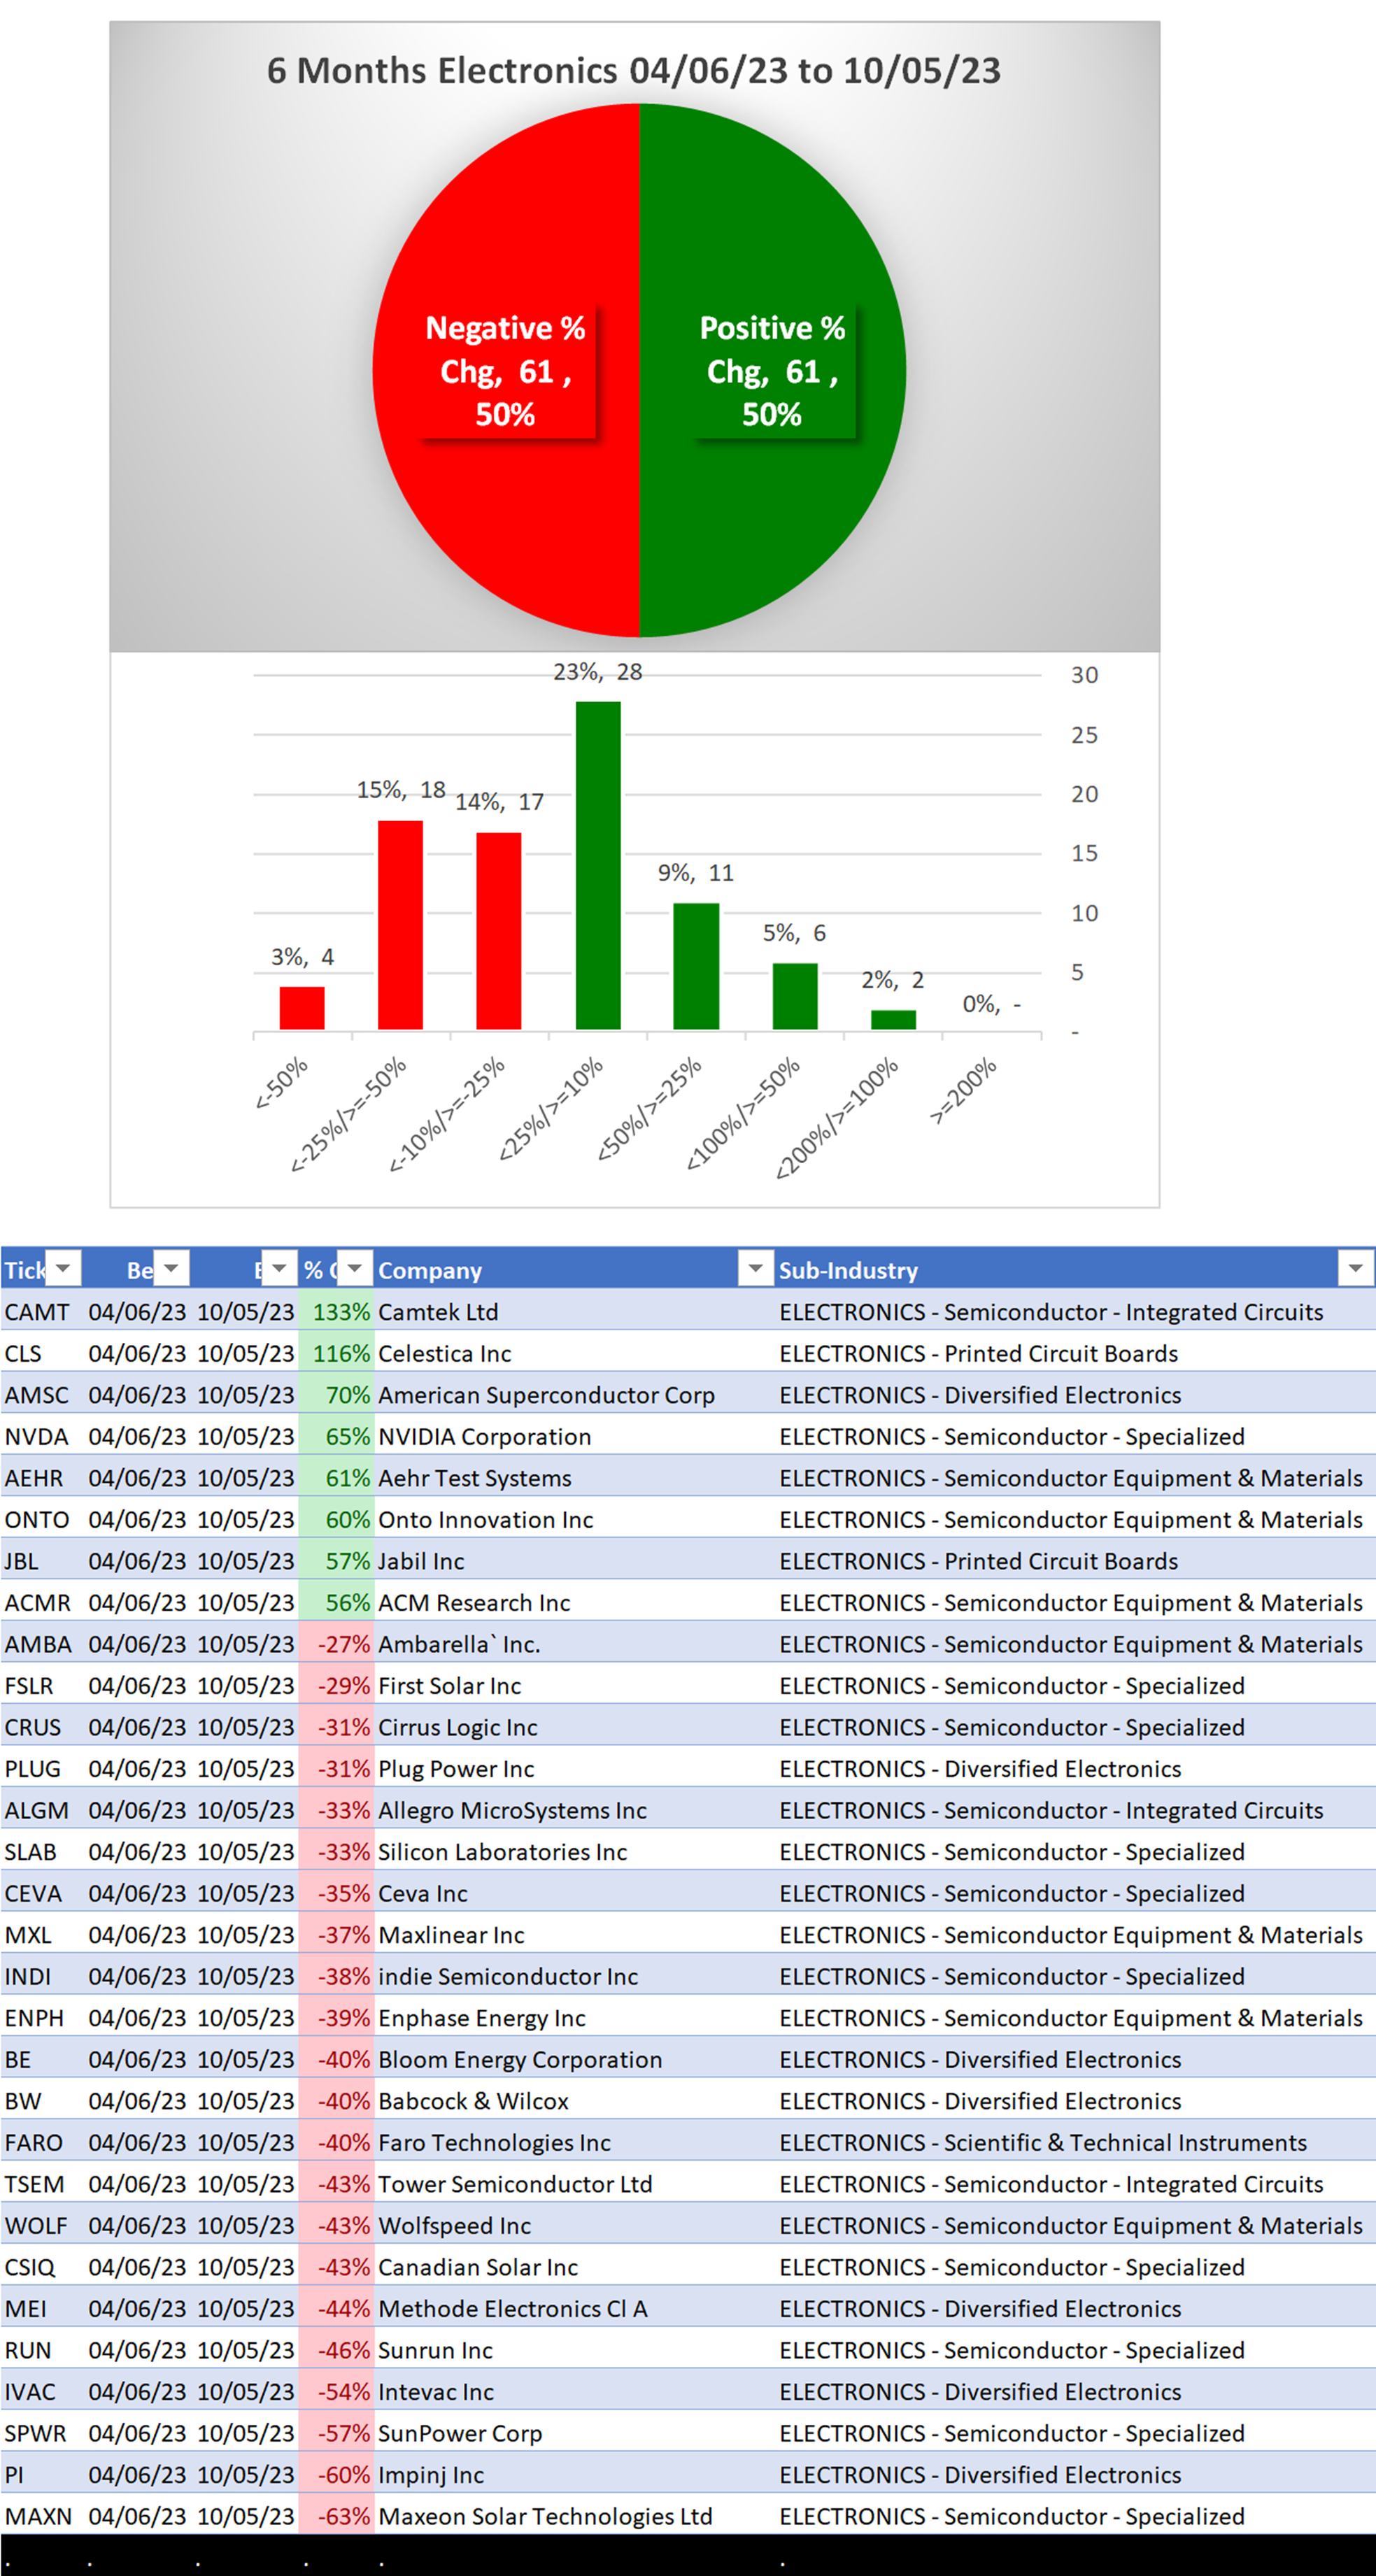
3A. Lookback 6 Months
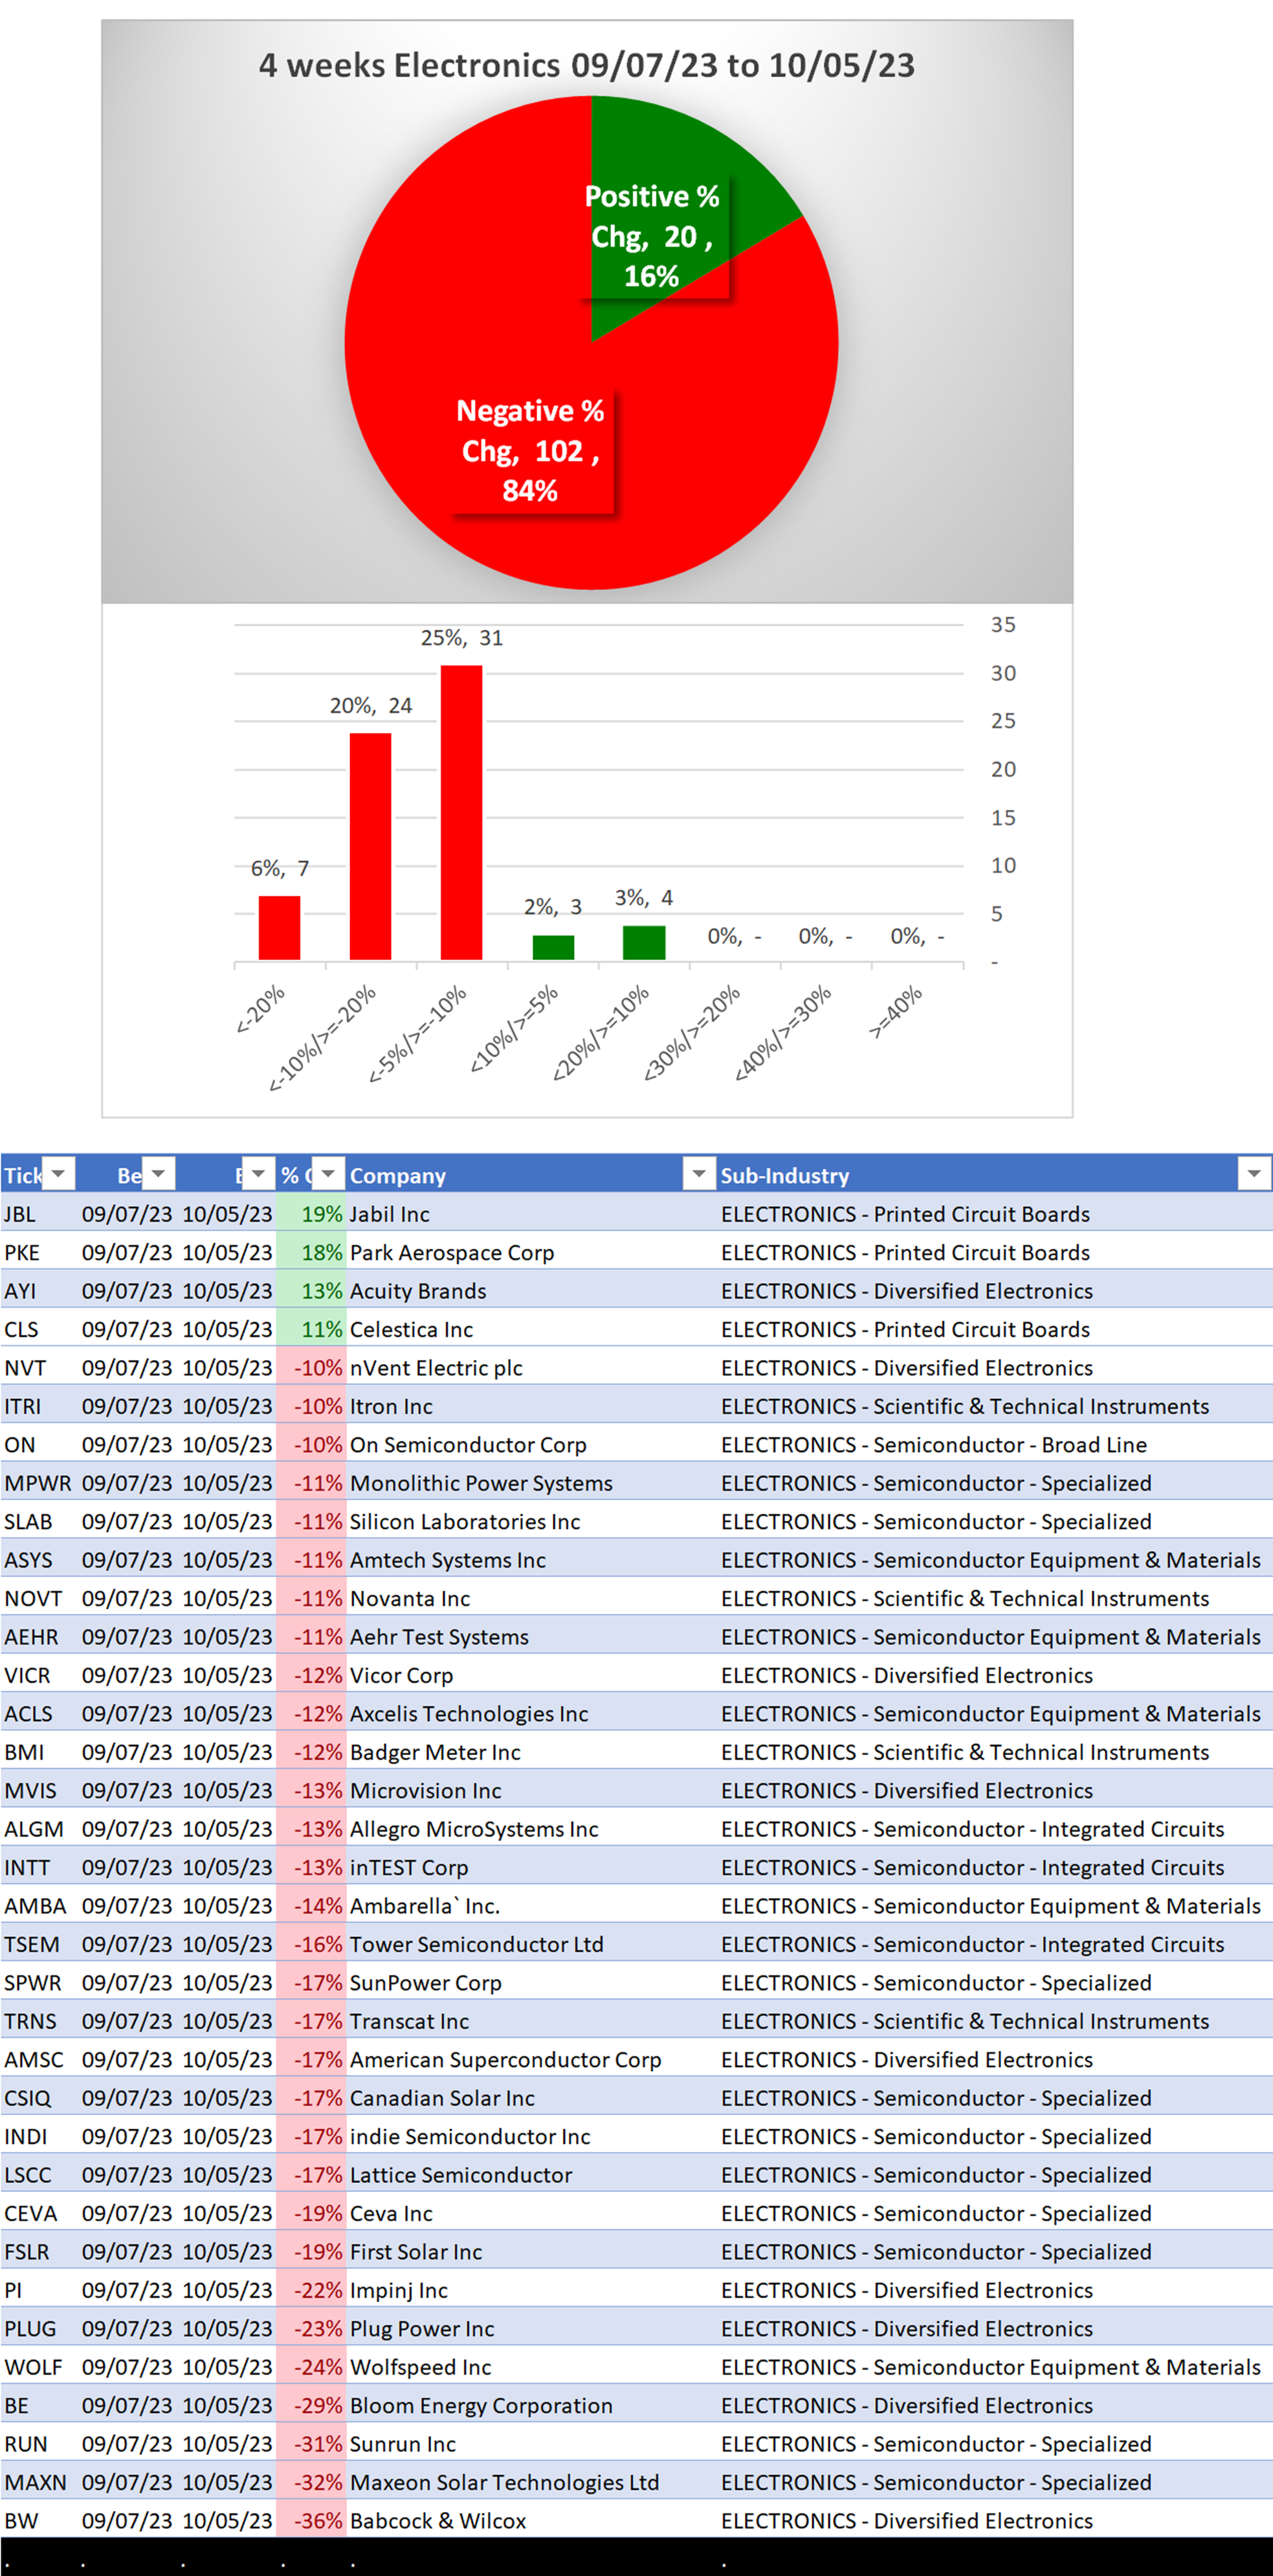
3B. Lookback 4 weeks
3C. Lookback 1 Week
1. INDUSTRY OVERVIEW
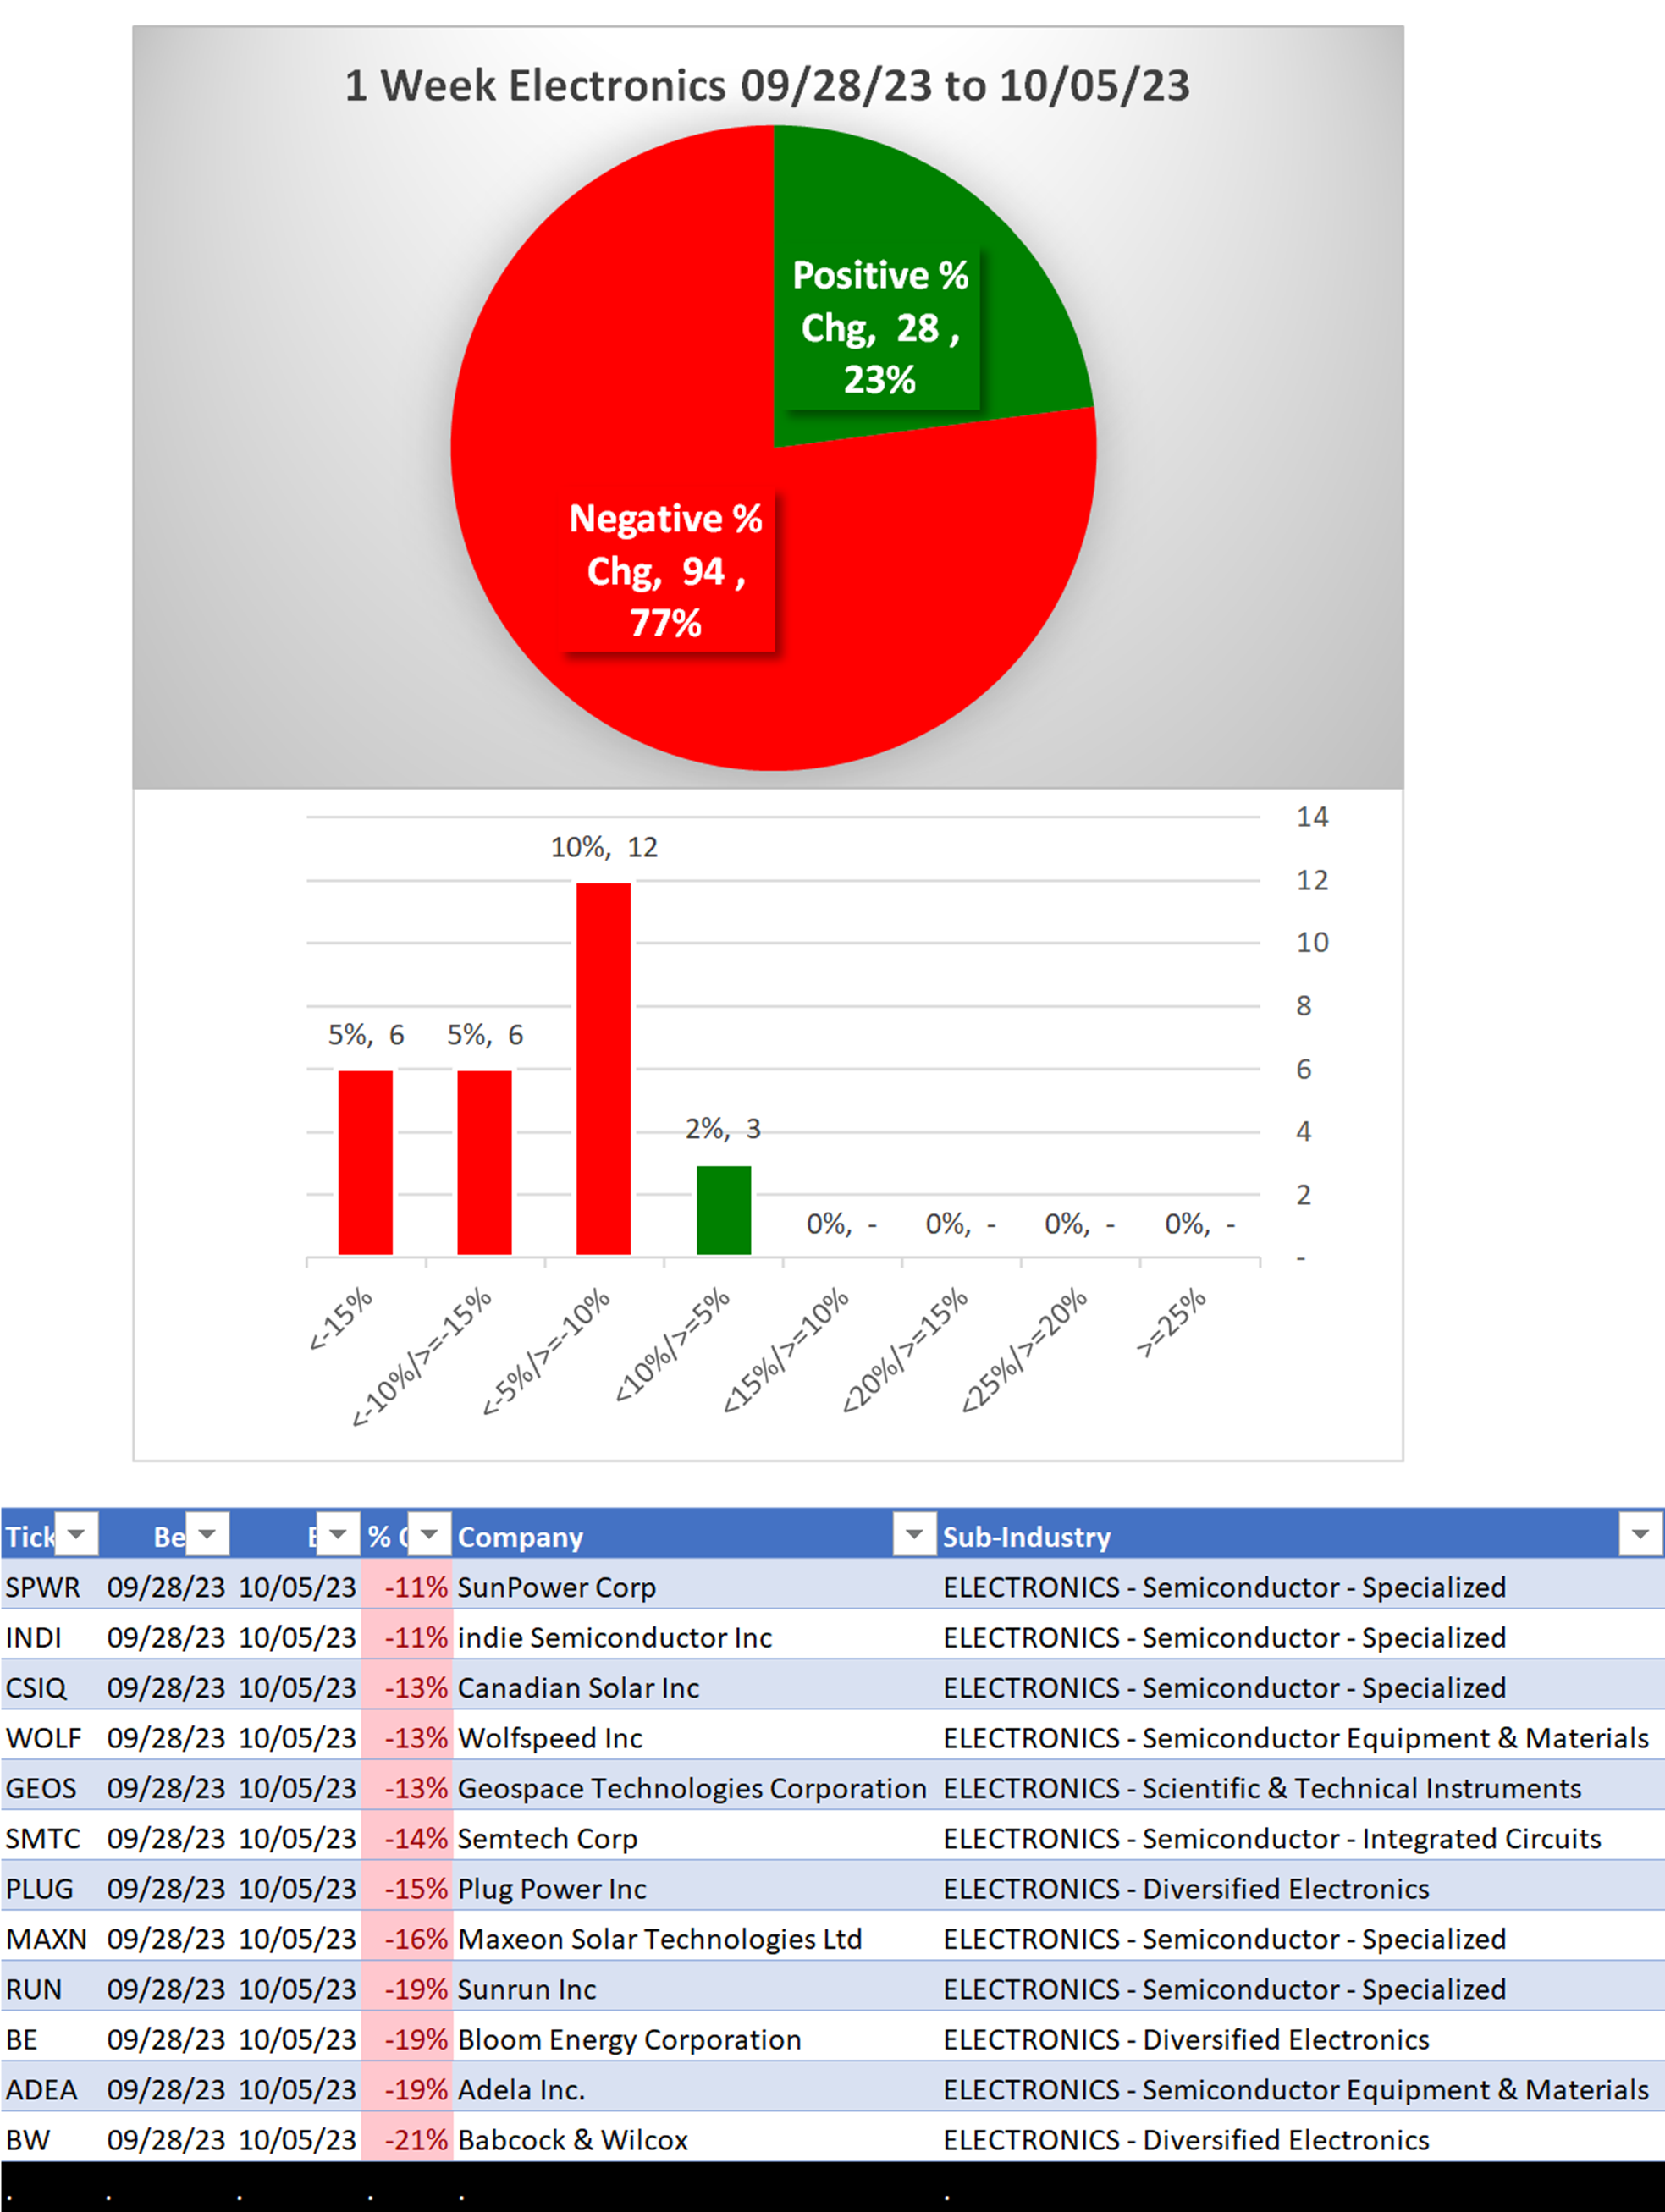
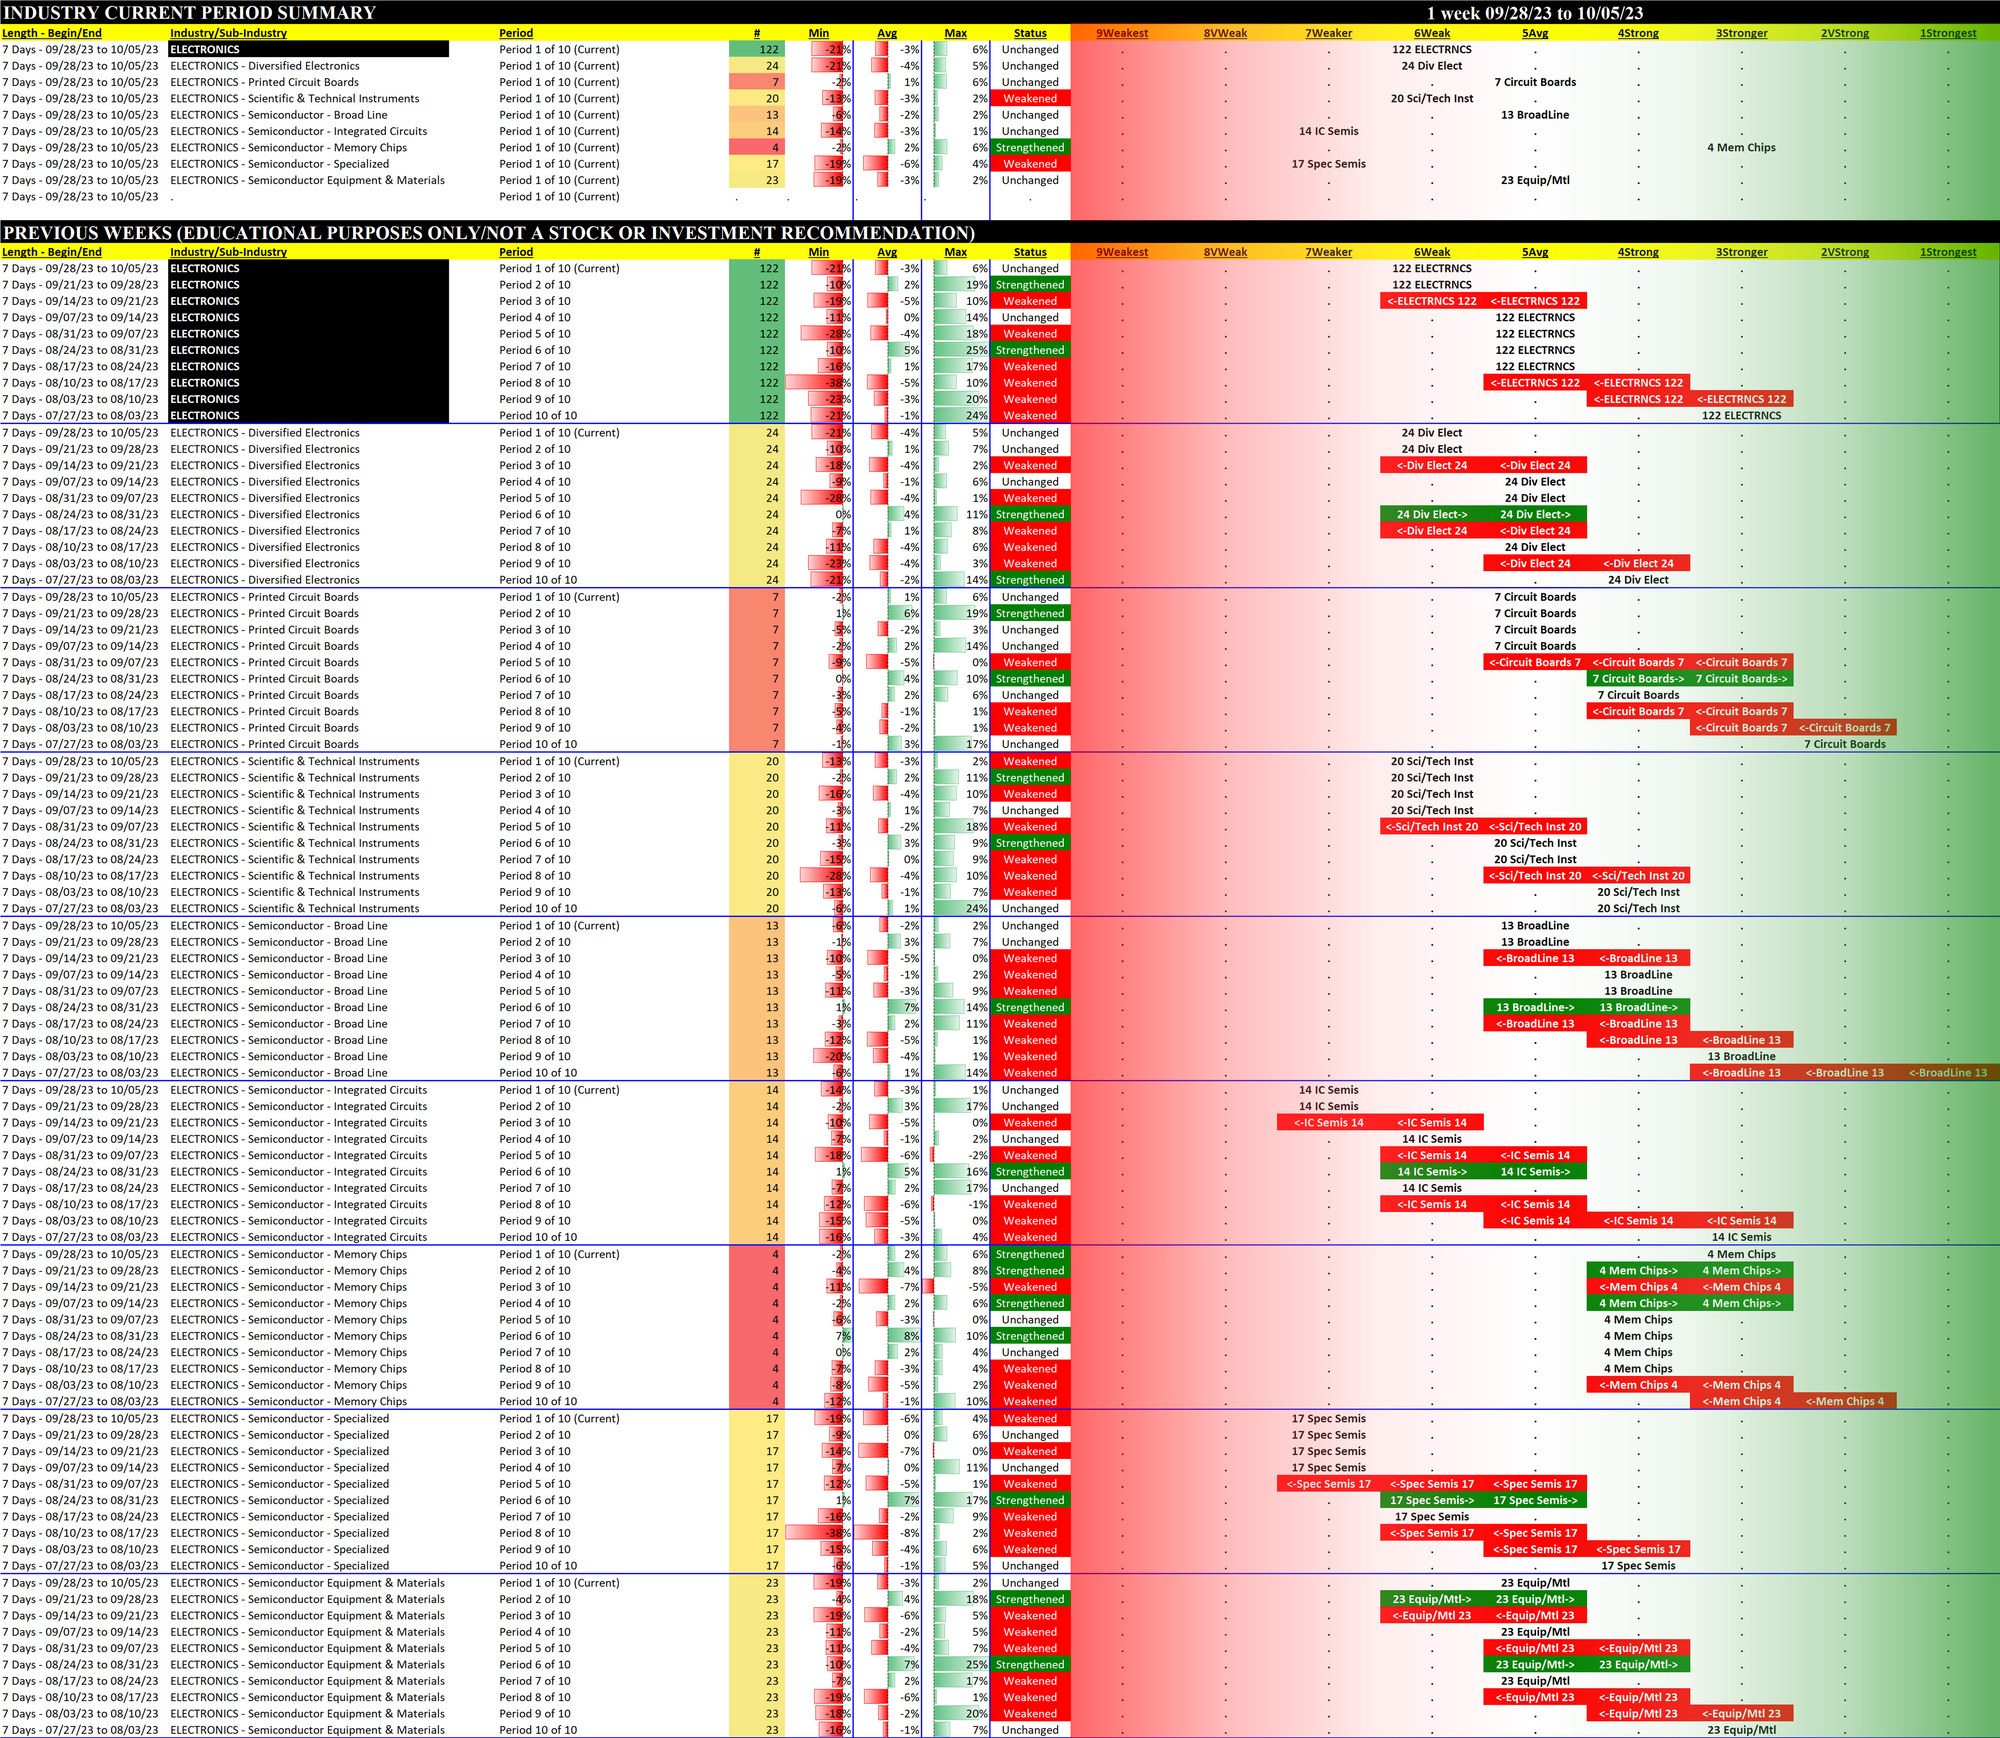
1A. Performance
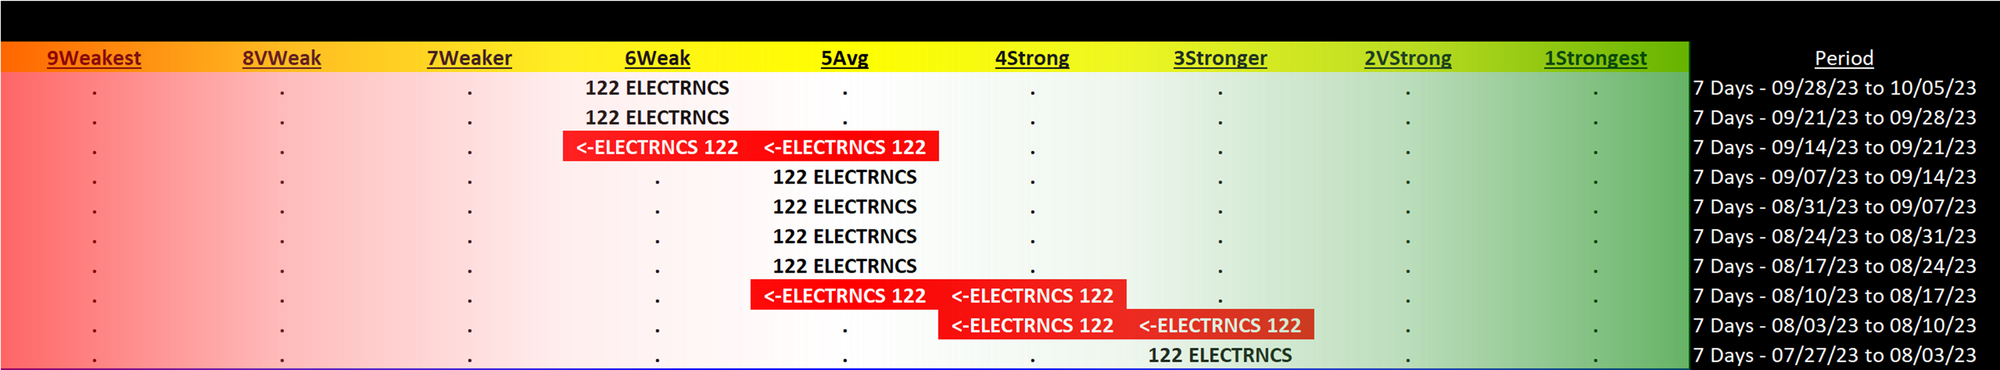
Past 10 Weeks Strengthening/Weakening week-by-week, per the following chart:
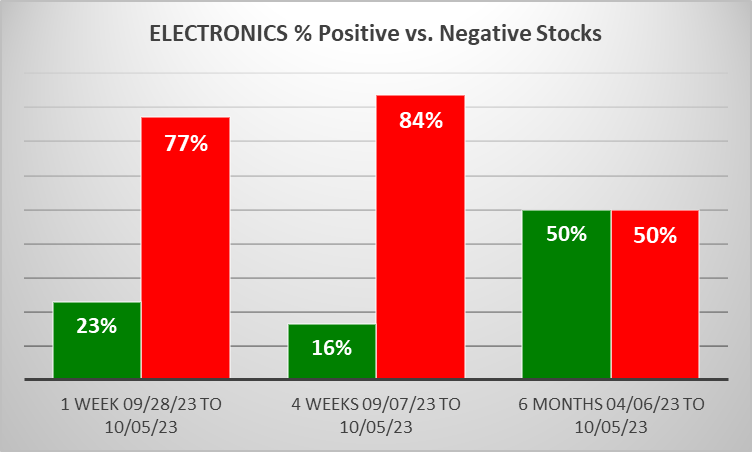
Mixed/STRENGTHENING 1 Week vs. Mid- and Longer-Term // 1 week positive/negative stocks ratio is HIGHER than 4 weeks but LOWER than 6 Months, per the following chart:
Comment:
- 34% of stocks are rated Weakest.
1B. Background
Largest of 8 sub-industries (122 stocks, average 15):
- Diversified Electronics (24 stocks)
- Semiconductor Equipment & Materials (23 stocks)
- Scientific & Technical Instruments (20 stocks)
- Semiconductor - Specialized (17 stocks)
- Semiconductor - Integrated Circuits (14 stocks)
Top 10 by Market Capitalization:
NVDA/NVIDIA Corporation, TSM/Taiwan Semiconductor Manufacturing Company Ltd. ADS, AVGO/Broadcom Inc, AMD/Advanced Micro Devices, INTC/Intel Corp, TXN/Texas Instruments Inc, AMAT/Applied Materials Inc, LRCX/Lam Research Corp, ADI/Analog Devices Inc, MU/Micron Technology Inc
2. SUB-INDUSTRIES AND STOCKS DETAIL
2A. Sub-Industries Overview
Strengthened: 0/8 sub-industries
Weakened: 0/8 sub-industries
STRONGEST at Stronger rating/3rd strongest of 9 levels:
- Semiconductor - Memory Chips (4 stocks)
WEAKEST at Weaker rating/7th strongest of 9 levels:
- Semiconductor - Integrated Circuits (14 stocks)
- Semiconductor - Specialized (17 stocks)
2B. Sub-Industries 10-Week Strengthening Analysis
What: recent week-by-week strength changes for the industry and each underlying sub-industry
Why: objective measurement of strengthening and weakening enabling comparison within and across industries and sub-industries
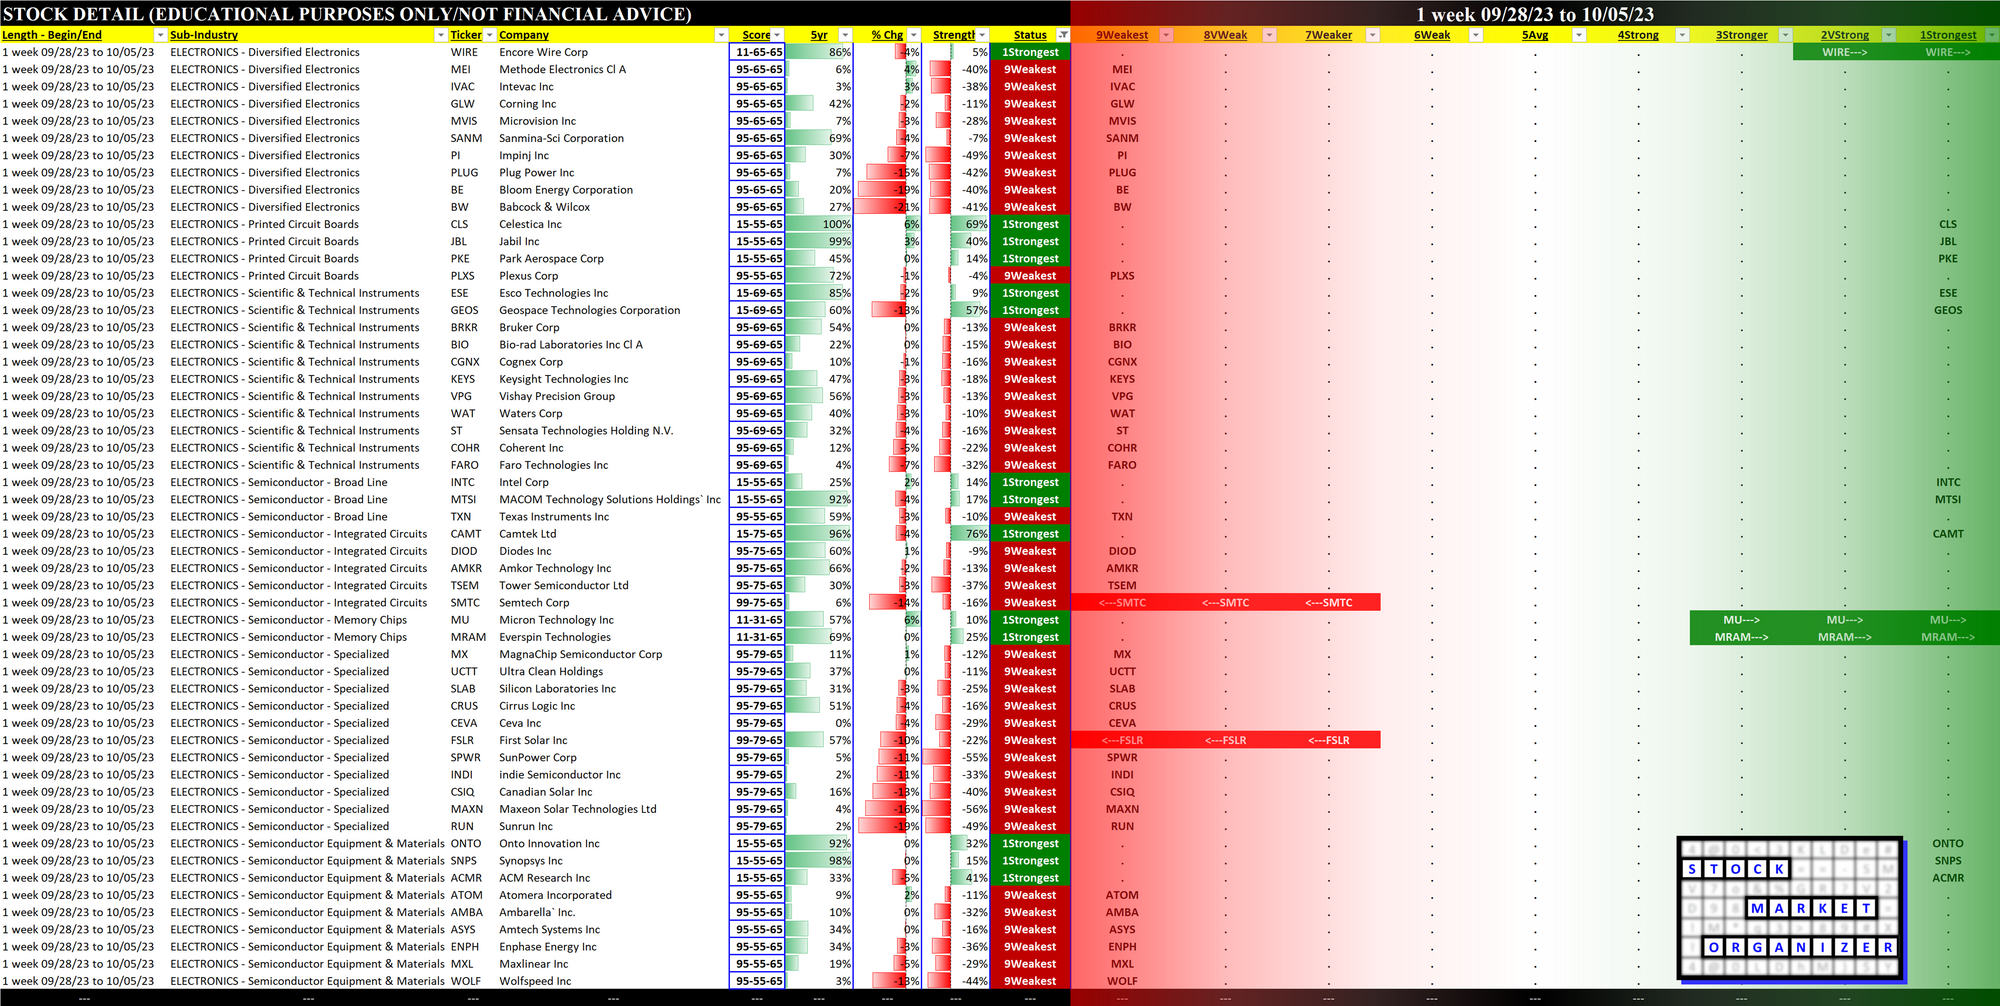
2C. Stocks 1 Week Strongest and Weakest
What: stocks currently rated Strongest/Weakest (highest/lowest of 9 strength ratings)
Why: most interesting stocks for available capital because
- the Strongest have the least amount of overhead supply to dampen breakouts while
- the Weakest may be prone to volatility, subject to big pops from bottom-fishing and short-covering BUT ALSO to bigger and faster falls.
(Not guaranteed and not a recommendation - weak stocks in weakening sub-industries may be better shorts than high-flyers.)
3. STRENGTH BY LOOKBACK PERIOD (with Best/Worst stocks)
3A. Lookback 6 Months
3B. Lookback 4 weeks
3C. Lookback 1 Week