Electronics 2023-09-14: Unchanged at "AVERAGE" strength rating (5th strongest of 9 levels), previous move was DOWN
SUMMARY
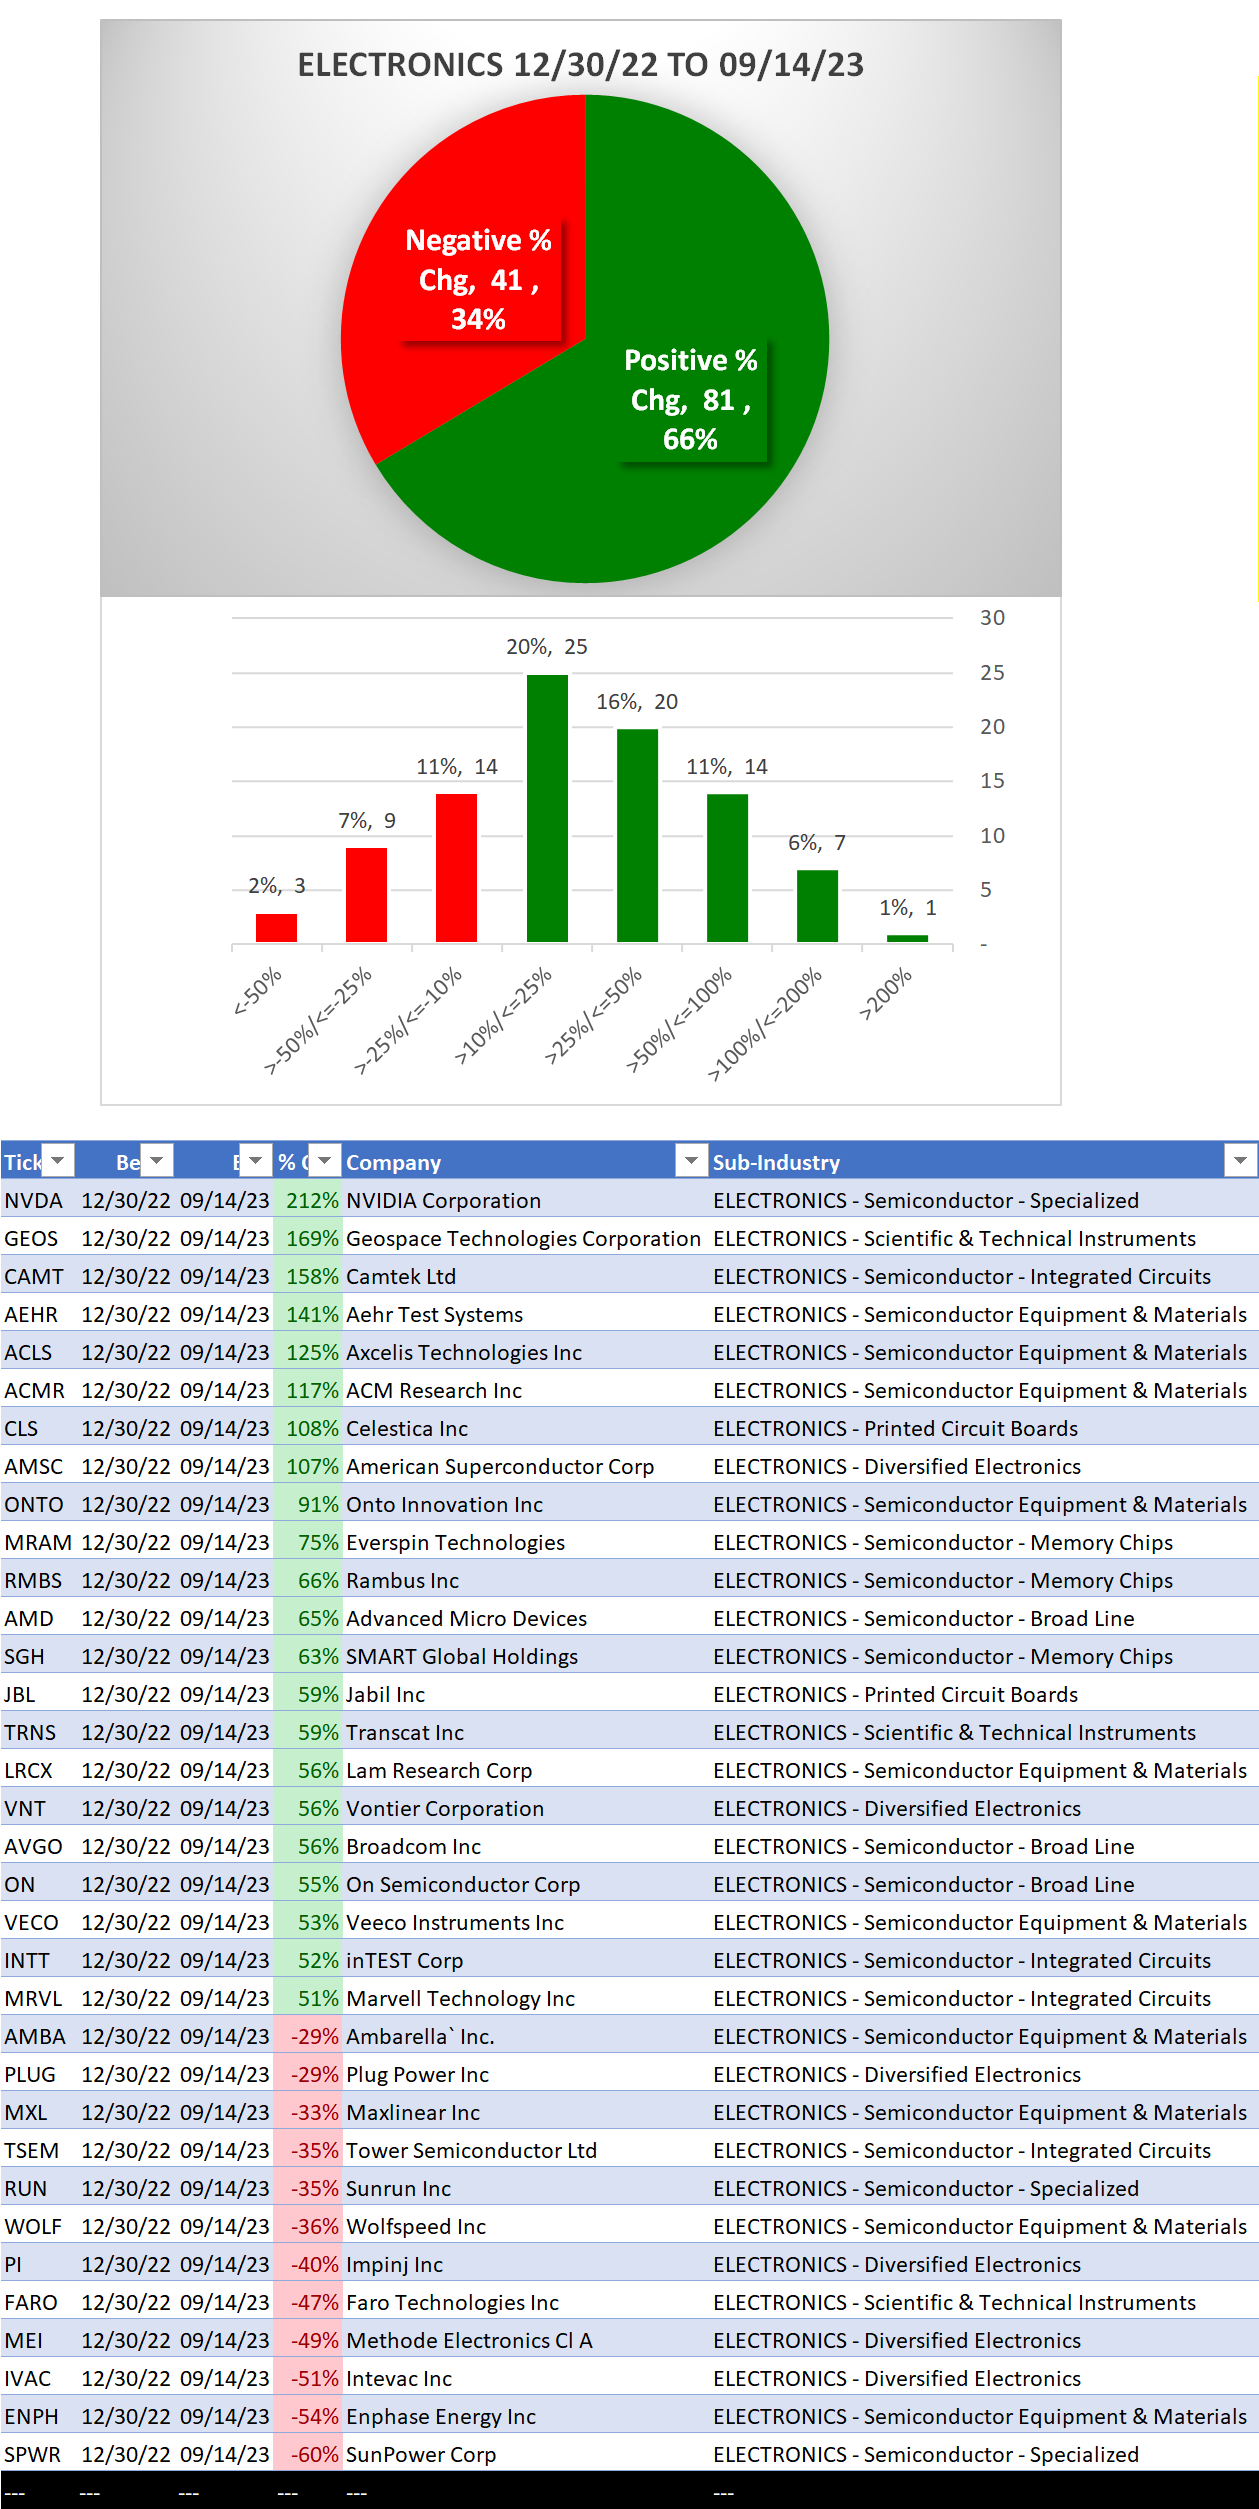
Performance
Bottom line: 4 weeks flat after weakening 2 levels in 2 weeks
Context: slightly weaker recently vs. YTD
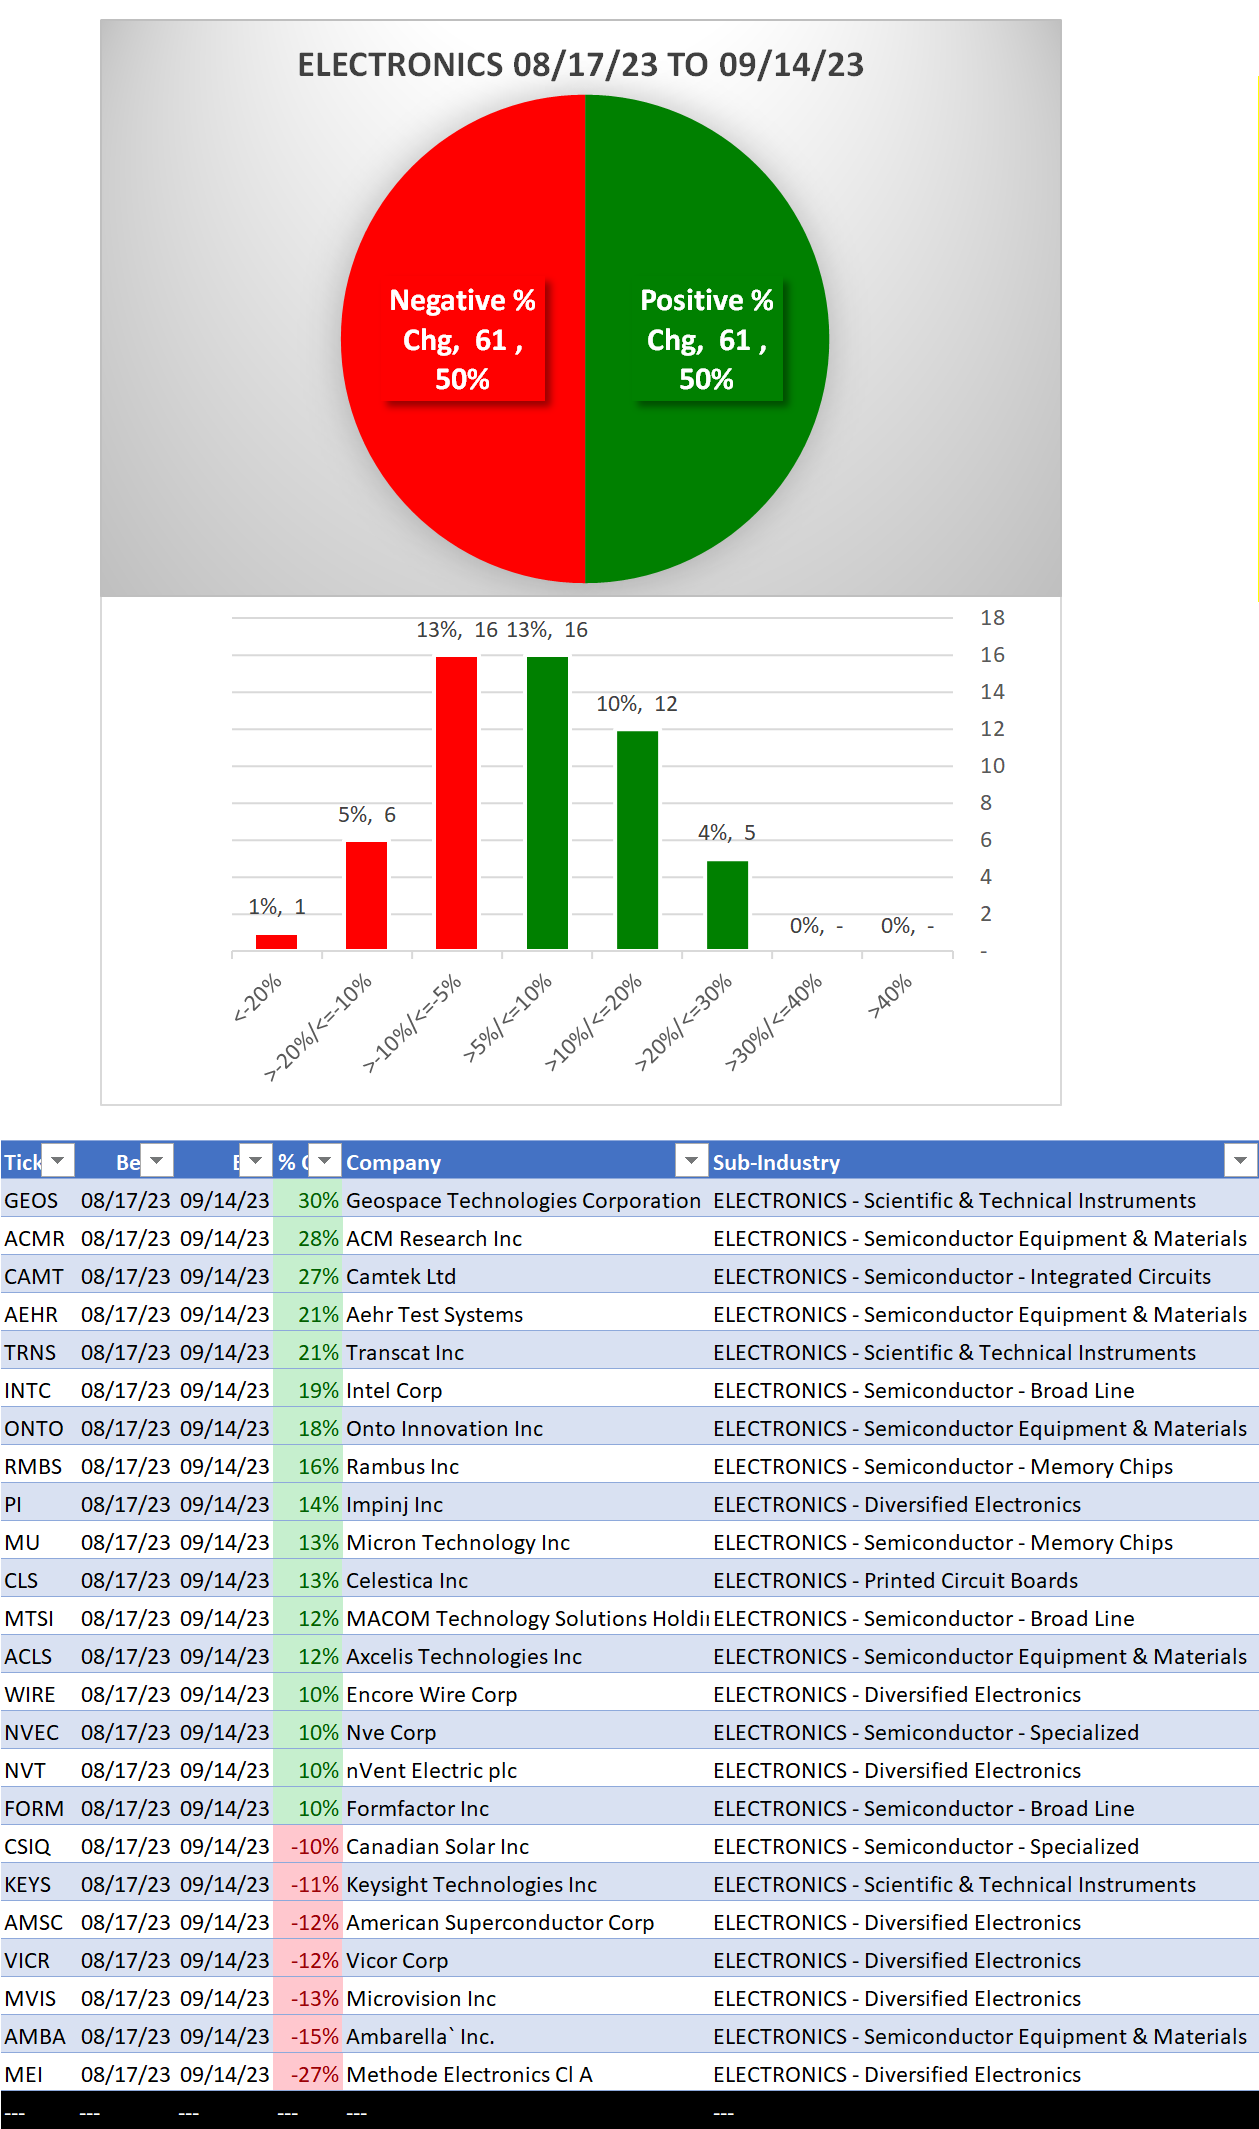
- 66% positive stocks YTD
- 50% positive stocks past 4 weeks
Background
Largest of 8 Sub-industries (122 stocks total):
- 24 stocks Diversified Electronics
- 23 stocks Semiconductor Equipment & Materials
- 20 stocks Scientific & Technical Instruments
10 Biggest Market Cap stocks: NVDA, TSM, AVGO, AMD, INTC, TXN, AMAT, LRCX, ADI, MU
DETAIL: 1 week review, YTD/4 weeks lookbacks
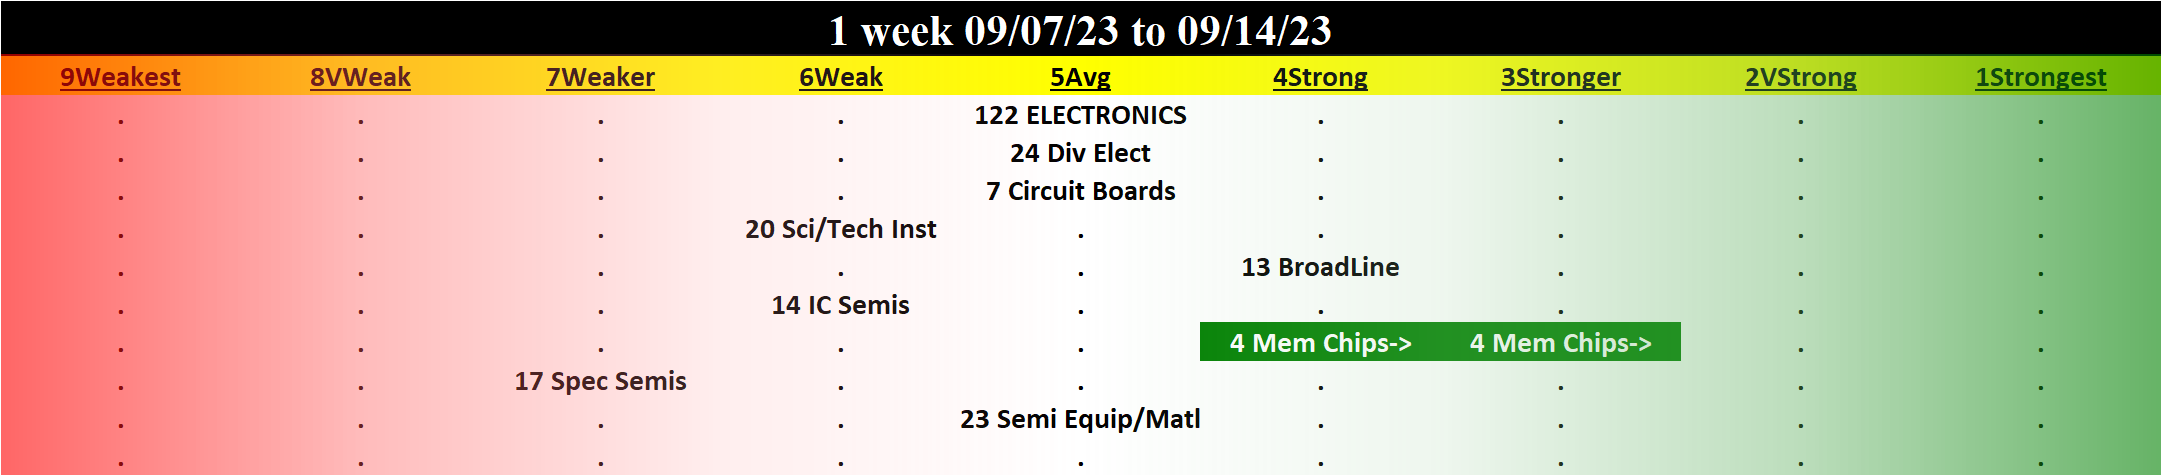
1 Week Review
Strengthened: 1/8 sub-industries
Weakened: 0/8 sub-industries
Strongest at Strong/4th strongest (of 9 levels) rating: Semiconductor - Memory Chips
Weakest at Weaker/7th strongest rating: Semiconductor - Specialized
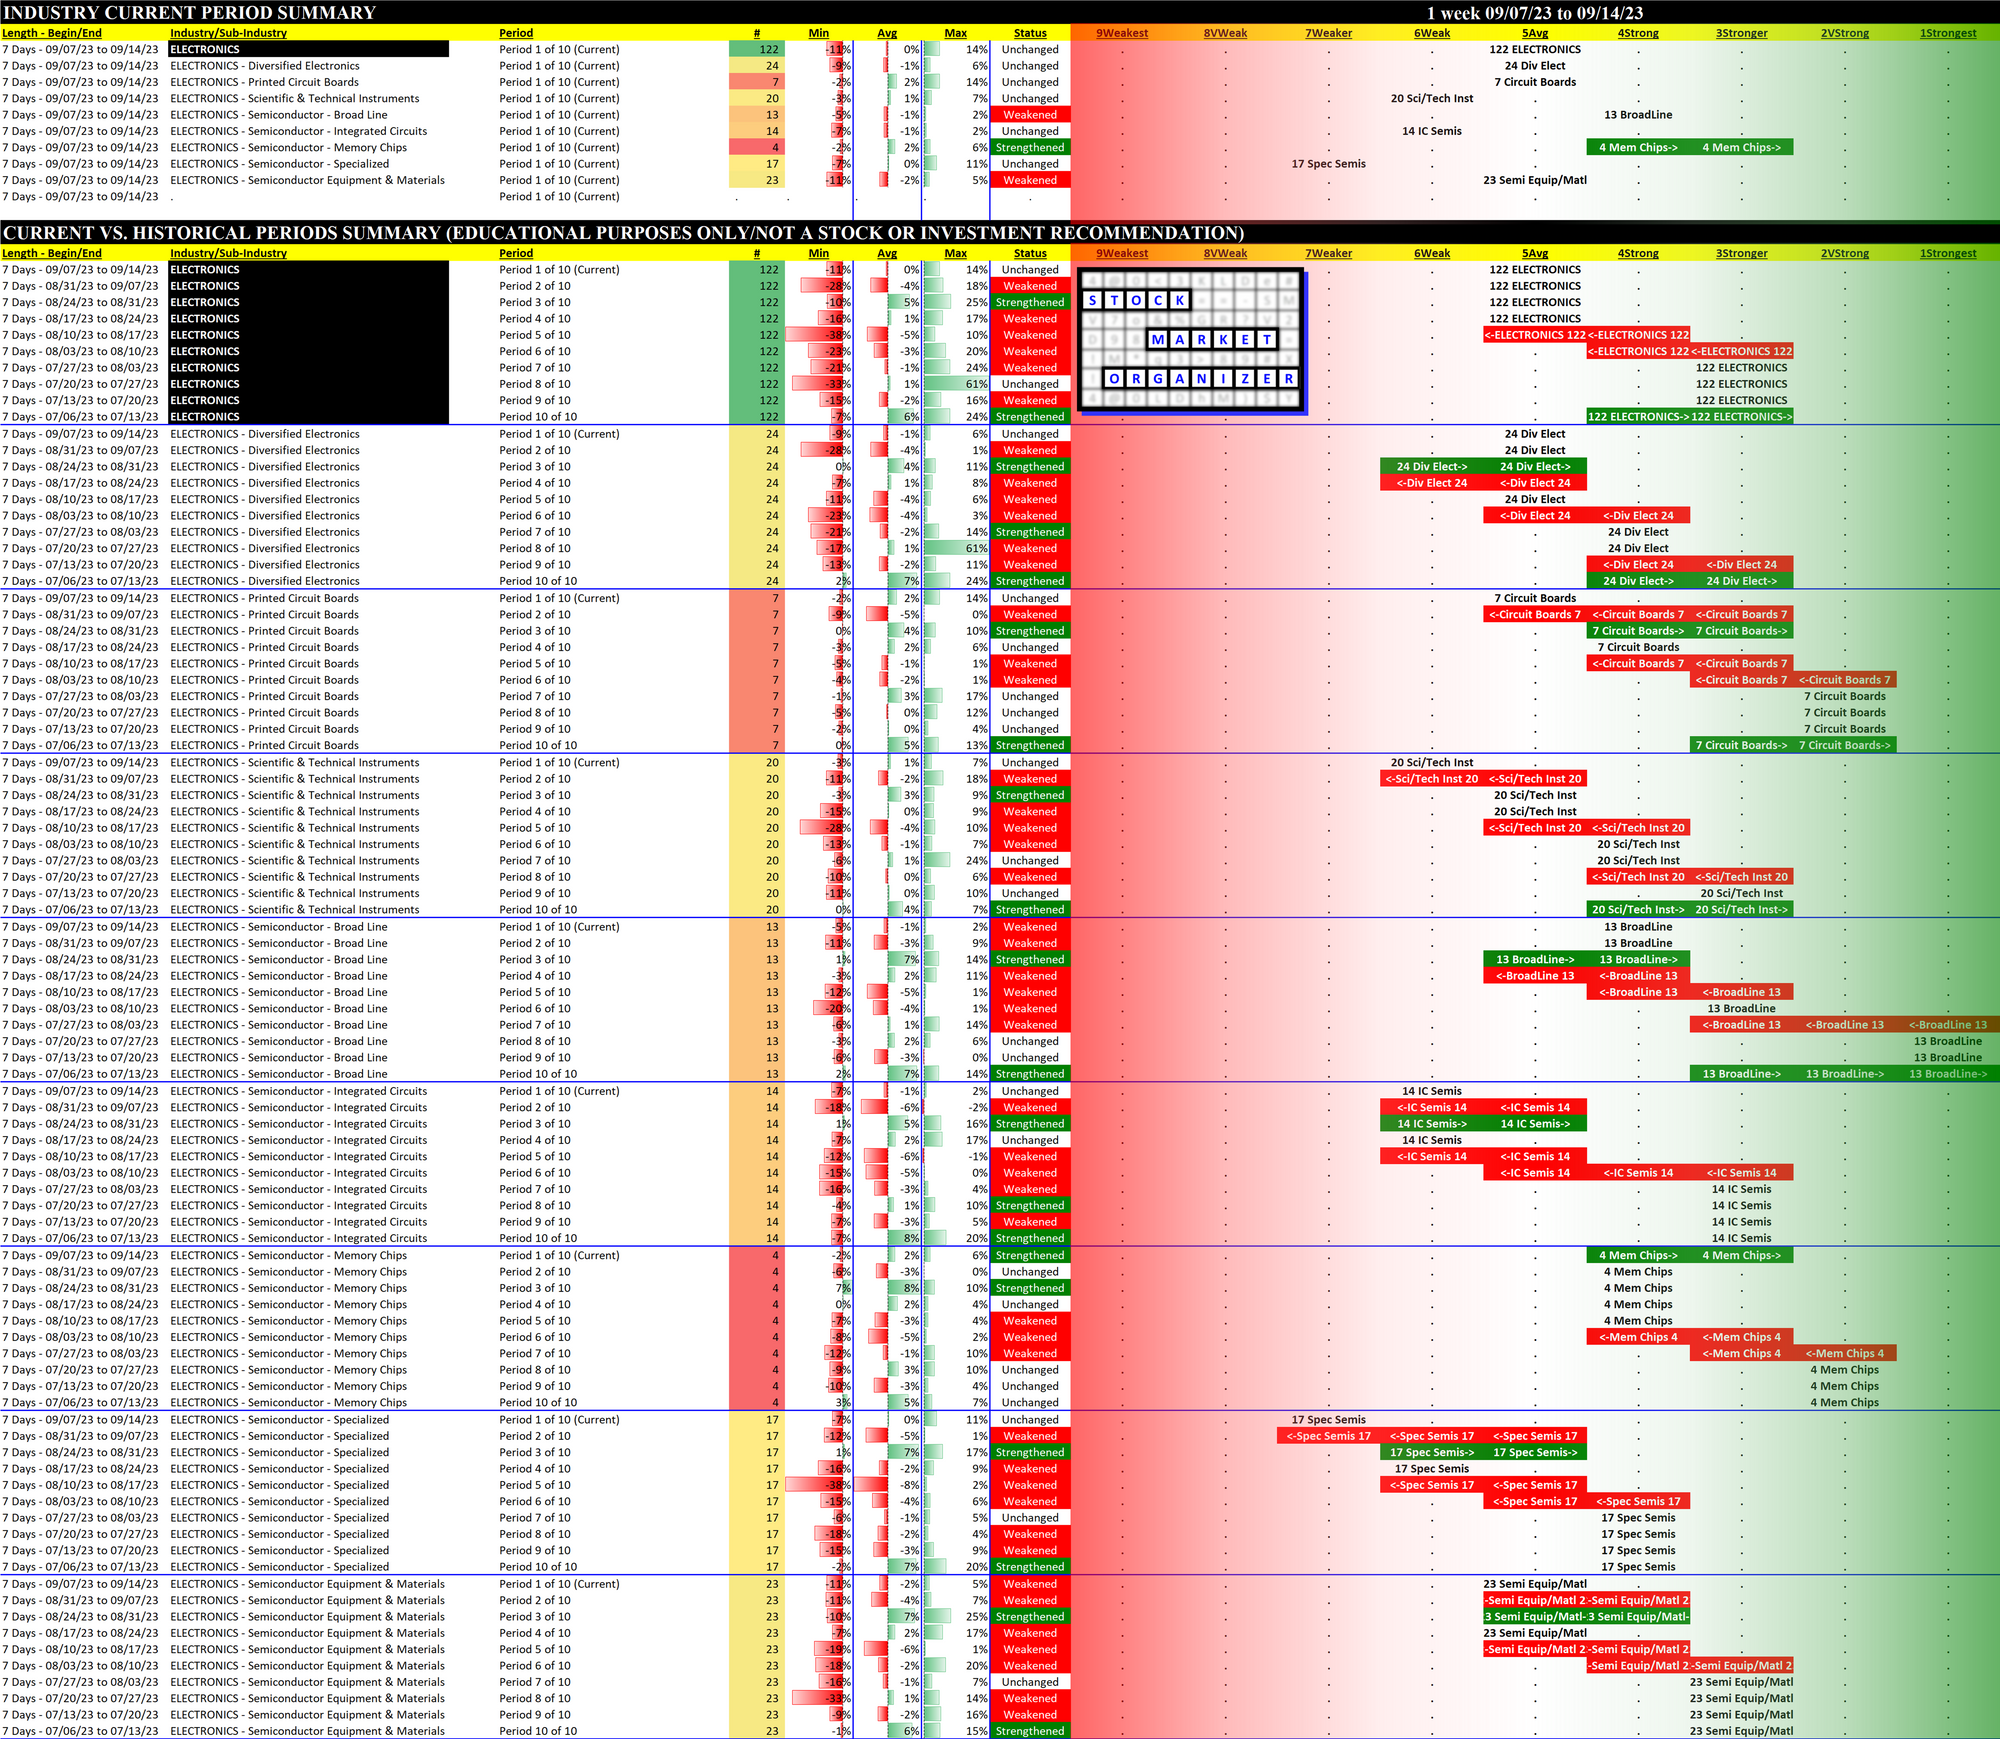
10-Week Week-by-Week Industry/Sub-industry Strength Comparison
What: recent week-by-week strength changes for the industry and each underlying sub-industry
Why: objective measurement of strengthening and weakening enabling comparison within and across industries and sub-industries
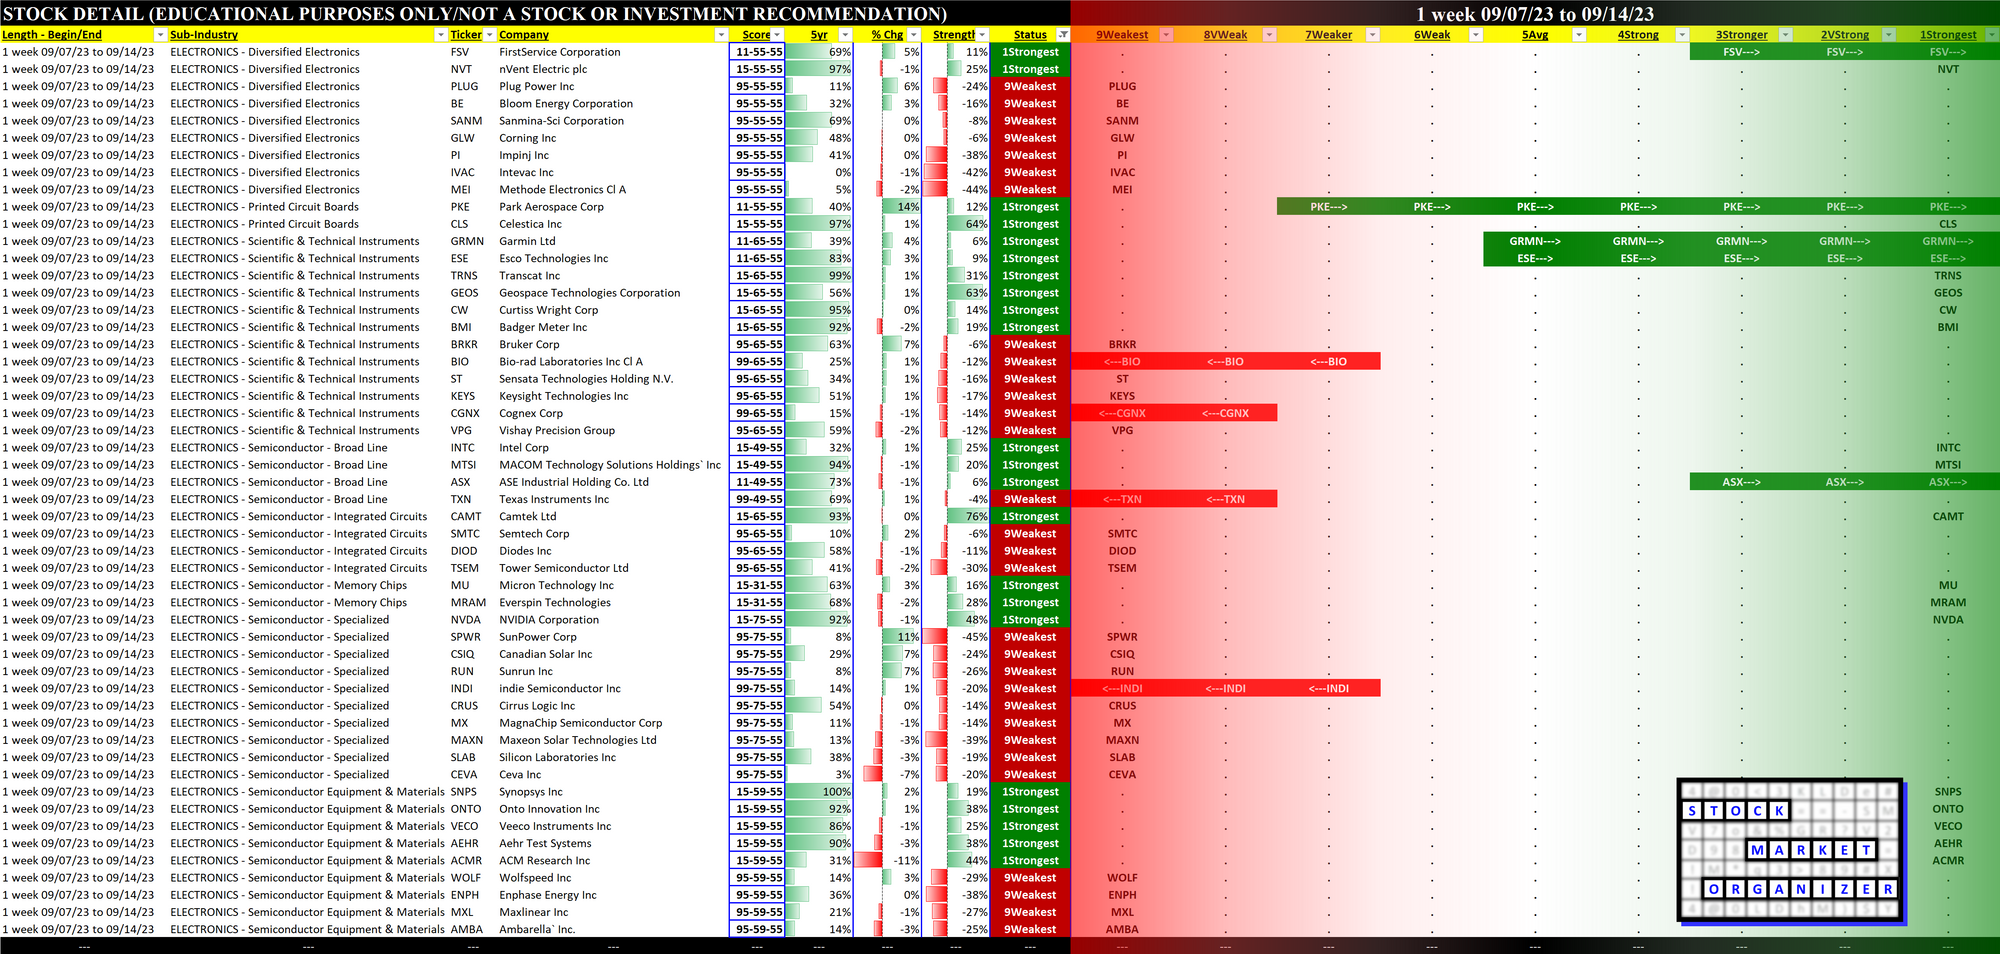
Strongest and Weakest Stocks
What: stocks currently rated Strongest/Weakest (highest/lowest of 9 strength ratings)
Why: most interesting stocks for available capital because
- the Strongest may be meme-stock mania candidates prone to breakouts, and
- the Weakest may be prone to large bottom-fishing/short-covering-driven pops... and may also be primed for bigger and faster falls. (Not guaranteed and not a recommendation - weak stocks in weakening sub-industries may be better shorts than high-flyers.)
YTD Lookback
4 Weeks Lookback