Diversified Services 2023-10-09: UP +1 to AVERAGE strength rating (5th strongest of 9 levels), previous move was DOWN
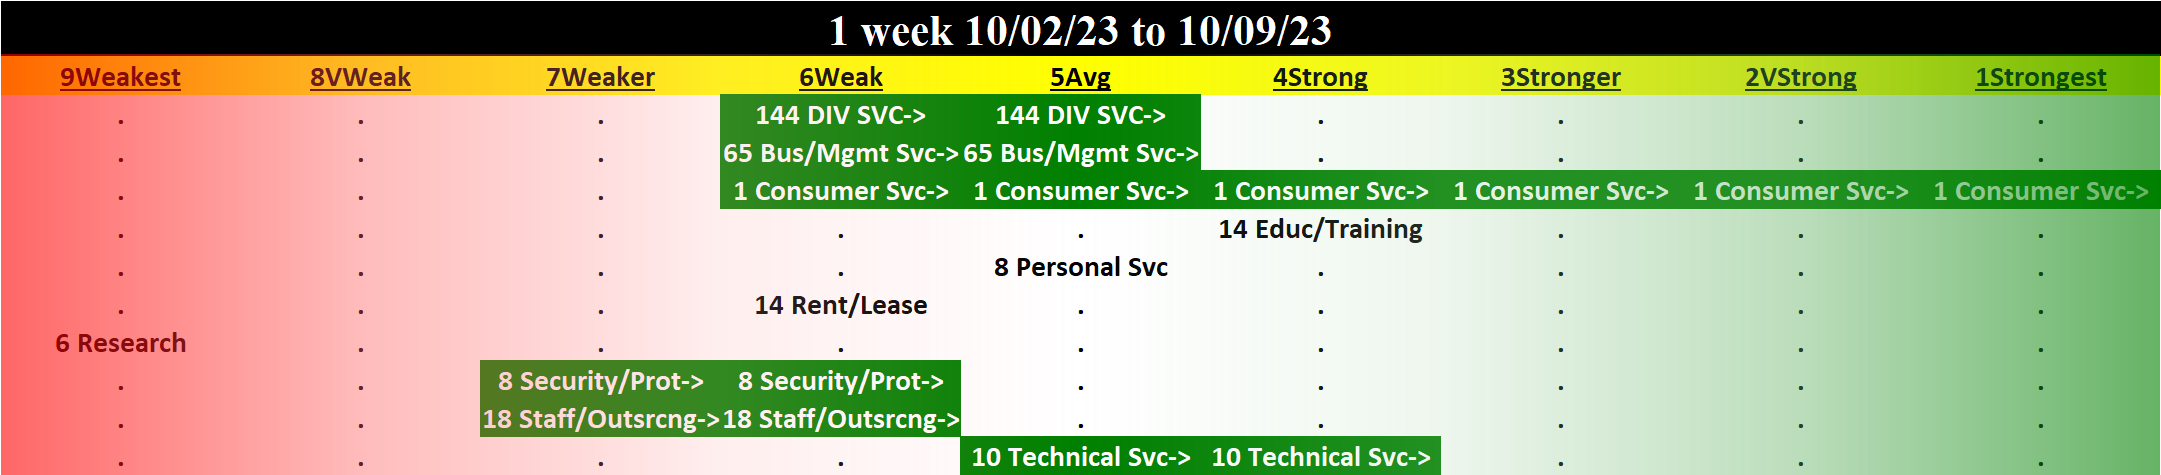
TABLE OF CONTENTS
- INDUSTRY OVERVIEW
1A. Performance
1B. Background - SUB-INDUSTRIES AND STOCKS DETAIL
2A. Sub-Industries Overview
2B. Sub-Industries 10-Week Strengthening Analysis
2C. Stocks 1 Week Strongest and Weakest - STRENGTH BY LOOKBACK PERIOD (with Best/Worst stocks)
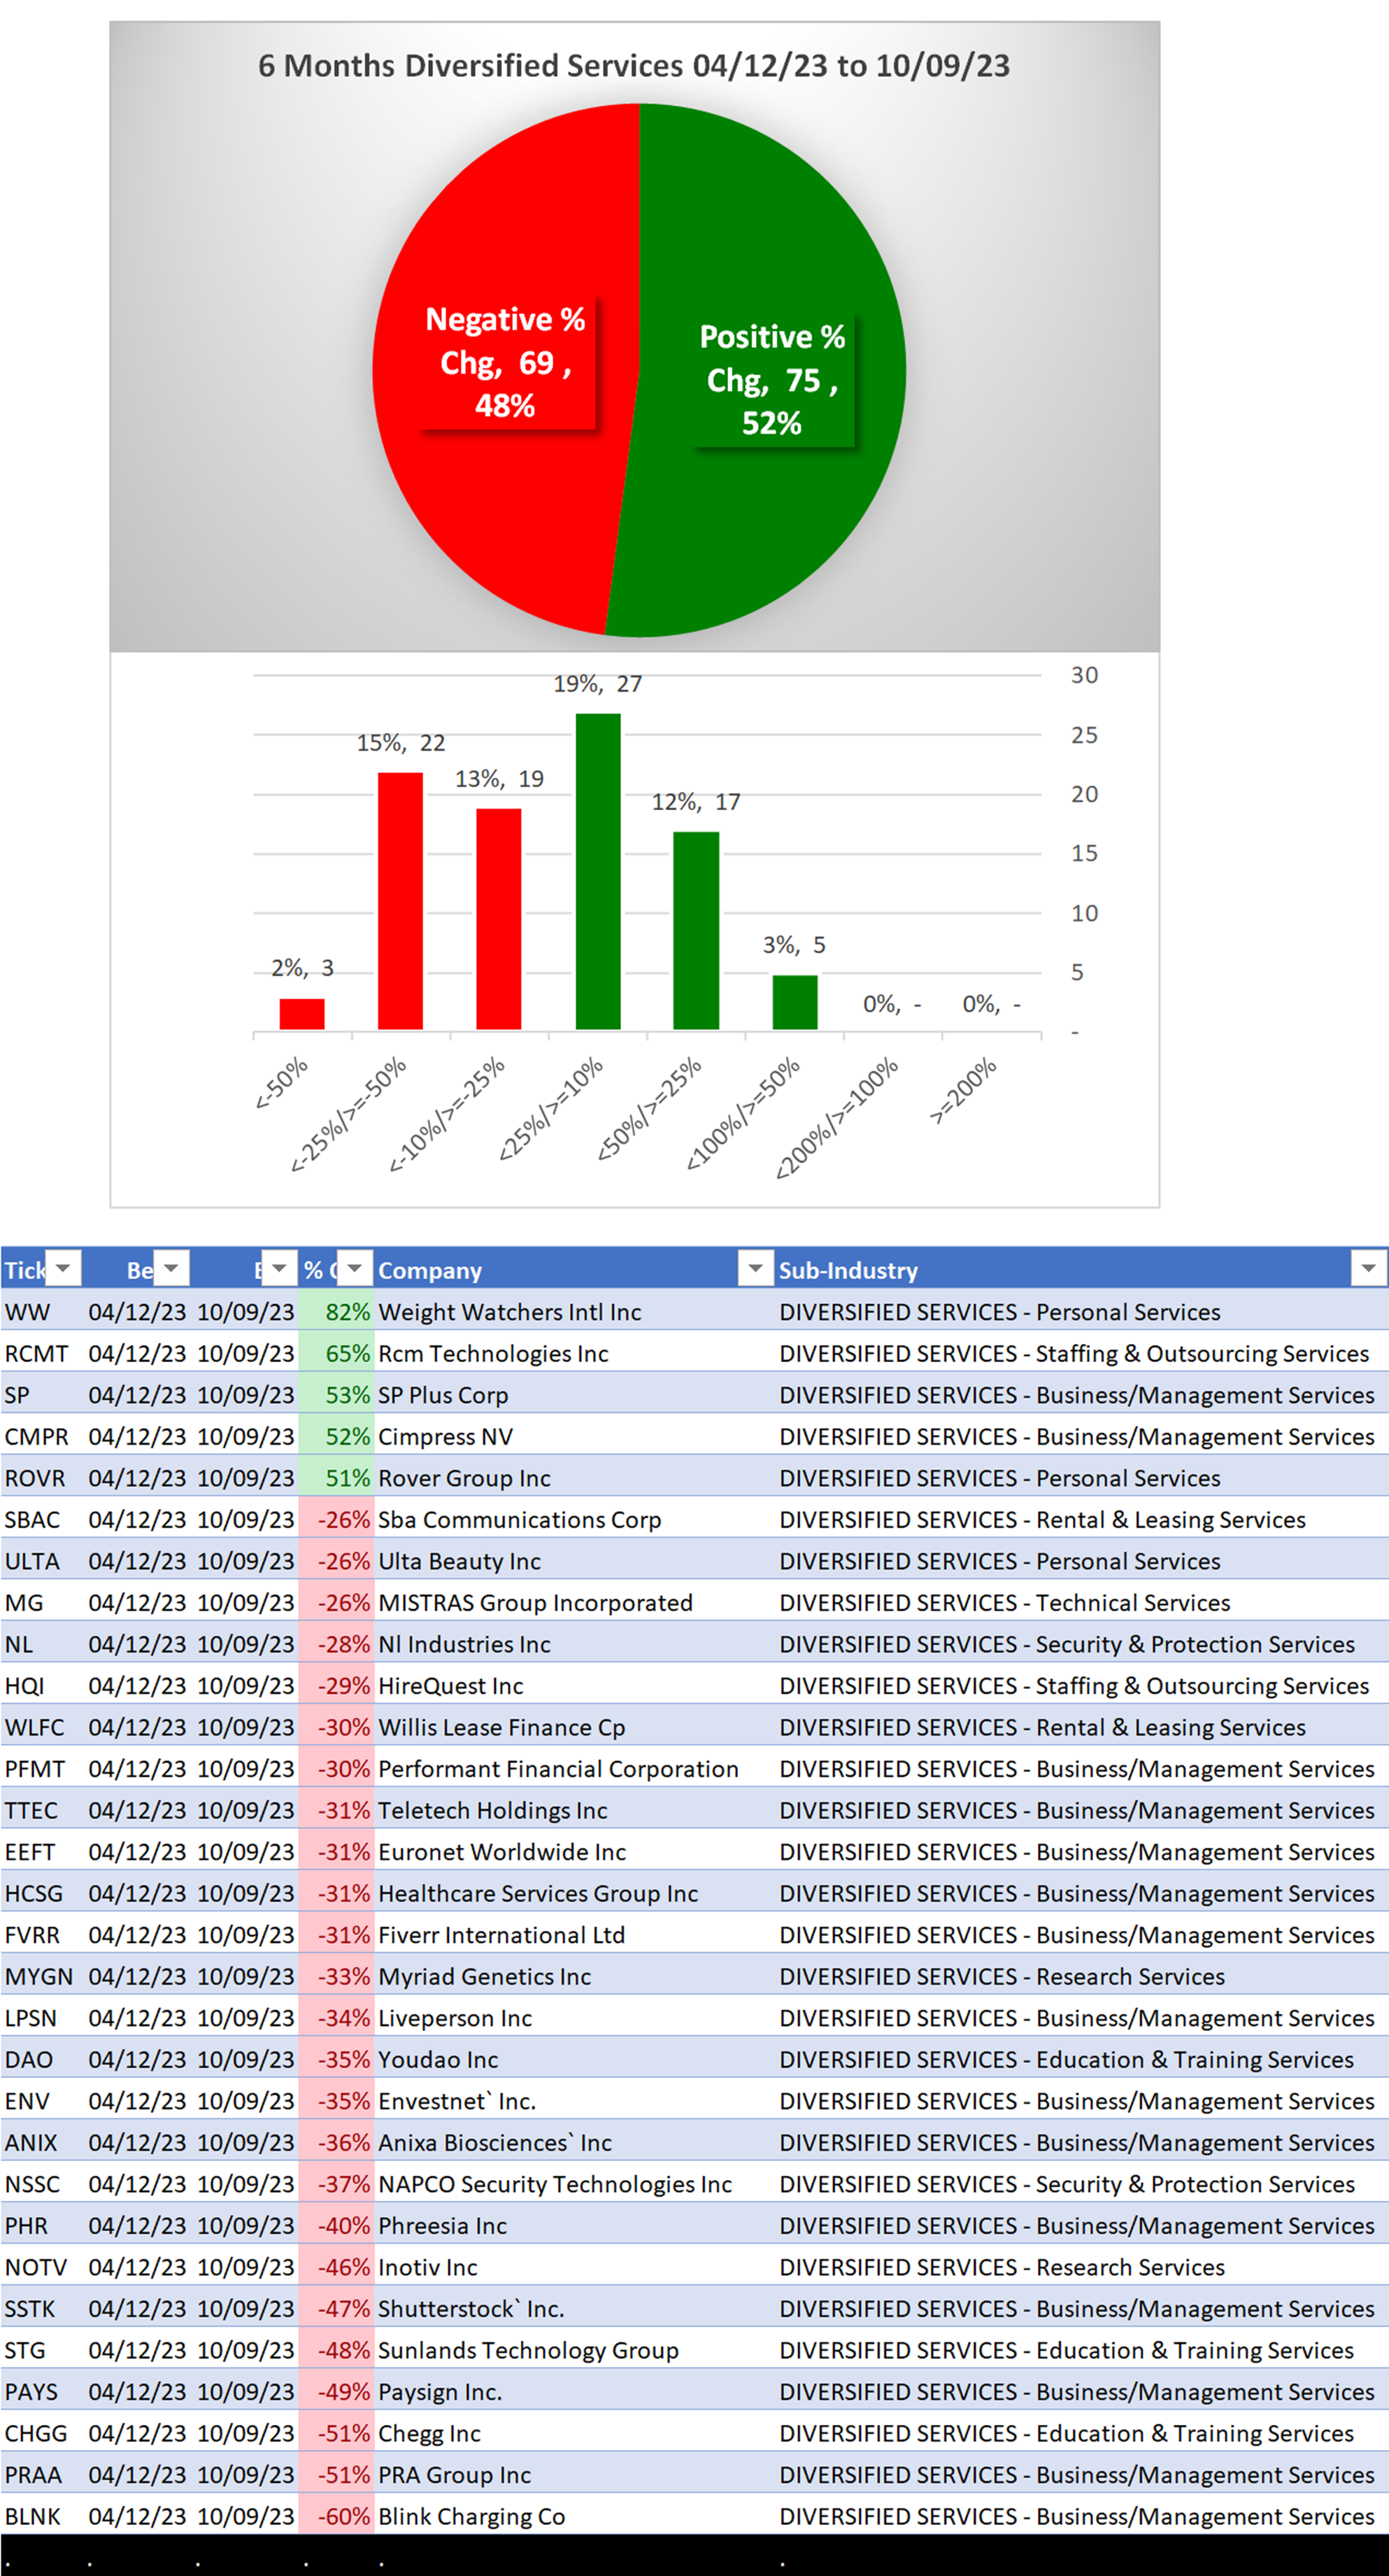
3A. Lookback 6 Months
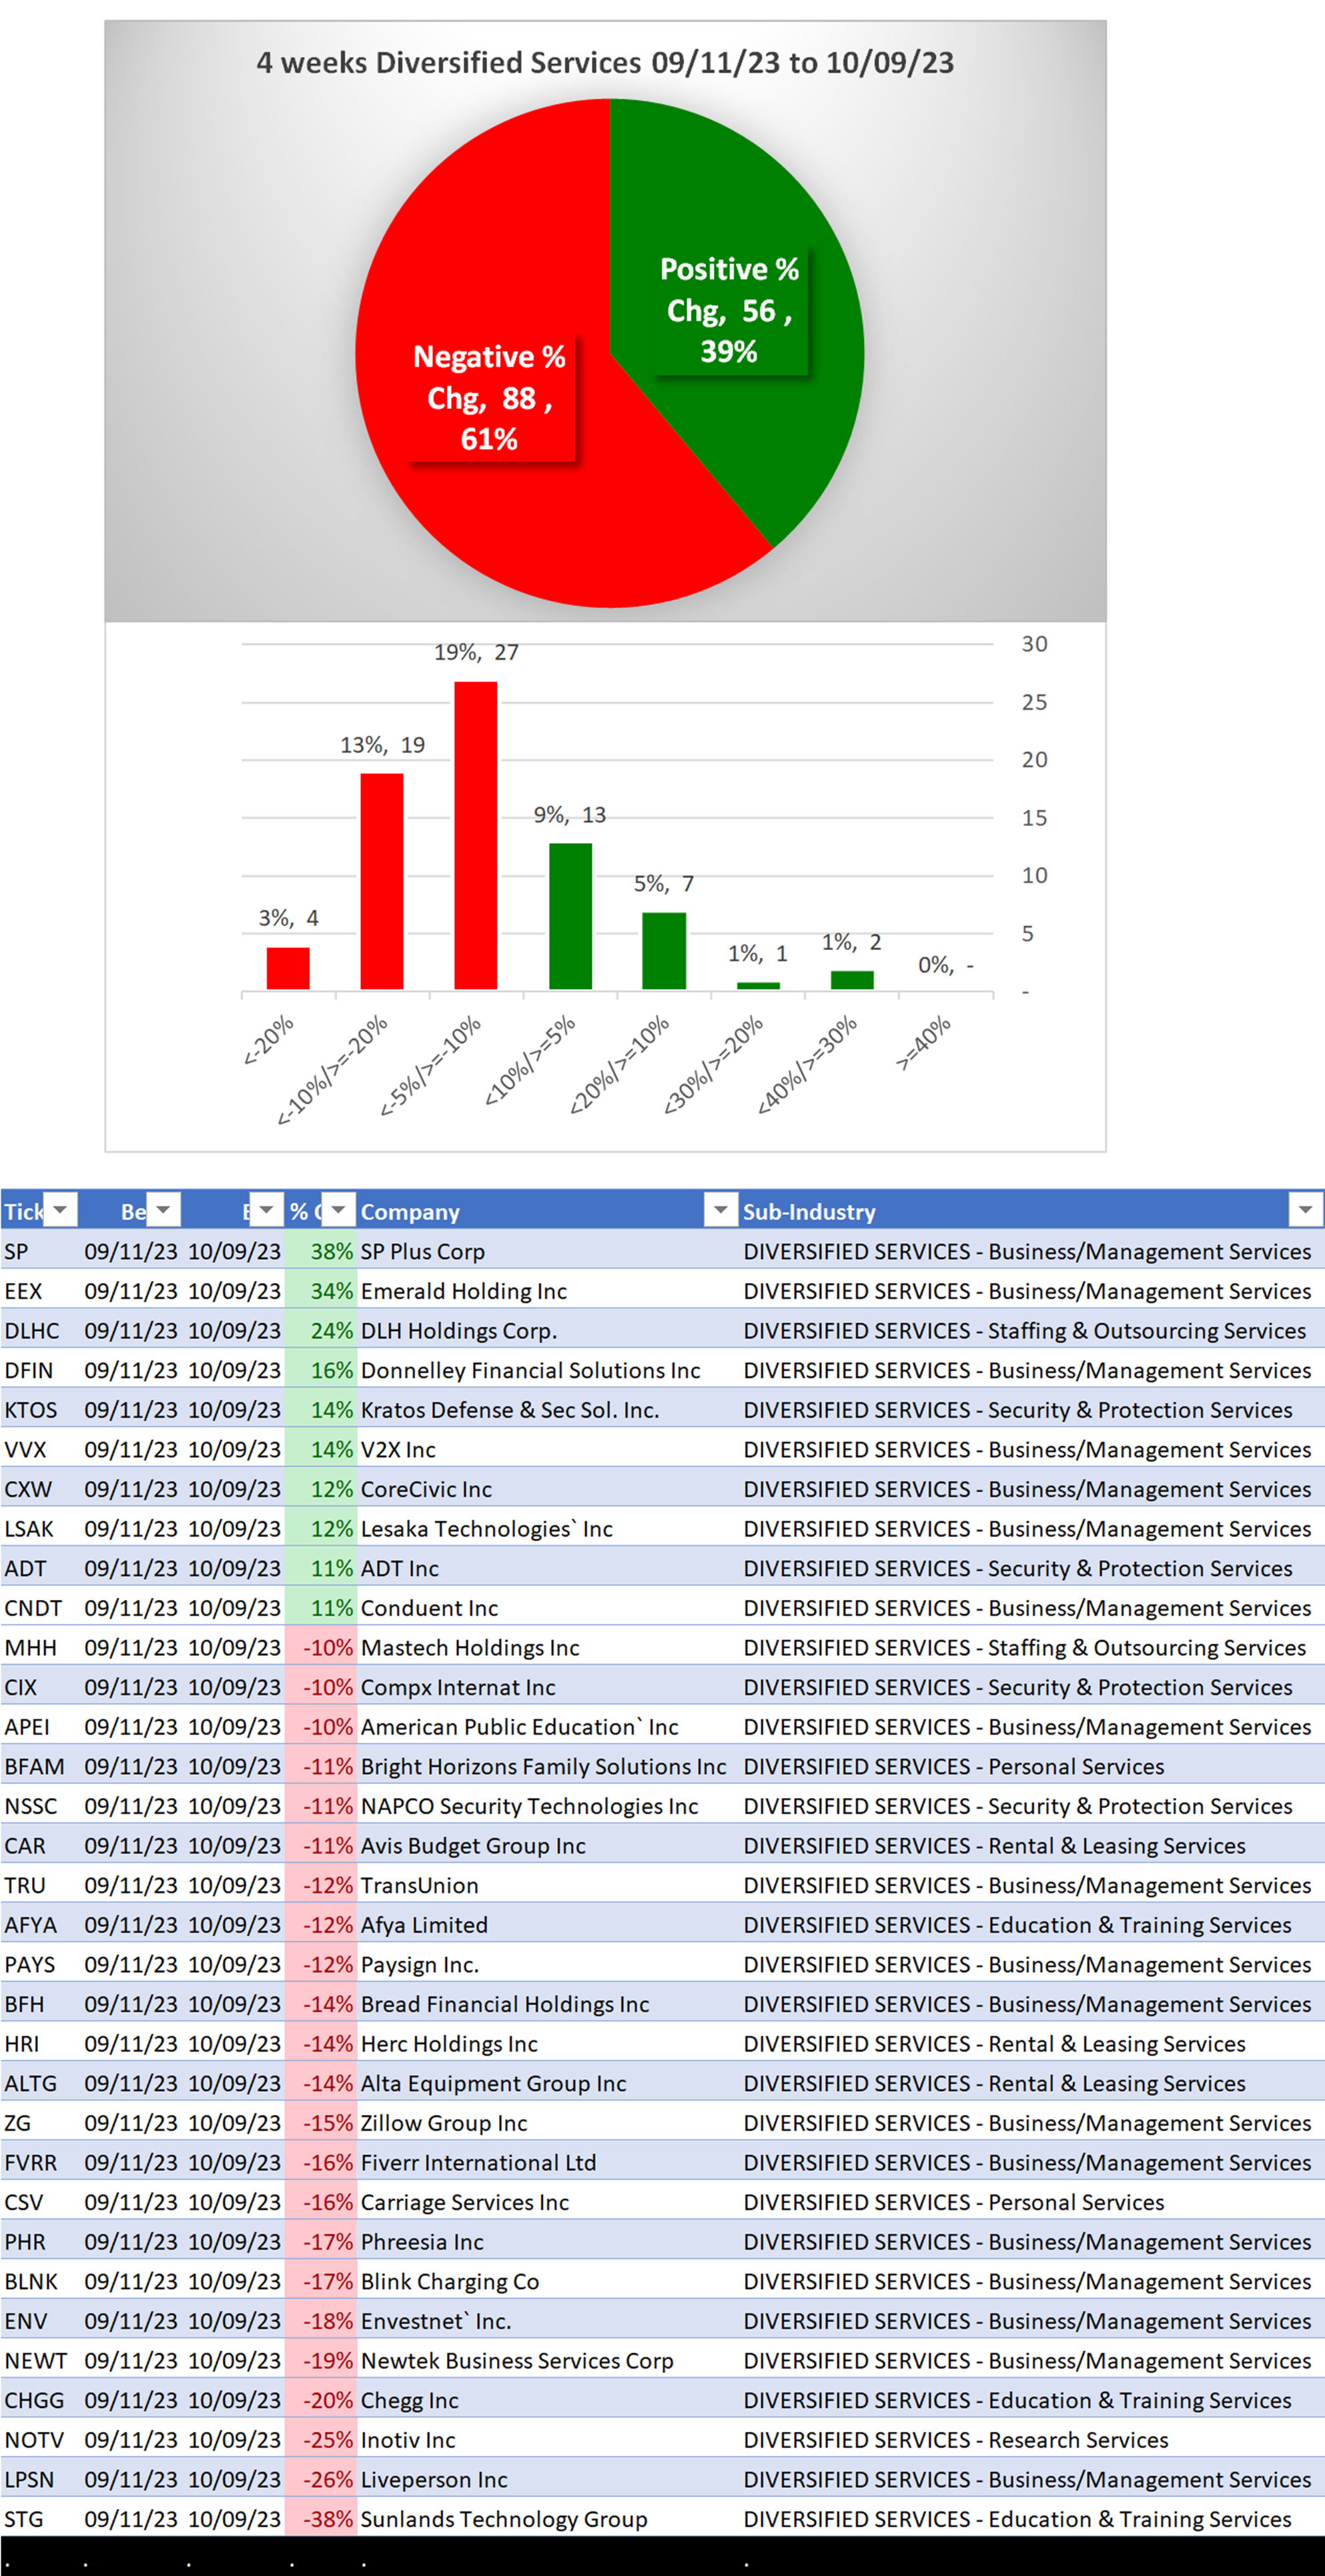
3B. Lookback 4 weeks
3C. Lookback 1 Week
1. INDUSTRY OVERVIEW
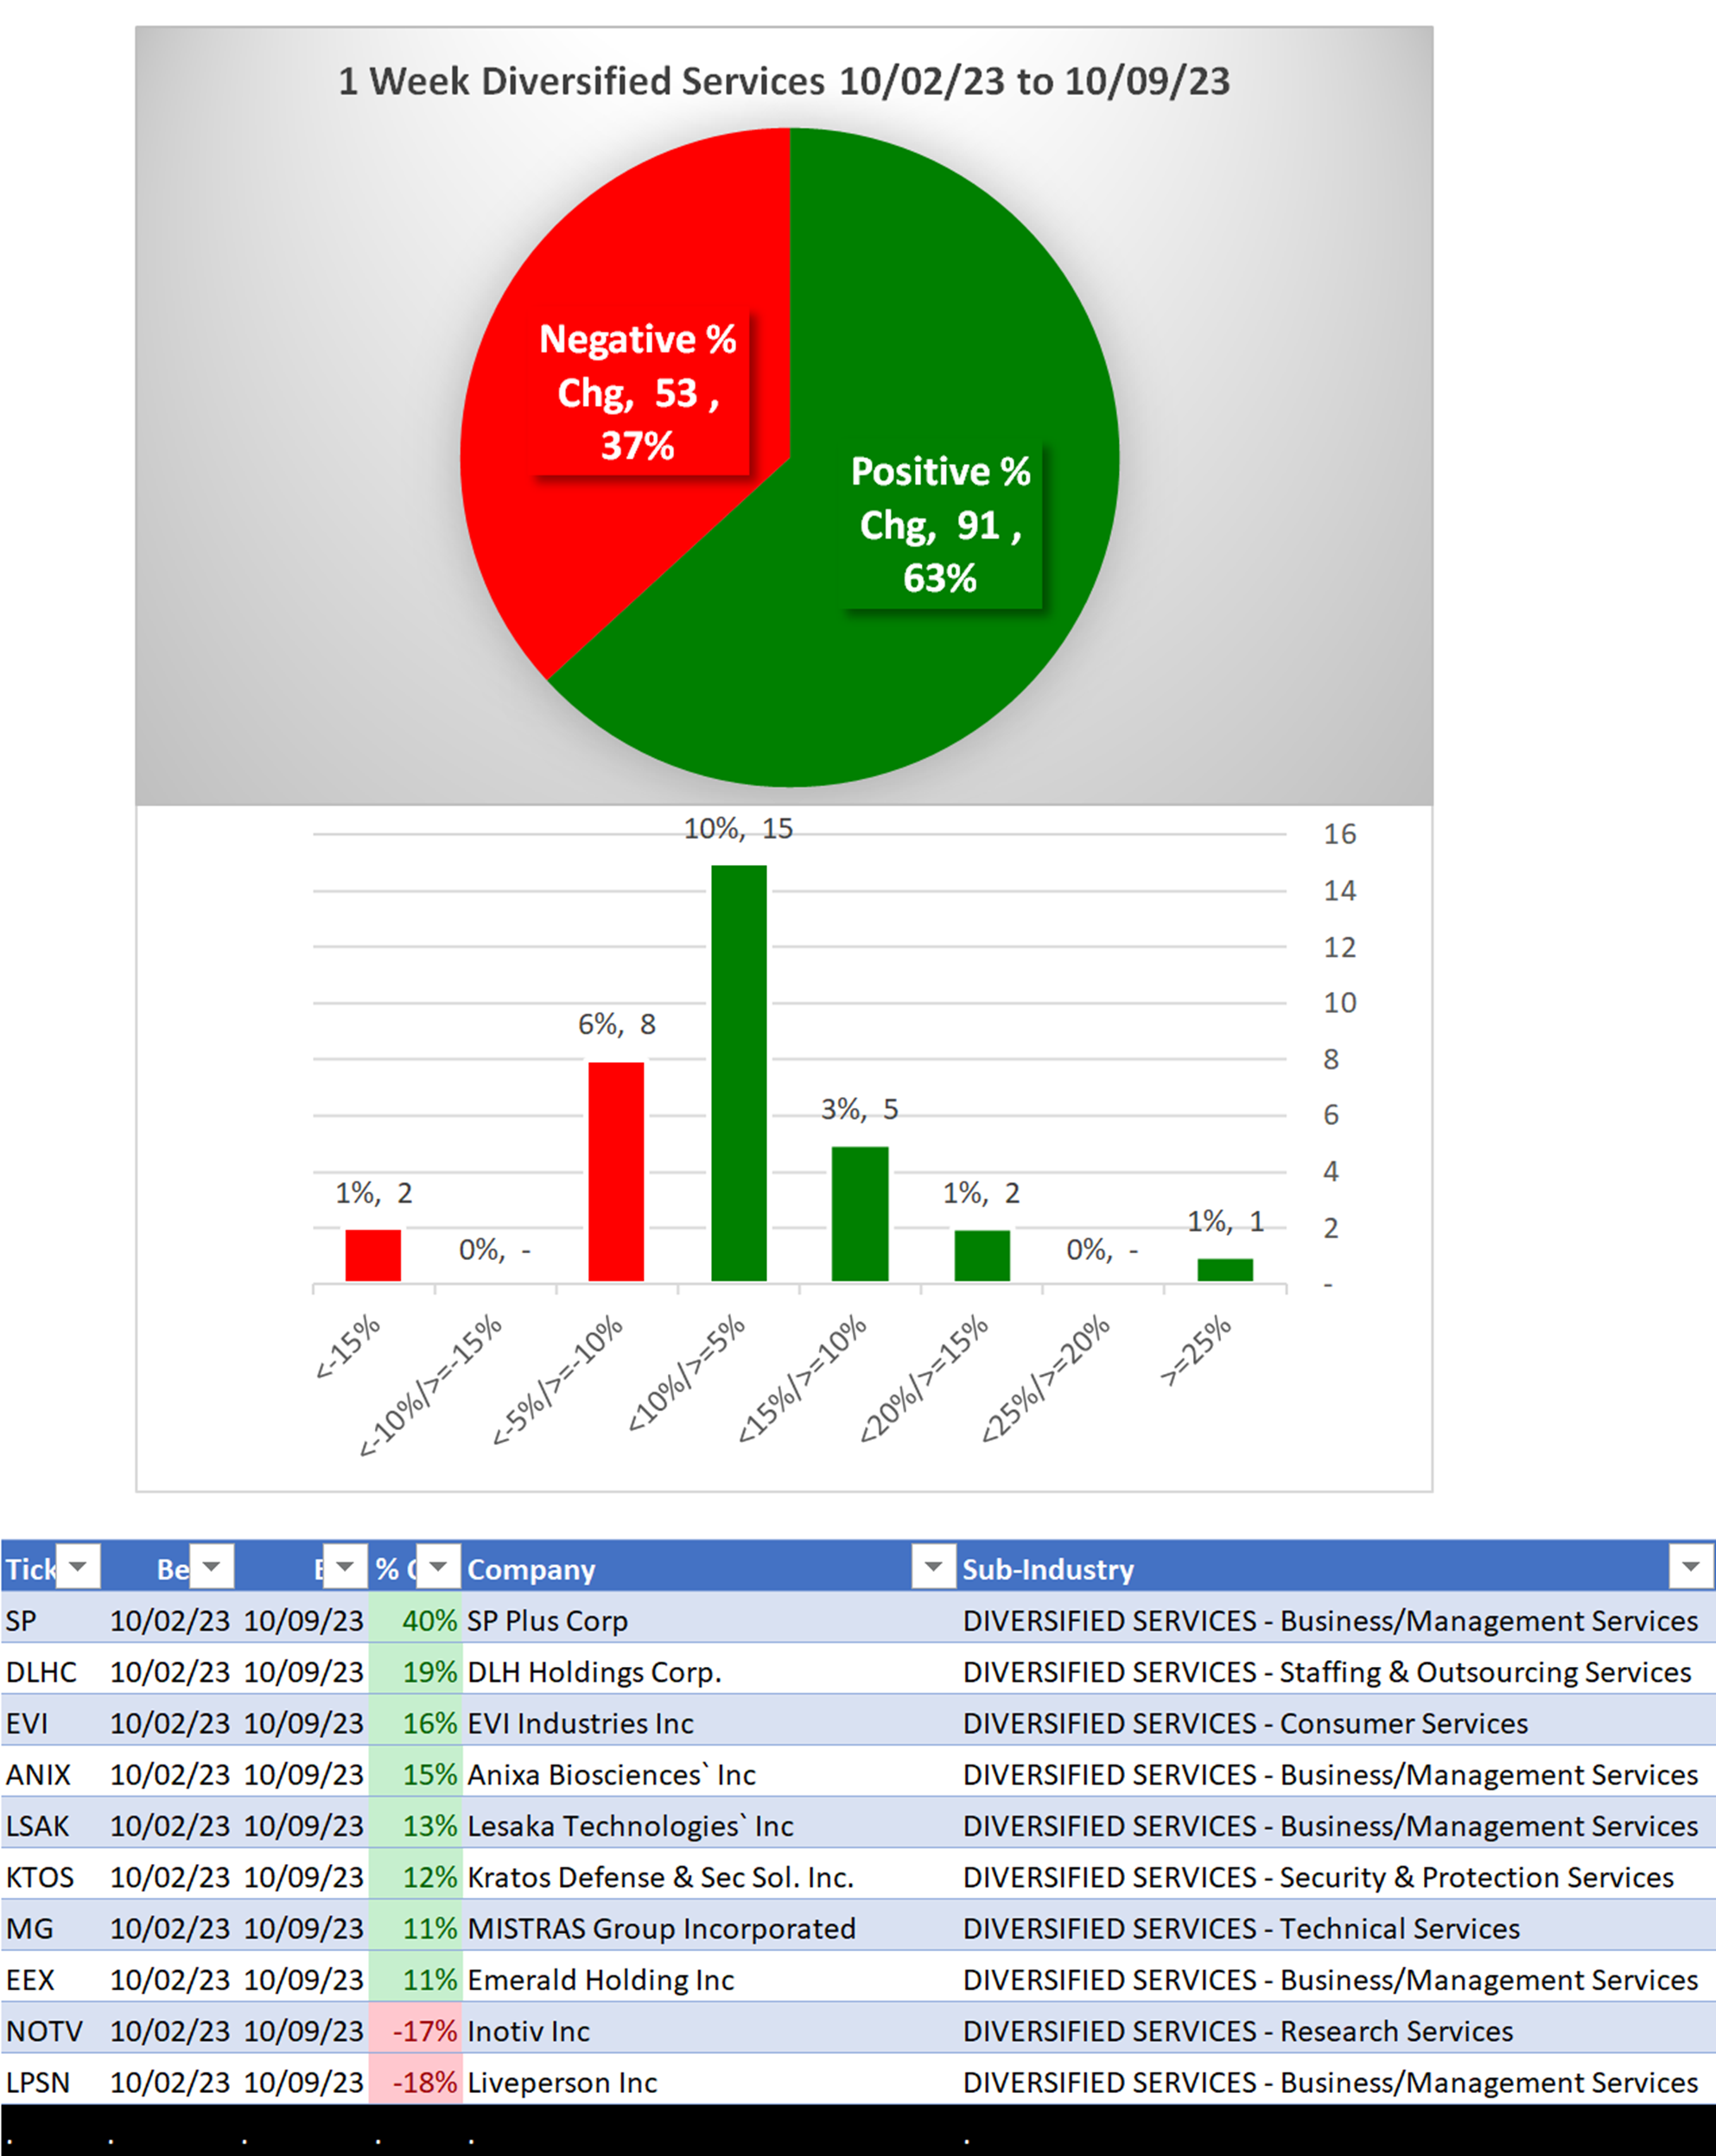
1A. Performance
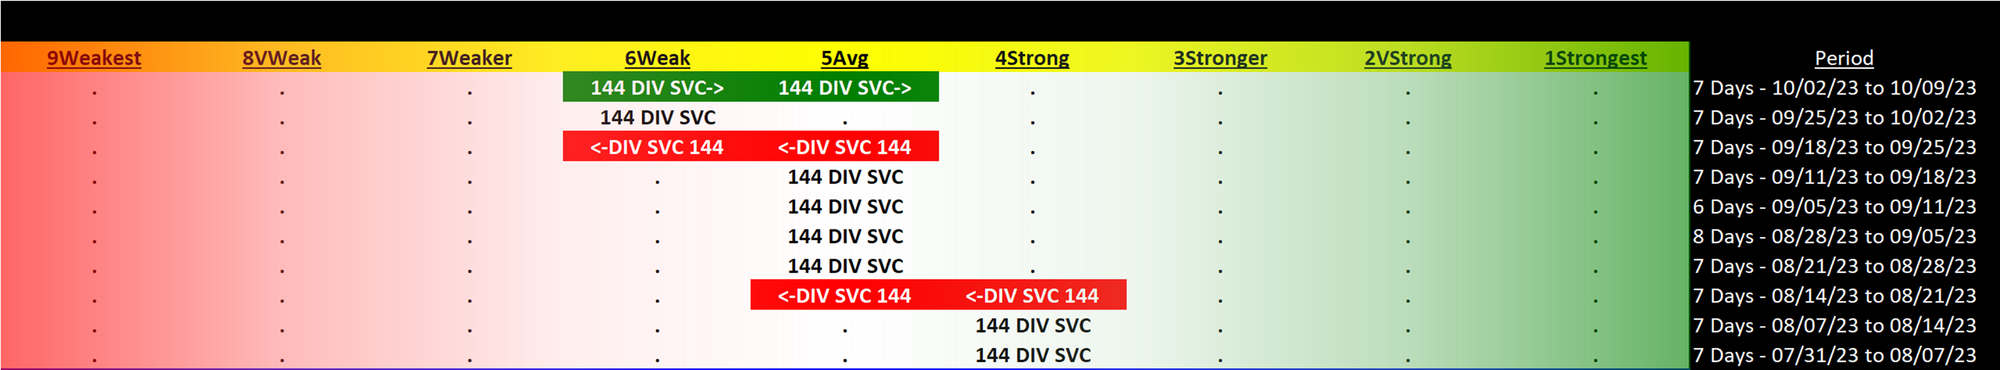
Past 10 Weeks Strengthening/Weakening week-by-week, per the following chart:
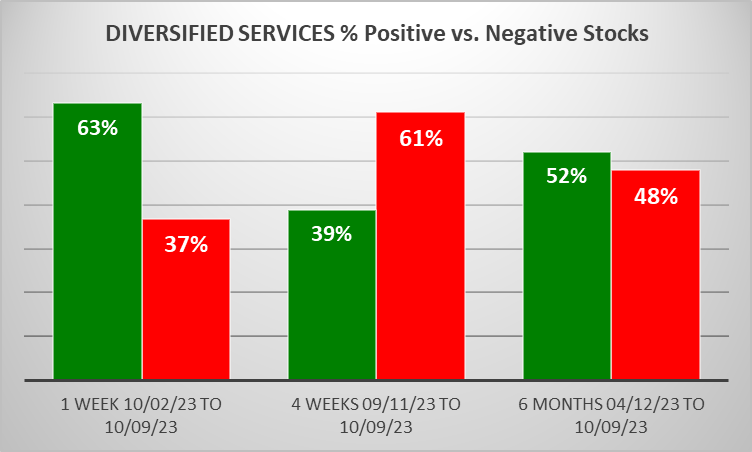
STRENGTHENING 1 Week vs. Mid- and Longer-Term // 1 week positive/negative stocks ratio is HIGHER than both 4 weeks and 6 Months, per the following chart:
Comment:
- Research remains Weakest but 5 strengthening sub-industries is a healthy move.
1B. Background
Largest of 9 sub-industries (144 stocks, average 16):
- Business/Management Services (65 stocks)
- Staffing & Outsourcing Services (18 stocks)
- Education & Training Services (14 stocks)
- Rental & Leasing Services (14 stocks)
Top 10 by Market Capitalization:
V/Visa Inc, MA/Mastercard Incorporated, FI/Fiserv Inc., MCO/Moody's Corporation, CTAS/Cintas Corp, PAYX/Paychex Inc, VRSK/Verisk Analytics Inc, GPN/Global Pmts Inc, URI/United Rentals Inc, FICO/Fair Isaac Inc
2. SUB-INDUSTRIES AND STOCKS DETAIL
2A. Sub-Industries Overview
Strengthened: 5/9 sub-industries
Weakened: 0/9 sub-industries
STRONGEST at Strongest rating/1st strongest of 9 levels:
- Consumer Services (1 stock)
- Education & Training Services (14 stocks) (4th/Strong rating, more than 1 stock)
- Technical Services (10 stocks) (4th/Strong rating, more than 1 stock)
WEAKEST at Weakest rating/9th strongest of 9 levels:
- Research Services (6 stocks)
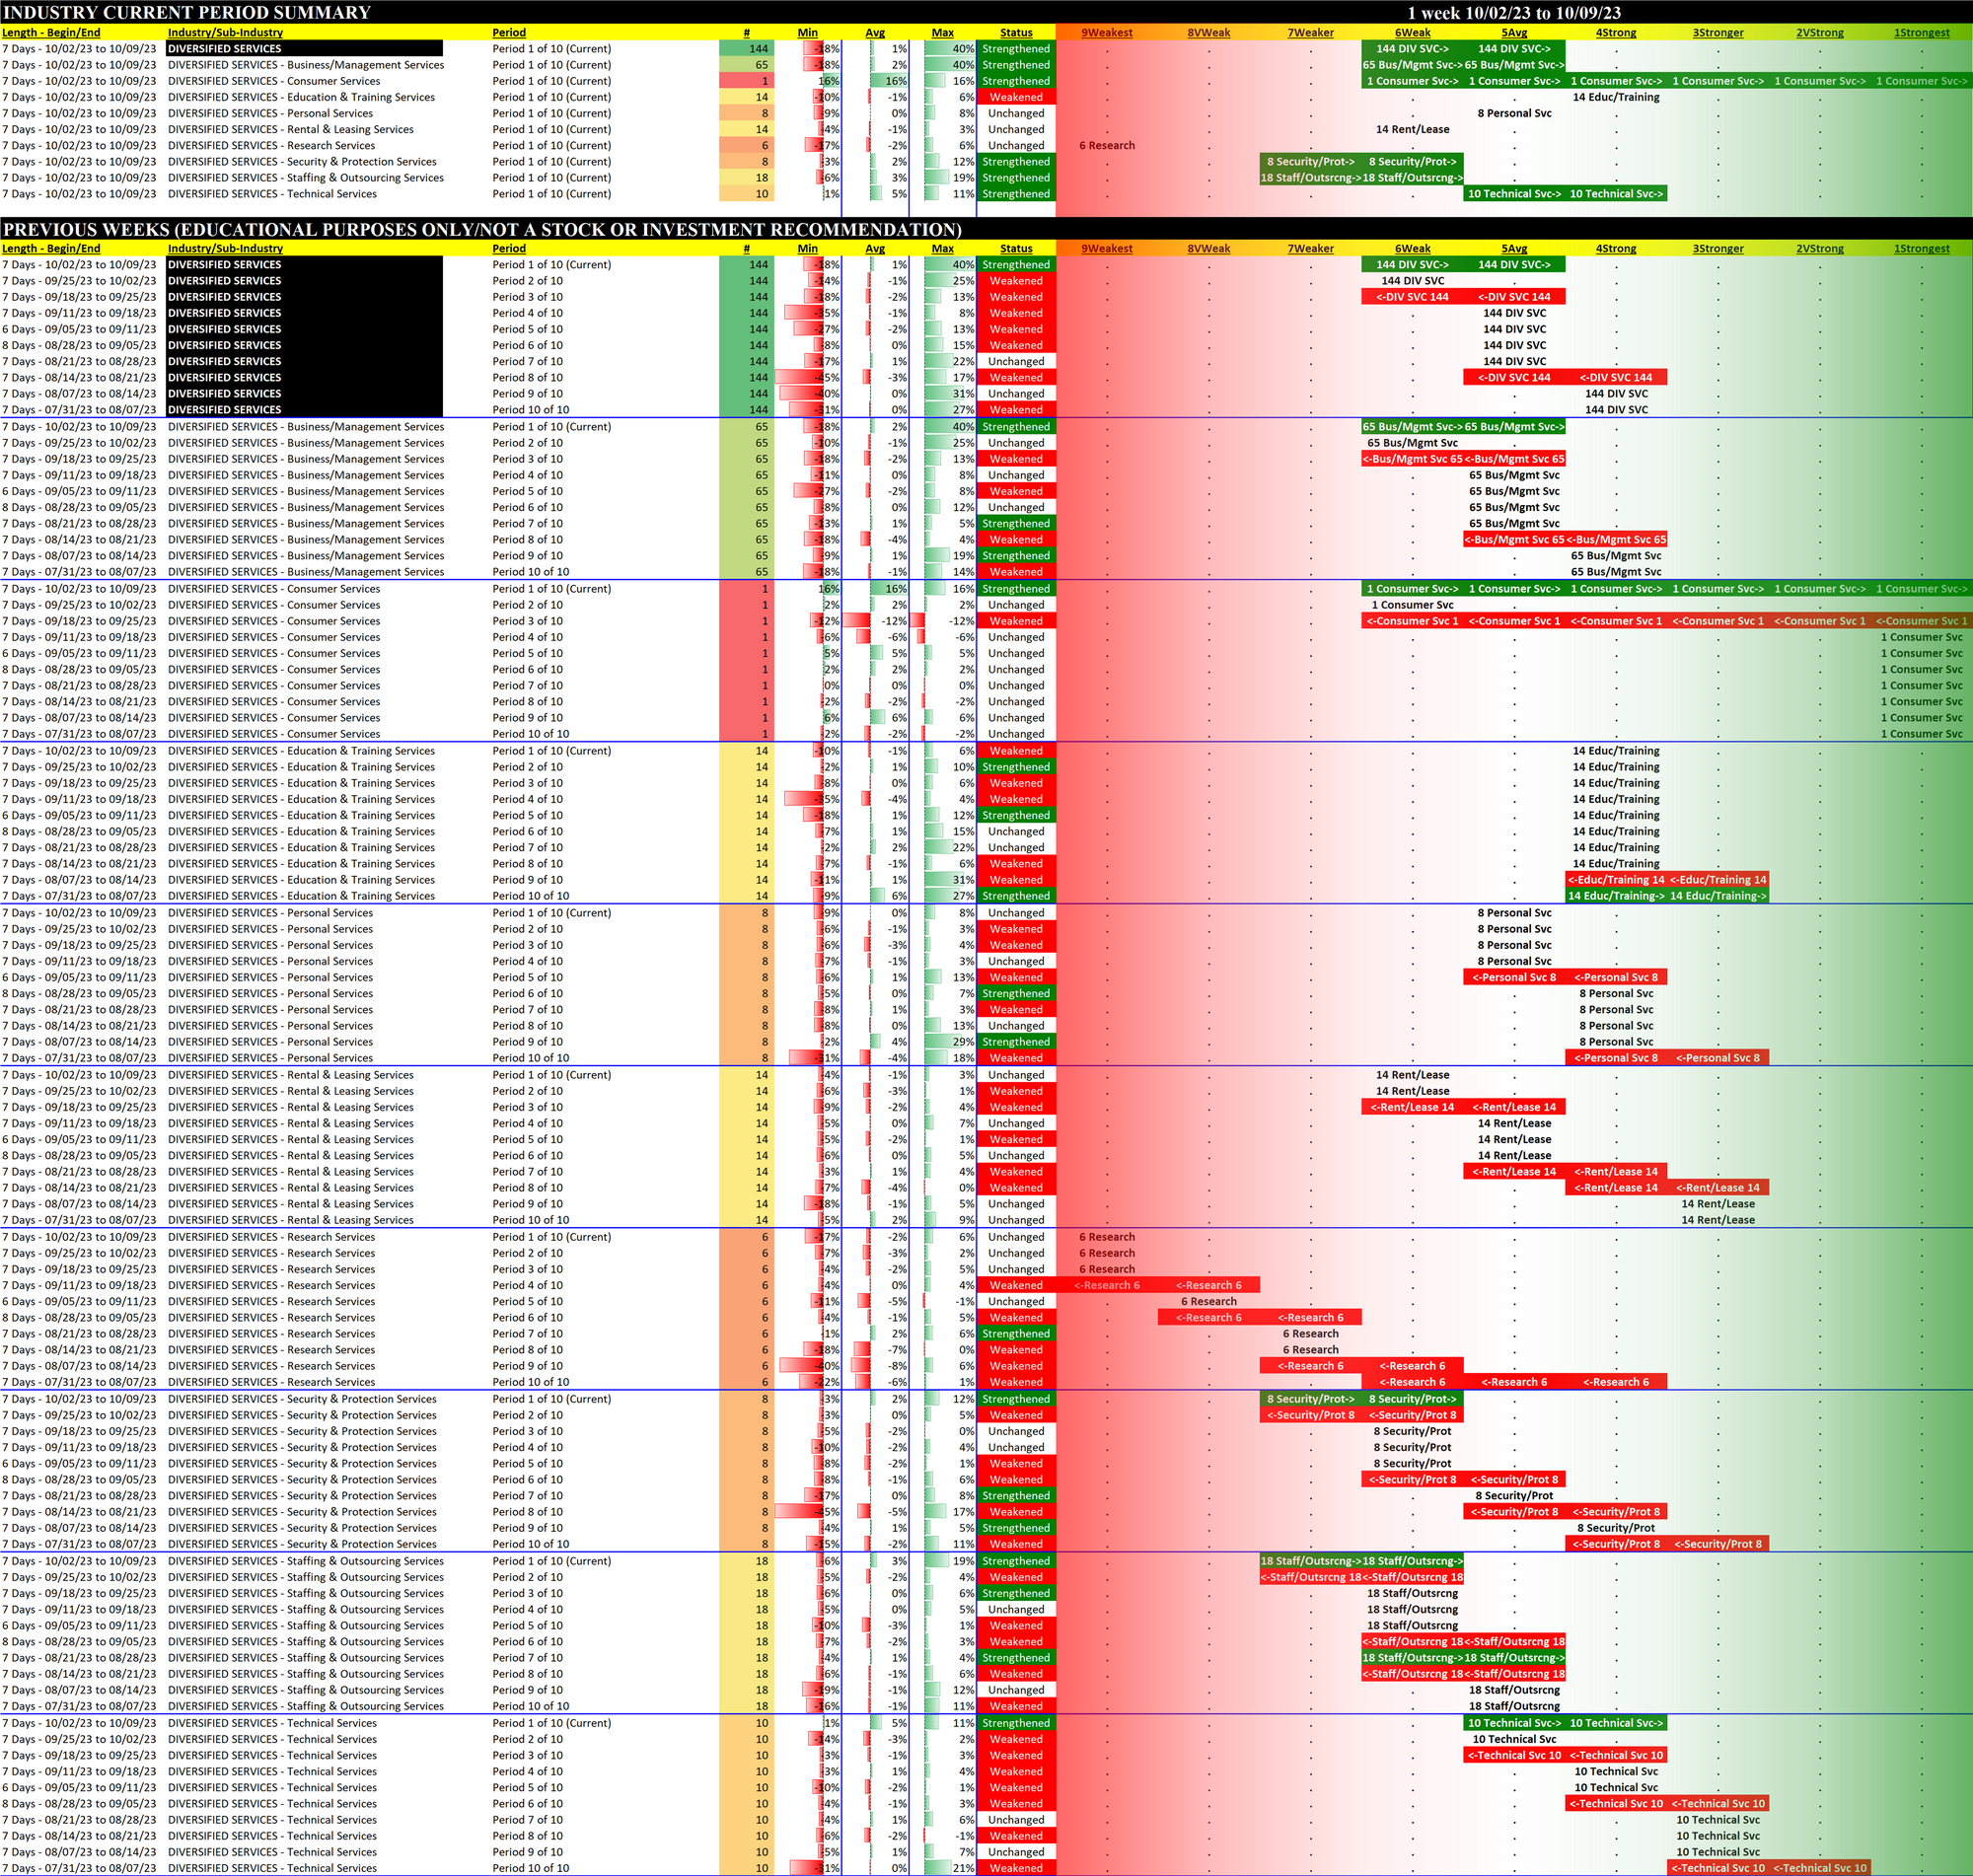
2B. Sub-Industries 10-Week Strengthening Analysis
What: recent week-by-week strength changes for the industry and each underlying sub-industry
Why: objective measurement of strengthening and weakening enabling comparison within and across industries and sub-industries
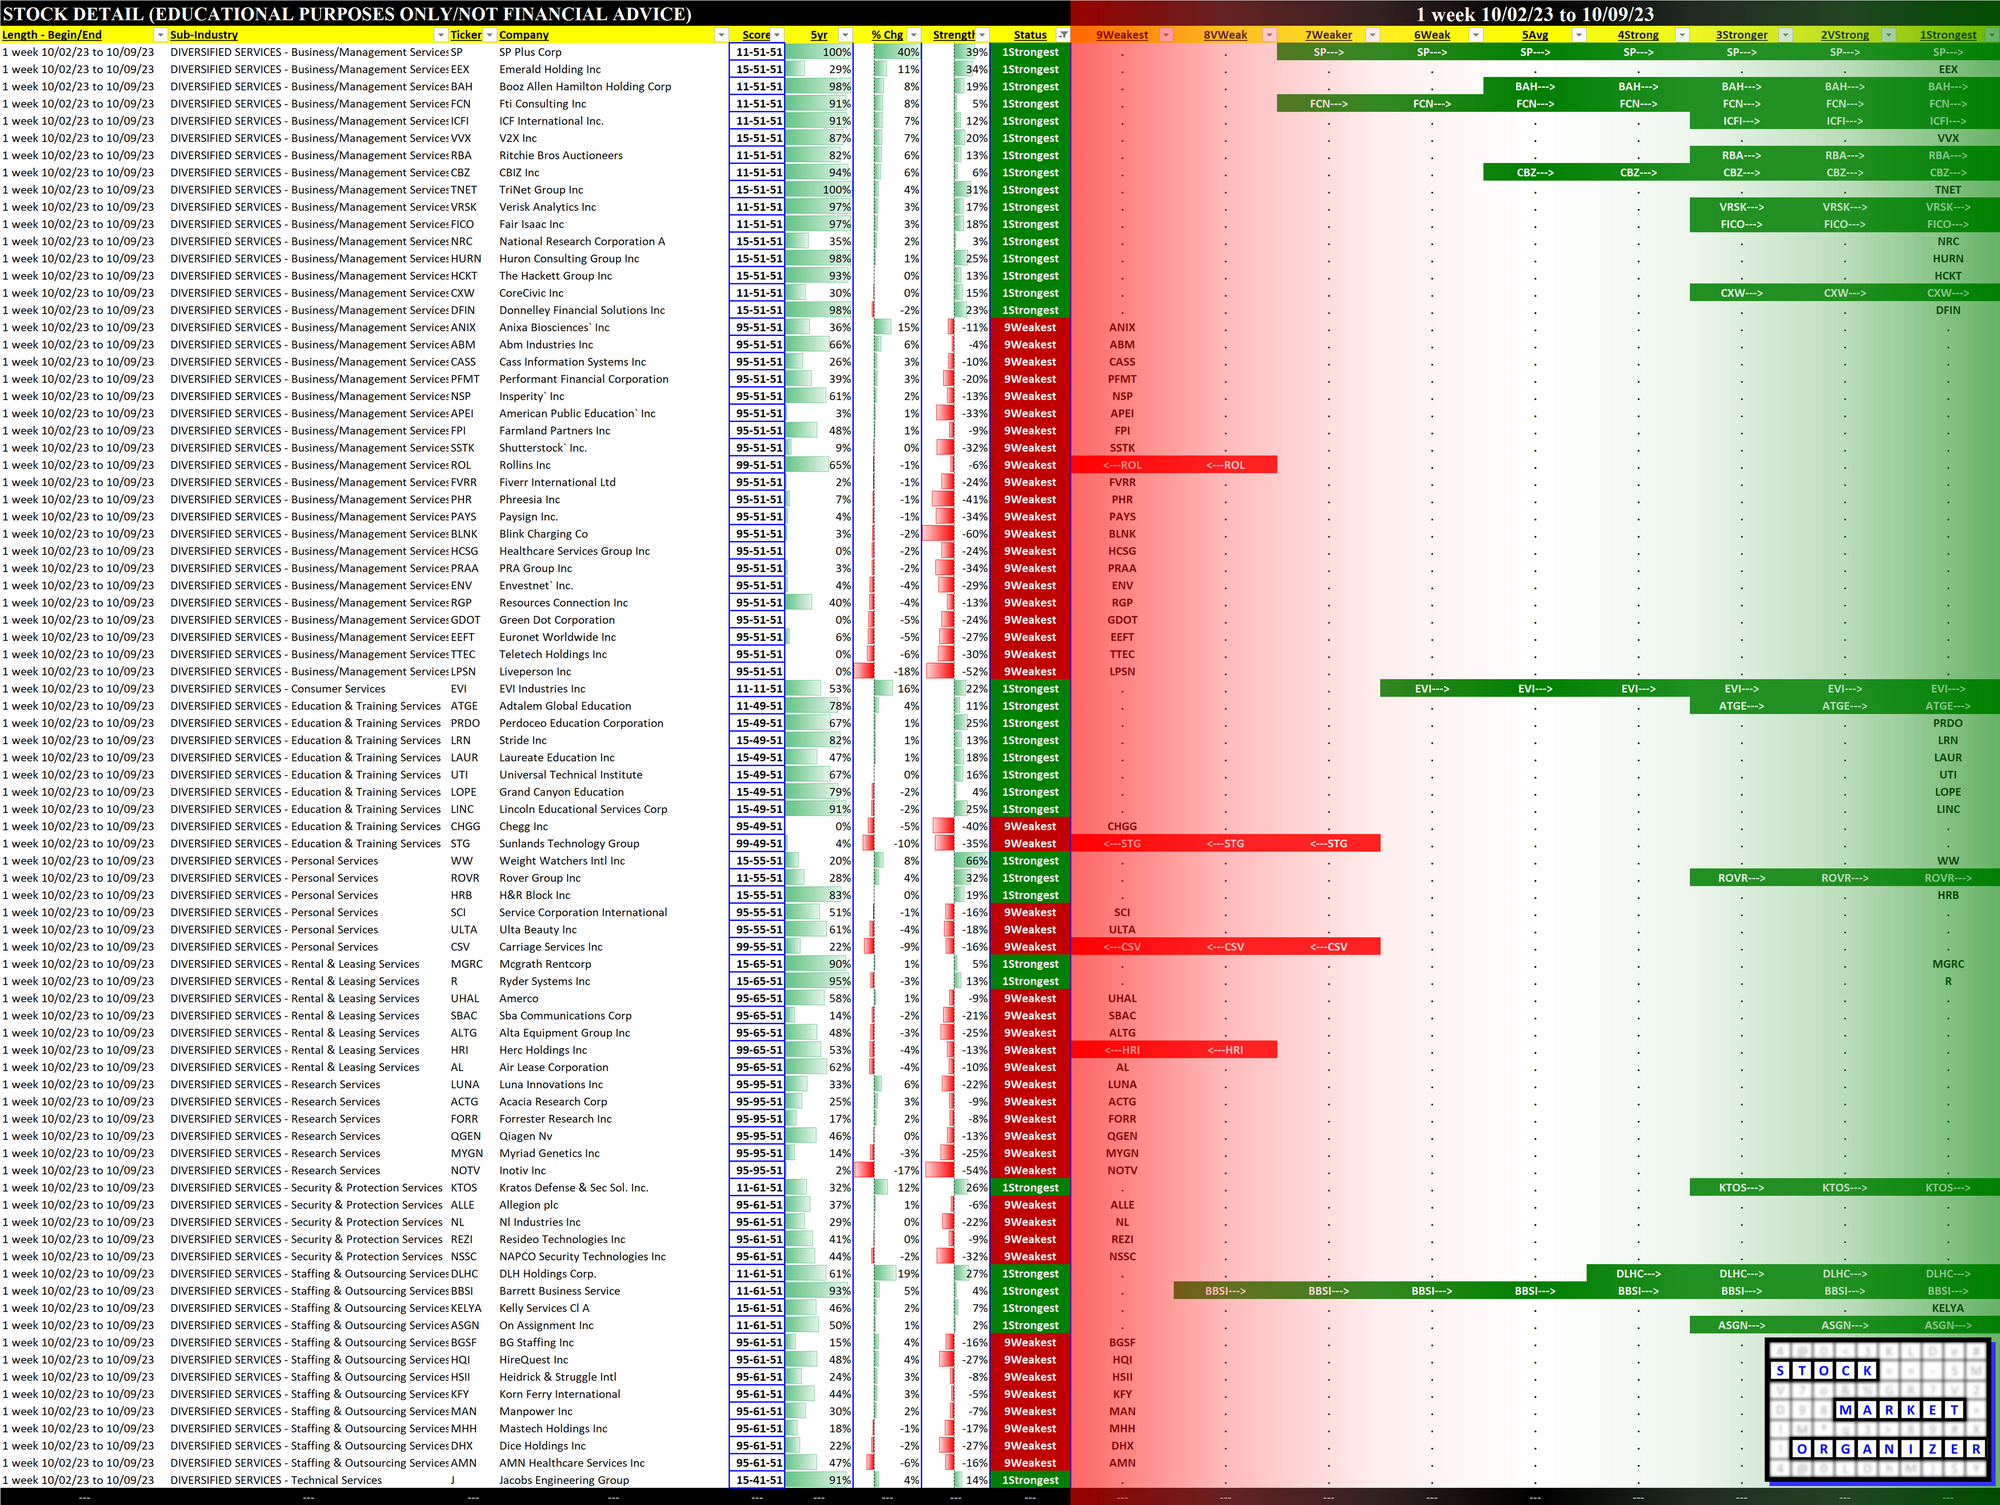
2C. Stocks 1 Week Strongest and Weakest
What: stocks currently rated Strongest/Weakest (highest/lowest of 9 strength ratings)
Why: most interesting stocks for available capital because
- the Strongest have the least amount of overhead supply to dampen breakouts while
- the Weakest may be prone to volatility, subject to big pops from bottom-fishing and short-covering BUT ALSO to bigger and faster falls.
(Not guaranteed and not a recommendation - weak stocks in weakening sub-industries may be better shorts than high-flyers.)
3. STRENGTH BY LOOKBACK PERIOD (with Best/Worst stocks)
3A. Lookback 6 Months
3B. Lookback 4 weeks
3C. Lookback 1 Week