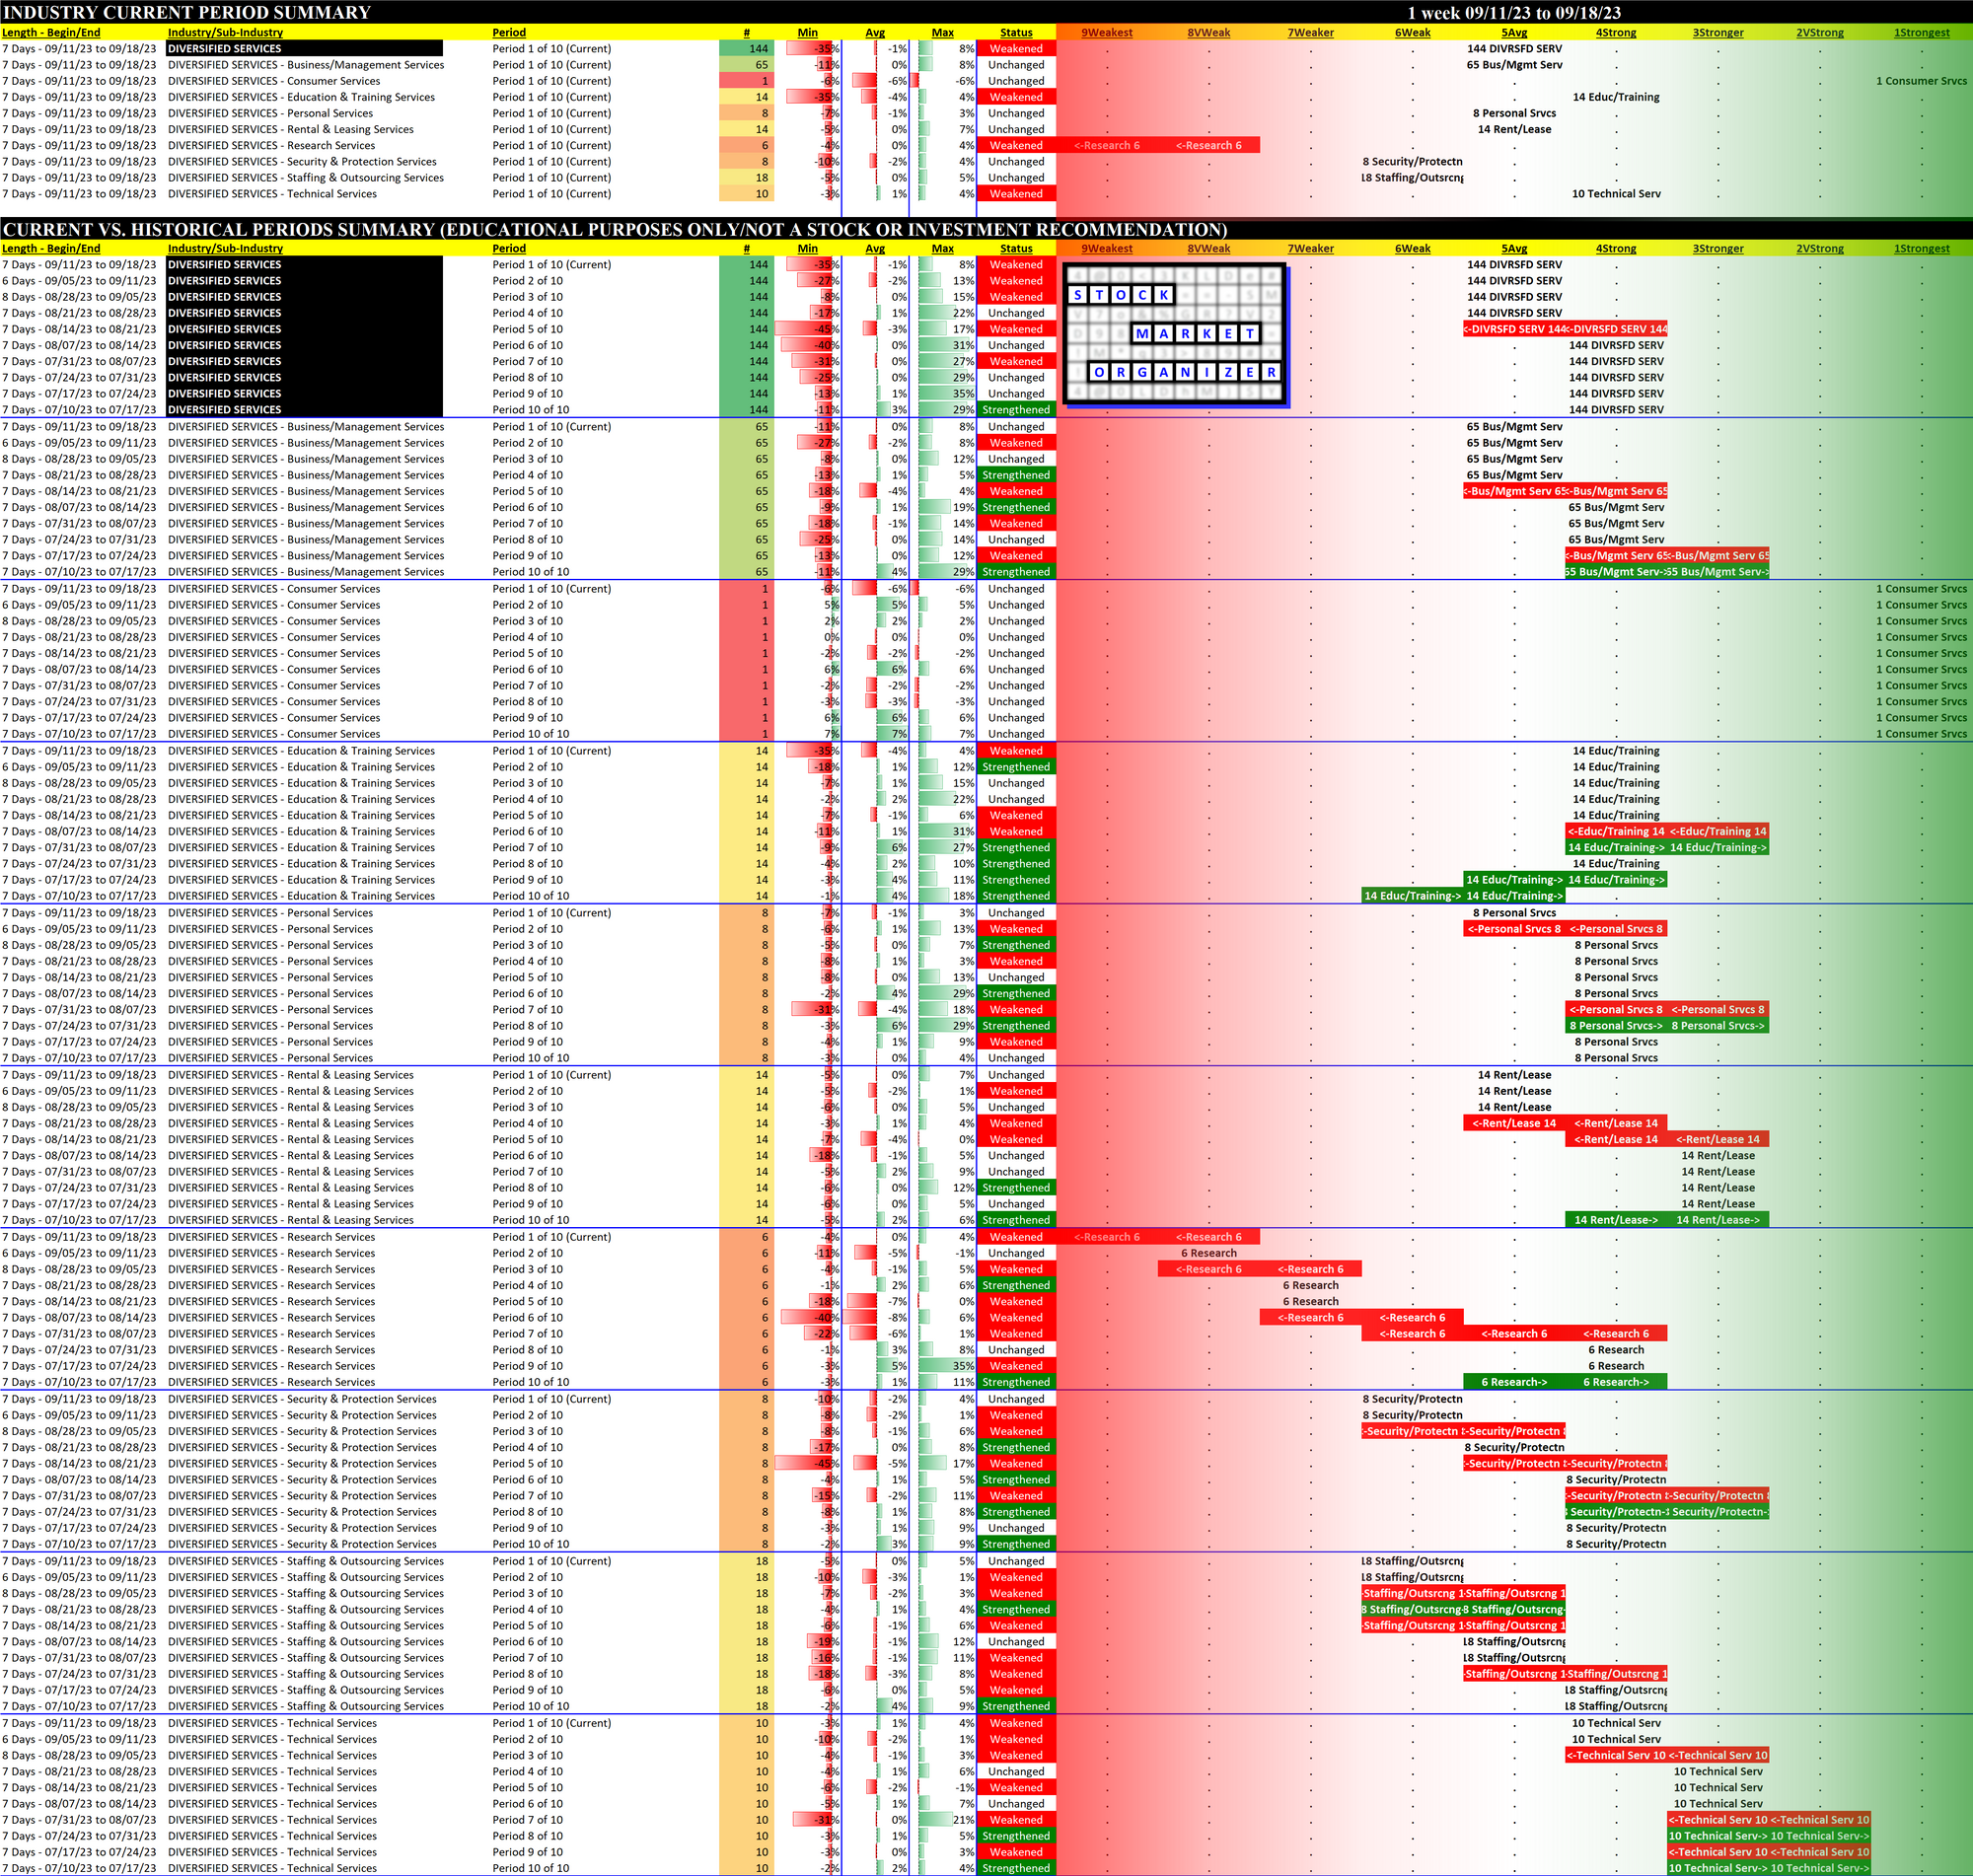
Diversified Services 2023-09-18: Unchanged at AVERAGE strength rating (5th strongest of 9 levels), previous move was DOWN
SUMMARY
Performance
Bottom Line: weakened 1 level over the past 10 weeks
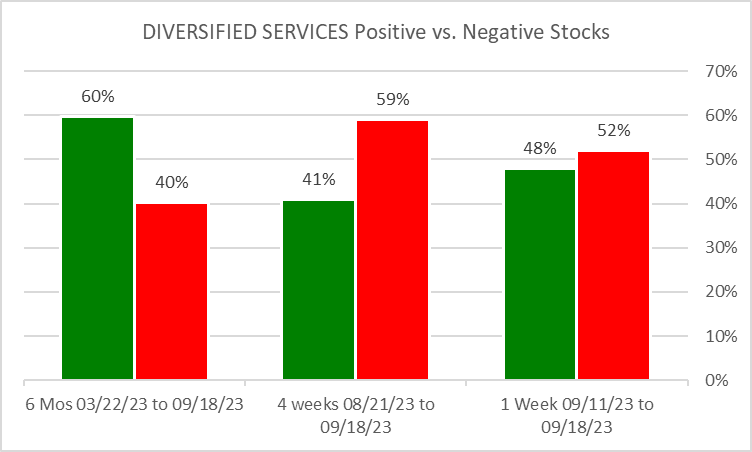
Context: 1 week positive/negative stocks ratio is WEAKER than 6 Mos and STRONGER than 4 weeks.
Other Notes:
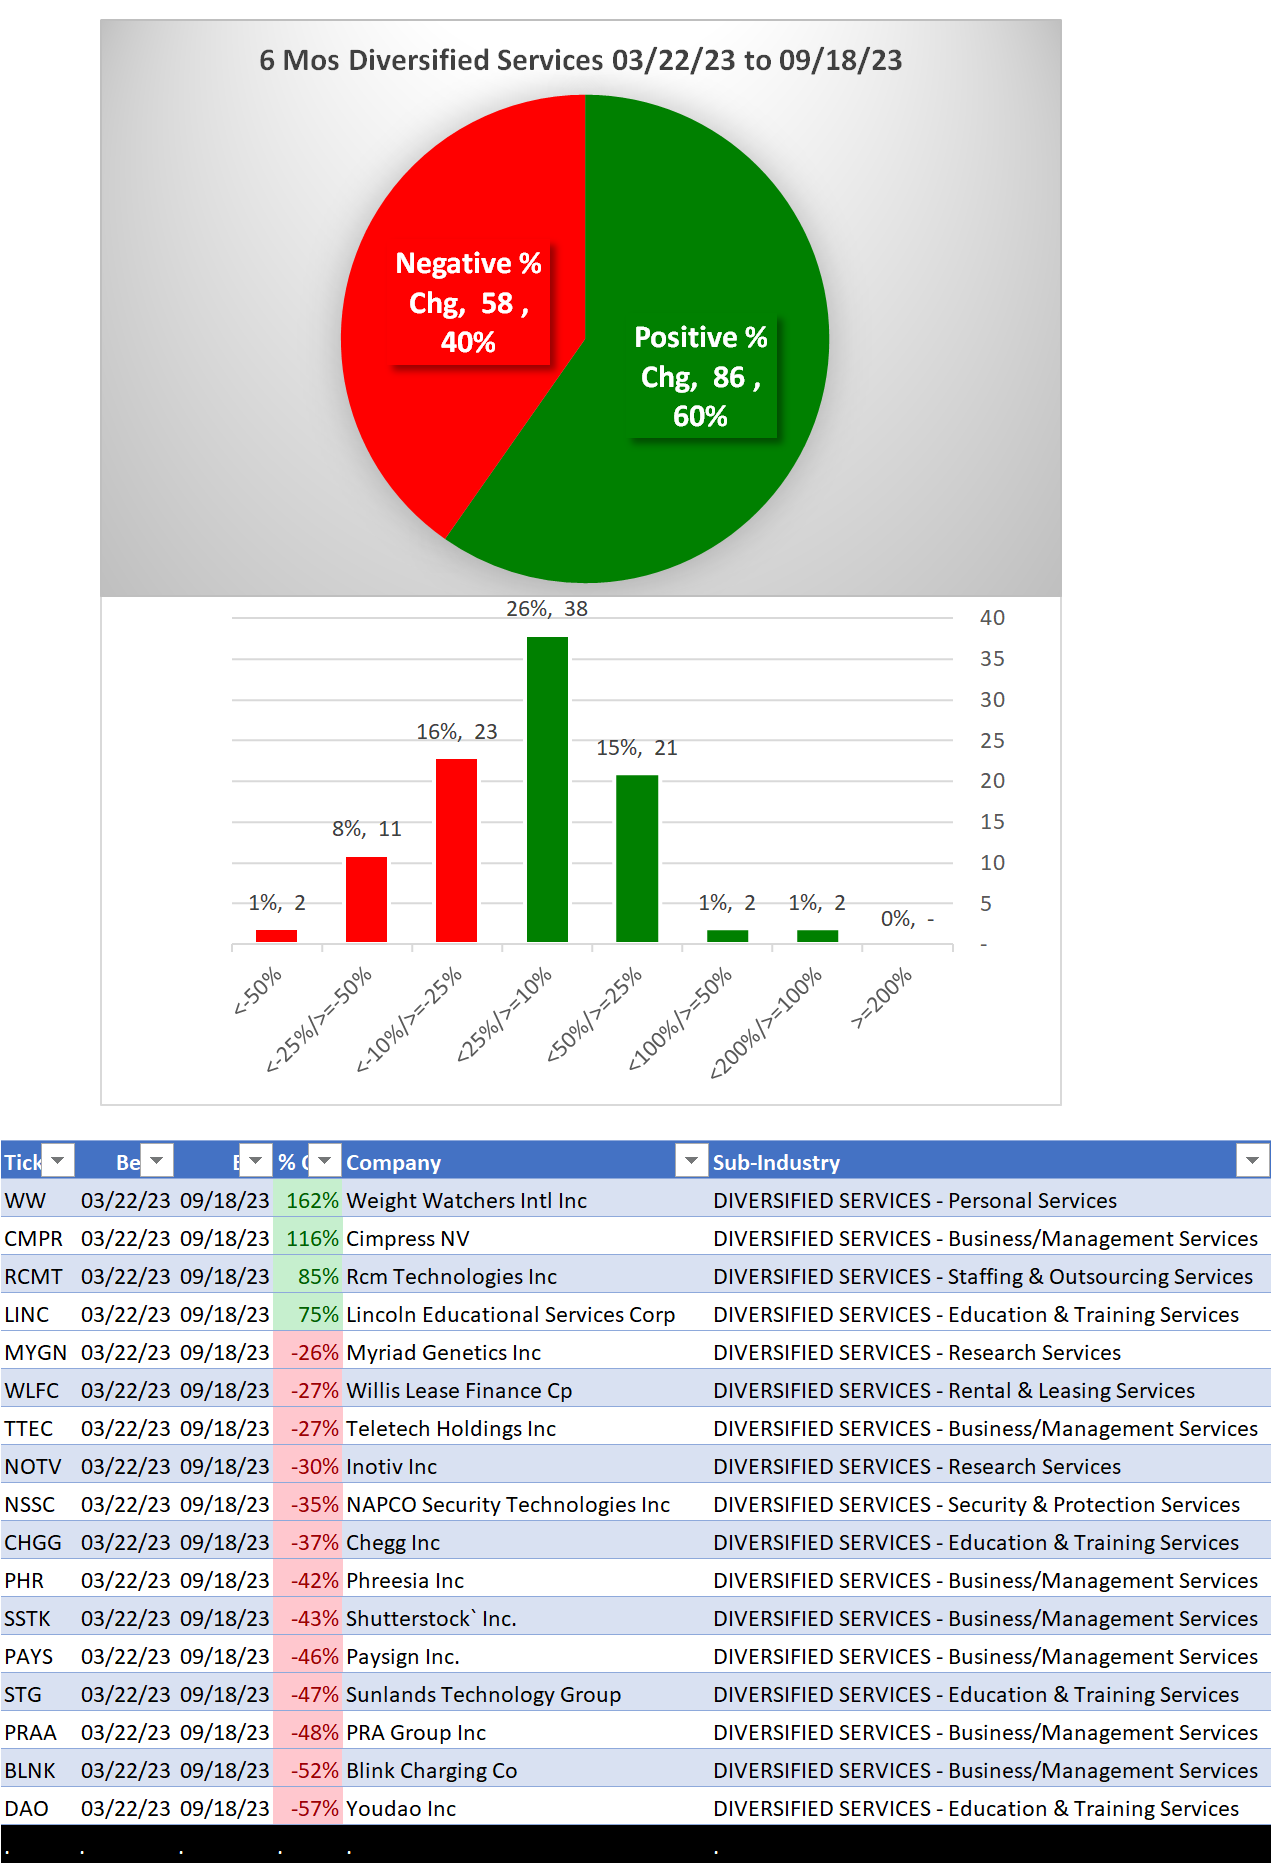
Past 6 months
- WW/Weightwatchers +162% getting some attention due to the obesity drugs?
- CMPR/Cimpress NV Business/Management Services sub-industry +116%, as BLNK/Blink Charging in the same industry is -52%
- DAO/Youdao Education & Training sub-industry -57%
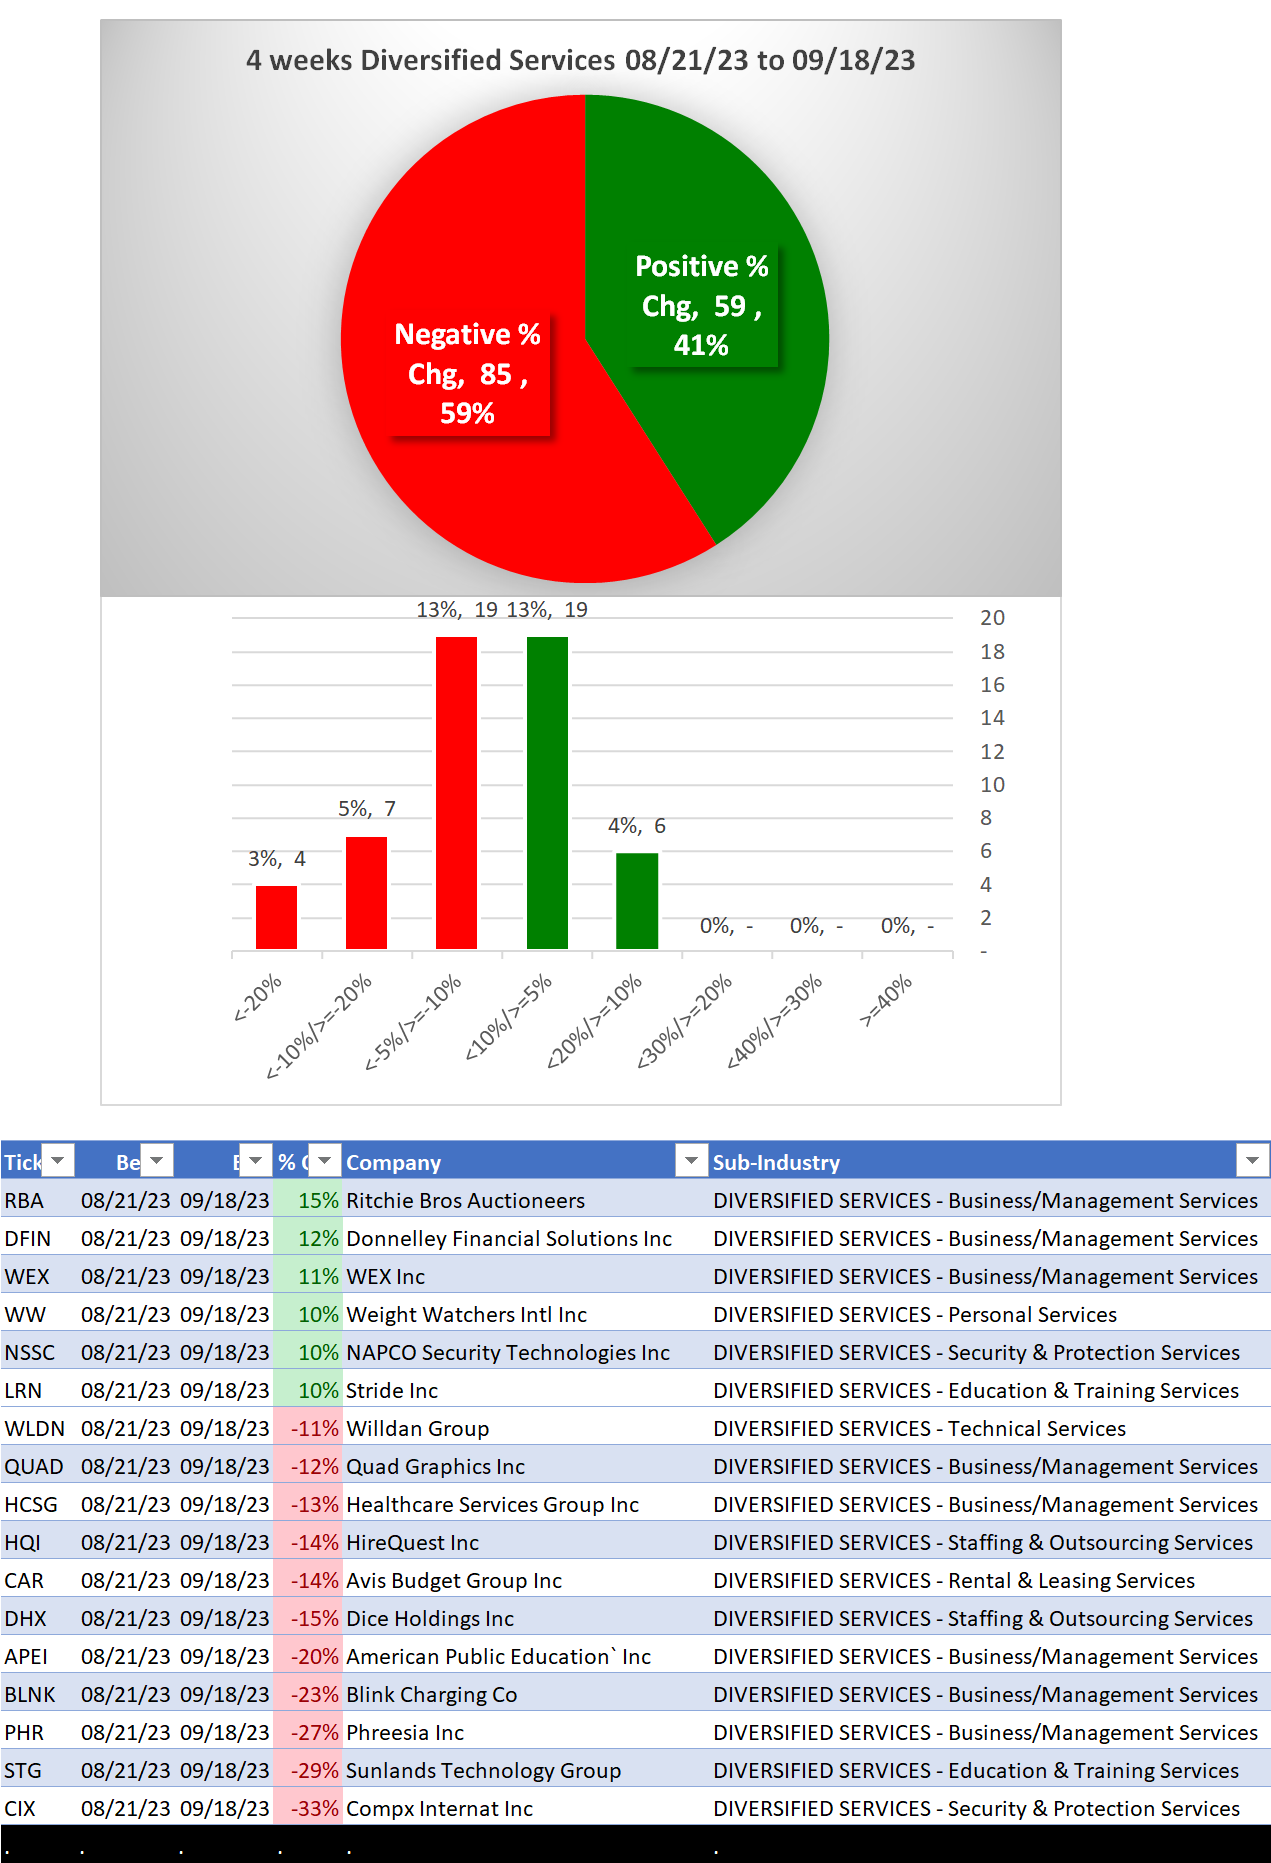
4 Weeks
CIX/Compx International, Security & Protection Services - 33%
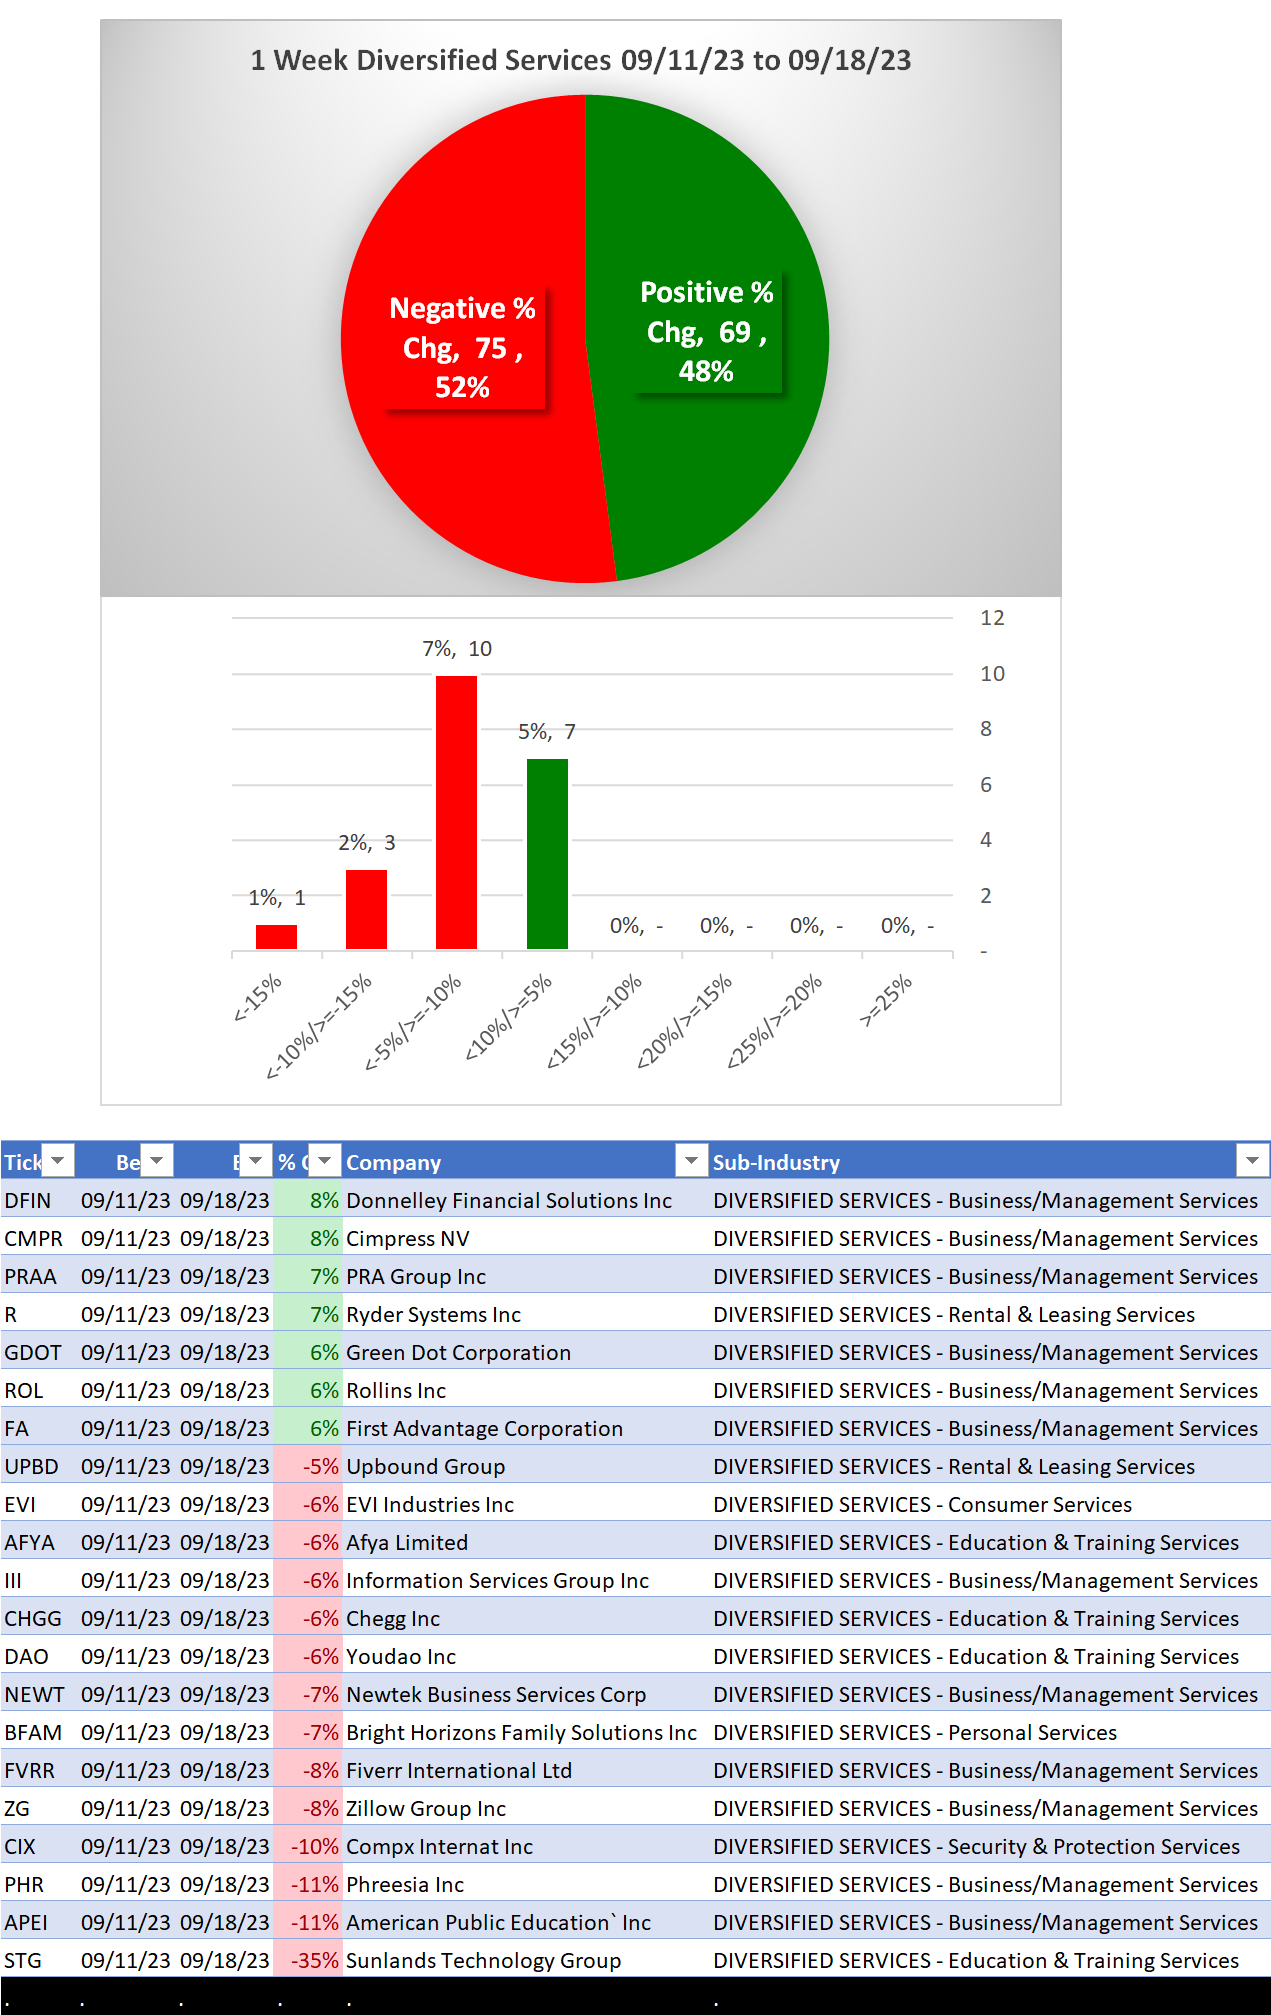
1 Week
- STG/Sunlands Technology Group -35%
Background
Material of 9 sub-industries (144 stocks total, average 16 stocks/sub-industry):
65 stocks Business/Management Services
18 stocks Staffing & Outsourcing Services
14 stocks Education & Training Services
14 stocks Rental & Leasing Services
10 stocks Technical Services
10 Biggest Market Cap stocks:
V, MA, FI, MCO, CTAS, PAYX, VRSK, GPN, URI, SBAC
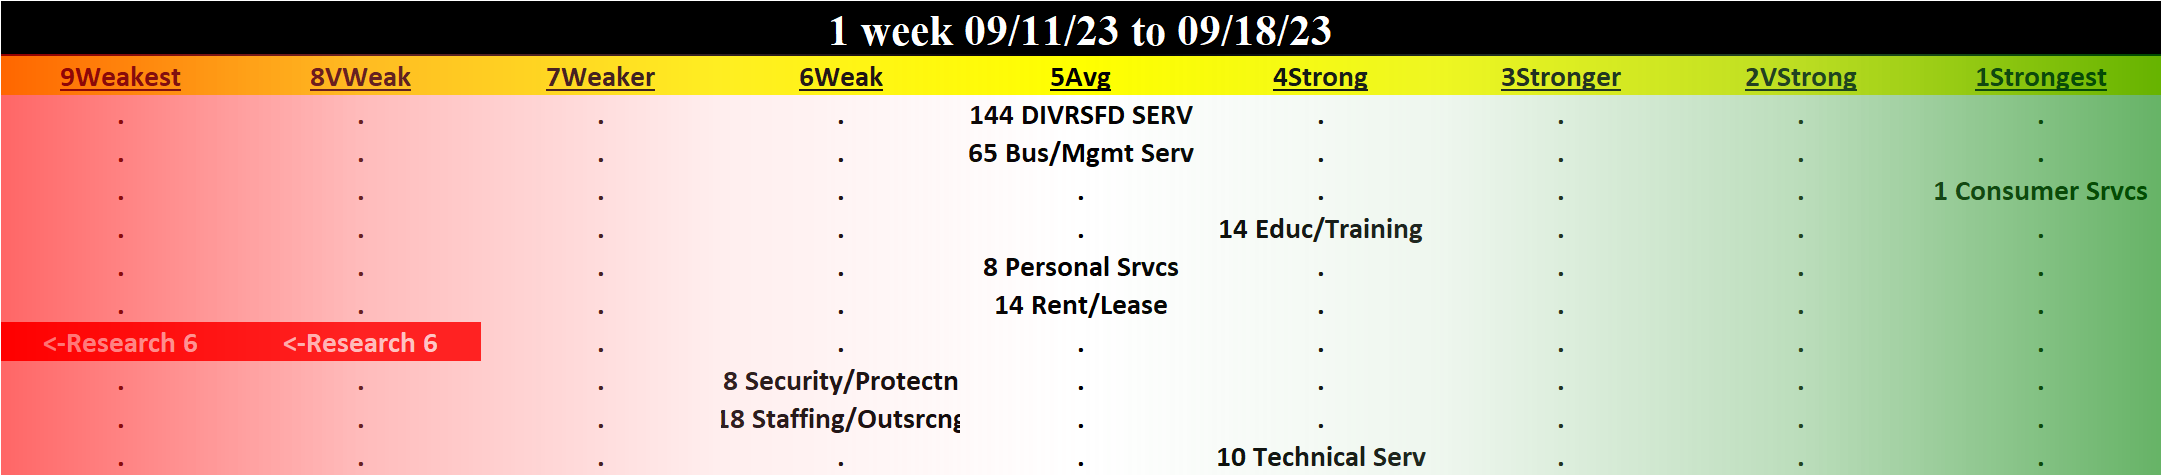
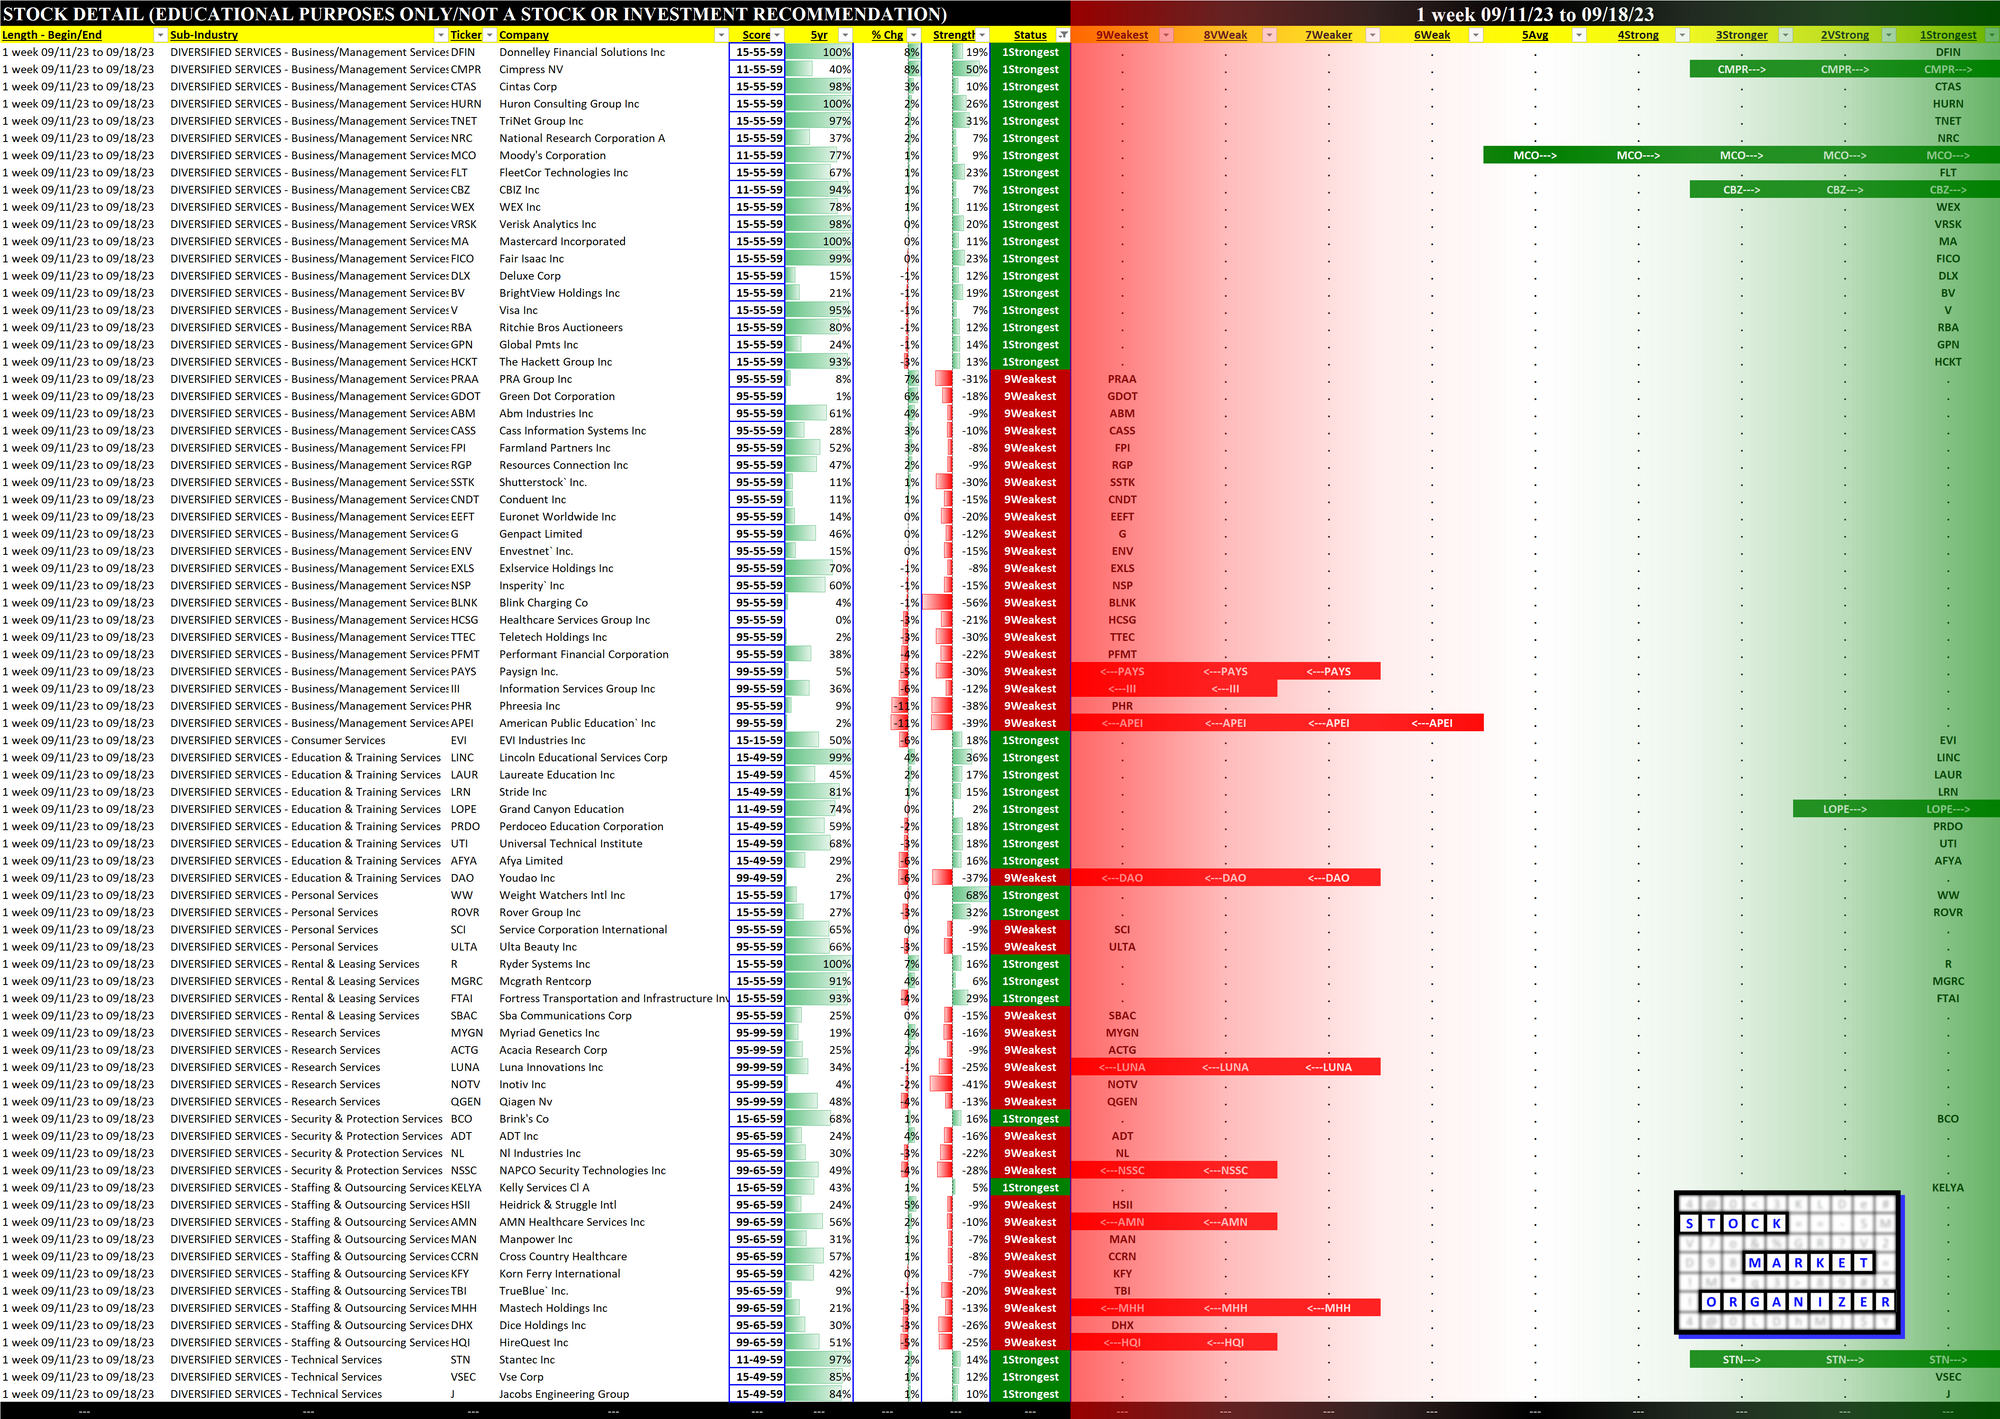
DETAIL: 1 Week Performance Review
Status
Strengthened: 0/9 sub-industries
Weakened: 1/9 sub-industries
Strongest at Strongest rating/1st strongest of 9 levels:
1 stock Consumer Services
Tie at Strong/4th Strongest:
- 14 stocks Education & Training Services
- 10 stocks Technical Services
Weakest at Weakest rating/9th strongest of 9 levels:
6 stocks Research Services
Detail Charts: Sub-Industry and Stock
10-Week Week-by-Week Industry/Sub-industry Strength Comparison
What: recent week-by-week strength changes for the industry and each underlying sub-industry
Why: objective measurement of strengthening and weakening enabling comparison within and across industries and sub-industries
Strongest and Weakest Stocks
What: stocks currently rated Strongest/Weakest (highest/lowest of 9 strength ratings)
Why: most interesting stocks for available capital because
- the Strongest may be meme-stock mania candidates prone to breakouts, and
- the Weakest may be prone to large bottom-fishing/short-covering-driven pops... and may also be primed for bigger and faster falls.
(Not guaranteed and not a recommendation - weak stocks in weakening sub-industries may be better shorts than high-flyers.)
DETAIL: Lookbacks 6 Mos vs. 4 weeks vs. 1 Week
6 Mos Lookback
4 weeks Lookback
1 Week Lookback