Consumer Non-Durables 2023-09-22: Unchanged at WEAK strength rating (6th strongest of 9 levels), previous move was DOWN
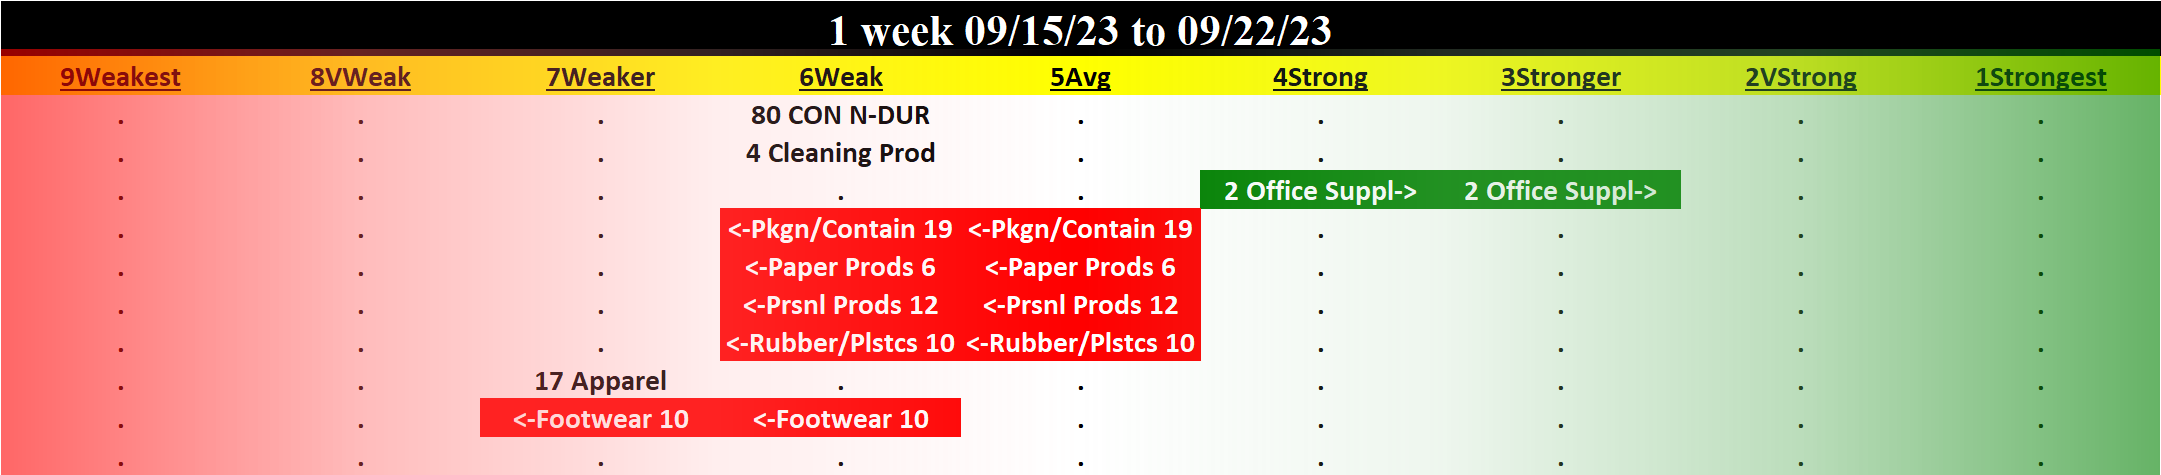
TABLE OF CONTENTS
- INDUSTRY OVERVIEW
1A. Performance
1B. Background - SUB-INDUSTRIES AND STOCKS DETAIL
2A. Sub-Industries Overview
2B. Sub-Industries 10-Week Strengthening Analysis
2C. Stocks 1 Week Strongest and Weakest - STRENGTH BY LOOKBACK PERIOD (with Best/Worst stocks)
3A. Lookback 6 Months
3B. Lookback 4 weeks
3C. Lookback 1 Week
1. INDUSTRY OVERVIEW
1A. Performance
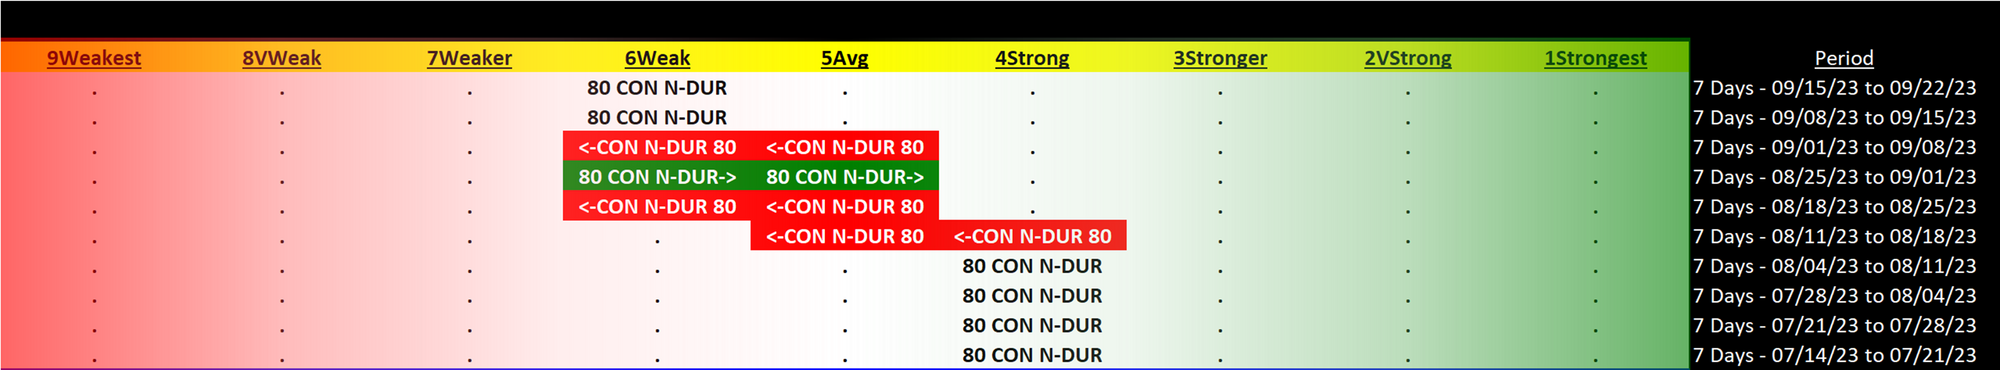
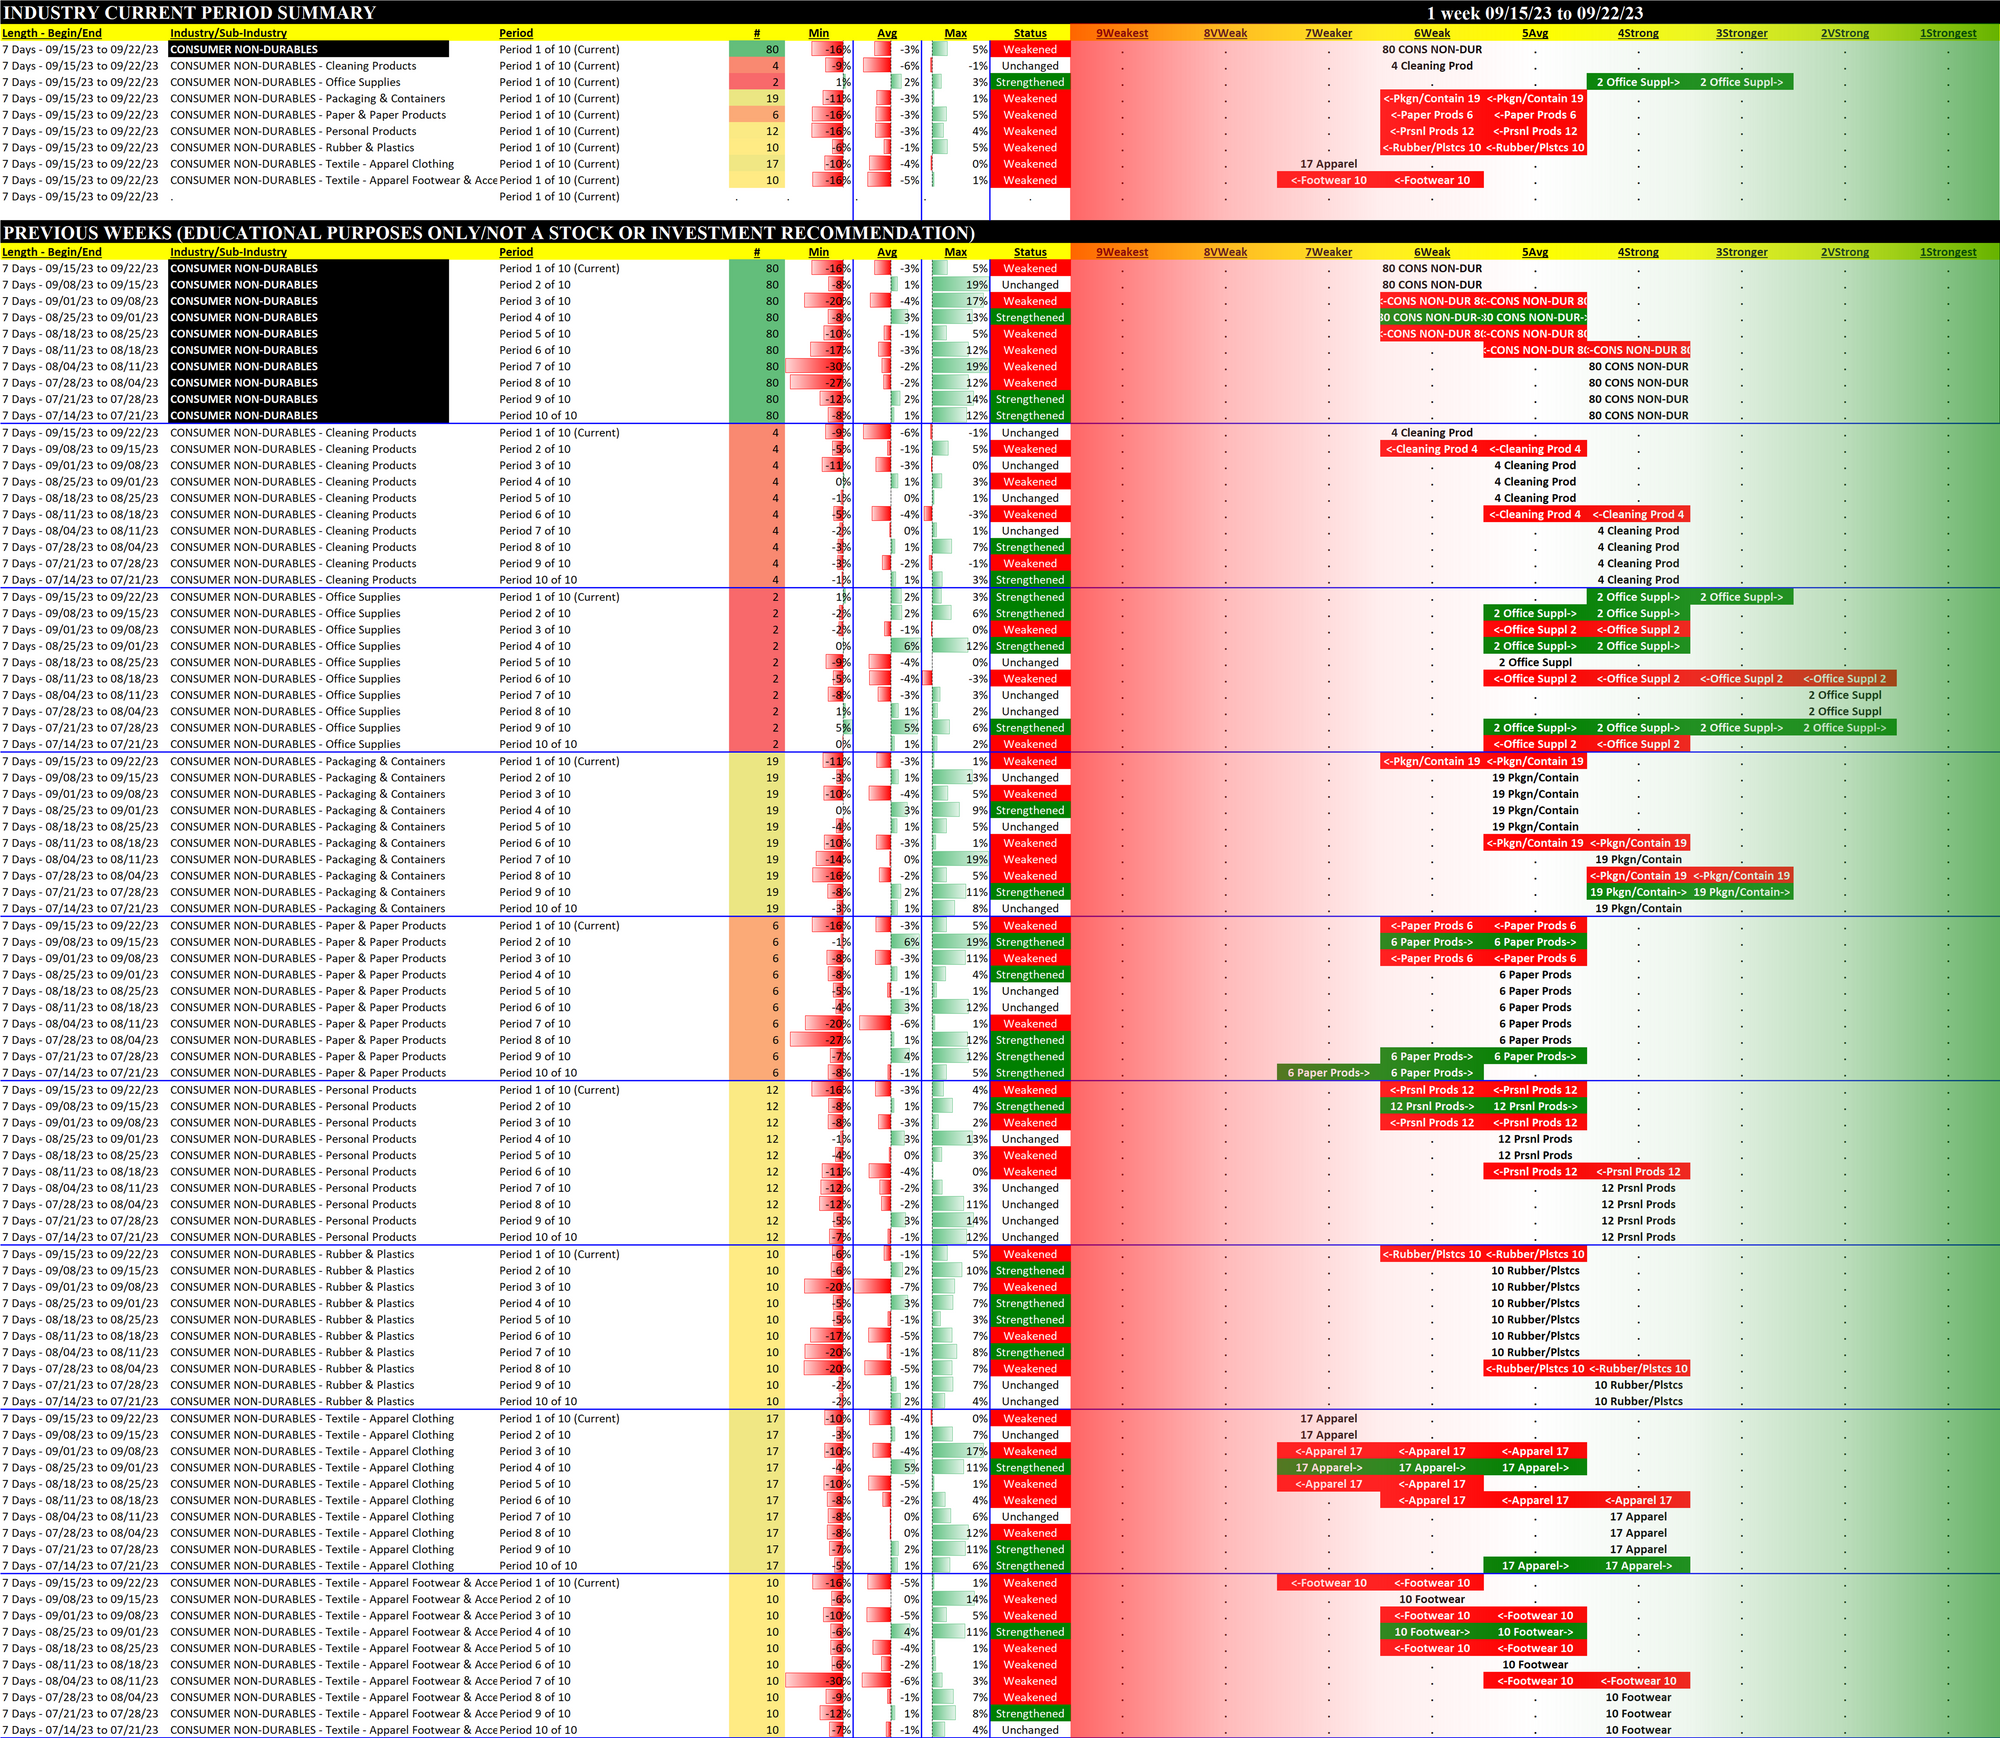
Past 10 Weeks Strengthening/Weakening week-by-week, per the following chart:
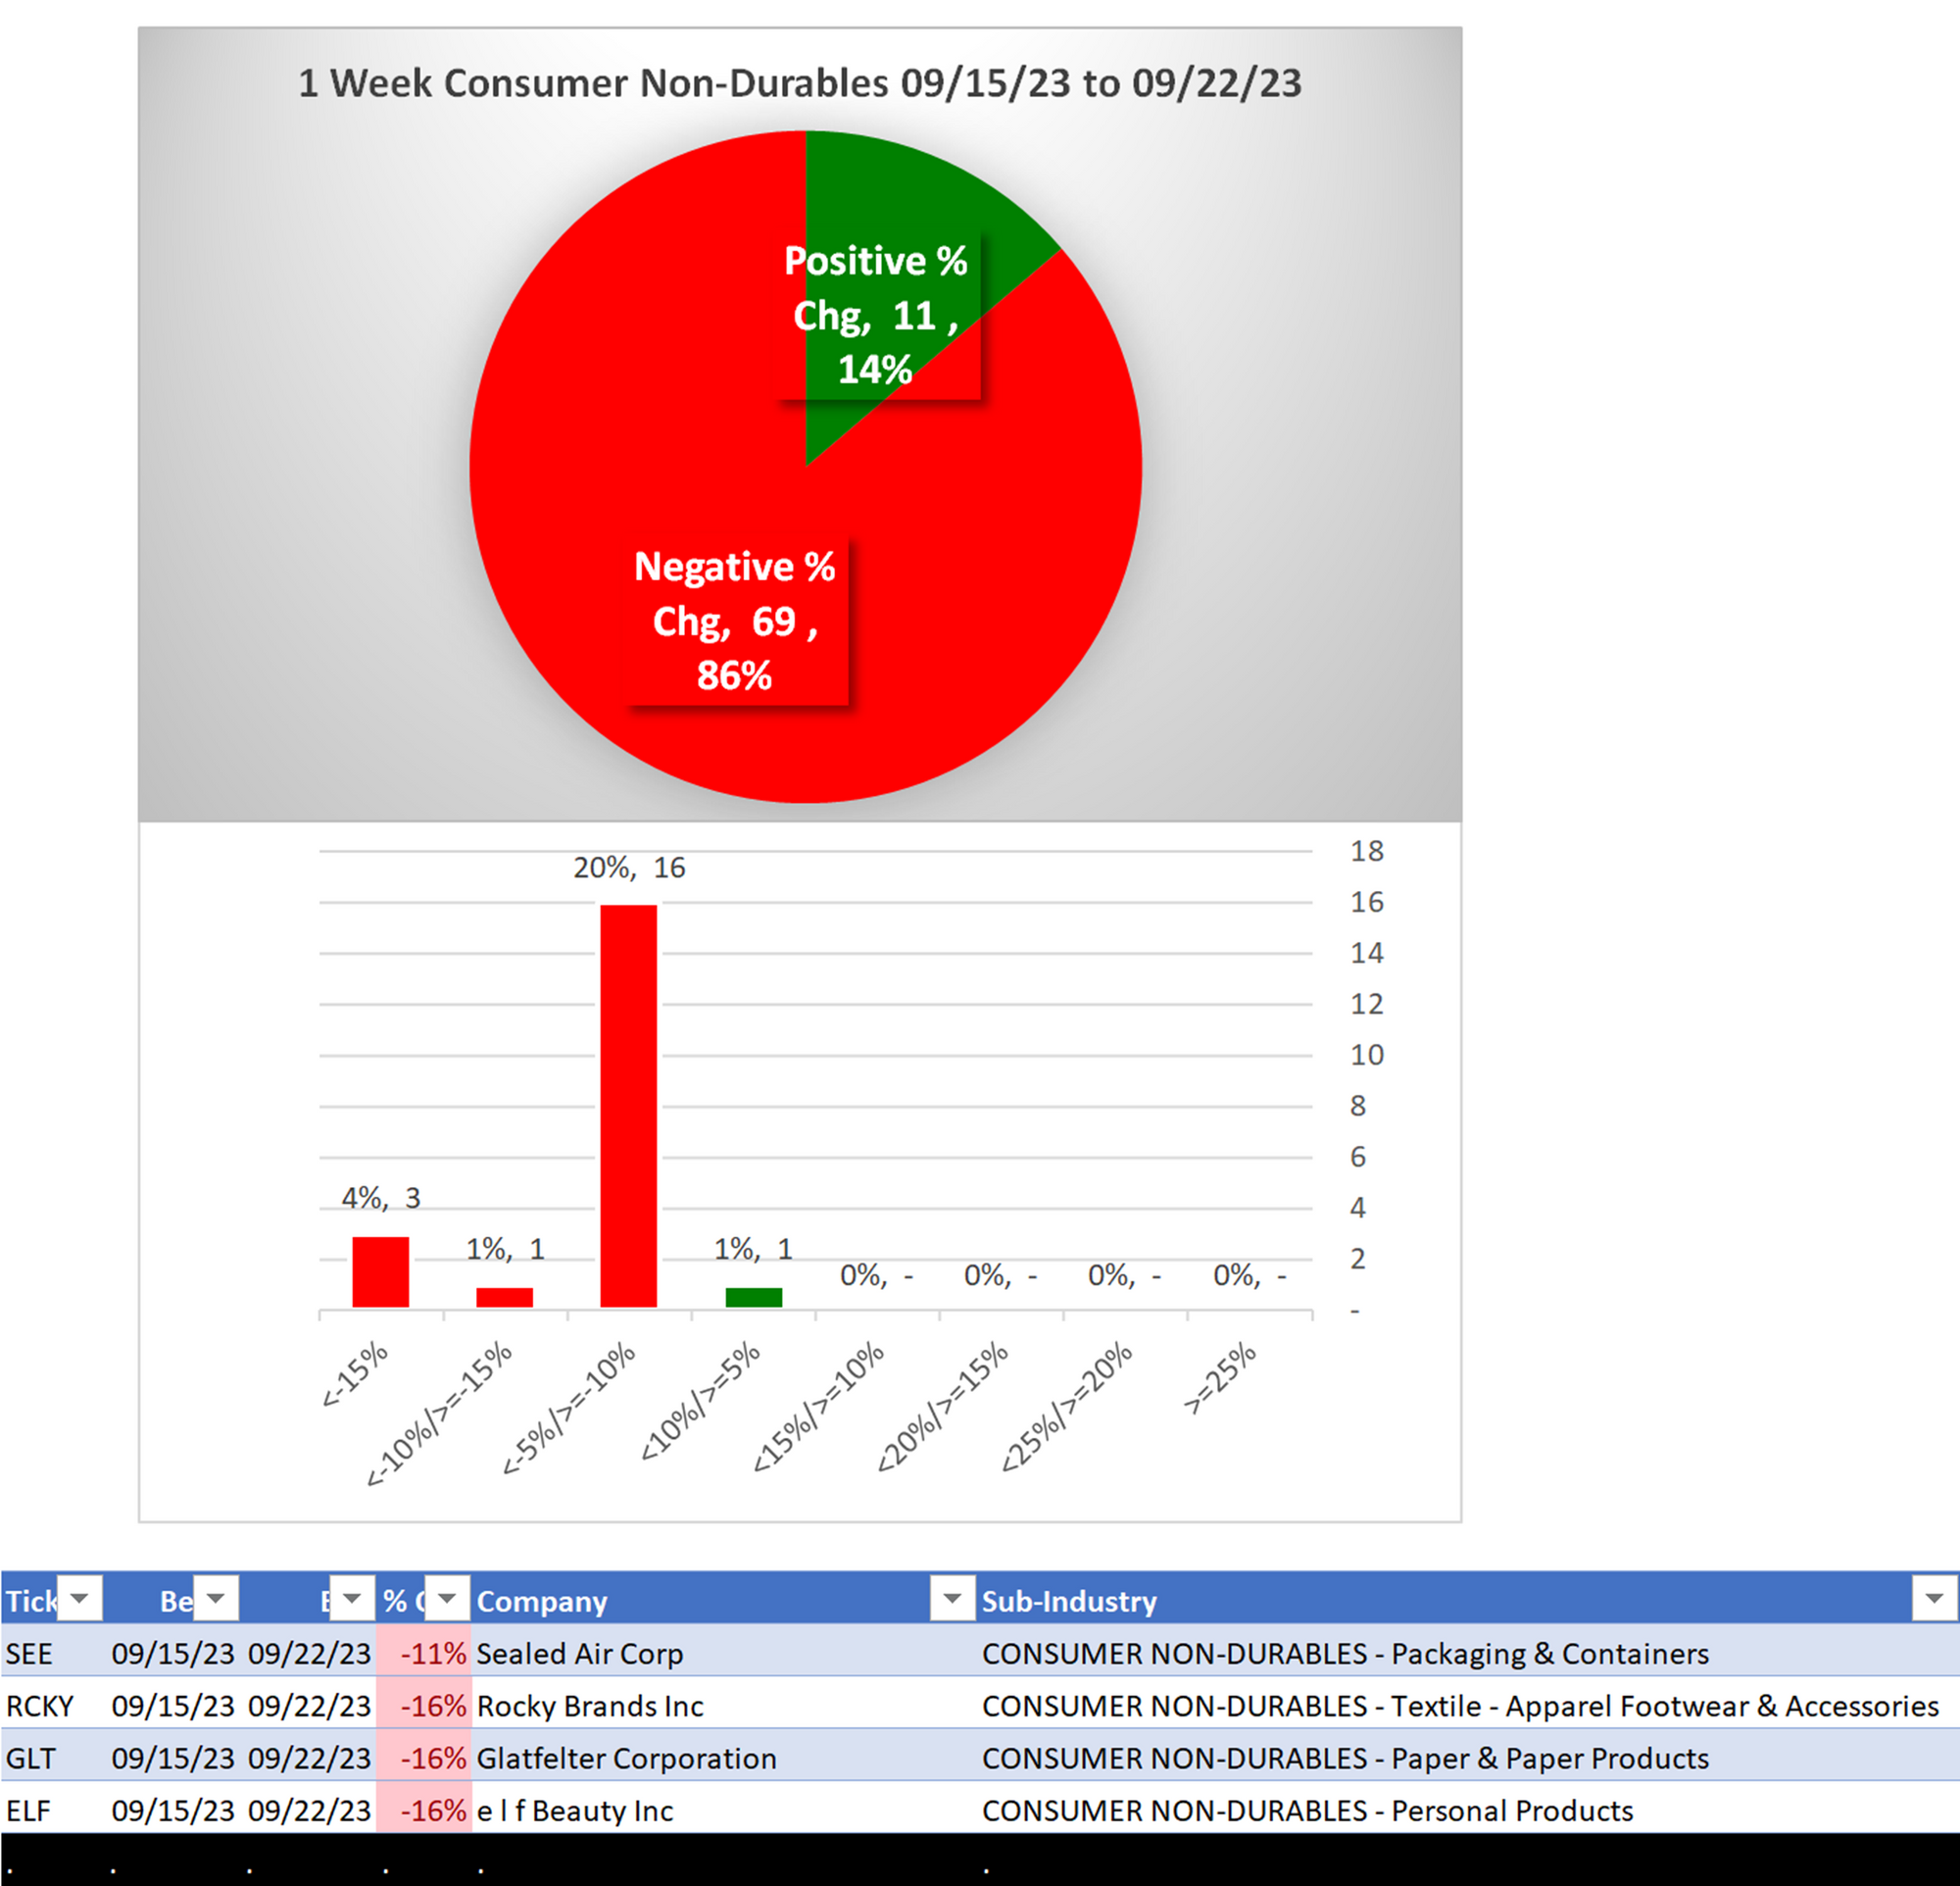
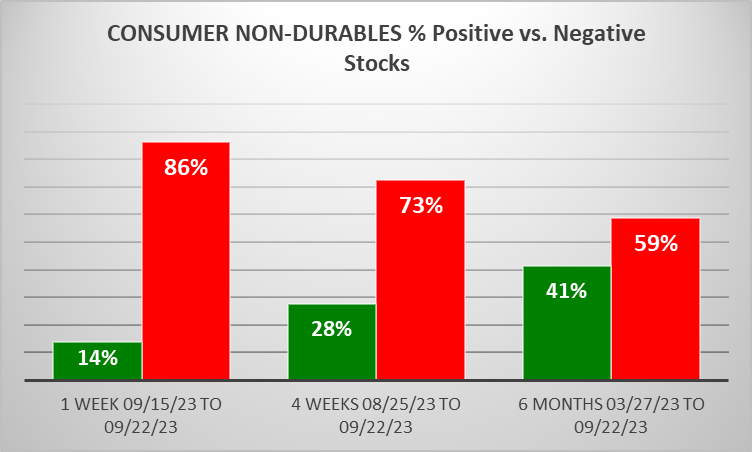
WEAKENING 1 Week vs. Mid- and Longer-Term // 1 week positive/negative stocks ratio is LOWER than both 4 weeks and 6 Months, per the following chart:
Comments;
- Weakest stocks are 46% of total.
1B. Background
Largest of 8 sub-industries (80 stocks, average 10):
- Packaging & Containers (19 stocks)
- Textile - Apparel Clothing (17 stocks)
- Personal Products (12 stocks)
- Rubber & Plastics (10 stocks)
- Textile - Apparel Footwear & Accessories (10 stocks)
Top 10 by Market Capitalization:
PG/Procter & Gamble Co, NKE/Nike Inc Cl B, CL/Colgate-Palmolive Co, EL/Estee Lauder Companies Inc (The), ECL/Ecolab Inc, LULU/Lululemon Athletica Inc., KMB/Kimberly Clark Corp, CHD/Church & Dwight Co Inc, CLX/Clorox Co, BALL/Ball Corp
2. SUB-INDUSTRIES AND STOCKS DETAIL
2A. Sub-Industries Overview
Strengthened: 1/8 sub-industries
Weakened: 5/8 sub-industries
STRONGEST at Stronger rating/3rd strongest of 9 levels:
- Office Supplies (2 stocks)
WEAKEST at Weaker rating/7th strongest of 9 levels:
- Textile - Apparel Clothing (17 stocks)
- Textile - Apparel Footwear & Accessories (10 stocks)
2B. Sub-Industries 10-Week Strengthening Analysis
What: recent week-by-week strength changes for the industry and each underlying sub-industry
Why: objective measurement of strengthening and weakening enabling comparison within and across industries and sub-industries
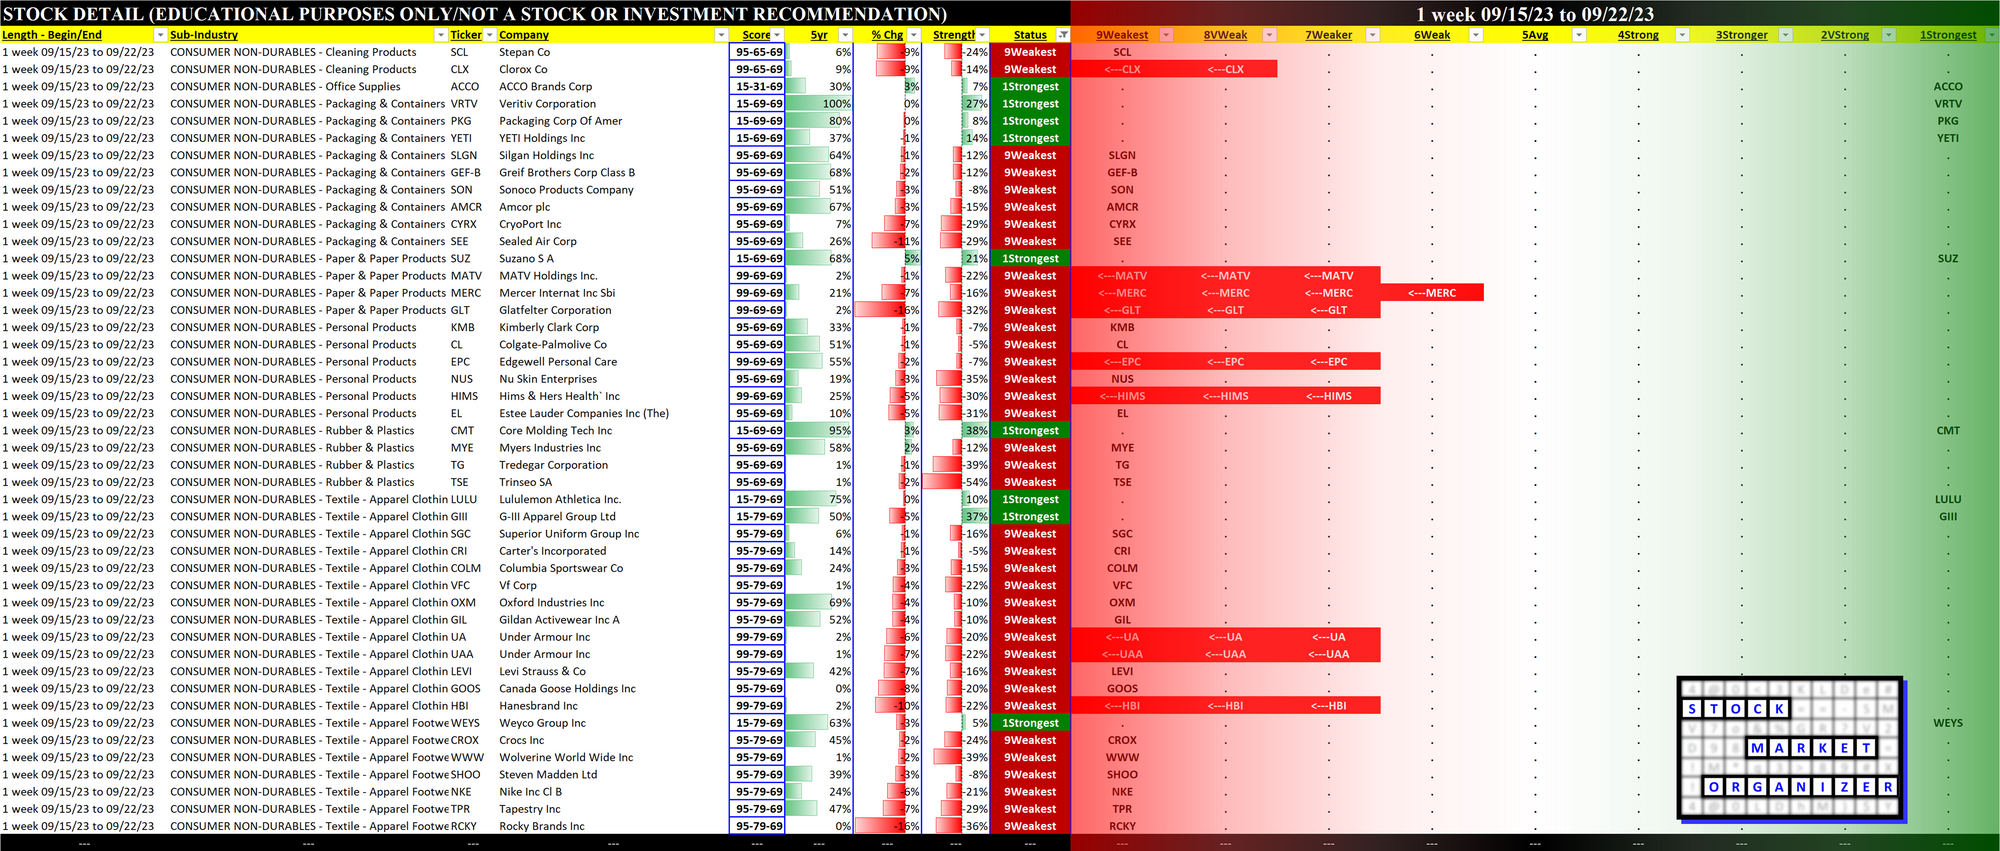
2C. Stocks 1 Week Strongest and Weakest
What: stocks currently rated Strongest/Weakest (highest/lowest of 9 strength ratings)
Why: most interesting stocks for available capital because
- the Strongest have the least amount of overhead supply to dampen breakouts while
- the Weakest may be prone to volatility, subject to big pops from bottom-fishing and short-covering BUT ALSO to bigger and faster falls.
(Not guaranteed and not a recommendation - weak stocks in weakening sub-industries may be better shorts than high-flyers.)
3. STRENGTH BY LOOKBACK PERIOD (with Best/Worst stocks)
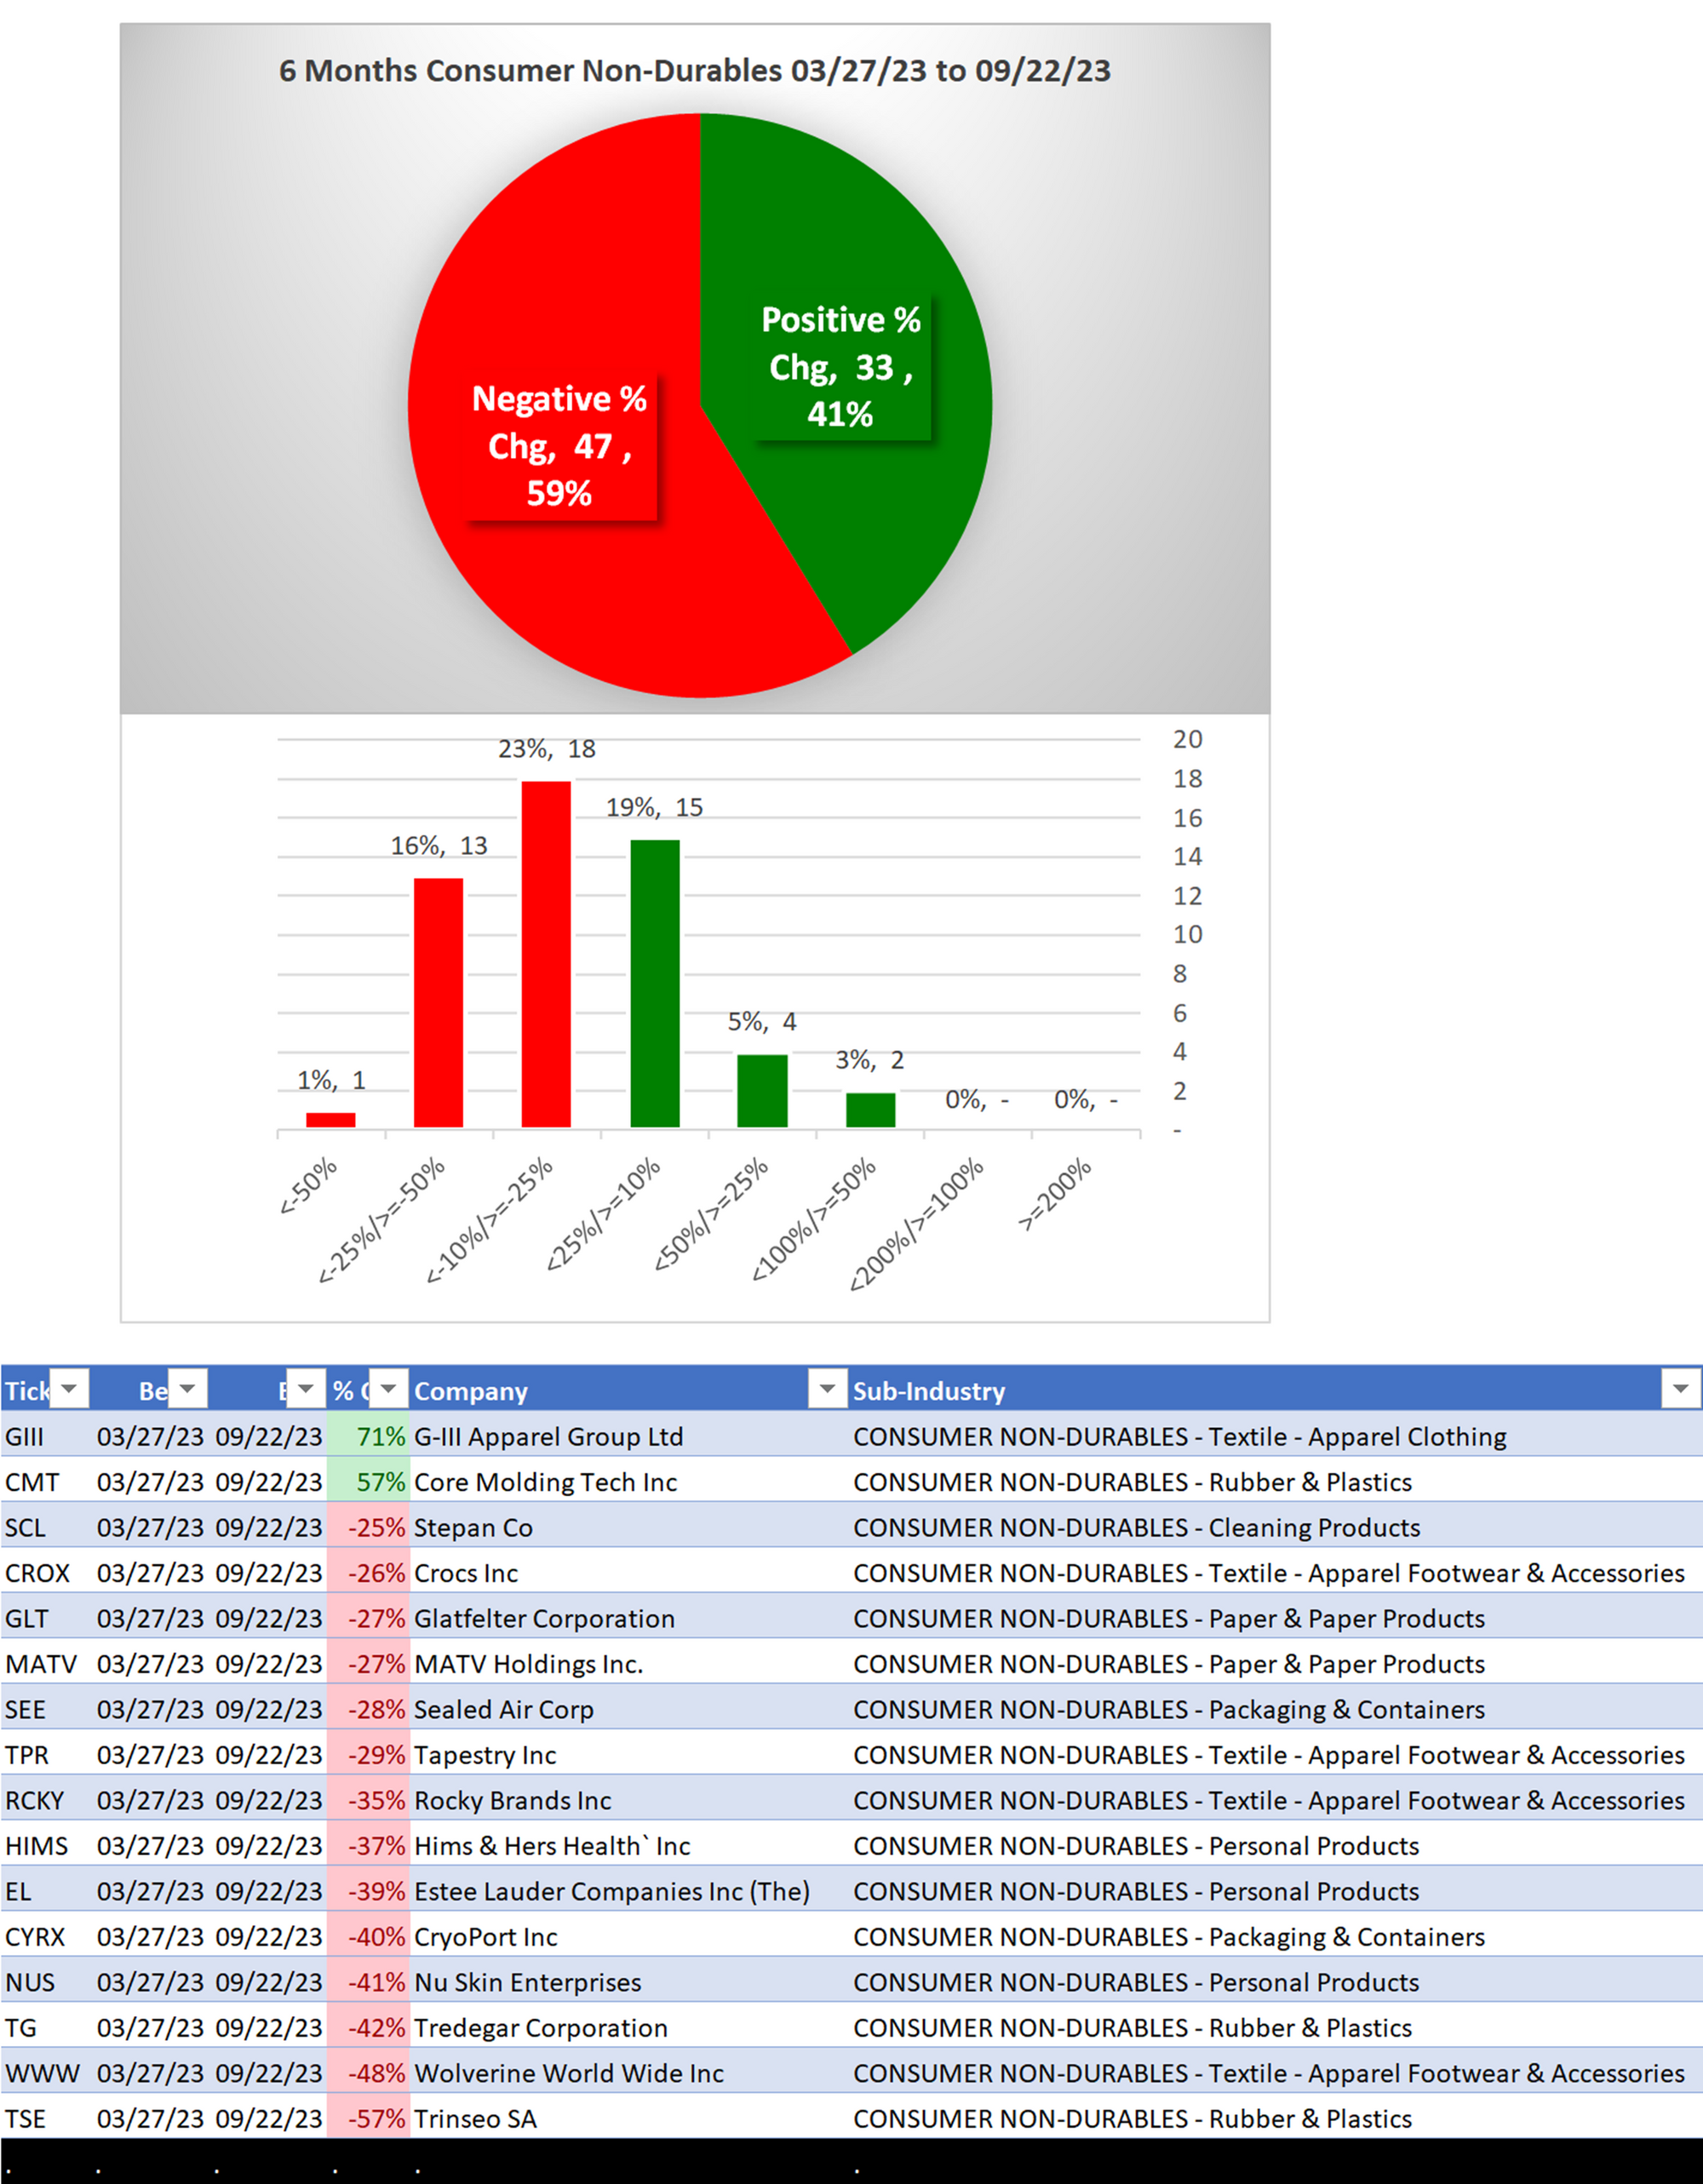
3A. Lookback 6 Months
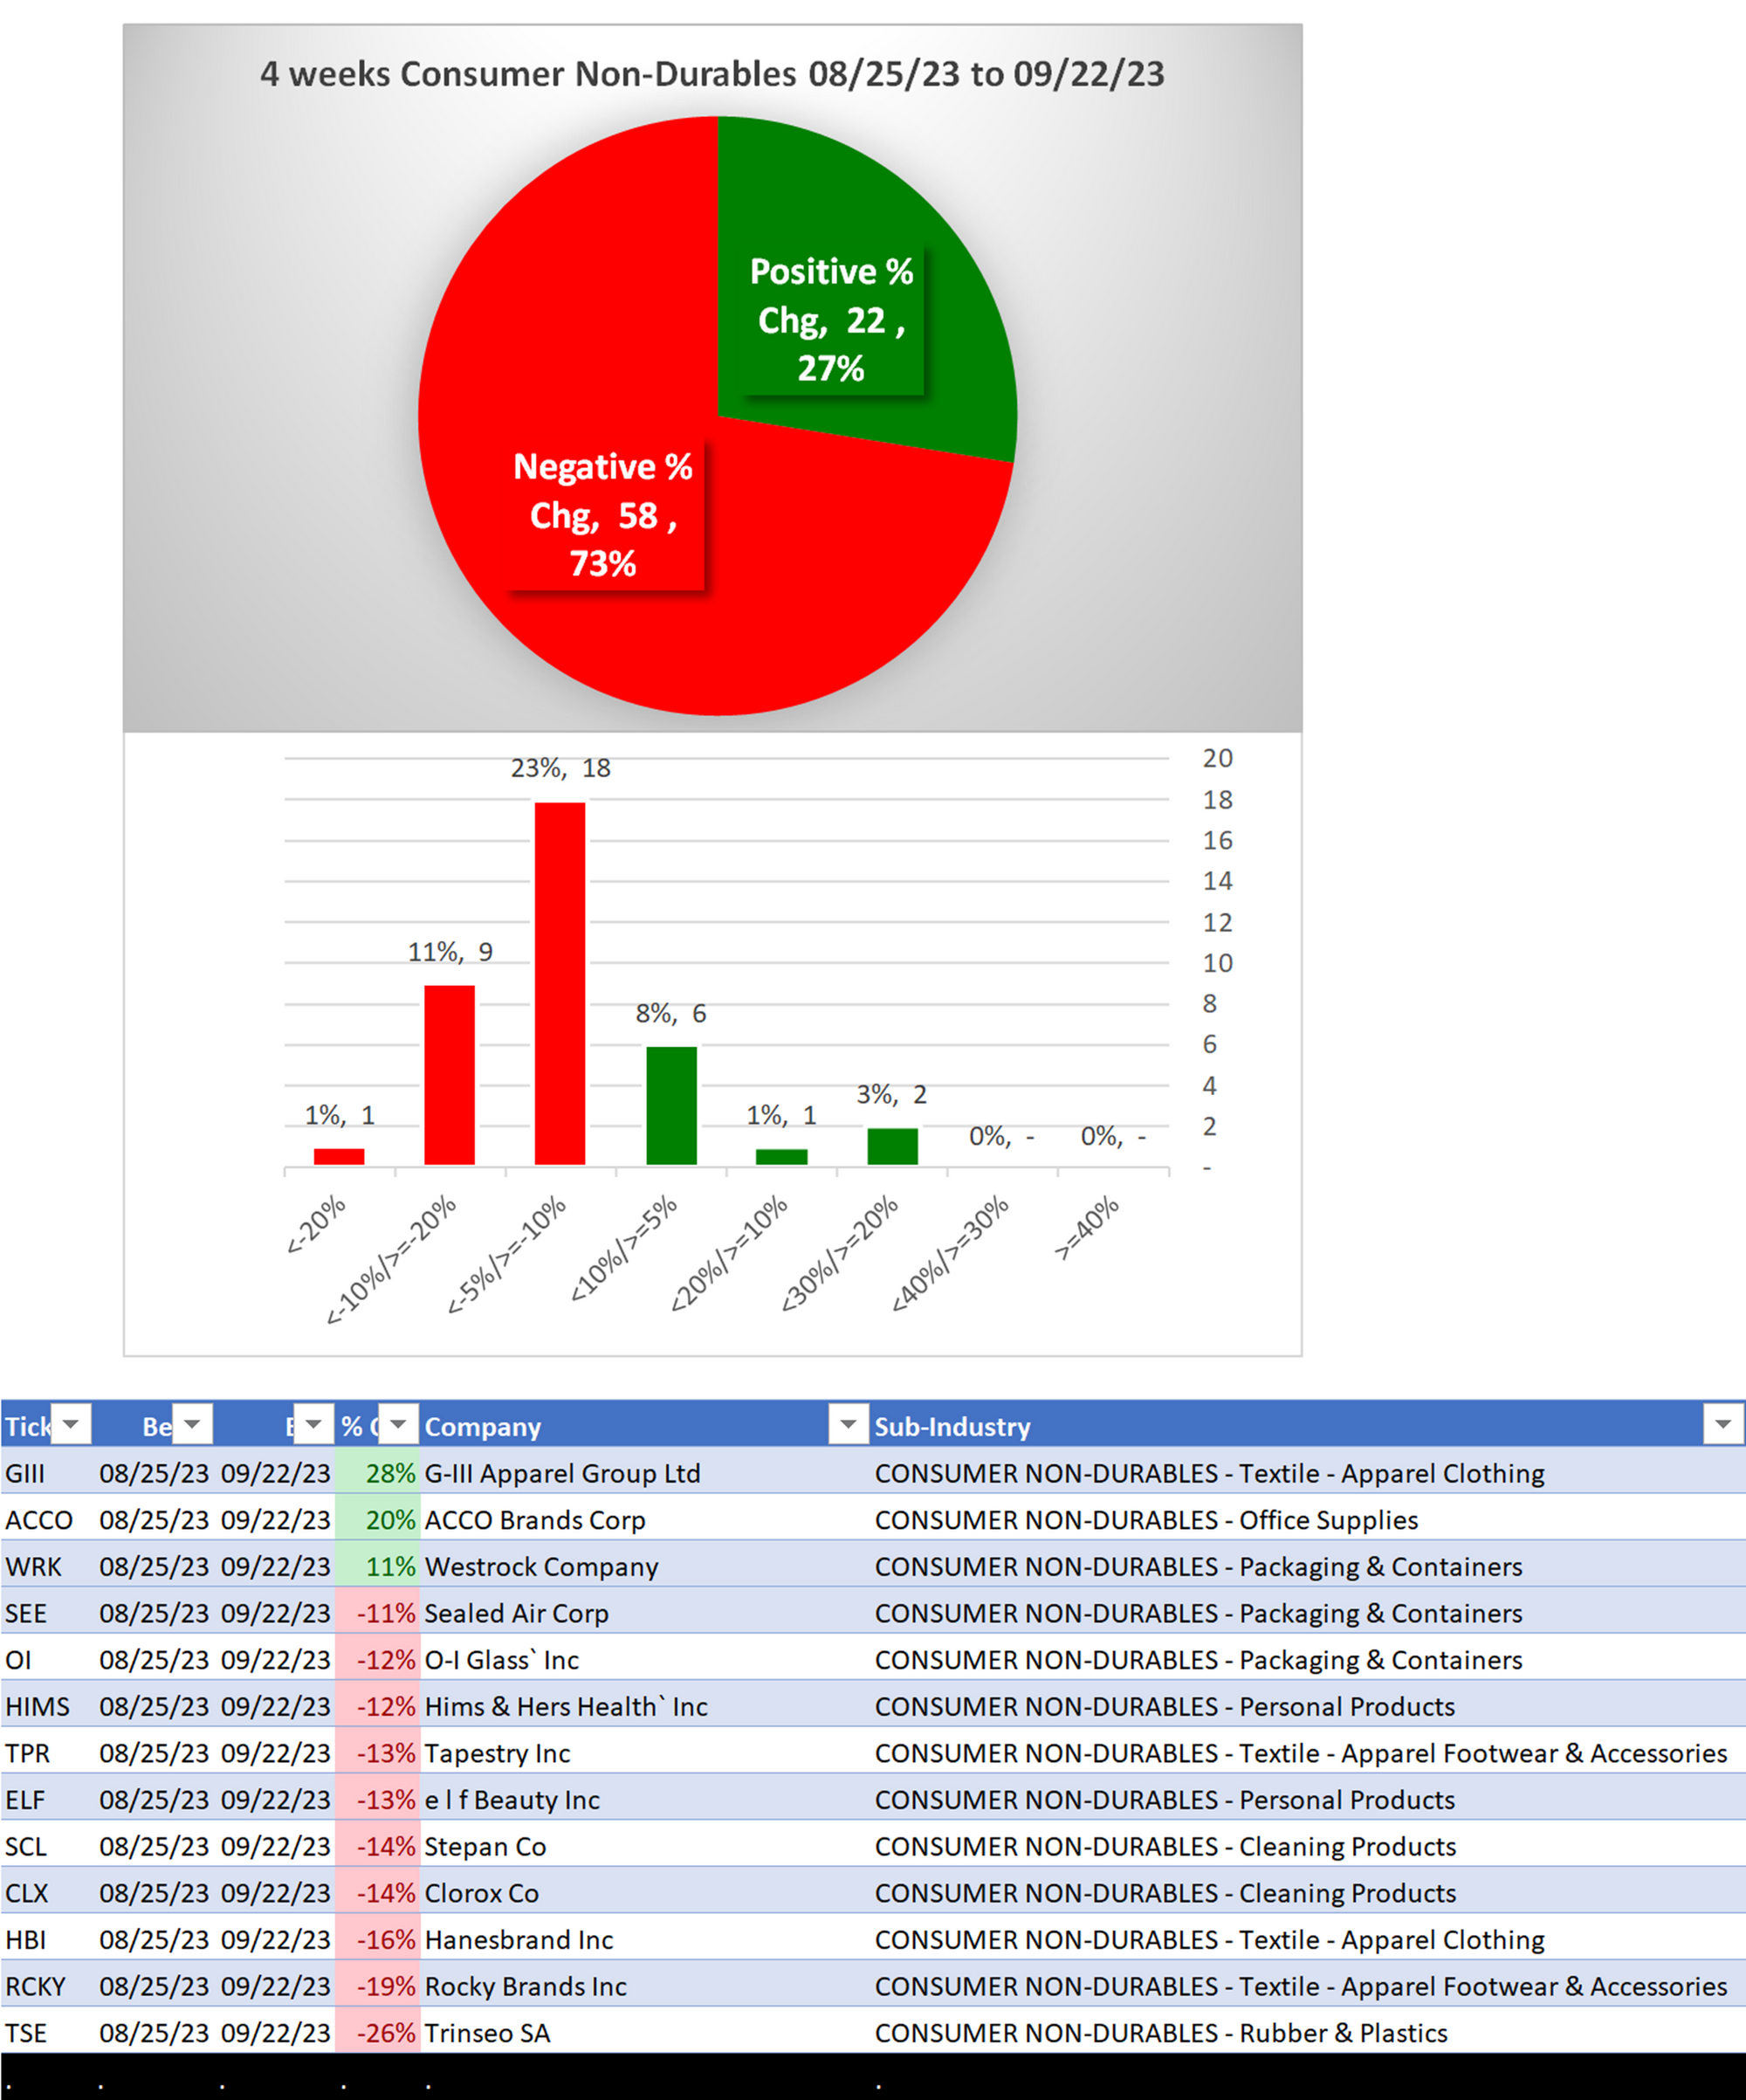
3B. Lookback 4 weeks
3C. Lookback 1 Week