Consumer Durables 2023-09-22: DOWN -1 to WEAK strength rating (6th strongest of 9 levels), previous move was also DOWN
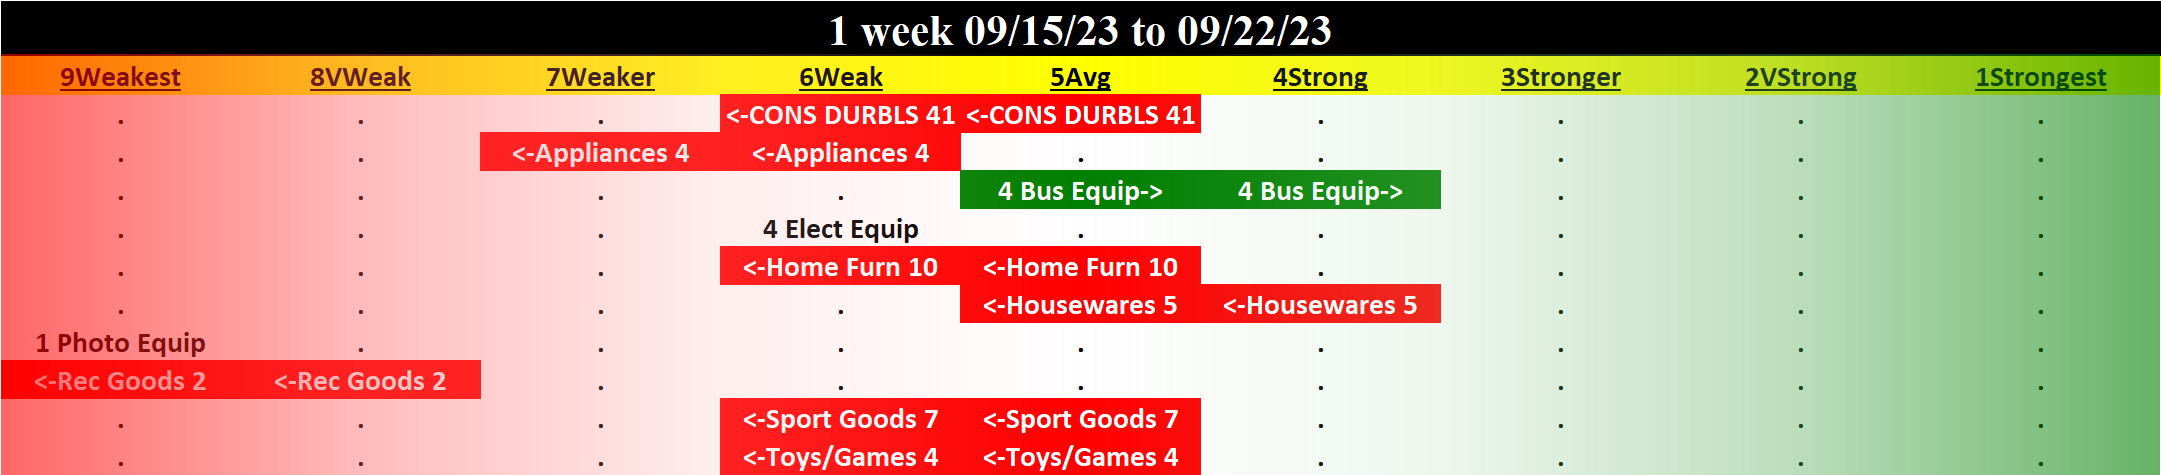
TABLE OF CONTENTS
- INDUSTRY OVERVIEW
1A. Performance
1B. Background - SUB-INDUSTRIES AND STOCKS DETAIL
2A. Sub-Industries Overview
2B. Sub-Industries 10-Week Strengthening Analysis
2C. Stocks 1 Week Strongest and Weakest - STRENGTH BY LOOKBACK PERIOD (with Best/Worst stocks)
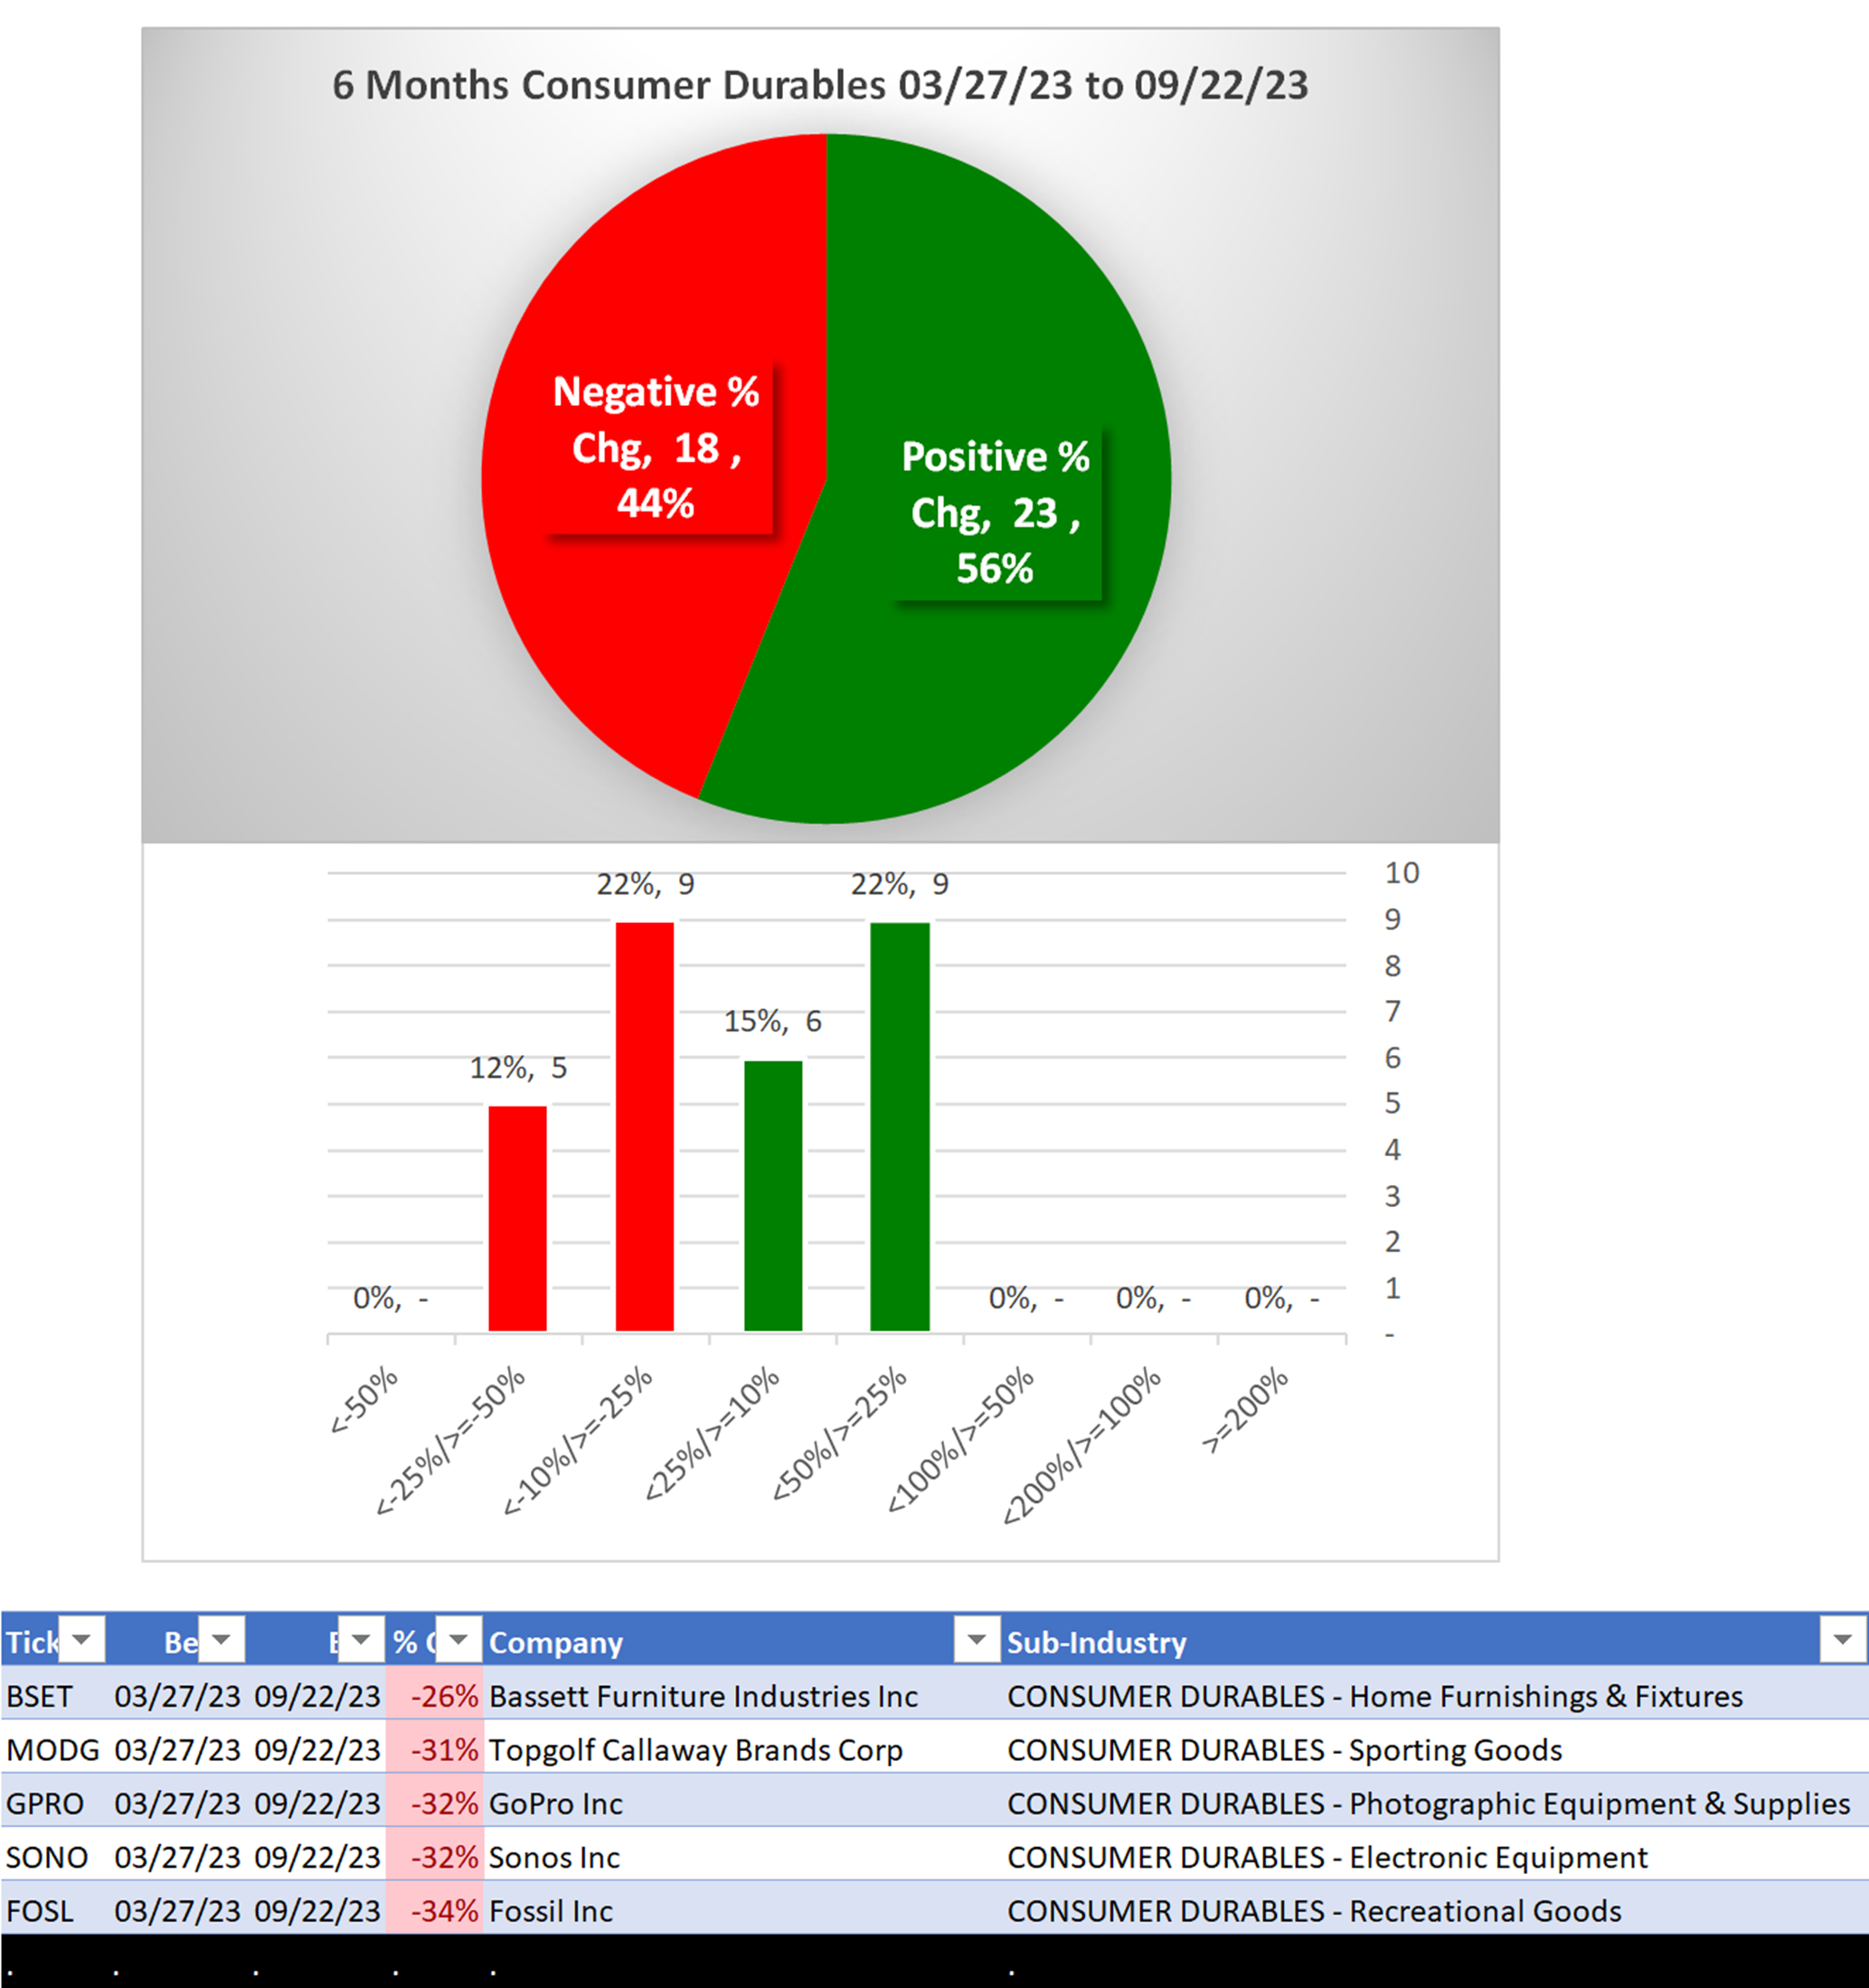
3A. Lookback 6 Months
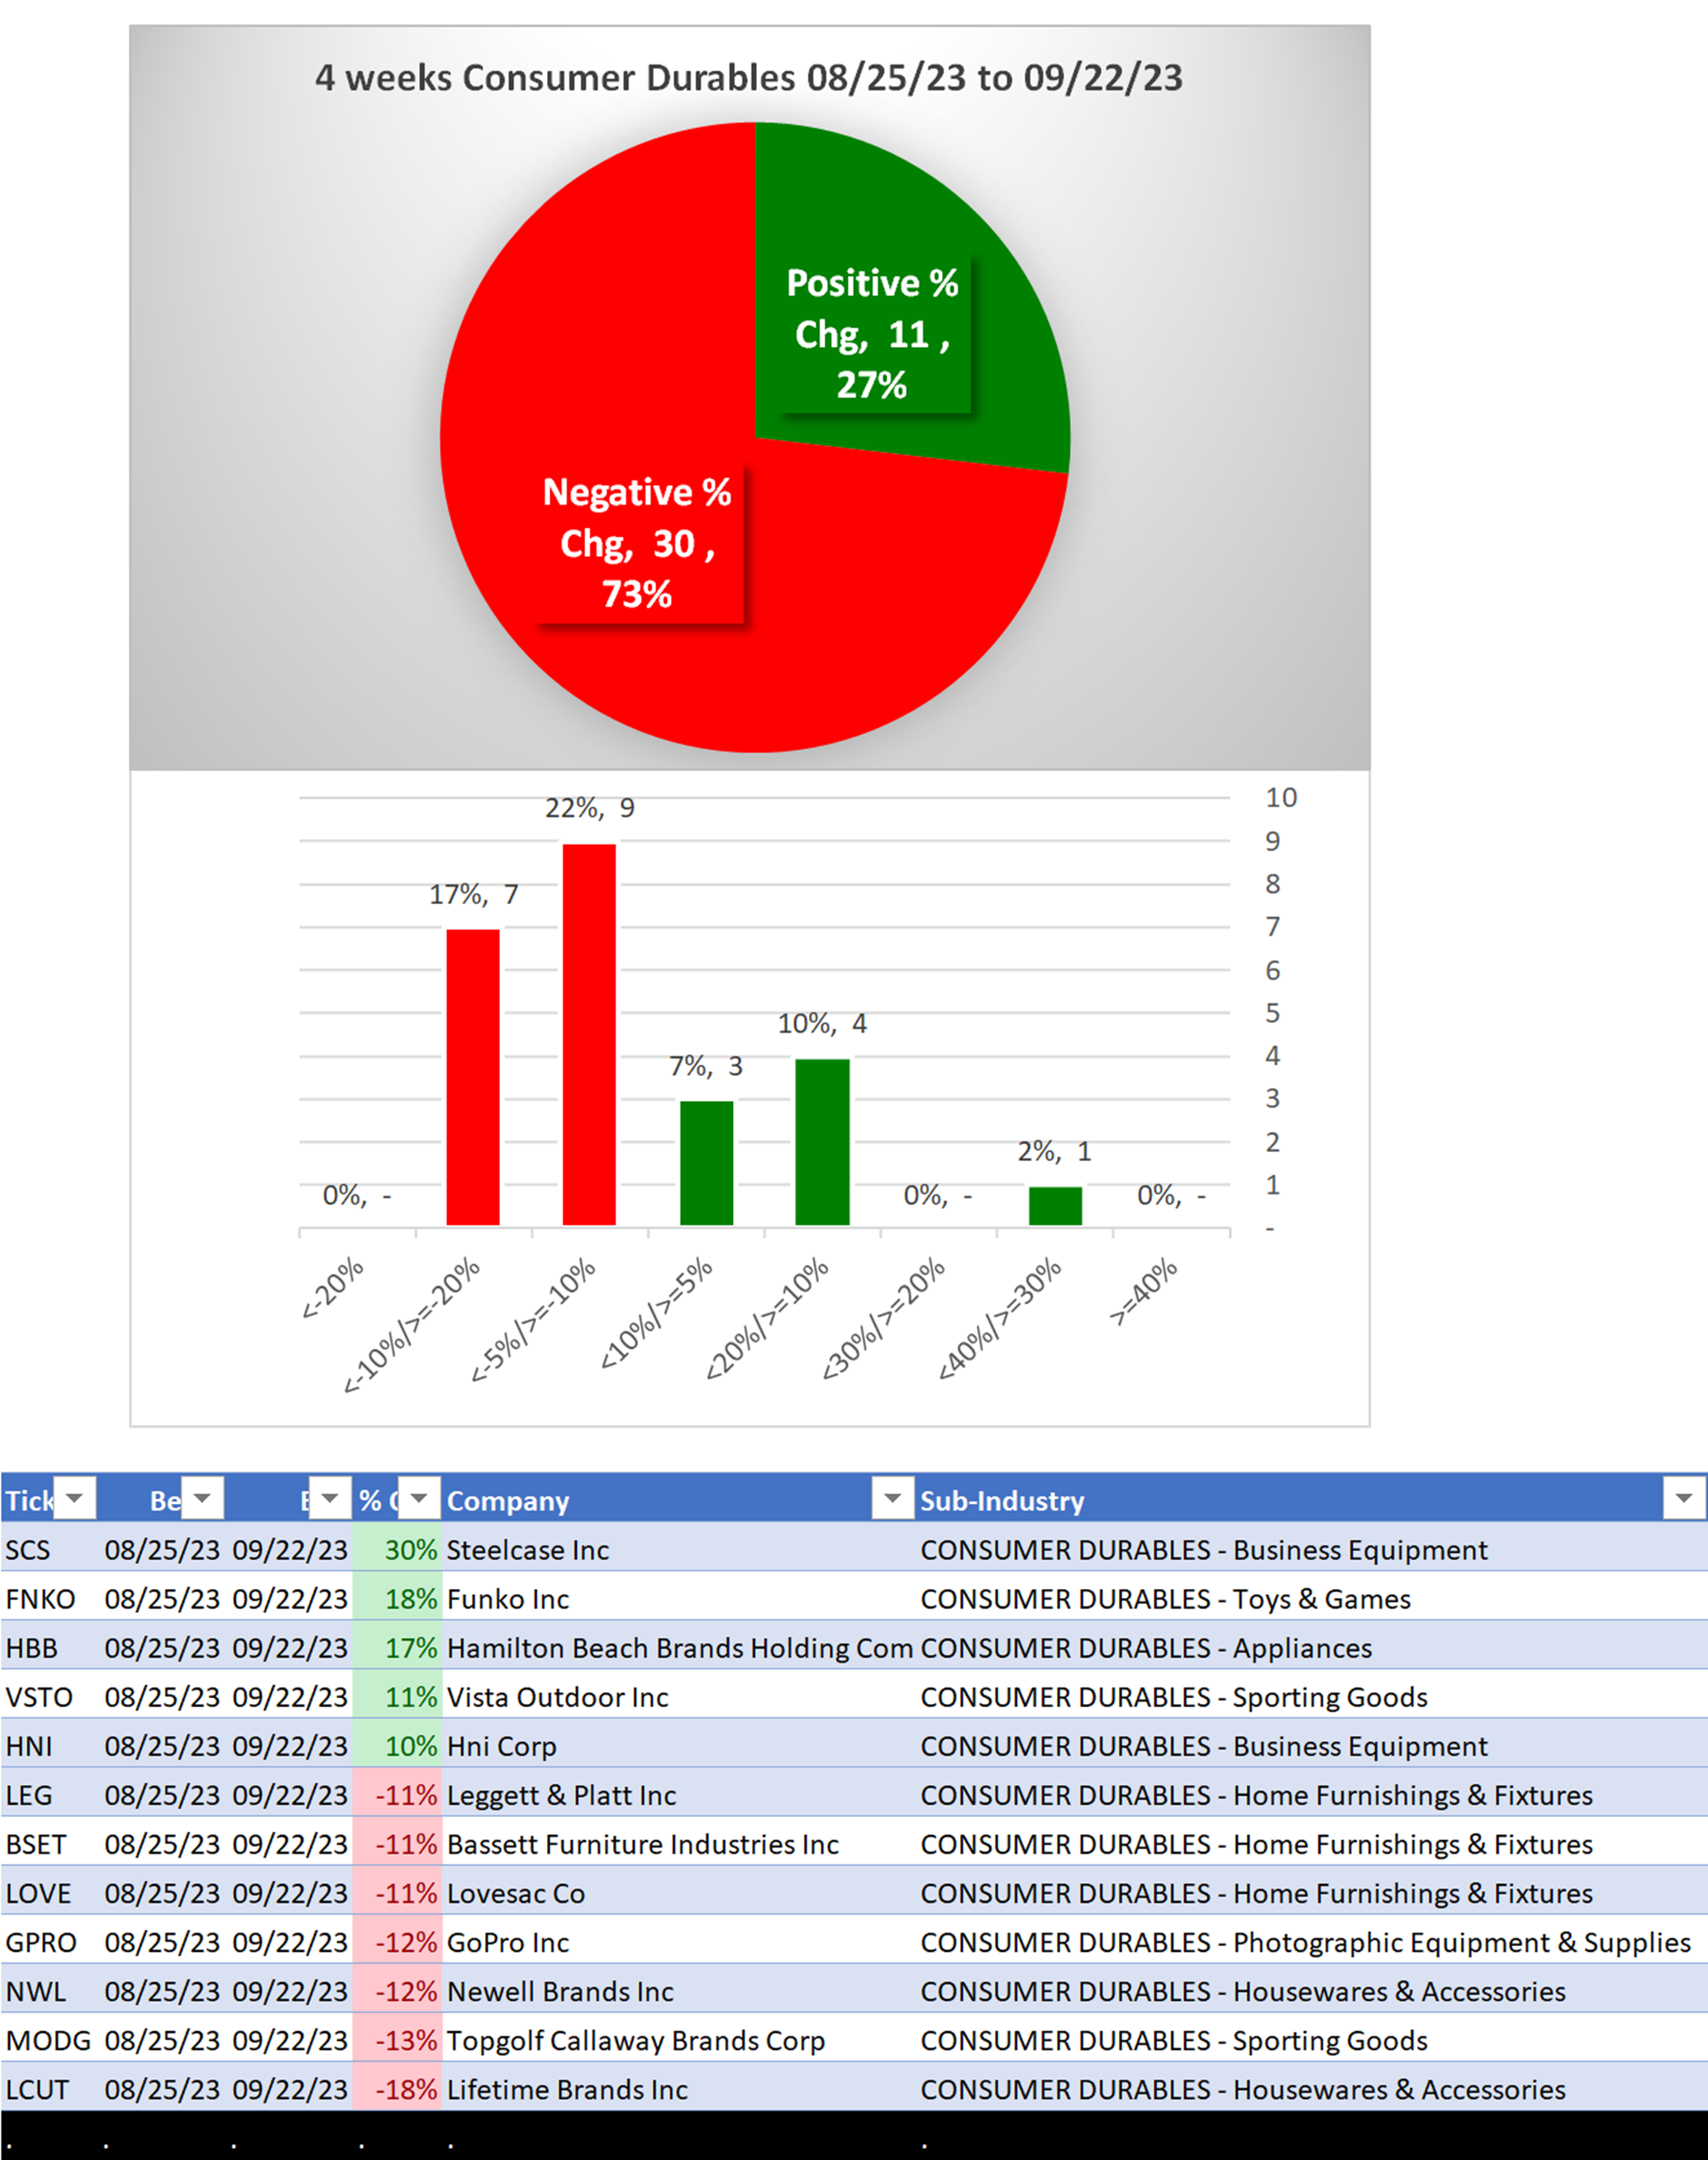
3B. Lookback 4 weeks
3C. Lookback 1 Week
1. INDUSTRY OVERVIEW
1A. Performance
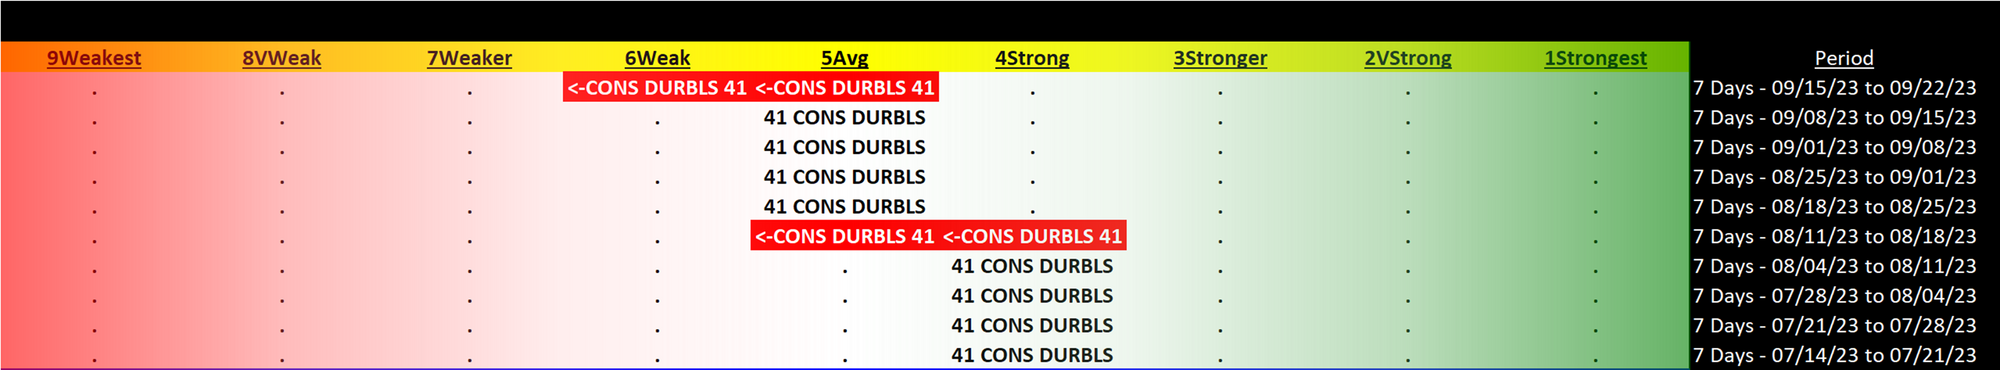
Past 10 Weeks Strengthening/Weakening week-by-week, per the following chart:
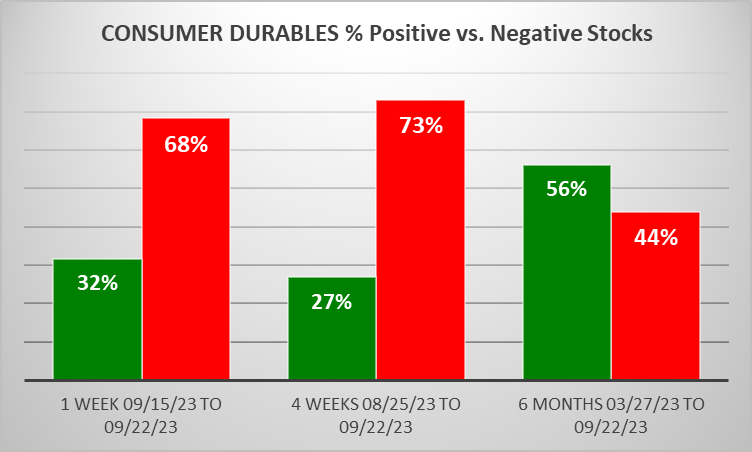
Mixed/STRENGTHENING 1 Week vs. Mid- and Longer-Term // 1 week positive/negative stocks ratio is HIGHER than 4 weeks but LOWER than 6 Months, per the following chart:
1B. Background
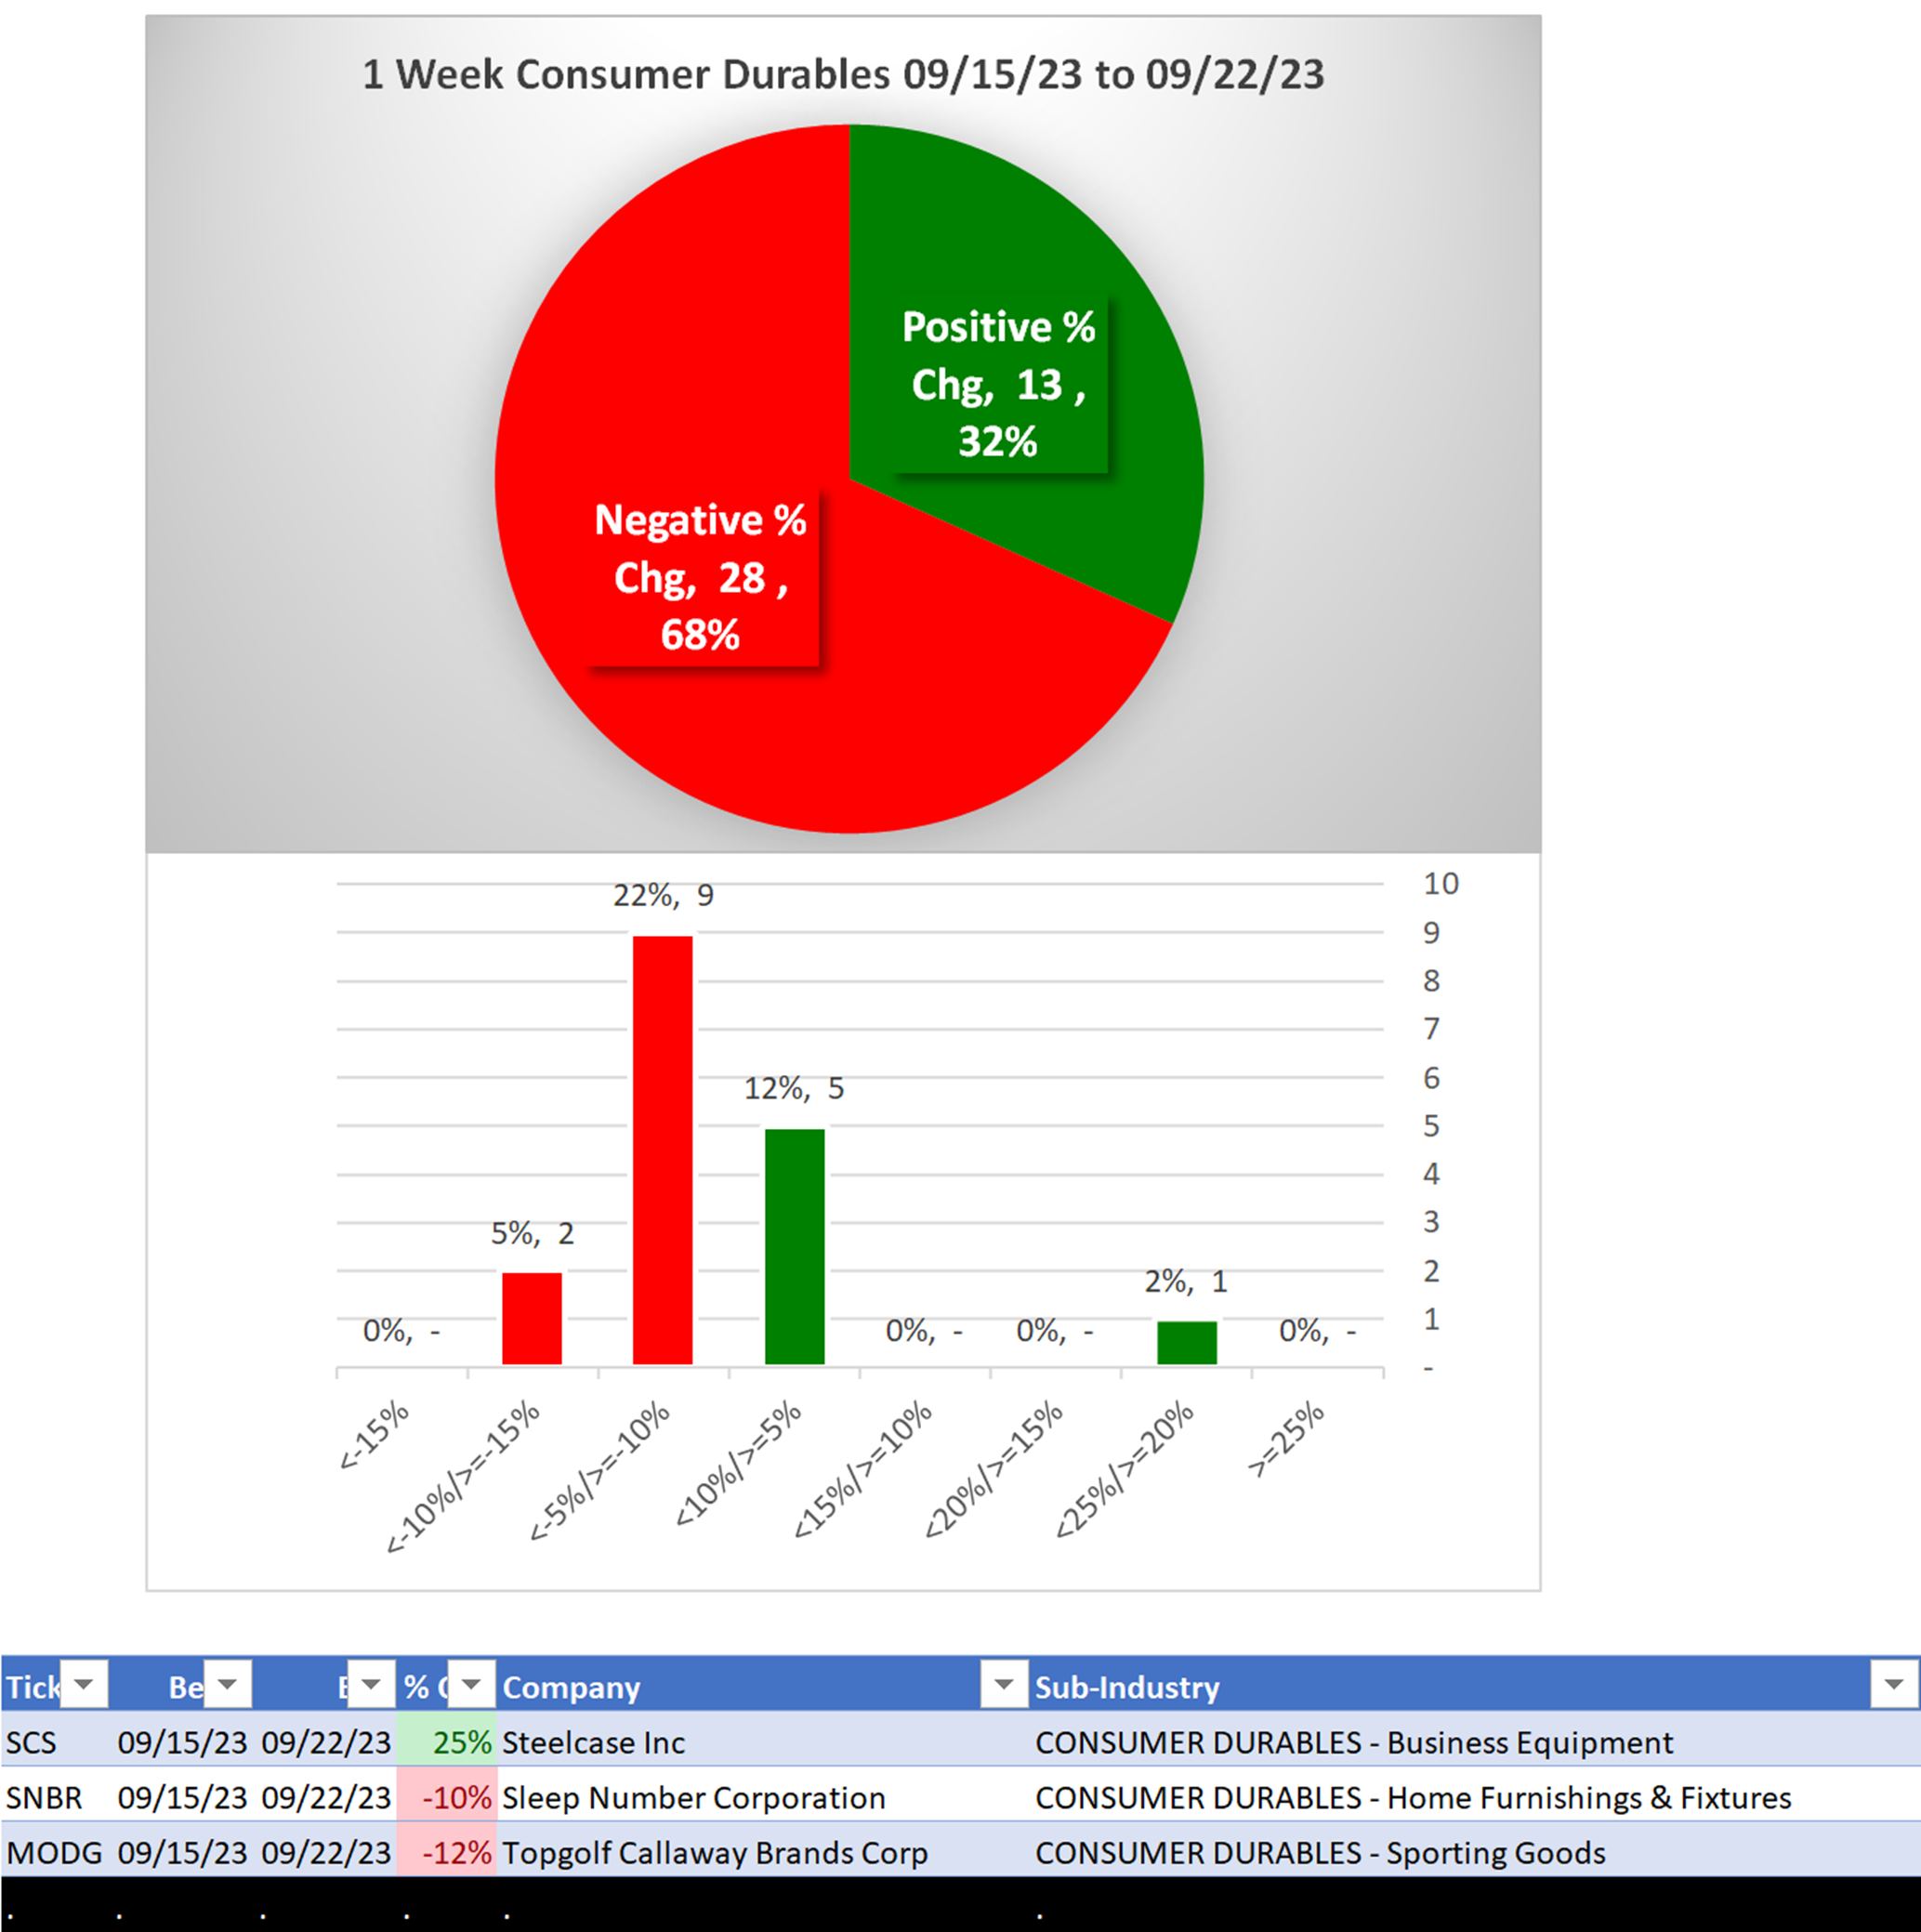
Largest of 9 sub-industries (41 stocks, average 5):
- Home Furnishings & Fixtures (10 stocks)
- Sporting Goods (7 stocks)
- Housewares & Accessories (5 stocks)
Top 10 by Market Capitalization:
POOL/Pool Corp, HAS/Hasbro Inc, FBIN/Fortune Brands Innovations Inc, TPX/Tempur Sealy International Inc., MAT/Mattel Inc, WHR/Whirlpool Corp, FN/Fabrinet, NWL/Newell Brands Inc, GOLF/Acushnet Holdings Corp, LEG/Leggett & Platt Inc
2. SUB-INDUSTRIES AND STOCKS DETAIL
2A. Sub-Industries Overview
Strengthened: 1/9 sub-industries
Weakened: 6/9 sub-industries
STRONGEST at Strong rating/4th strongest of 9 levels:
- Business Equipment (4 stocks)
WEAKEST at Weakest rating/9th strongest of 9 levels:
- Photographic Equipment & Supplies (1 stocks)
- Recreational Goods (2 stocks)
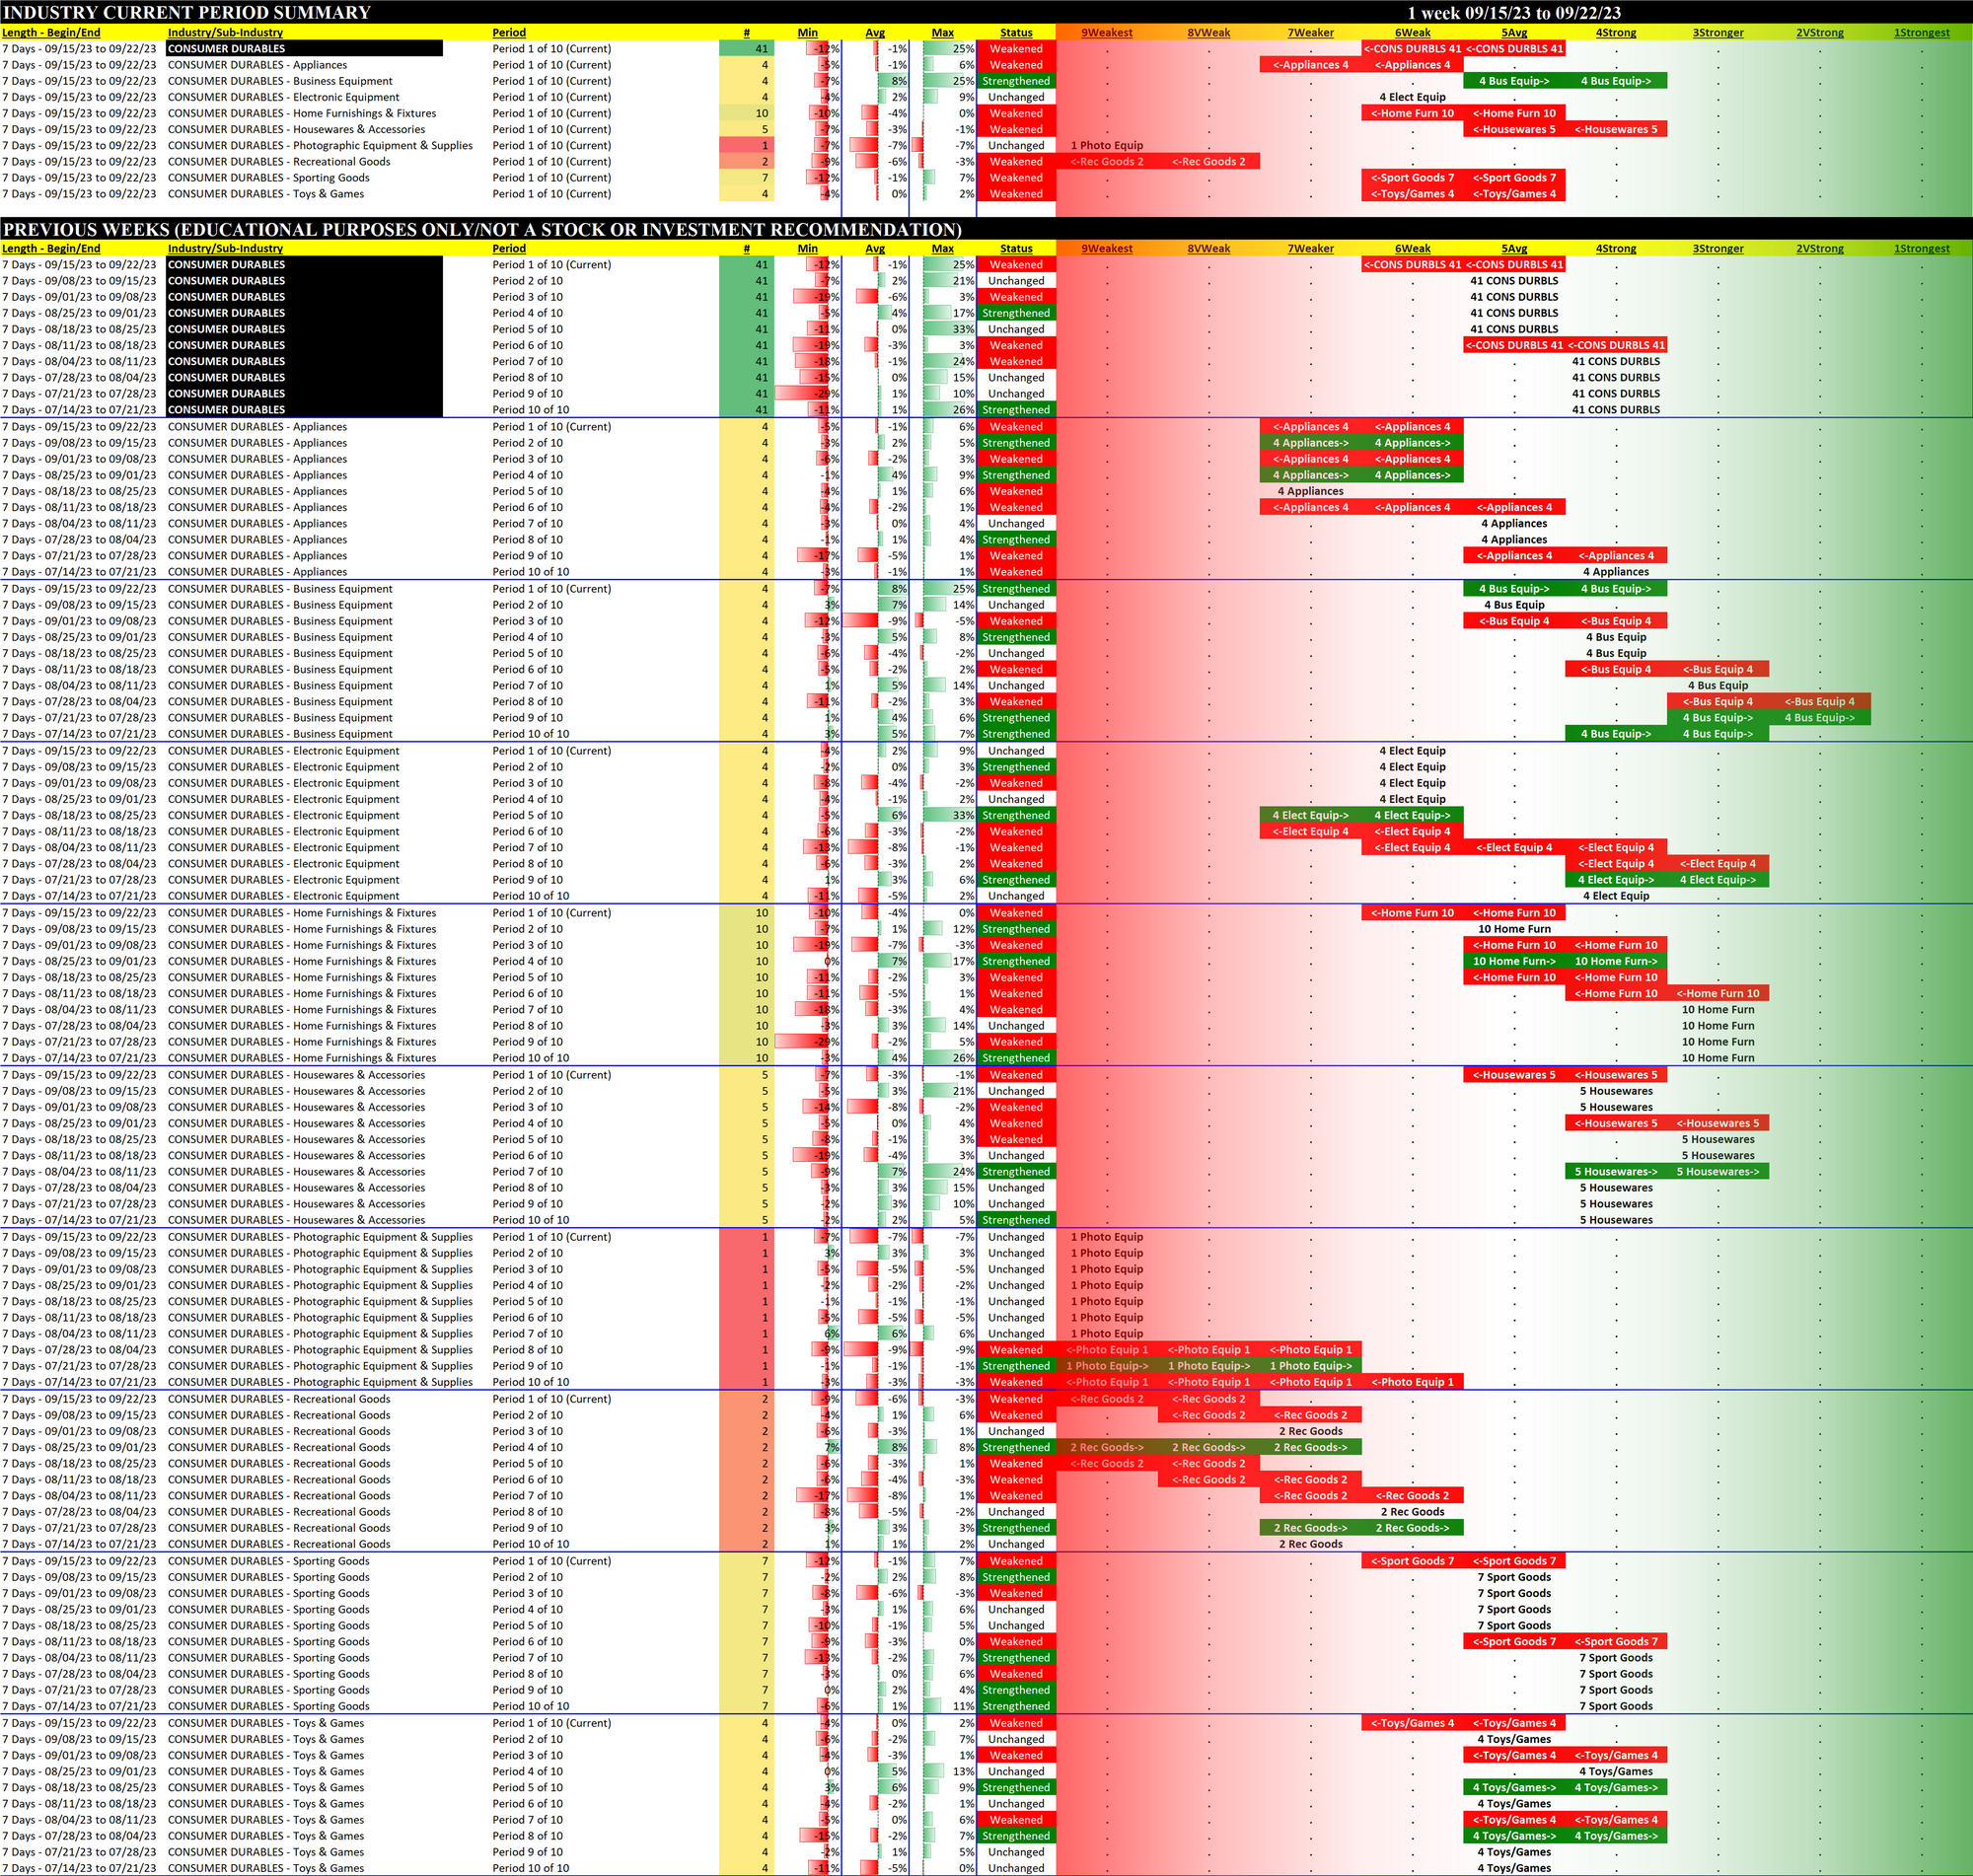
2B. Sub-Industries 10-Week Strengthening Analysis
What: recent week-by-week strength changes for the industry and each underlying sub-industry
Why: objective measurement of strengthening and weakening enabling comparison within and across industries and sub-industries
2C. Stocks 1 Week Strongest and Weakest
What: stocks currently rated Strongest/Weakest (highest/lowest of 9 strength ratings)
Why: most interesting stocks for available capital because
- the Strongest have the least amount of overhead supply to dampen breakouts while
- the Weakest may be prone to volatility, subject to big pops from bottom-fishing and short-covering BUT ALSO to bigger and faster falls.
(Not guaranteed and not a recommendation - weak stocks in weakening sub-industries may be better shorts than high-flyers.)
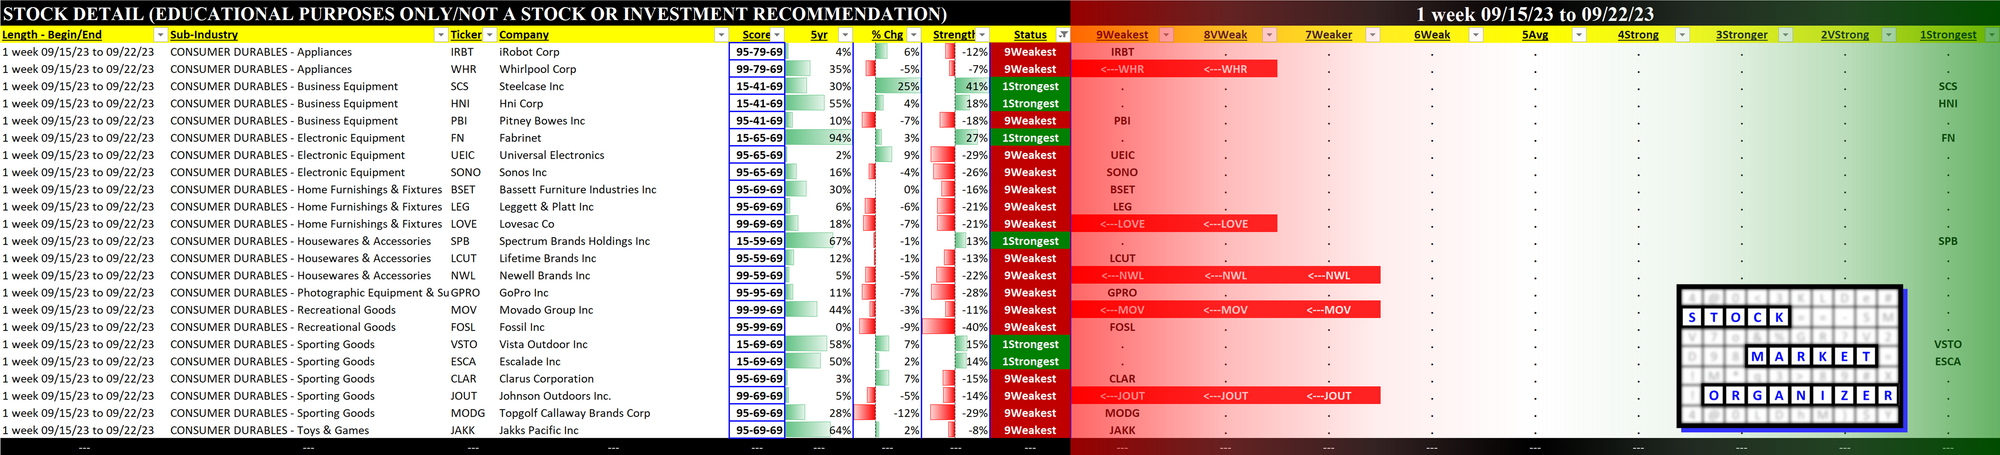
STRENGTH BY LOOKBACK PERIOD (with Best/Worst stocks)
3A. Lookback 6 Months
3B. Lookback 4 weeks
3C. Lookback 1 Week