Consumer Durables 2023-09-15: Unchanged at AVERAGE strength rating (5th strongest of 9 levels), previous move was DOWN

SUMMARY
Performance
Bottom line: flat for the past 4 weeks
Context: weakening recently vs. YTD
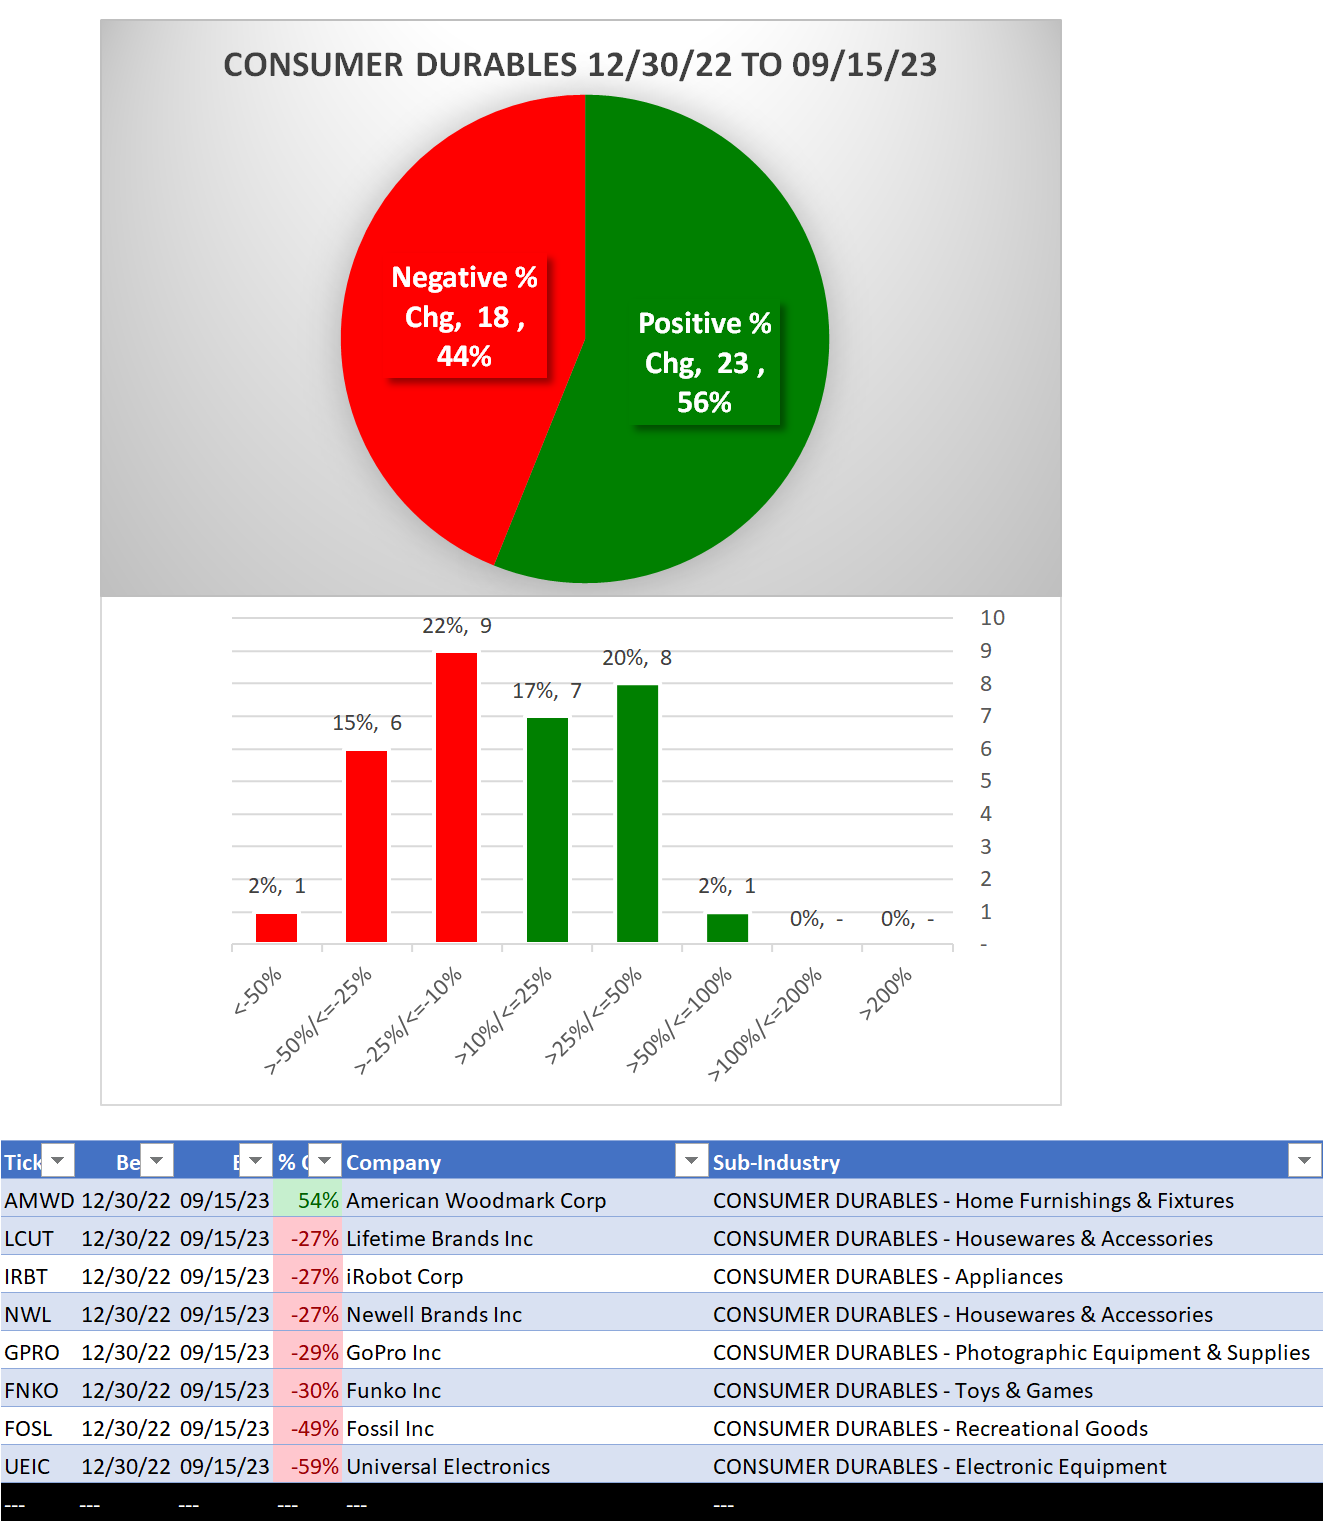
- 56% positive stocks YTD
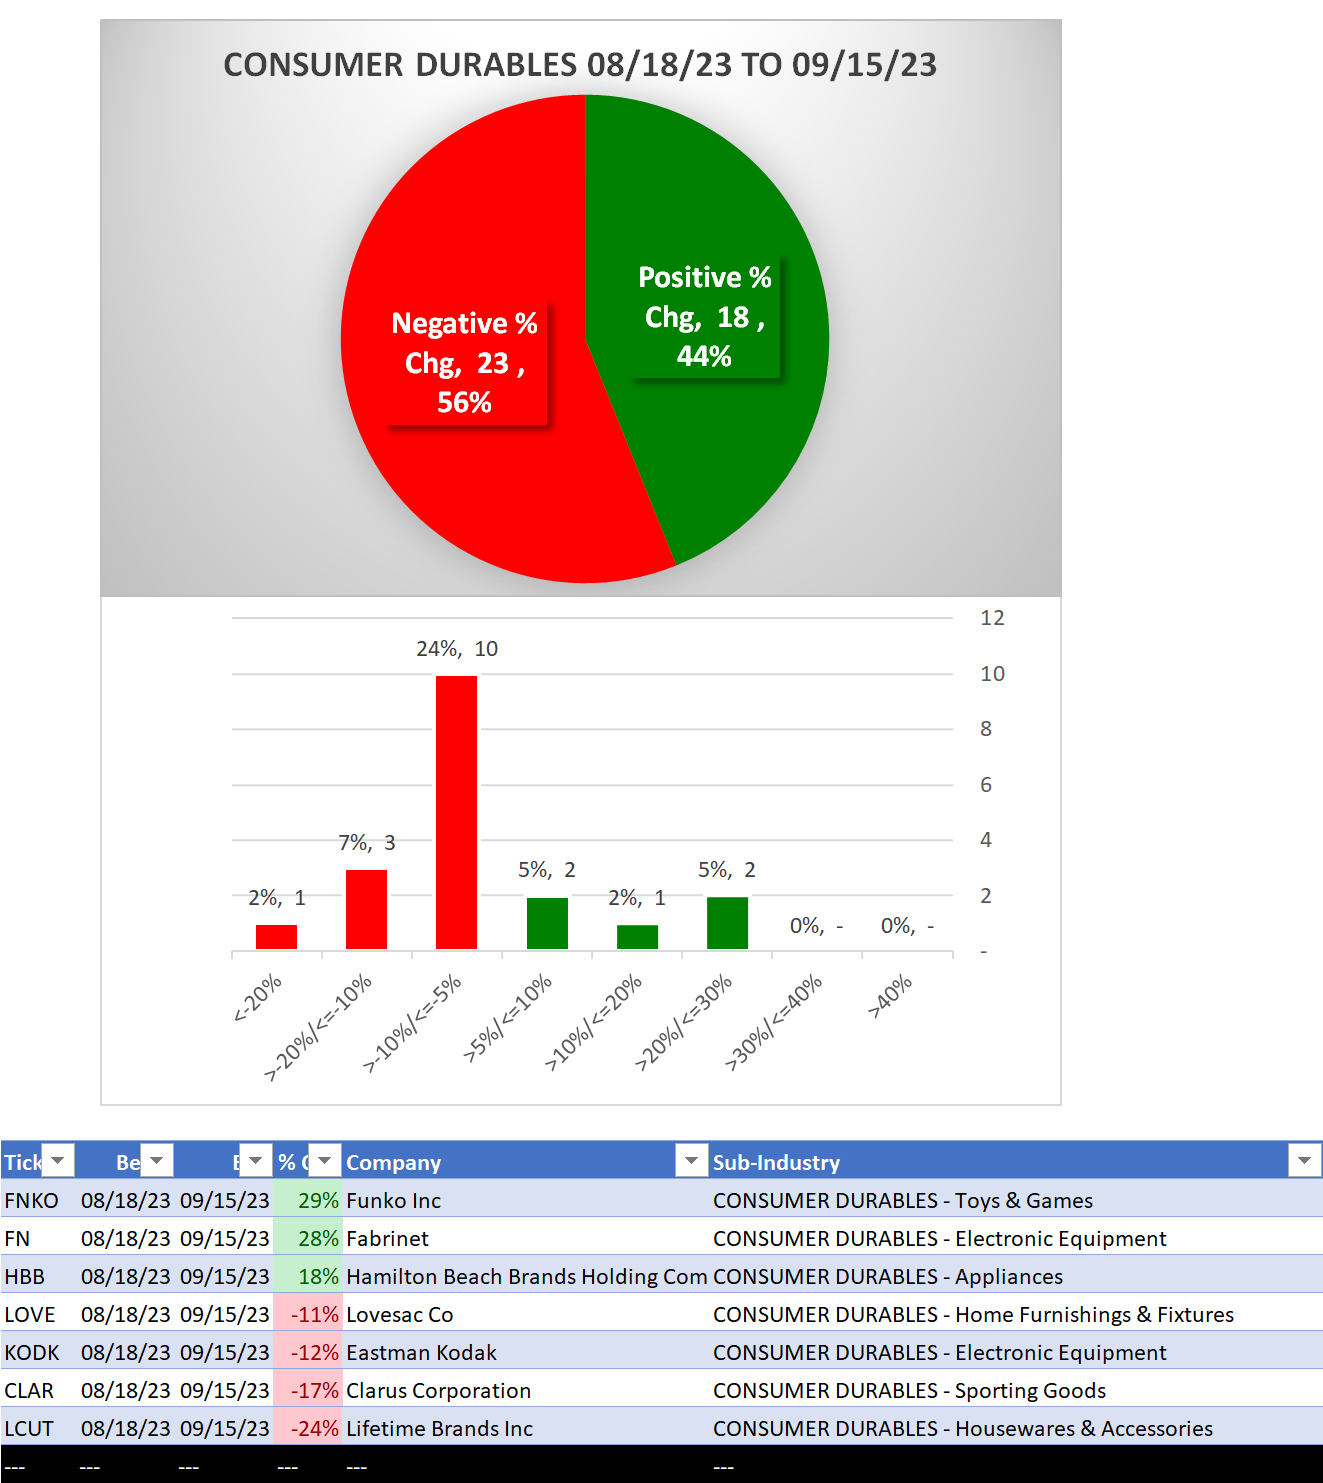
- 44% positive stocks past 4 weeks
Background
Largest of 9 sub-industries (41 stocks total):
- 10 stocks Home Furnishings & Fixtures
- 5 stocks Housewares & Accessories
10 Biggest Market Cap stocks: POOL, HAS, FBIN, TPX, MAT, WHR, FN, NWL, GOLF, LEG
DETAIL: 1 week review, YTD/4 weeks lookbacks
1 Week Review
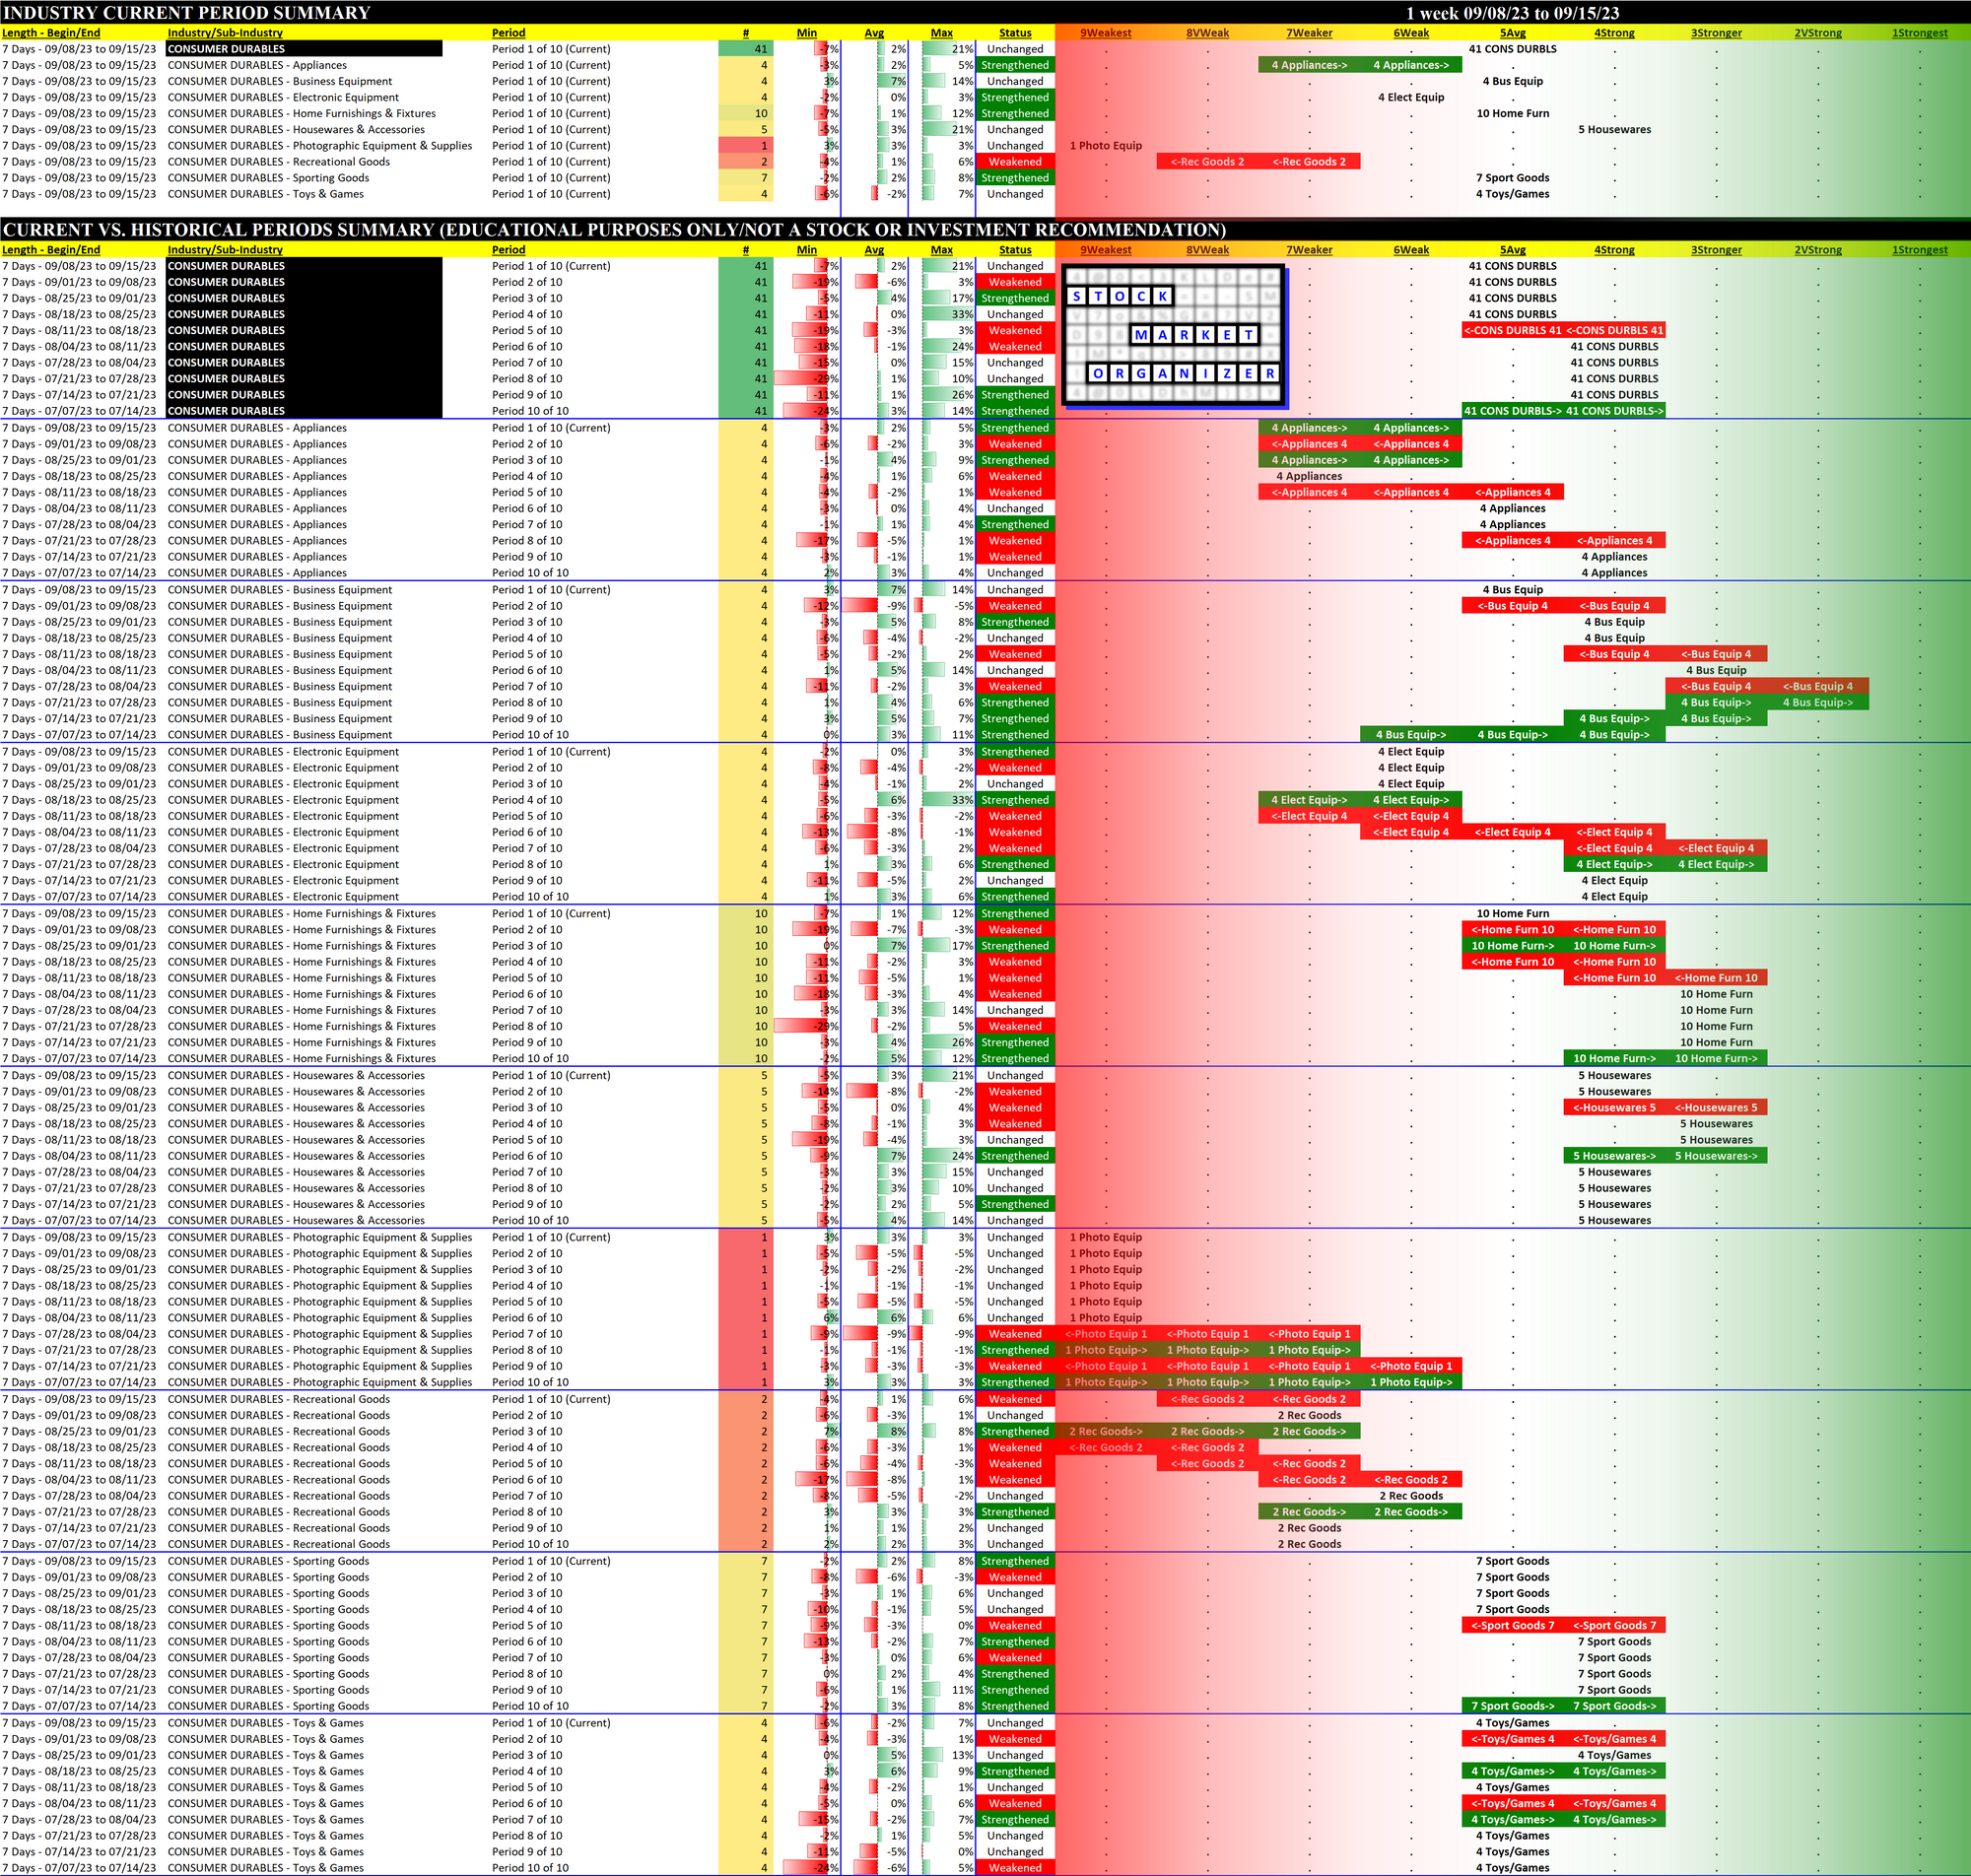
Strengthened: 1/9 sub-industries
Weakened: 1/9 sub-industries
Strongest at Strong/4th strongest (of 9 levels) rating: Housewares & Accessories
Weakest at Weakest/9th strongest rating: Photographic Equipment & Supplies (1 stock, Recreational Goods with 2 stocks is next at Very Weak/8th strongest)
10-Week Week-by-Week Industry/Sub-industry Strength Comparison
What: recent week-by-week strength changes for the industry and each underlying sub-industry
Why: objective measurement of strengthening and weakening enabling comparison within and across industries and sub-industries
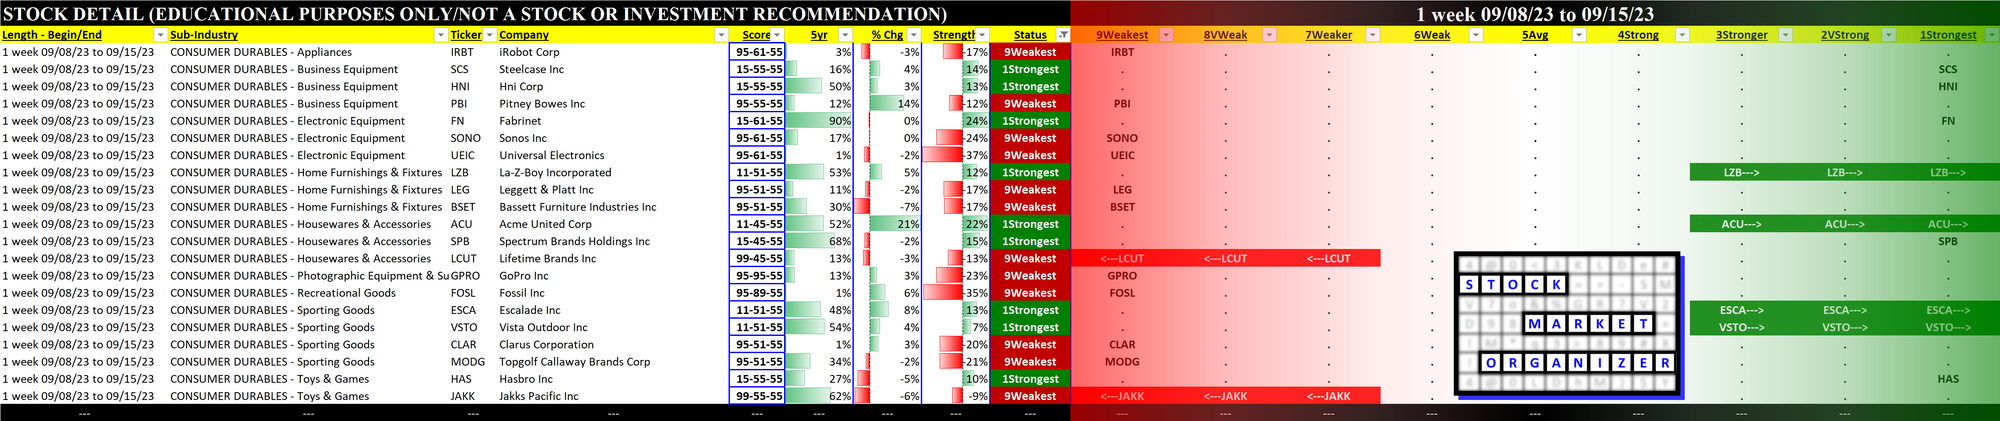
Strongest and Weakest Stocks
What: stocks currently rated Strongest/Weakest (highest/lowest of 9 strength ratings)
Why: most interesting stocks for available capital because
- the Strongest may be meme-stock mania candidates prone to breakouts, and
- the Weakest may be prone to large bottom-fishing/short-covering-driven pops... and may also be primed for bigger and faster falls. (Not guaranteed and not a recommendation - weak stocks in weakening sub-industries may be better shorts than high-flyers.)
YTD Lookback
4 Weeks Lookback