Computer Software & Services 2023-09-28: Unchanged at AVERAGE strength rating (5th strongest of 9 levels), previous move was DOWN
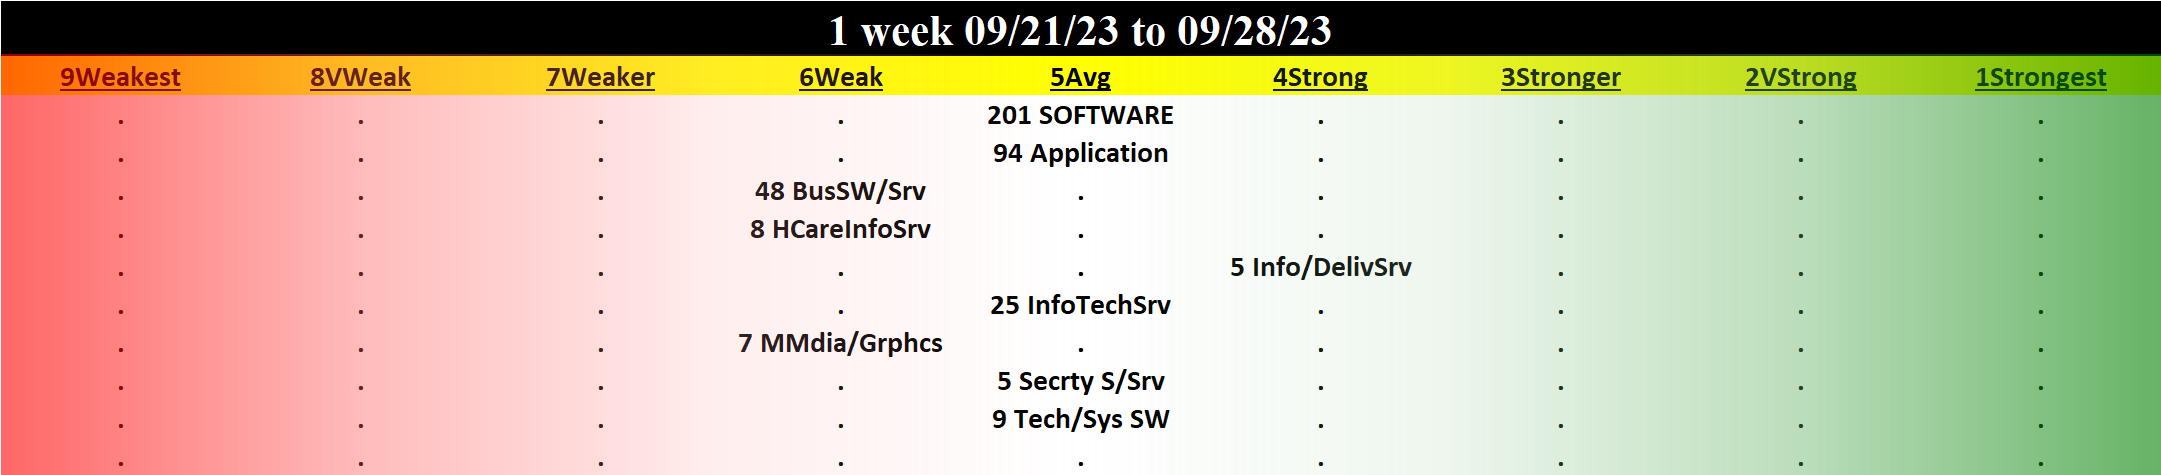
TABLE OF CONTENTS
- INDUSTRY OVERVIEW
1A. Performance
1B. Background - SUB-INDUSTRIES AND STOCKS DETAIL
2A. Sub-Industries Overview
2B. Sub-Industries 10-Week Strengthening Analysis
2C. Stocks 1 Week Strongest and Weakest - STRENGTH BY LOOKBACK PERIOD (with Best/Worst stocks)
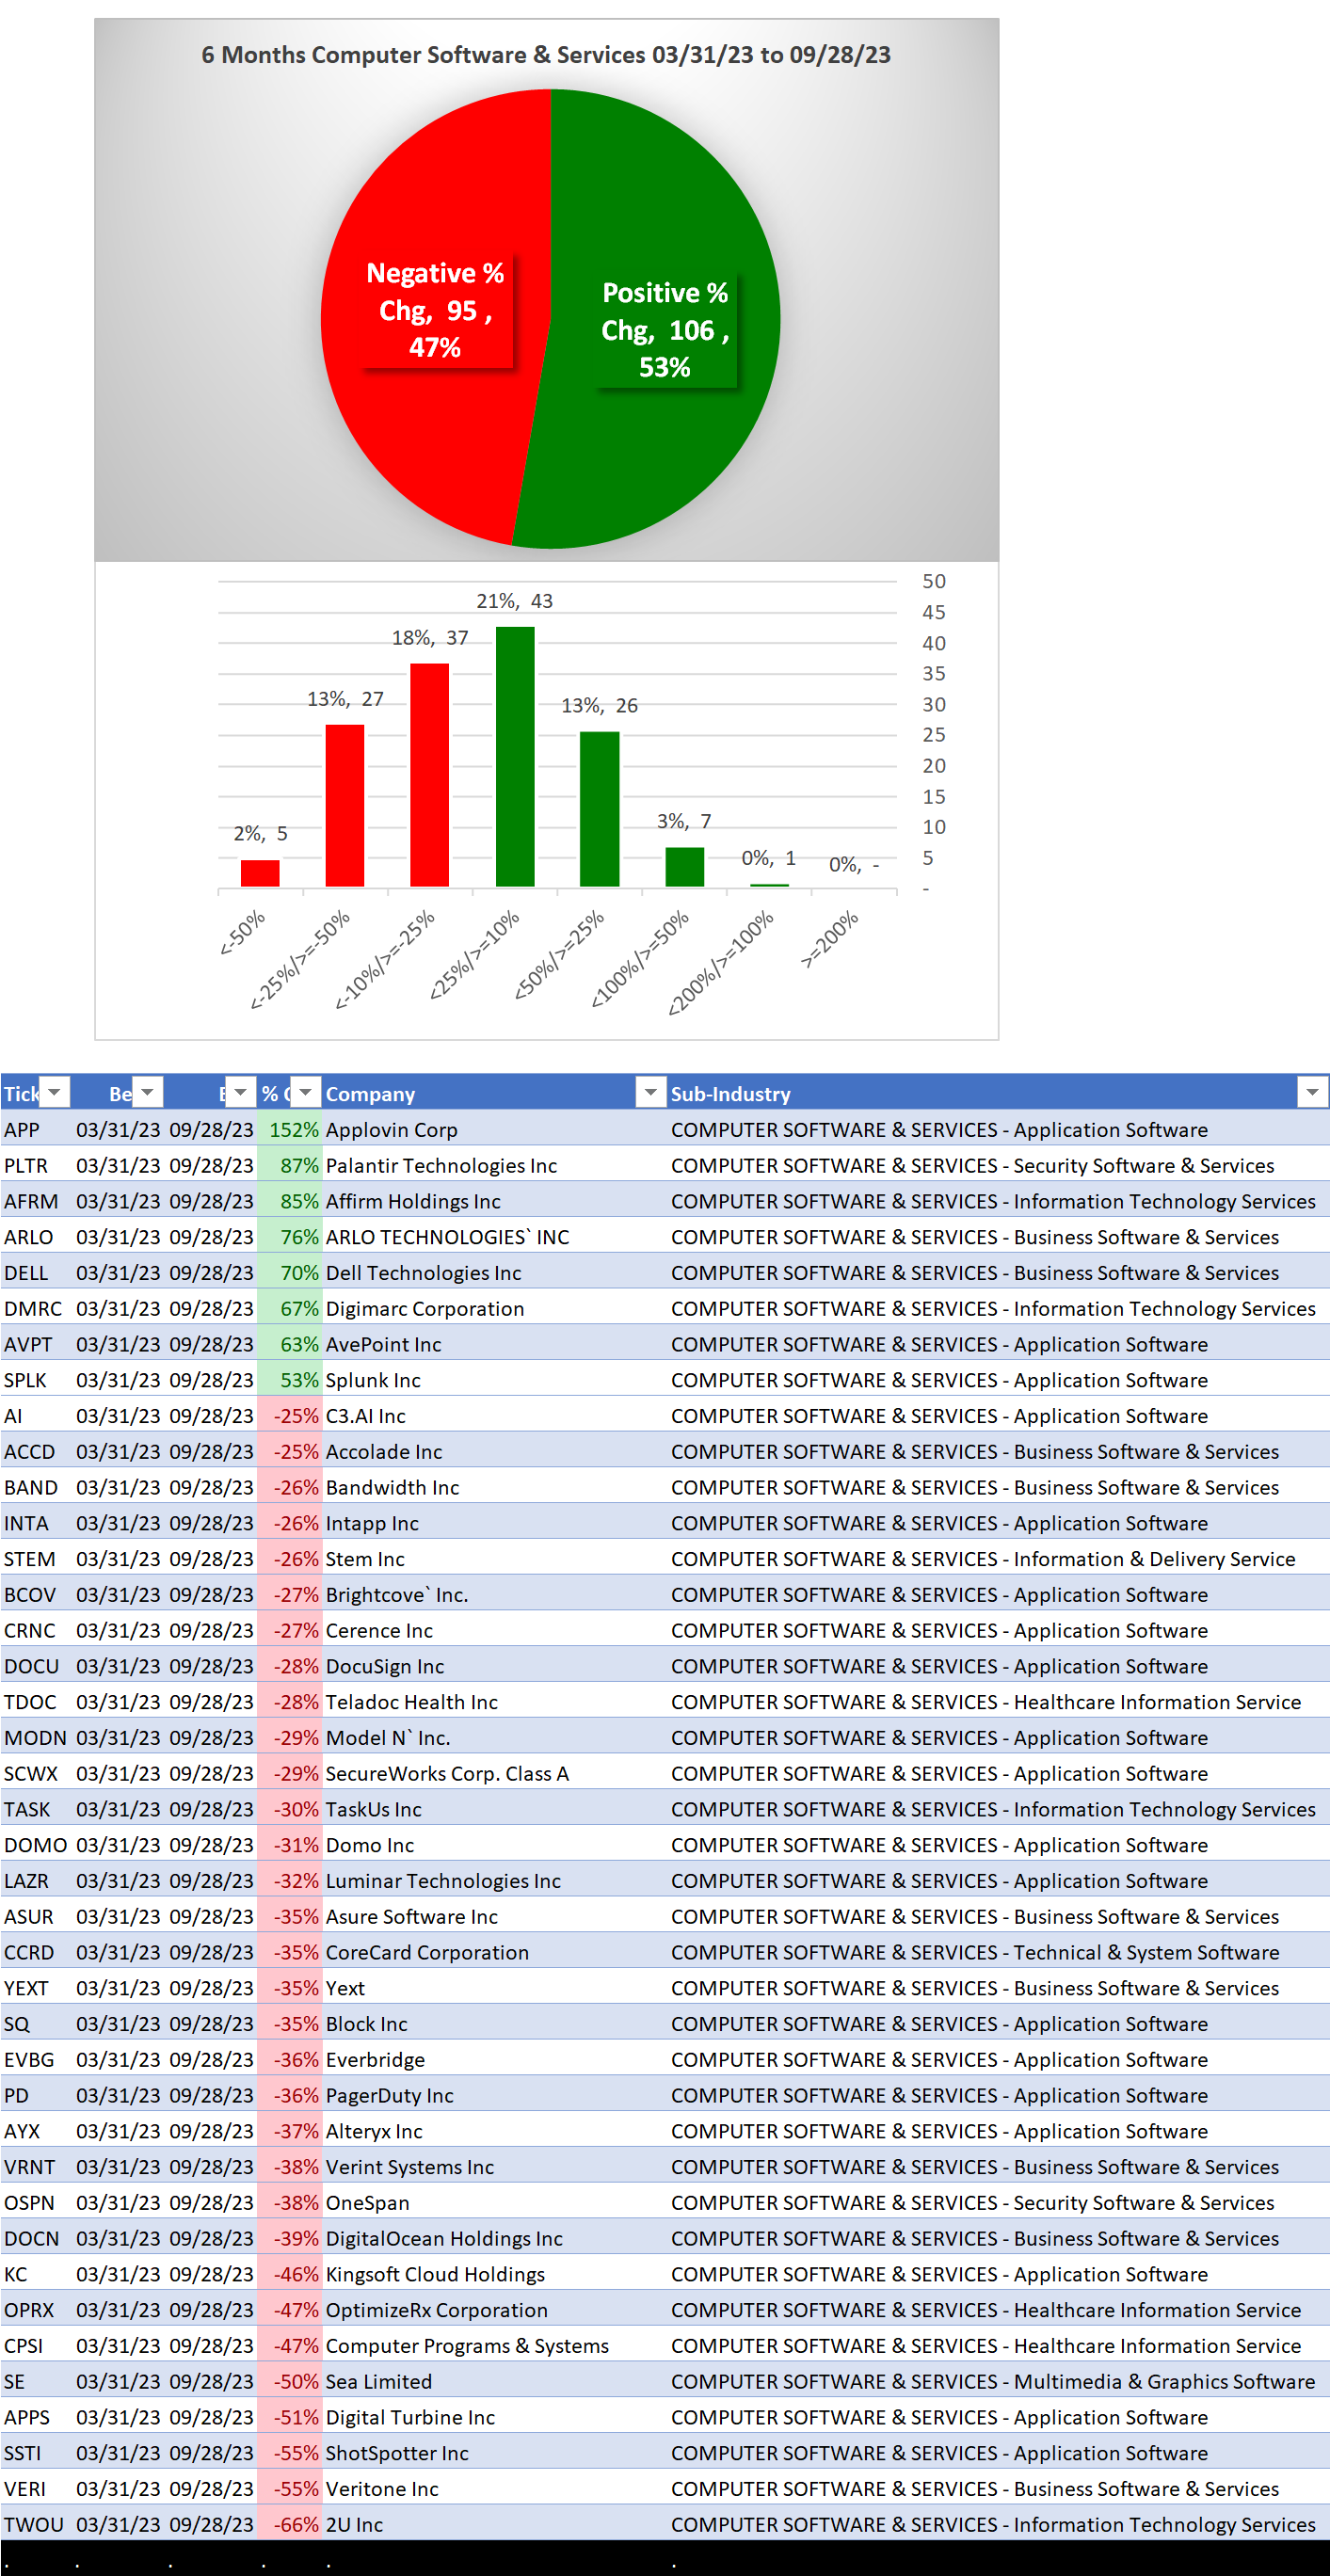
3A. Lookback 6 Months
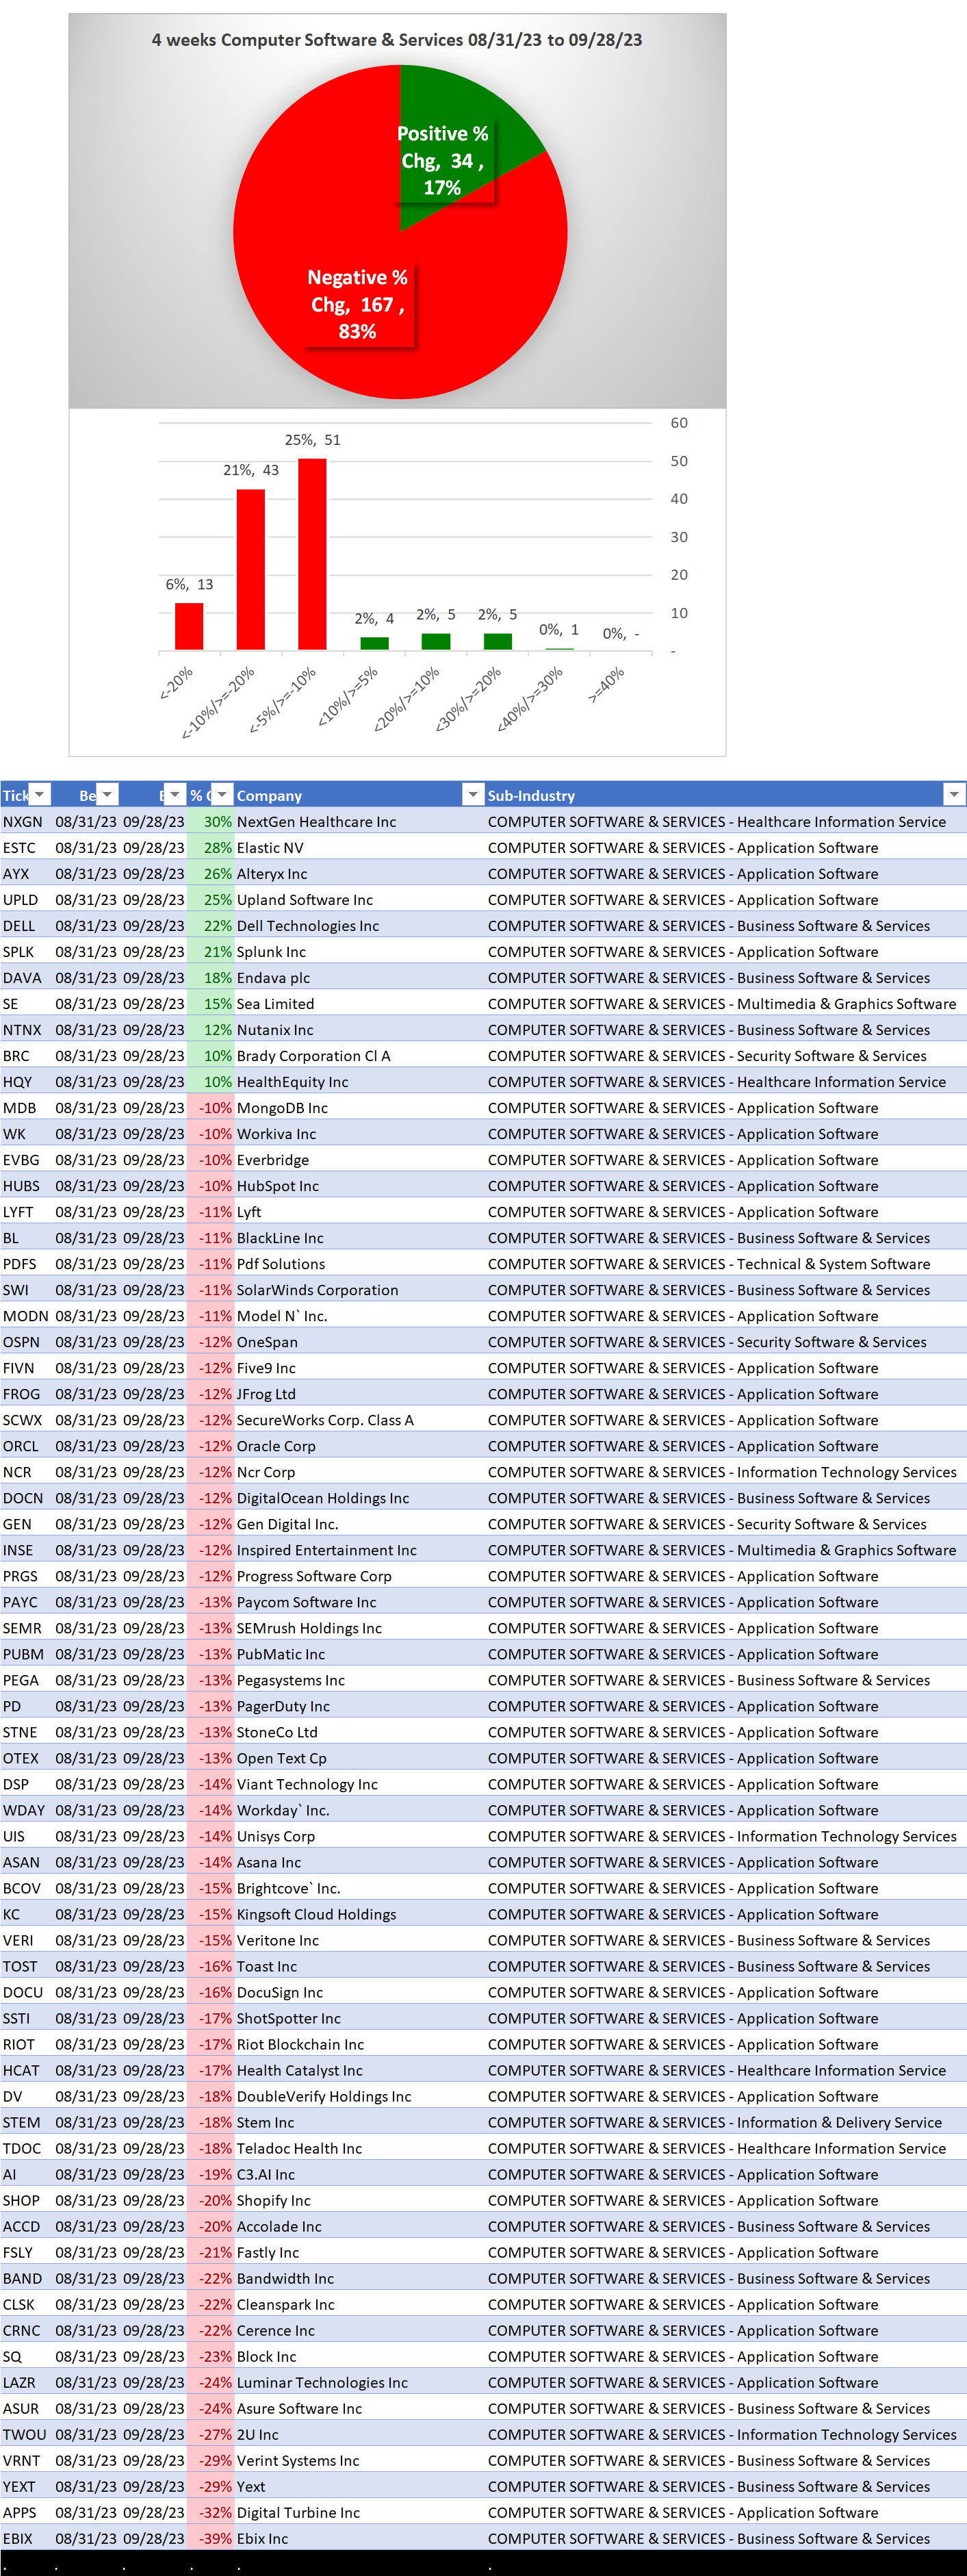
3B. Lookback 4 weeks
3C. Lookback 1 Week
1. INDUSTRY OVERVIEW
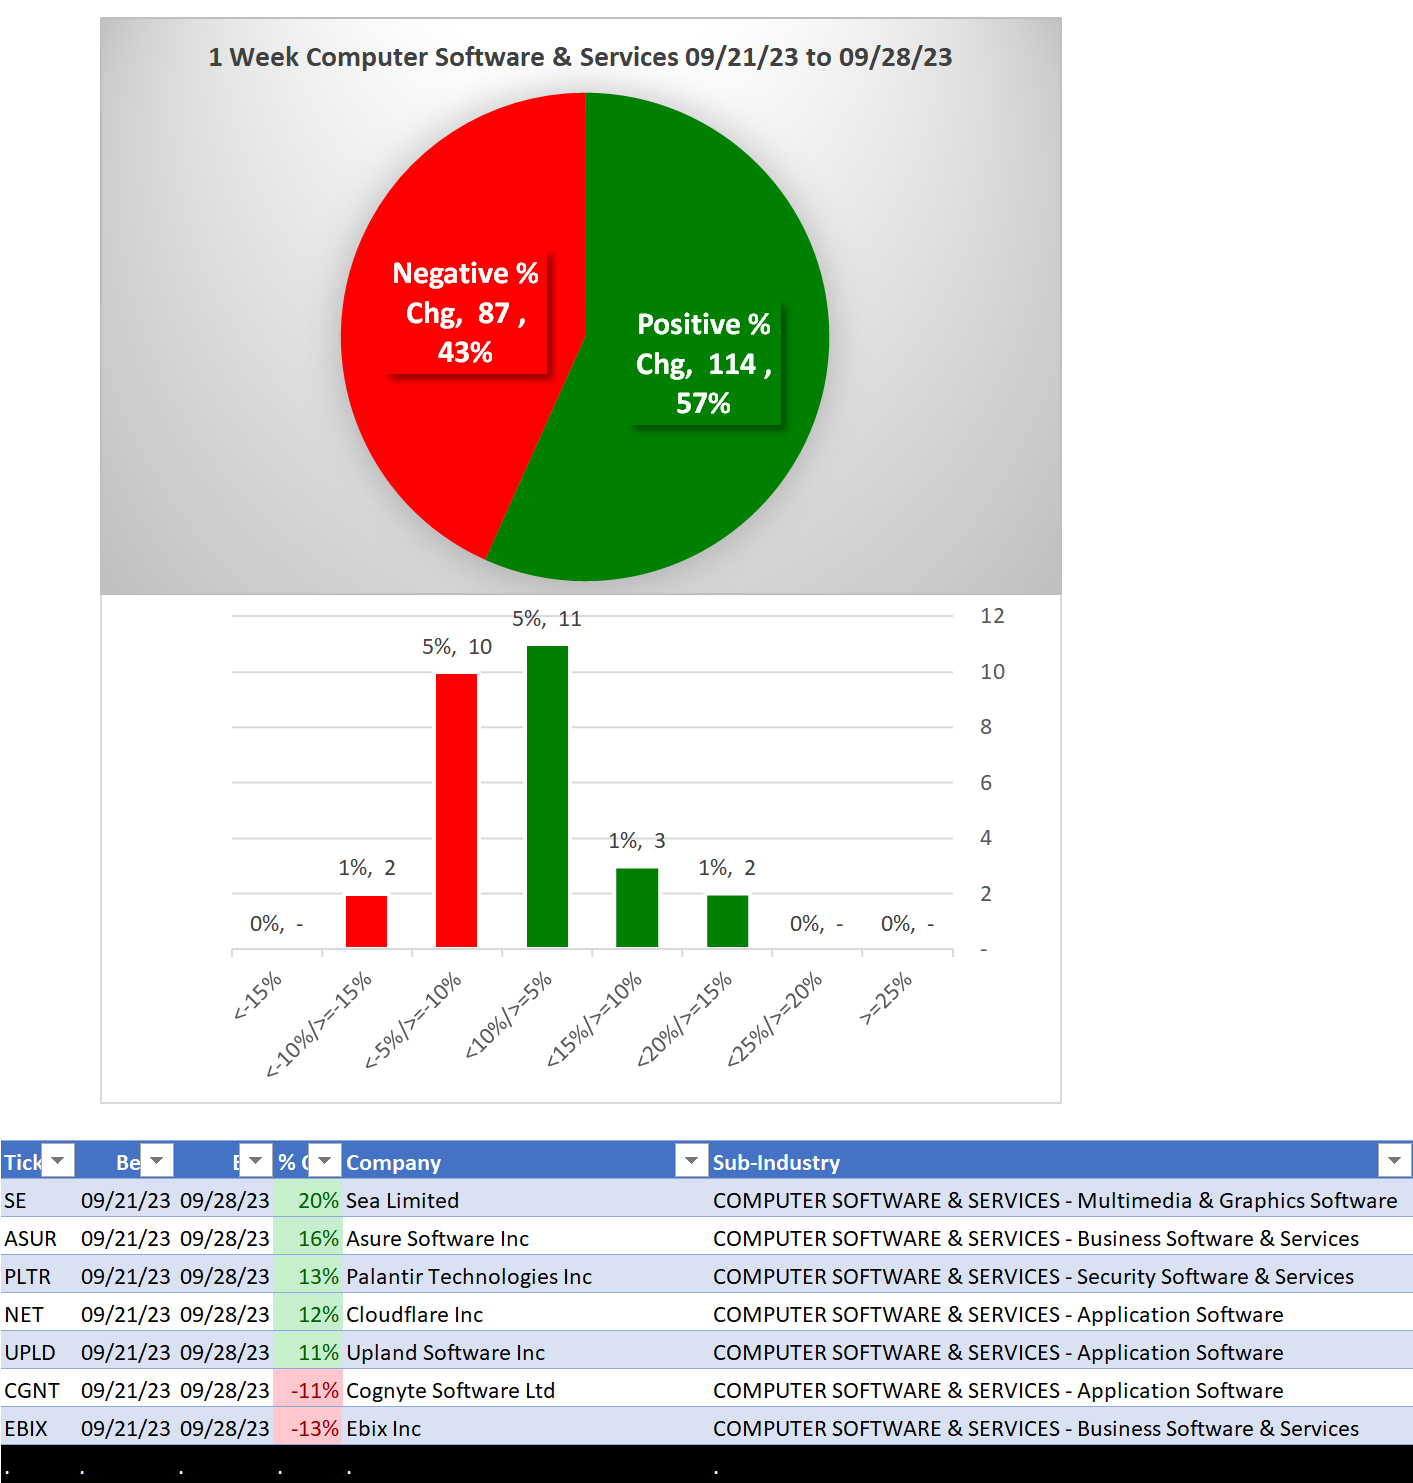
1A. Performance
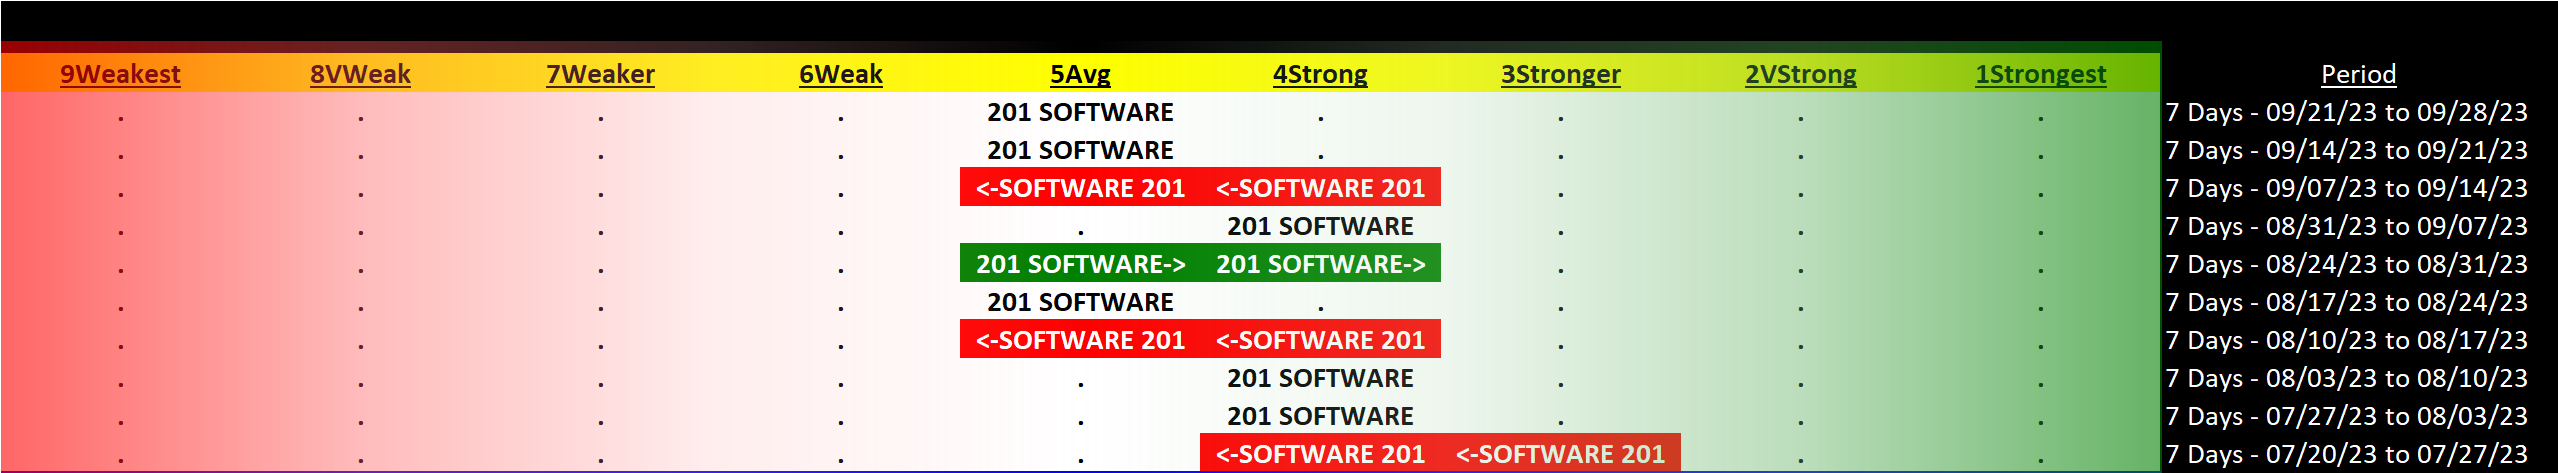
Past 10 Weeks Strengthening/Weakening week-by-week, per the following chart:
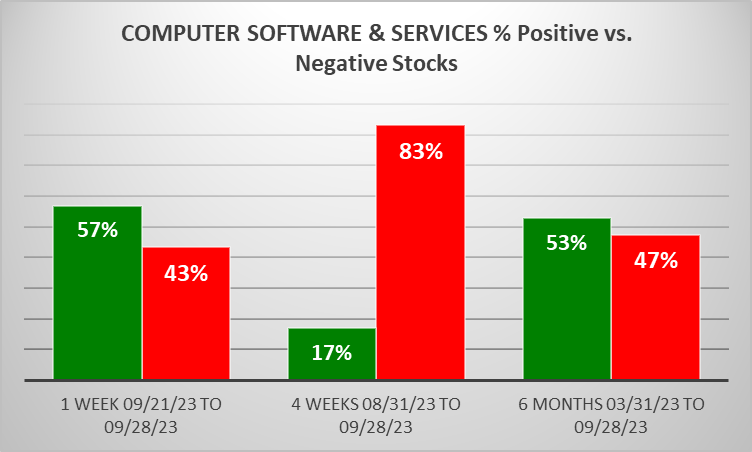
STRENGTHENING 1 Week vs. Mid- and Longer-Term // 1 week positive/negative stocks ratio is HIGHER than both 4 weeks and 6 Months, per the following chart:
1B. Background
Largest of 8 sub-industries (201 stocks, average 25):
- Application Software (94 stocks)
- Business Software & Services (48 stocks)
- Information Technology Services (25 stocks)
Top 10 by Market Capitalization:
MSFT/Microsoft Corp, ORCL/Oracle Corp, ADBE/Adobe Systems Inc, CRM/Salesforce Inc, ACN/Accenture Ltd, INTU/Intuit Inc, IBM/International Business Machines Corporation, NOW/ServiceNow Inc, ADP/Automatic Data Processing Inc, UBER/Uber Technologies
2. SUB-INDUSTRIES AND STOCKS DETAIL
2A. Sub-Industries Overview
Strengthened: 0/8 sub-industries
Weakened: 0/8 sub-industries
STRONGEST at Strong rating/4th strongest of 9 levels:
- Information & Delivery Service (5 stocks)
WEAKEST at Weak rating/6th strongest of 9 levels:
- Business Software & Services (48 stocks)
- Healthcare Information Service (8 stocks)
- Multimedia & Graphics Software (7 stocks)
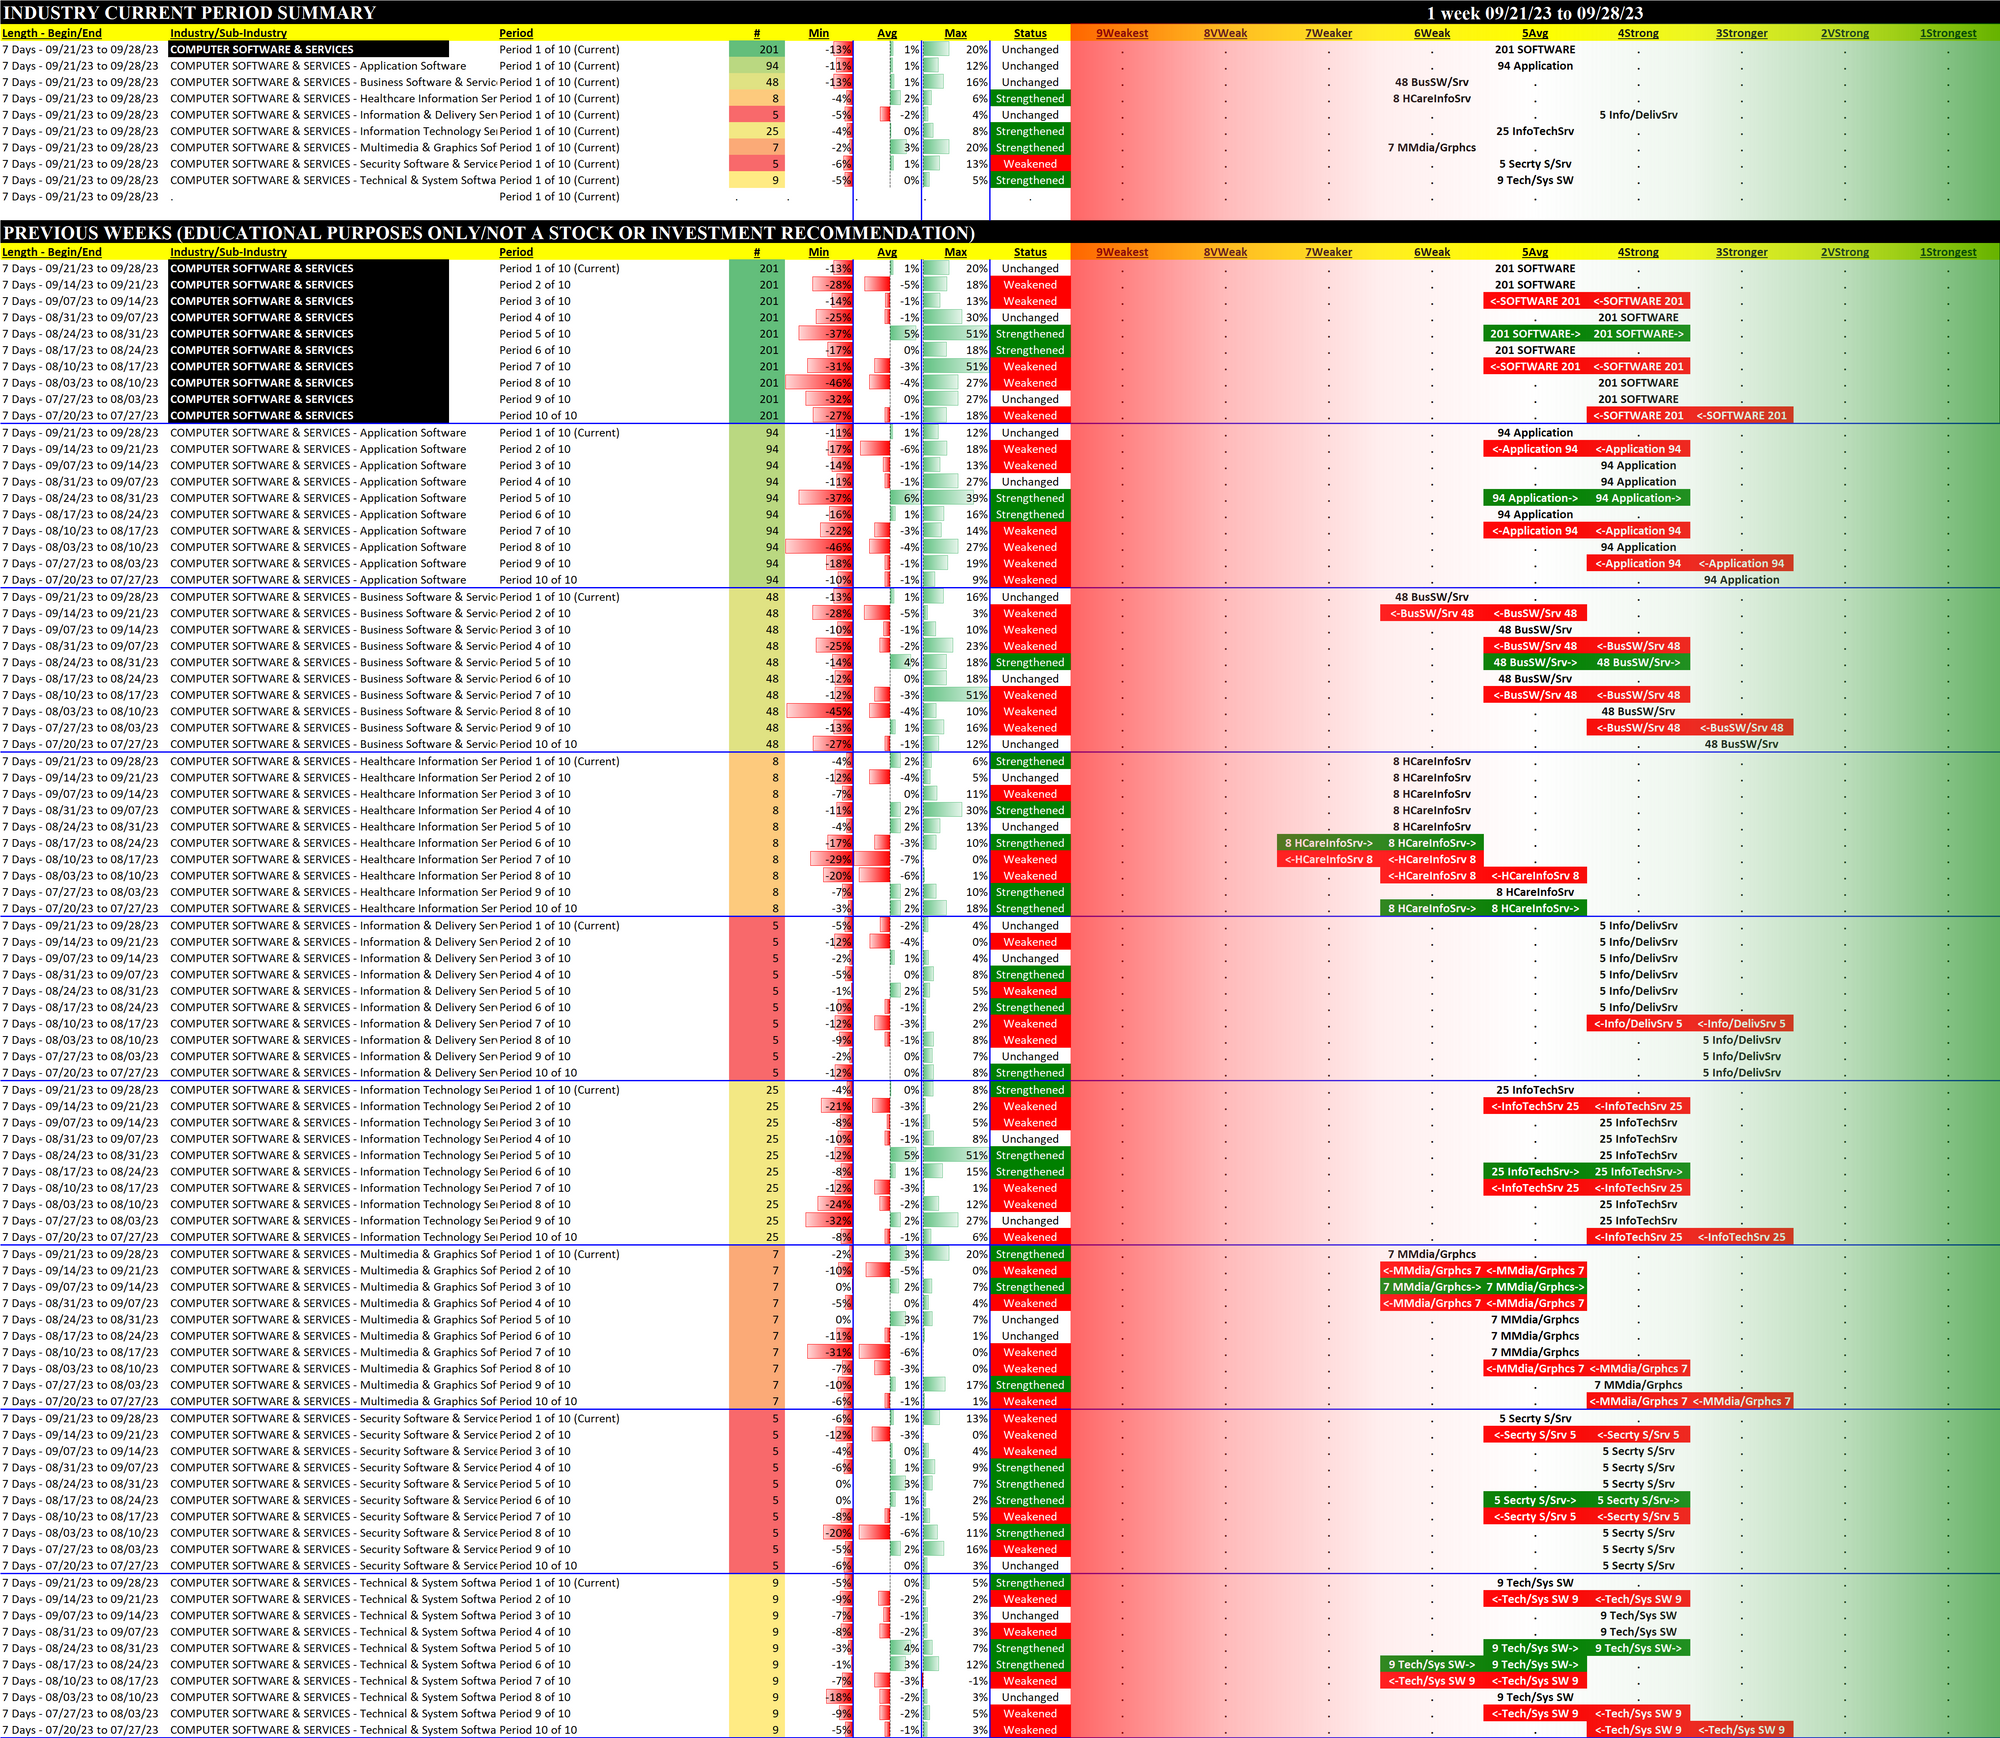
2B. Sub-Industries 10-Week Strengthening Analysis
What: recent week-by-week strength changes for the industry and each underlying sub-industry
Why: objective measurement of strengthening and weakening enabling comparison within and across industries and sub-industries
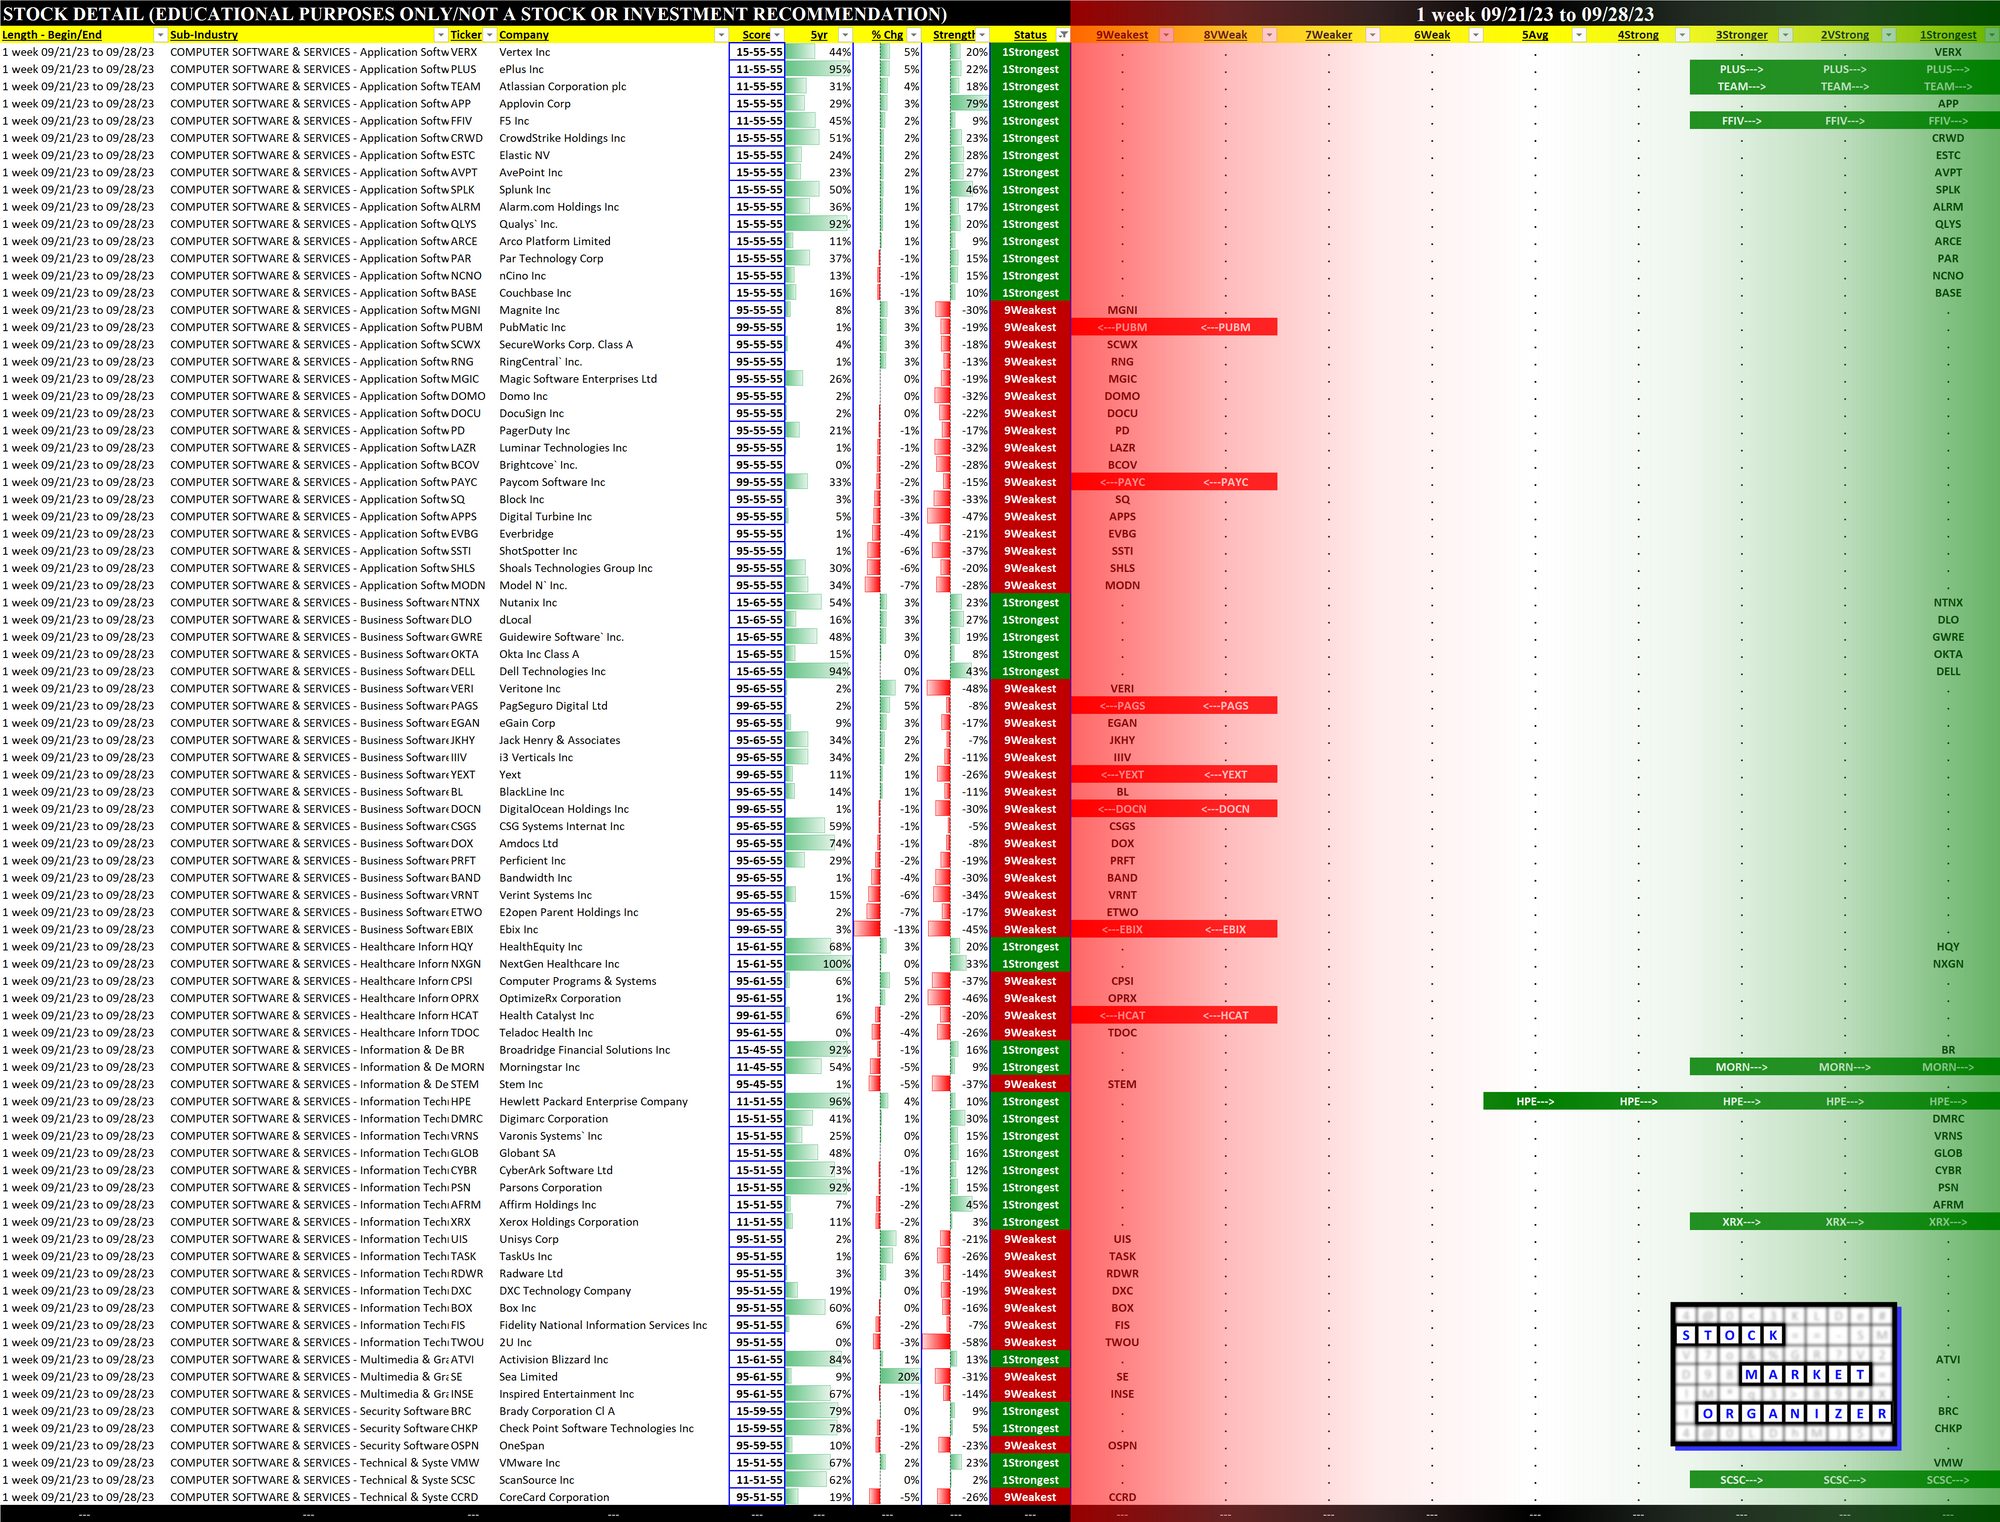
2C. Stocks 1 Week Strongest and Weakest
What: stocks currently rated Strongest/Weakest (highest/lowest of 9 strength ratings)
Why: most interesting stocks for available capital because
- the Strongest have the least amount of overhead supply to dampen breakouts while
- the Weakest may be prone to volatility, subject to big pops from bottom-fishing and short-covering BUT ALSO to bigger and faster falls.
(Not guaranteed and not a recommendation - weak stocks in weakening sub-industries may be better shorts than high-flyers.)
3. STRENGTH BY LOOKBACK PERIOD (with Best/Worst stocks)
3A. Lookback 6 Months
3B. Lookback 4 weeks
3C. Lookback 1 Week