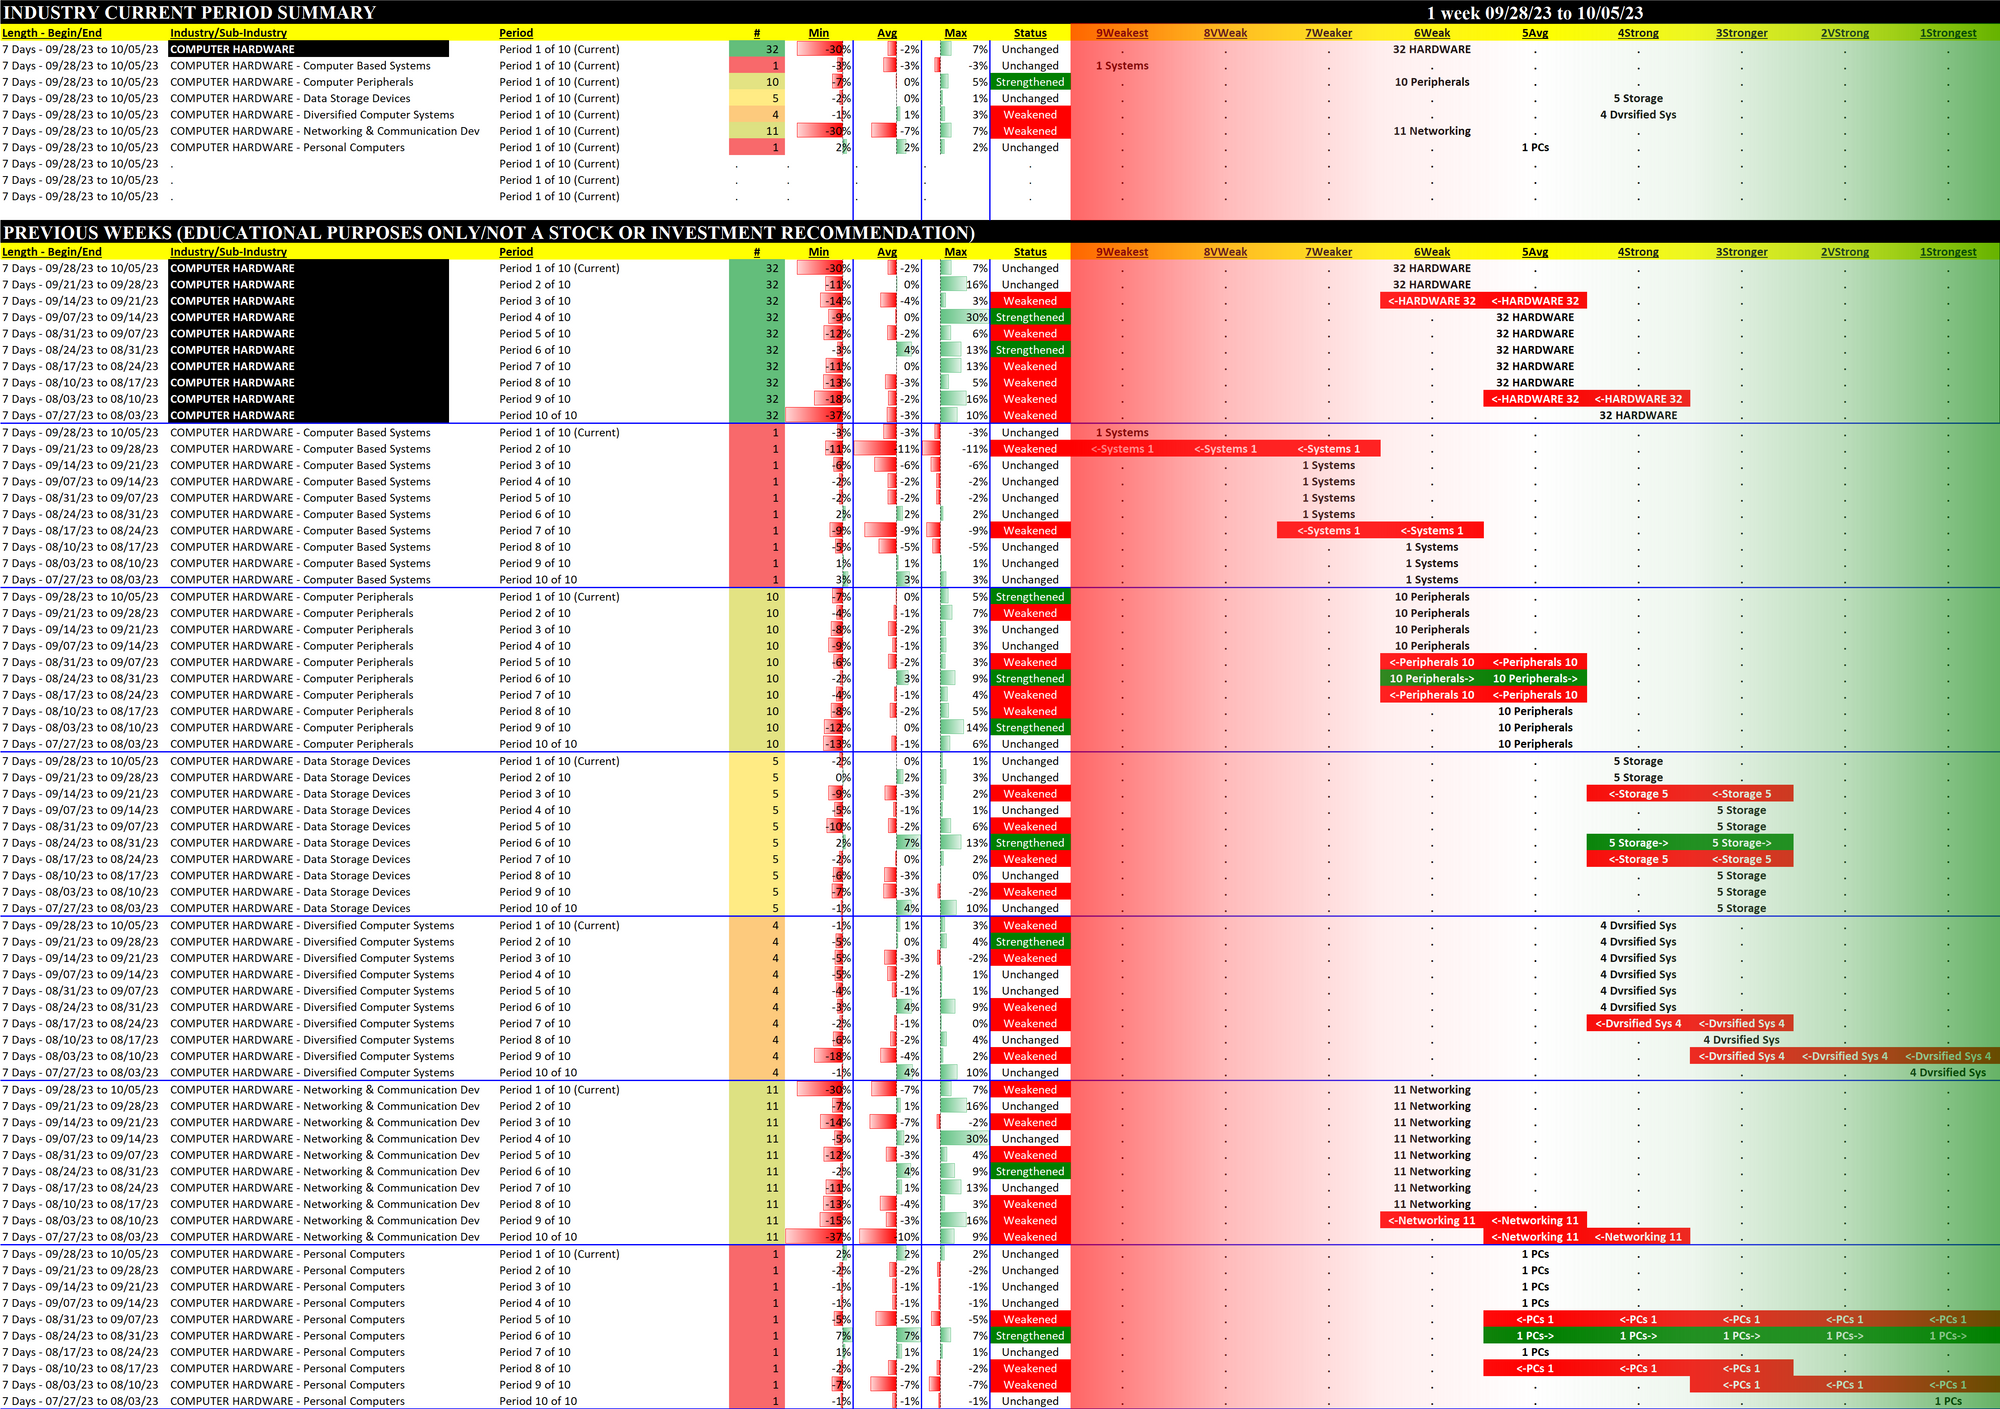
Computer Hardware 2023-10-05: Unchanged at WEAK strength rating (6th strongest of 9 levels), previous move was DOWN
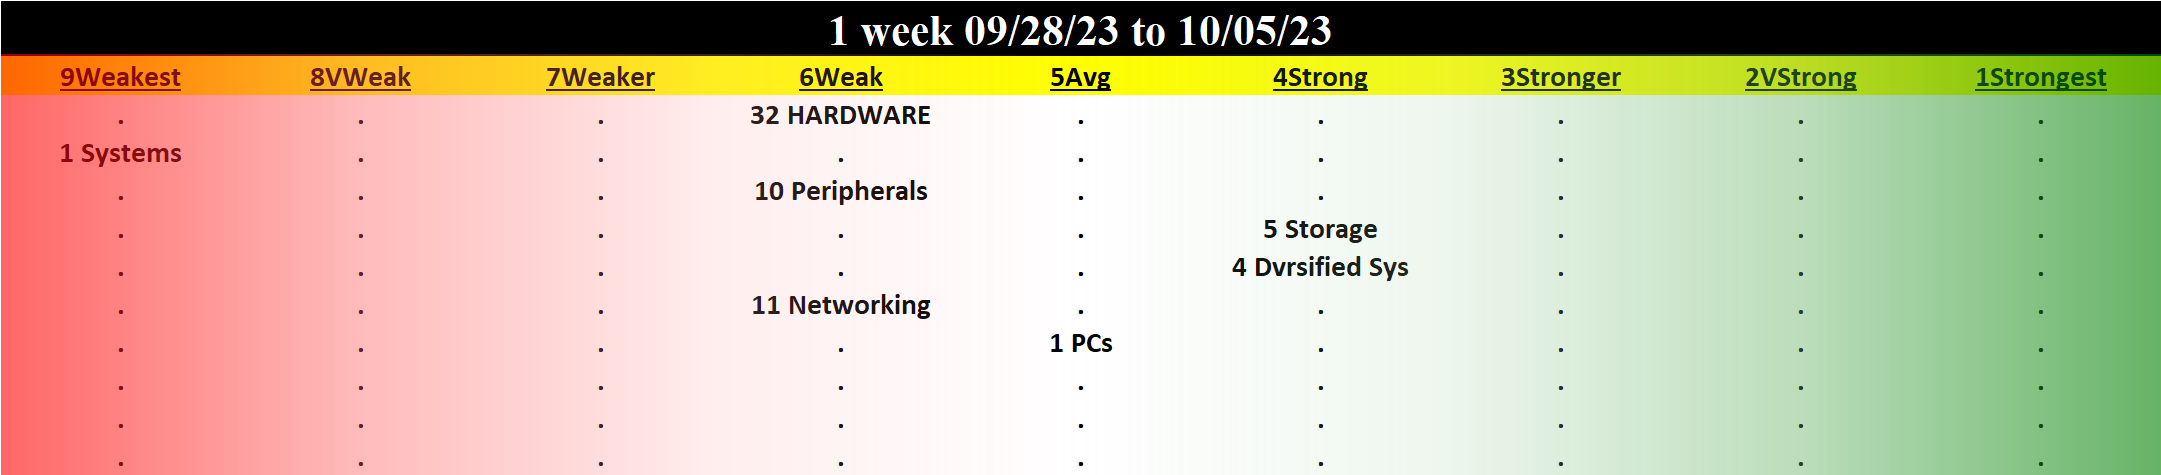
TABLE OF CONTENTS
- INDUSTRY OVERVIEW
1A. Performance
1B. Background - SUB-INDUSTRIES AND STOCKS DETAIL
2A. Sub-Industries Overview
2B. Sub-Industries 10-Week Strengthening Analysis
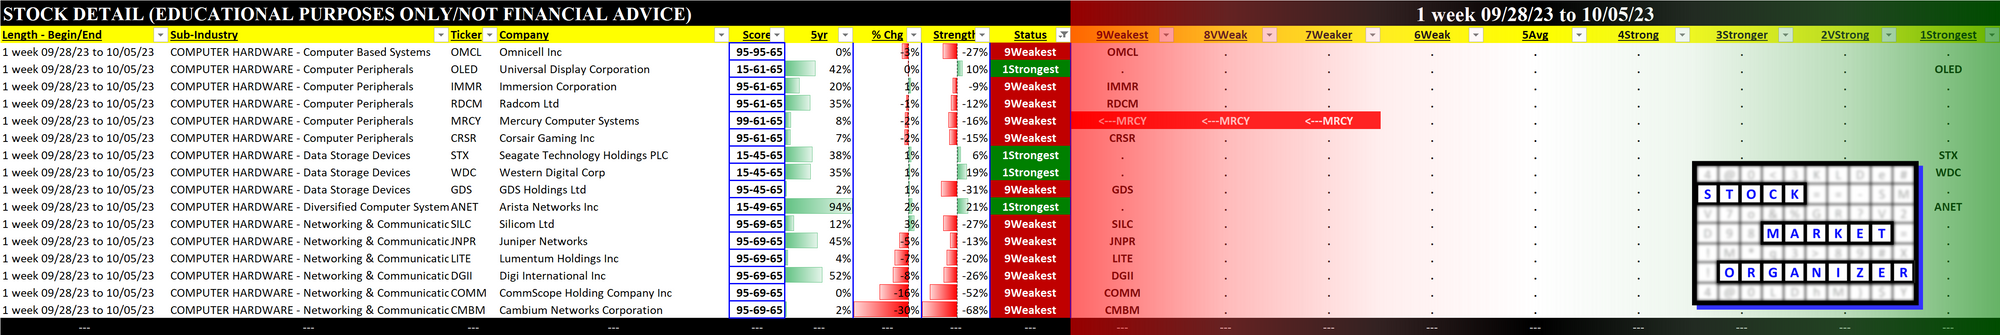
2C. Stocks 1 Week Strongest and Weakest - STRENGTH BY LOOKBACK PERIOD (with Best/Worst stocks)
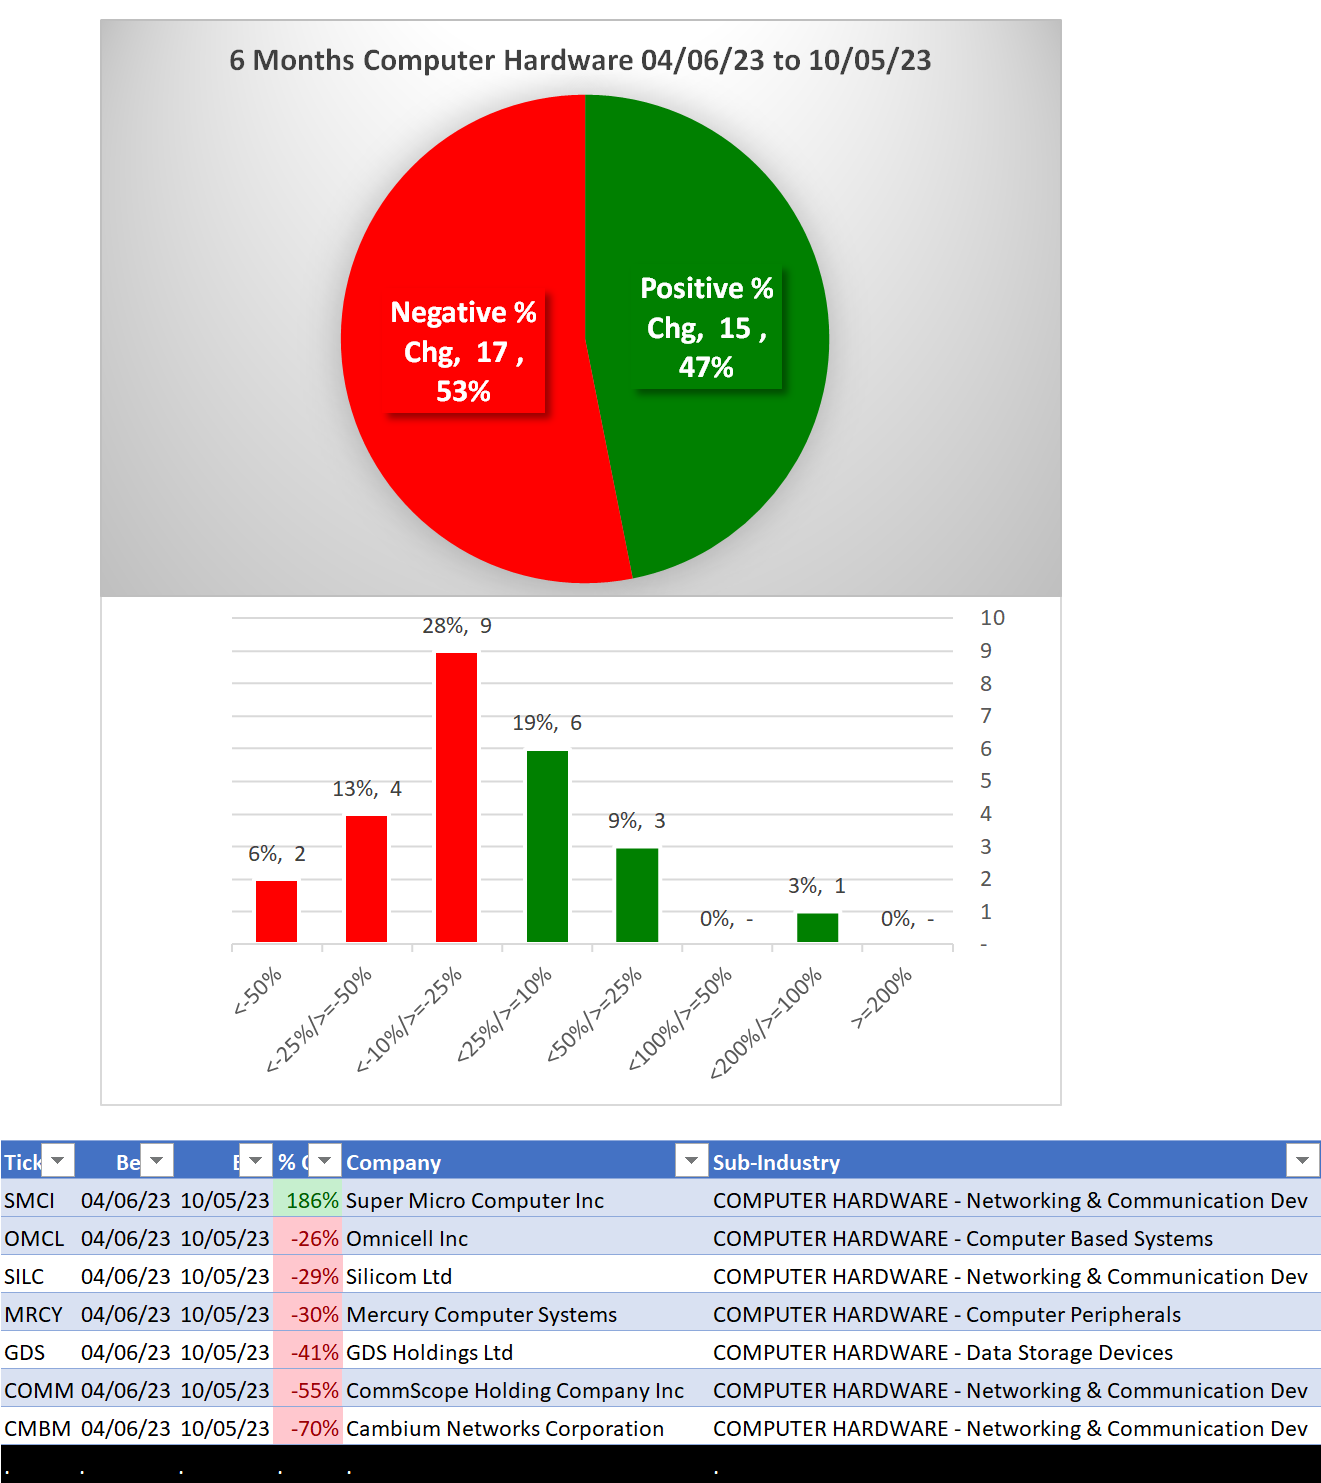
3A. Lookback 6 Months
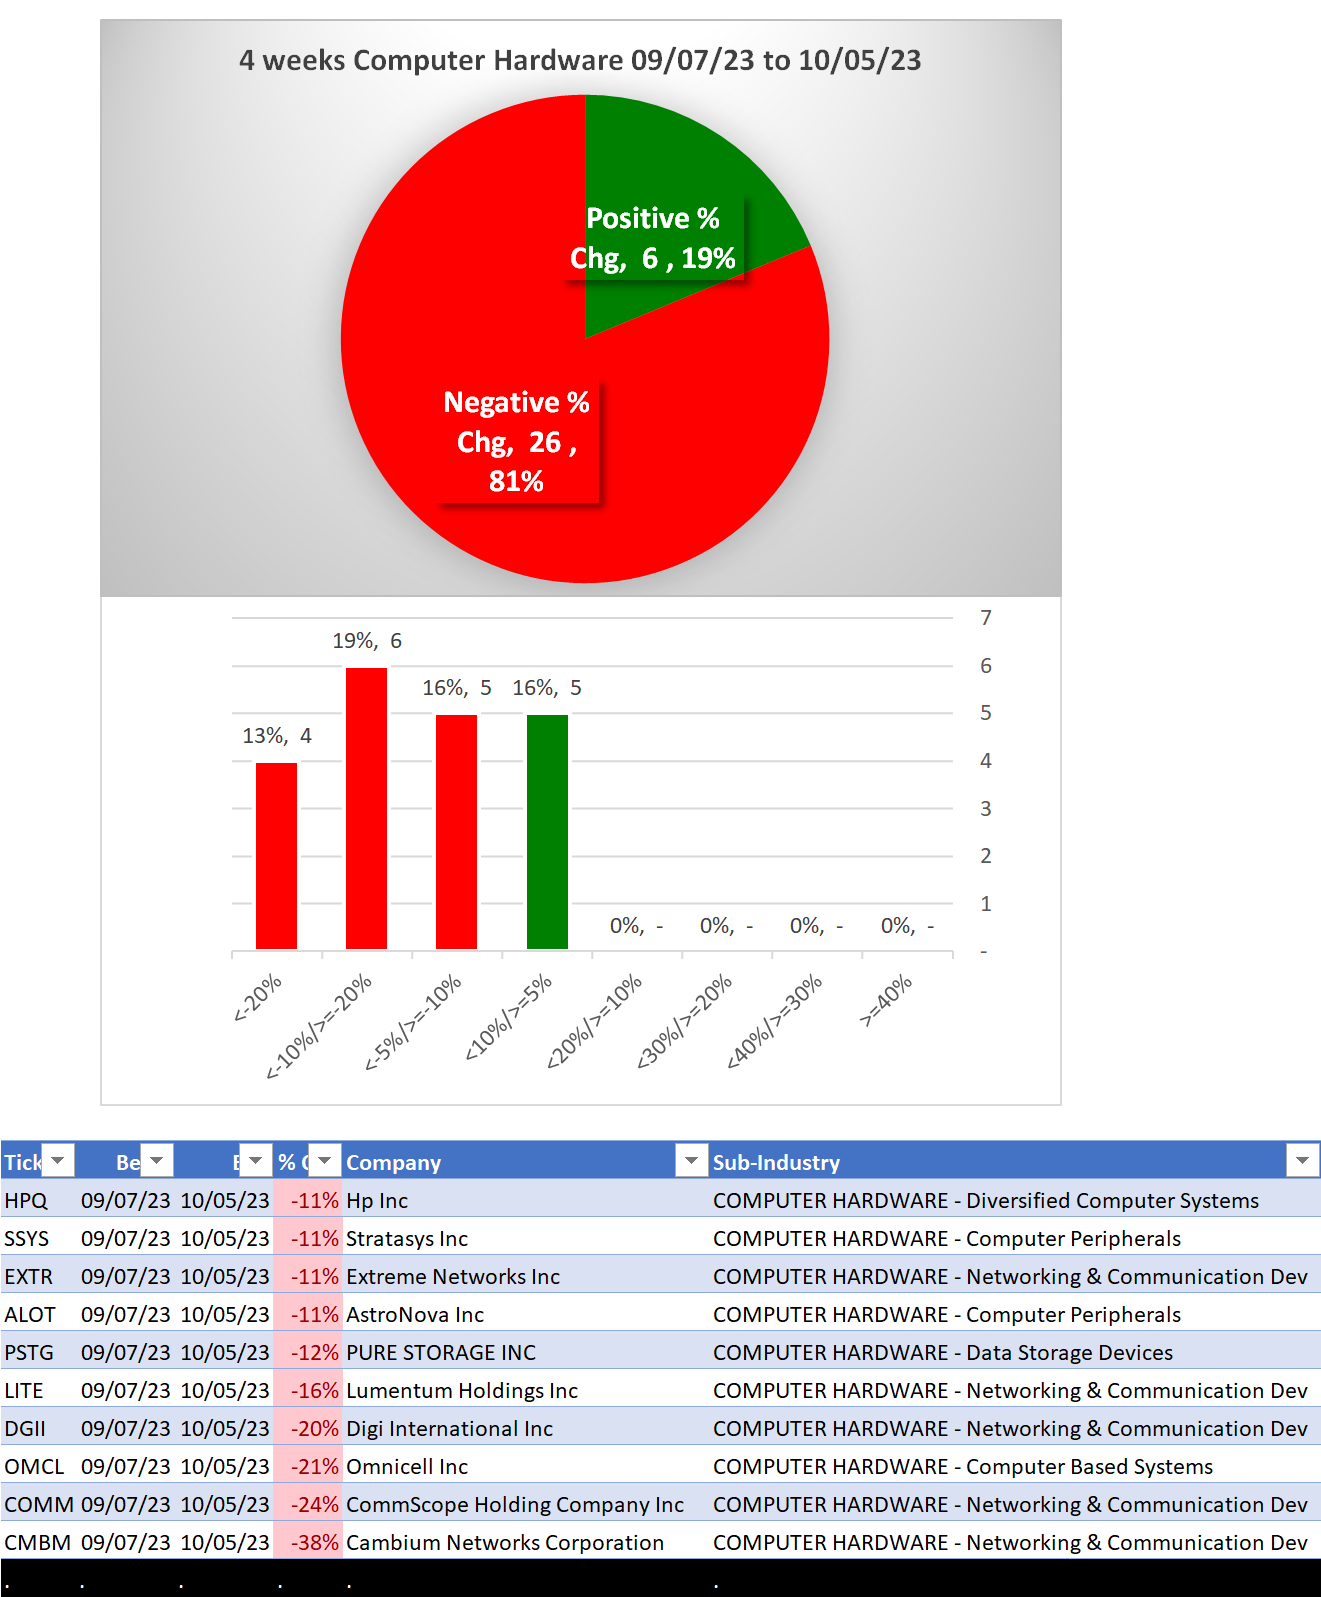
3B. Lookback 4 weeks
3C. Lookback 1 Week
1. INDUSTRY OVERVIEW
1A. Performance
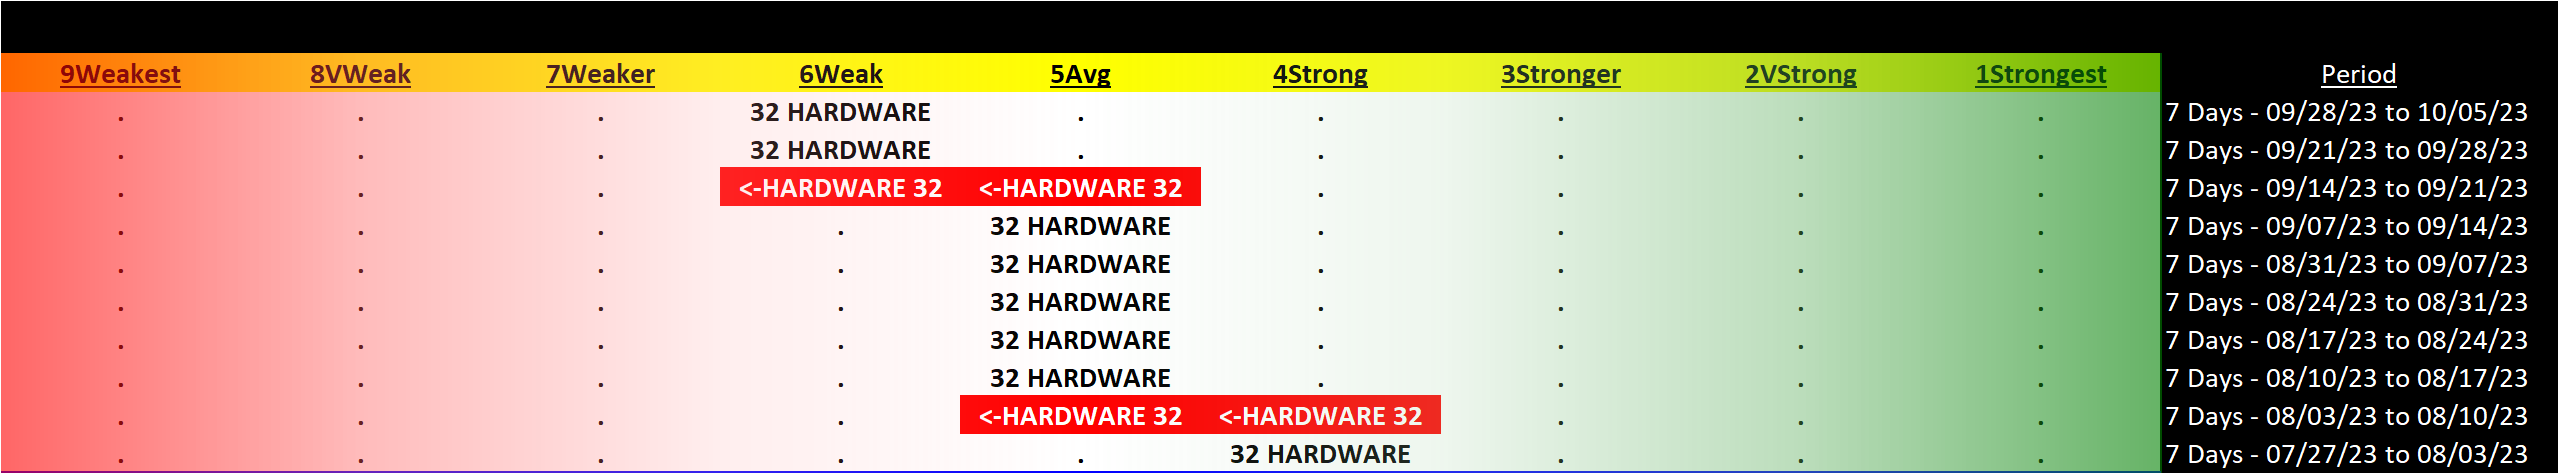
Past 10 Weeks Strengthening/Weakening week-by-week, per the following chart:
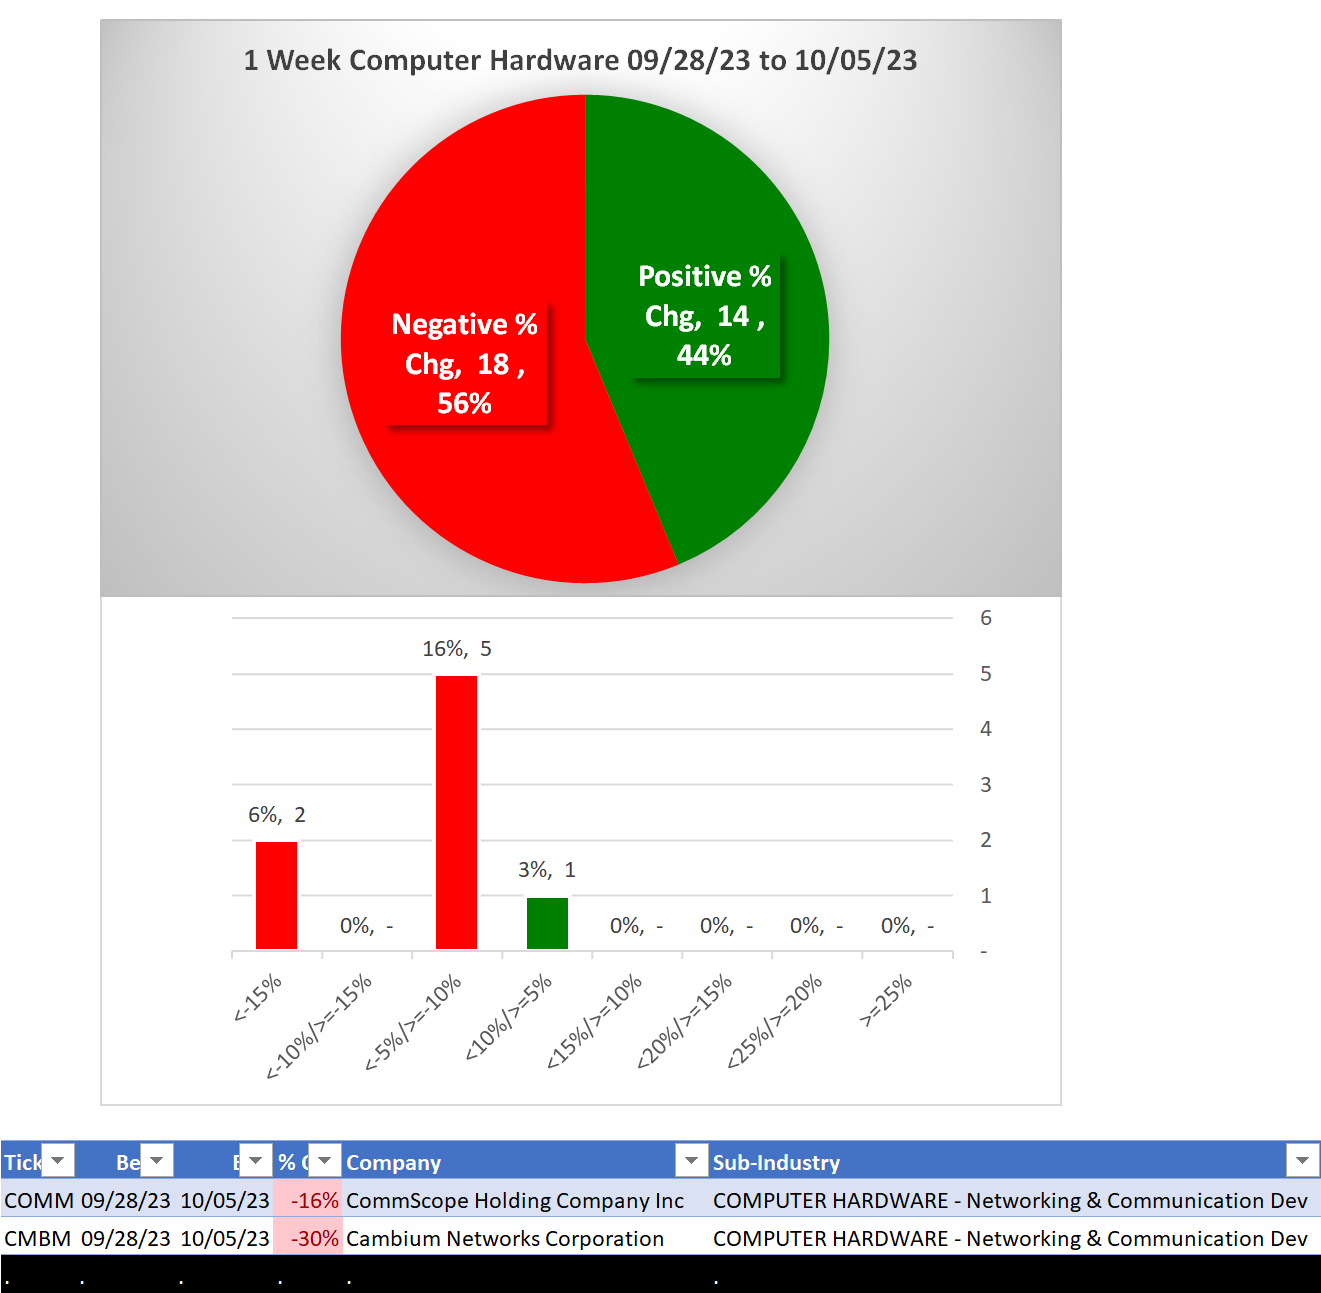
Mixed/STRENGTHENING 1 Week vs. Mid- and Longer-Term // 1 week positive/negative stocks ratio is HIGHER than 4 weeks but LOWER than 6 Months, per the following chart:
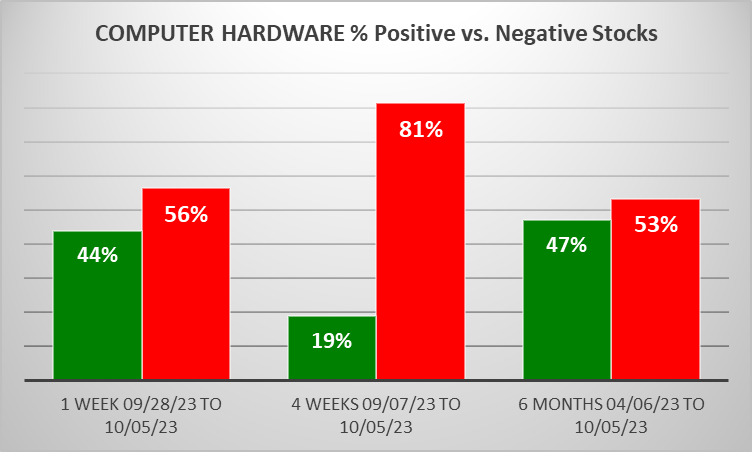
Comments:
- 38% of stocks are rated Weakest.
- 4 weeks, 31% of stocks were down more than -10%.
1B. Background
Largest of 6 sub-industries (32 stocks, average 5):
- Networking & Communication Dev (11 stocks)
- Computer Peripherals (10 stocks)
Top 10 by Market Capitalization:
AAPL/Apple Inc, CSCO/Cisco Systems Inc, PANW/Palo Alto Networks` Inc., ANET/Arista Networks Inc, CDW/CDW Corporation, HPQ/Hp Inc, NTAP/Netapp Inc, SMCI/Super Micro Computer Inc, WDC/Western Digital Corp, STX/Seagate Technology Holdings PLC
2. SUB-INDUSTRIES AND STOCKS DETAIL
2A. Sub-Industries Overview
Strengthened: 0/6 sub-industries
Weakened: 0/6 sub-industries
STRONGEST at Strong rating/4th strongest of 9 levels:
- Data Storage Devices (5 stocks)
- Diversified Computer Systems (4 stocks)
WEAKEST at Weakest rating/9th strongest of 9 levels:
- Computer Based Systems (1 stocks)
- Computer Peripherals (10 stocks) (more than 1 stock)
- Networking & Communication Dev (11 stocks) (more than 1 stock)
2B. Sub-Industries 10-Week Strengthening Analysis
What: recent week-by-week strength changes for the industry and each underlying sub-industry
Why: objective measurement of strengthening and weakening enabling comparison within and across industries and sub-industries
2C. Stocks 1 Week Strongest and Weakest
What: stocks currently rated Strongest/Weakest (highest/lowest of 9 strength ratings)
Why: most interesting stocks for available capital because
- the Strongest have the least amount of overhead supply to dampen breakouts while
- the Weakest may be prone to volatility, subject to big pops from bottom-fishing and short-covering BUT ALSO to bigger and faster falls.
(Not guaranteed and not a recommendation - weak stocks in weakening sub-industries may be better shorts than high-flyers.)
3. STRENGTH BY LOOKBACK PERIOD (with Best/Worst stocks)
3A. Lookback 6 Months
3B. Lookback 4 weeks
3C. Lookback 1 Week