Comparing disparate industries - how do YOU do it meaningfully? (2023-03-14 Automotive vs. Energy vs. others)
How about a break from bank stocks? We could all use one.
Let's assume you want to see where there are other areas in the market worth focusing on. How do you determine what areas are of interest?
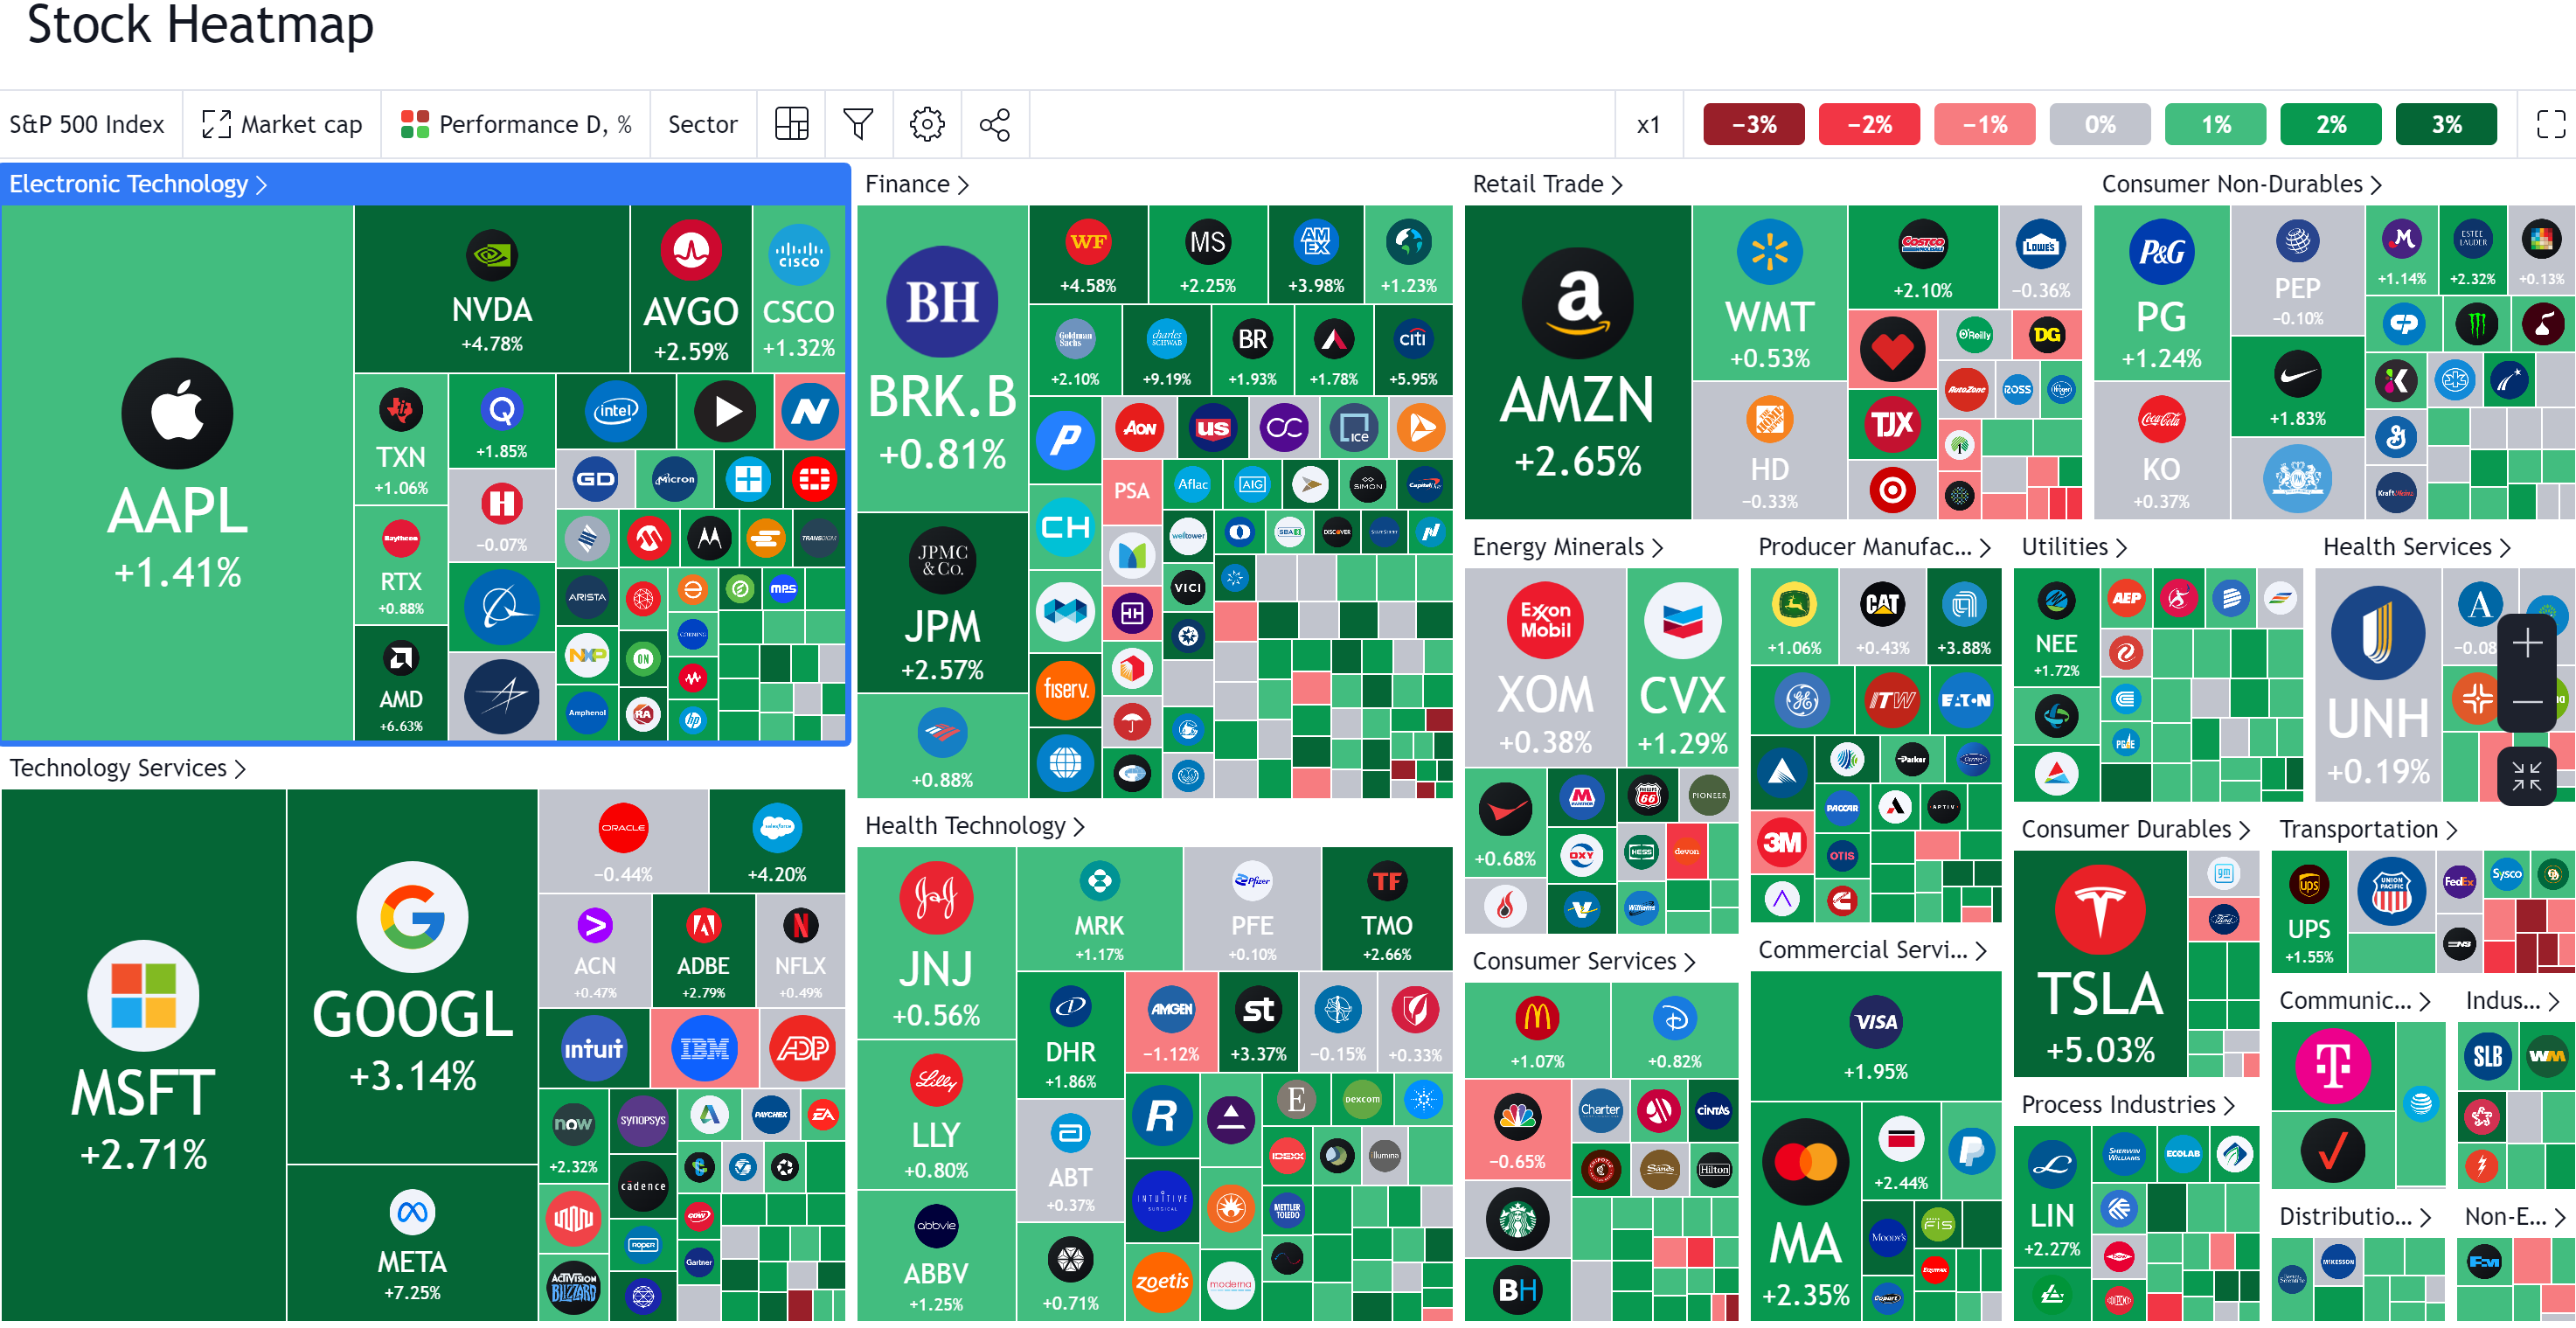
Some use "heat maps" that show comparative performance for stocks, segregated into sectors. One example is above, another is below which shows the detail screen that pops up for any individual stock (PepsiCo in this case):
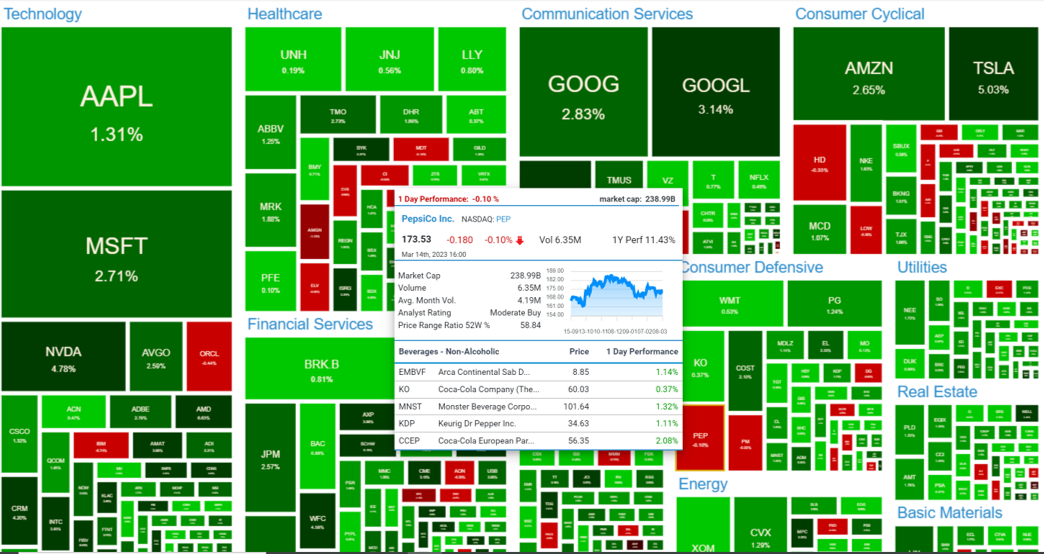
There is a lot of information here. But this is more than you need - my perspective, at least. And thus it dilutes the message and costs you time to wade through the less-important information.
A straight-to-the-point strong/strengthening and weak/weakening perspective
Heat maps may work for some as guideposts for areas of interest. Below is another possibility if you have any interest in looking at strengthening/weakening. This will be expanded upon in future posts (and is the same basic information as has been presented in previous posts) - in the meantime take a look at how this directly compares strengthening and weakening between four disparate industries.
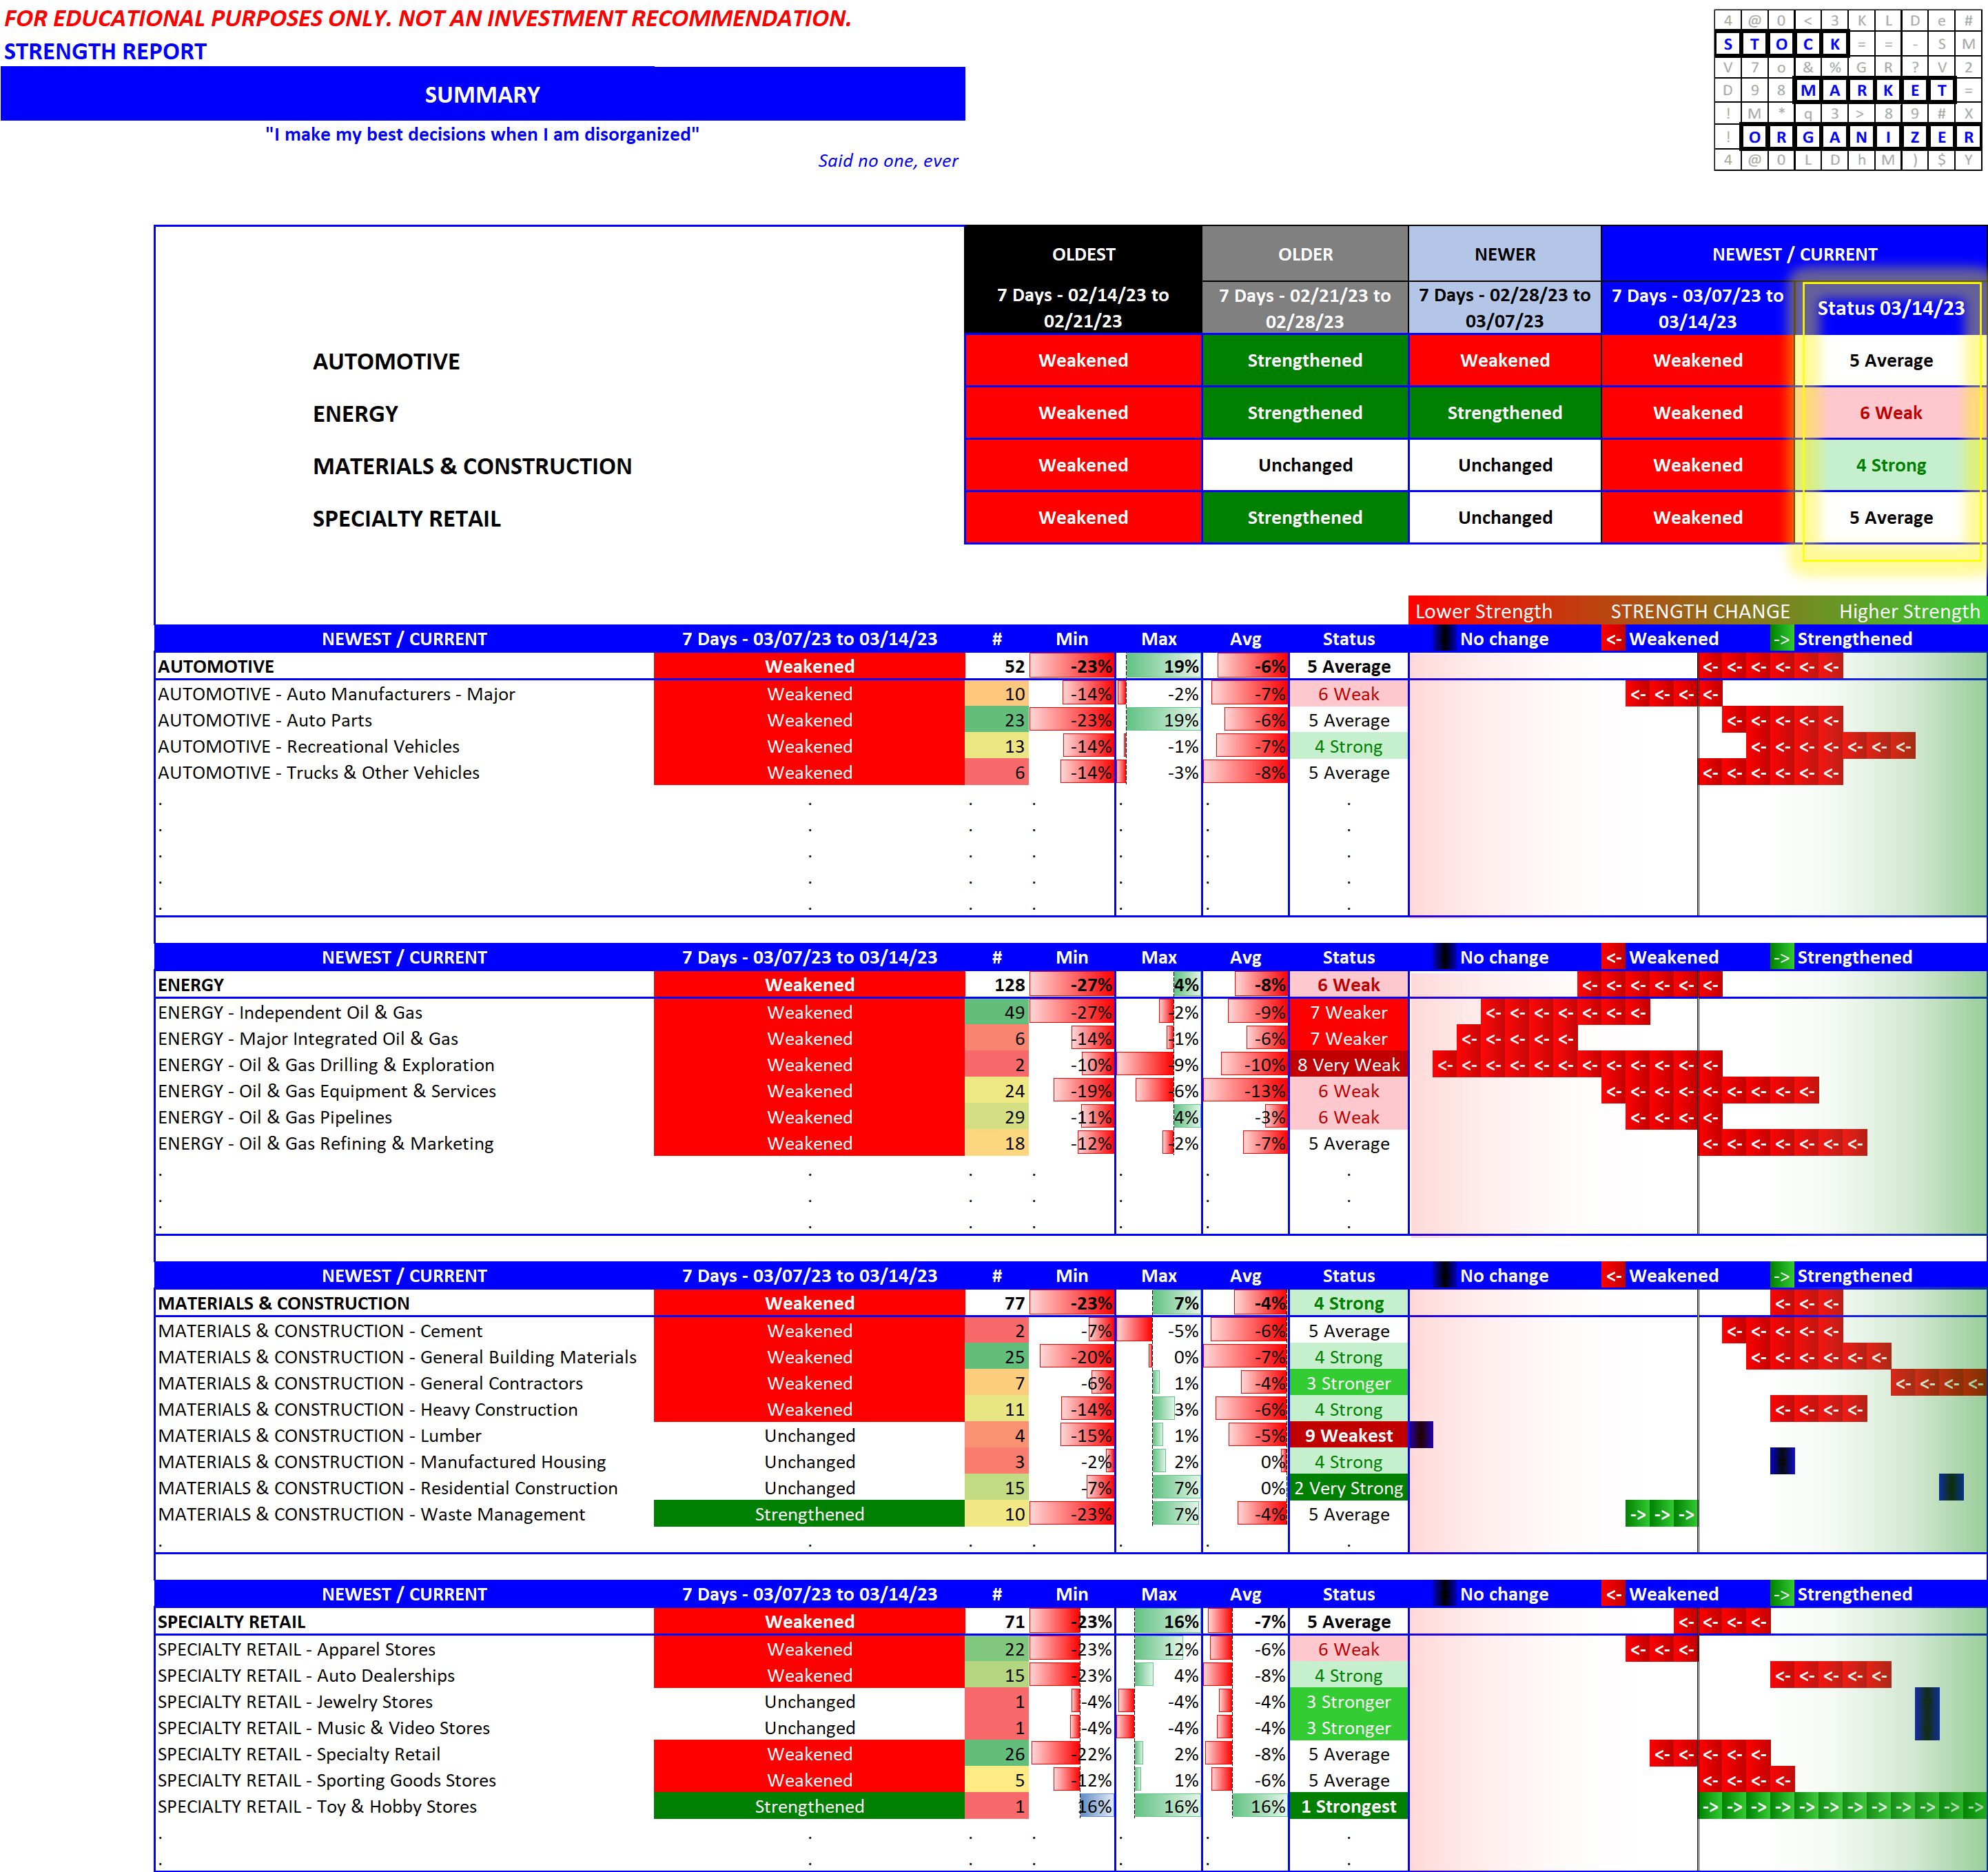
These are like watching movies rather than looking at snapshots. There are no opinions or interpretations, like determining what is an attractive set of growth rates or financial ratios for the price, or where to draw trend lines or support and resistance, or what indicators to overlay with whatever settings the user wants.
That's why my philosophy is to specialize in analyzing one action for many stocks instead of many traits for a few stocks, as summarized in this graphic:

Downloadable reports
Detailed reports for each of the above are downloadable at the following links. This first one directly compares the past four weeks action for the four industries:
The following are detailed stock-by-stock reports for each industry.
Automotive: curious where TSLA stands among Major Automotive Manufacturers?
Energy: what impact are oil price changes having on these stocks, and their comparative strength to other industries?
Materials and Construction: how are homebuilders doing? Take a guess then look. Surprised?
Specialty Retail: any pockets of strength here, or surprise standouts (either strong/strengthening or weak/weakening)?