Banking 2023-12-01: UP +1 to STRONG strength rating (4th strongest of 9 levels), previous move was also UP
Banking 6/9 sub-industries strengthened, 1- and 4-weeks >90% positive stocks.
Full details at downloadable file linked below.
What are you seeing here and why do you care? Partial listing:
🔹 An objective measurement of industry strengthening and weakening so you can objectively compare strength and weakness across/within industries and sub-industries.
🔹 A listing of stocks rated Strongest and Weakest (highest/lowest strength of 9 levels) by sub-industry, saving you significant time finding stocks that may be prone to making bigger moves faster. Stronger stocks have less overhead resistance, Weaker stocks are prone to “pops” from bargain hunting and short-covering yet due to preceding weakness are also prone to falling far and fast.
Details
🔹 13% Strongest Stocks, 3% Weakest Stocks.
🔹 Mixed/WEAKENING 1 Week vs. Mid- and Longer-Term // 1 week positive/negative stocks ratio is LOWER than 4 weeks but HIGHER than 3 Months (92%/94%/71% positive)
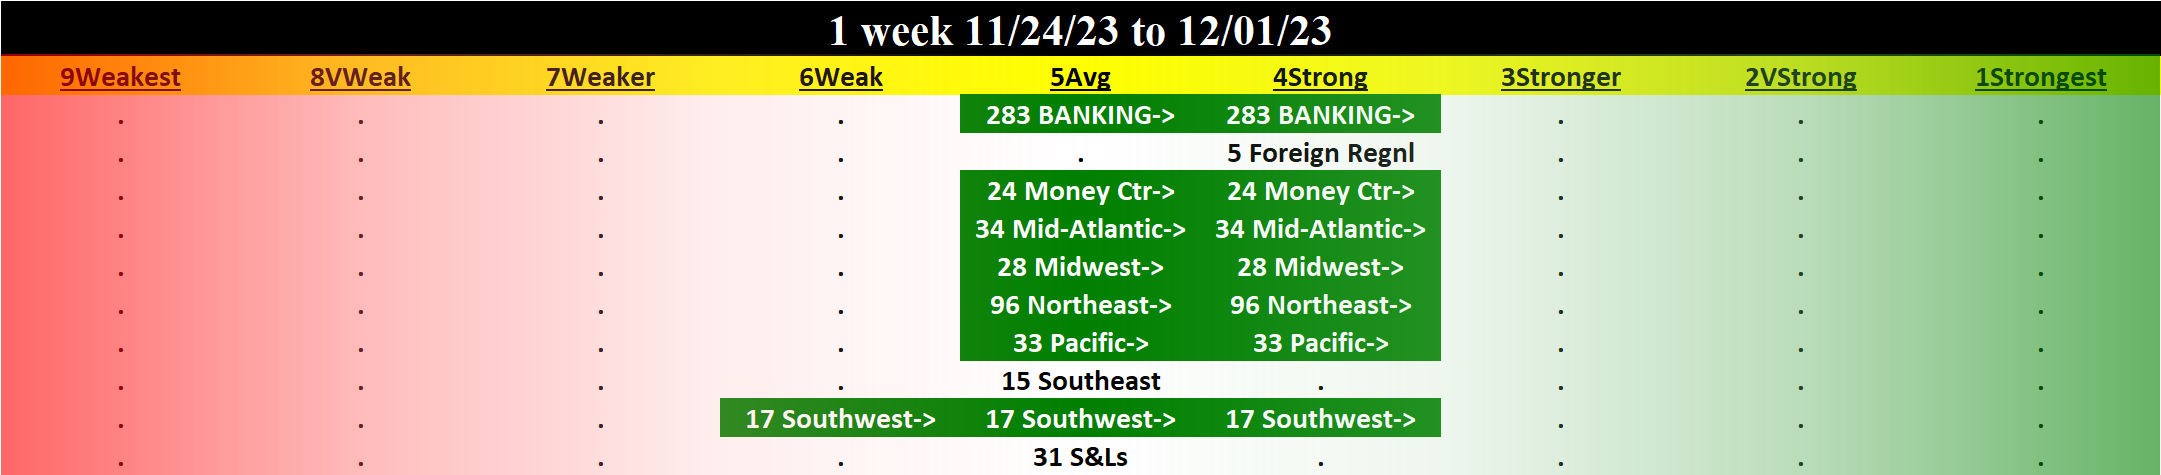
🔹 Sub-industry Overview:
STRONGEST at Strong rating/4th strongest of 9 levels:
- Foreign Regional Banks (5 stocks)
- Money Center Banks (24 stocks)
- Regional - Mid-Atlantic Banks (34 stocks)
- Regional - Midwest Banks (28 stocks)
- Regional - Northeast Banks (96 stocks)
- Regional - Pacific Banks (33 stocks)
WEAKEST at Average rating/5th strongest of 9 levels:
- Regional - Southeast Banks (15 stocks)
- Savings & Loans (31 stocks)
🔹 Lookback Periods Comparison:
3 Months: 4% stocks >+20% and 1% stocks <-20%.
___UP most:
AROW +51% (Northeast)
UNB +35% (Northeast)
CUBI +33% (Northeast)
HWBK +28% (Northeast)
CSTR +27% (Northeast)
___DOWN most:
HMST -26% (S&Ls)
TBNK -21% (Pacific)
PWOD -20% (Mid-Atlantic)
NYCB -19% (S&Ls)
FFWM -19% (Northeast)
4 weeks: 23% stocks >+10% and 0% stocks <-10%.
___UP most:
INBK +29% (Midwest)
HMST +20% (S&Ls)
MRBK +20% (Northeast)
RBB +19% (Northeast)
BKU +19% (Mid-Atlantic)
___DOWN most:
FGBI -9% (Southeast)
PACW -8% (Pacific)
CCBG -6% (Mid-Atlantic)
PWOD -4% (Mid-Atlantic)
FSFG -3% (Midwest)
1 Week: 5% stocks >+10% and 0% stocks <-10%.
___UP most:
HMST +23% (S&Ls)
FFWM +15% (Northeast)
INBK +15% (Midwest)
FITB +12% (Midwest)
BOH +12% (Pacific)
___DOWN most:
PACW -7% (Pacific)
FSFG -4% (Midwest)
FGBI -4% (Southeast)
MRBK -3% (Northeast)
FVCB -3% (Northeast)