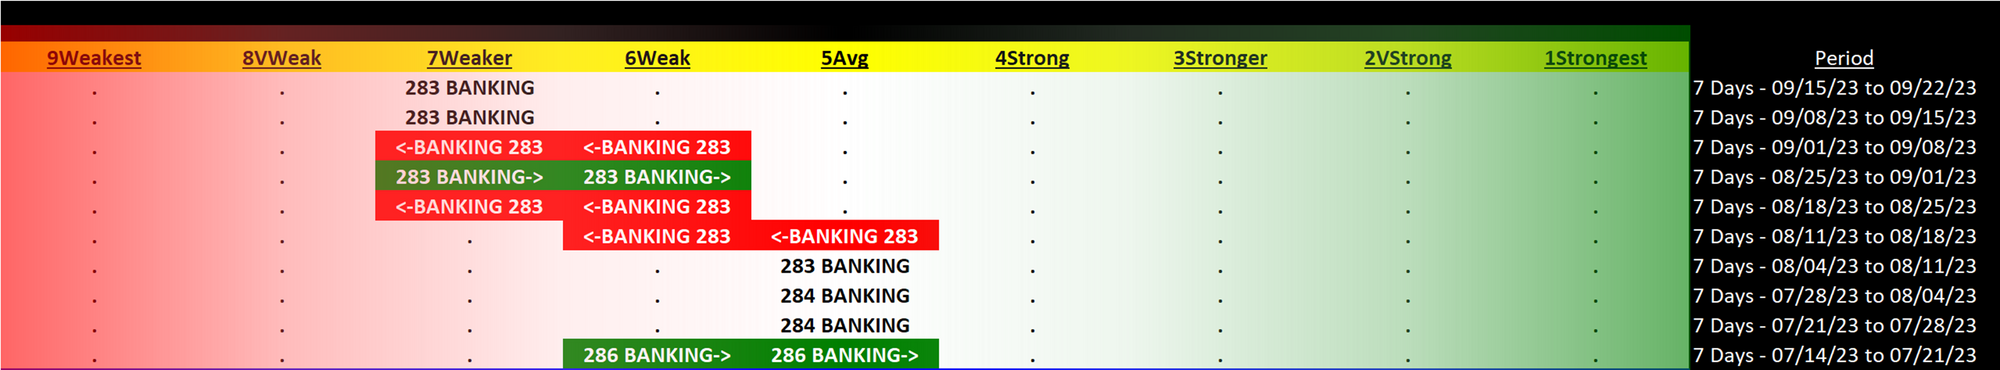
Banking 2023-09-22: Unchanged at WEAKER strength rating (7th strongest of 9 levels), previous move was DOWN
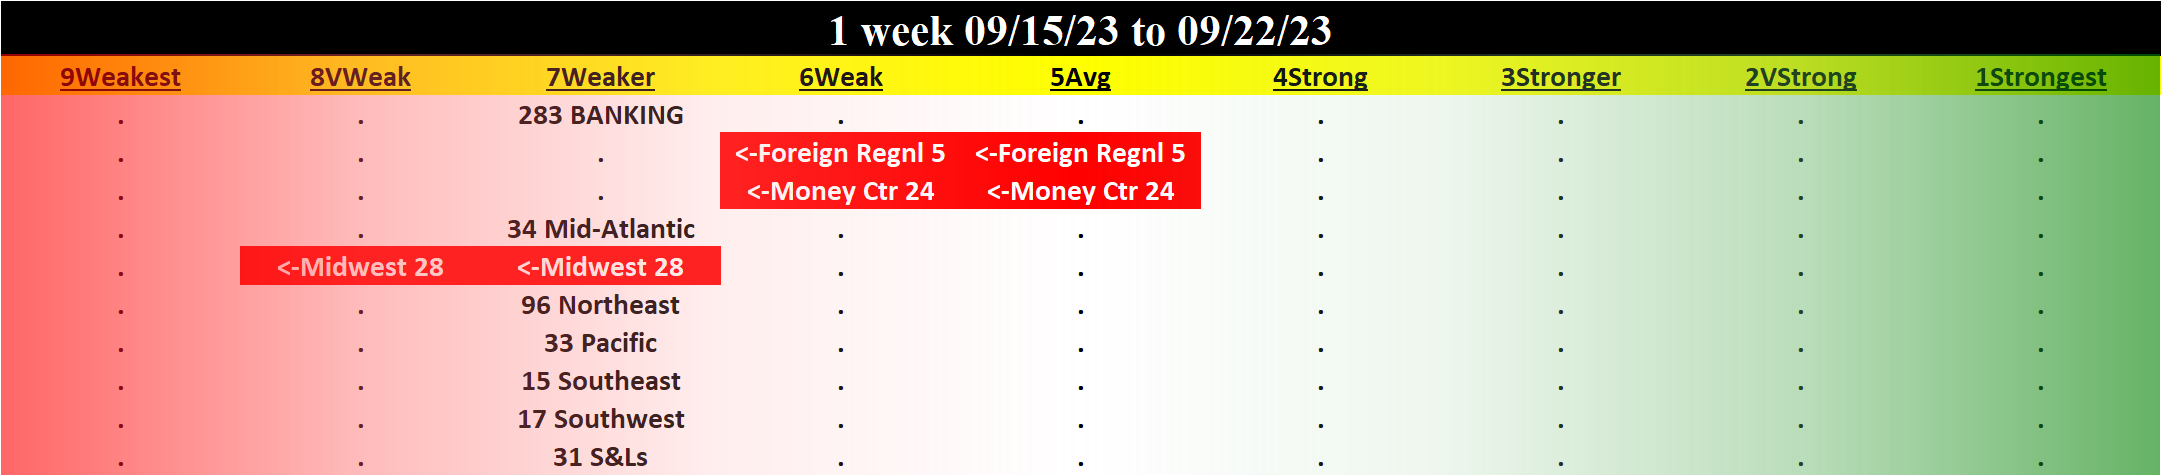
TABLE OF CONTENTS
- INDUSTRY OVERVIEW
1A. Performance
1B. Background - SUB-INDUSTRIES AND STOCKS DETAIL
2A. Sub-Industries Overview
2B. Sub-Industries 10-Week Strengthening Analysis
2C. Stocks 1 Week Strongest and Weakest - STRENGTH BY LOOKBACK PERIOD (with Best/Worst stocks)
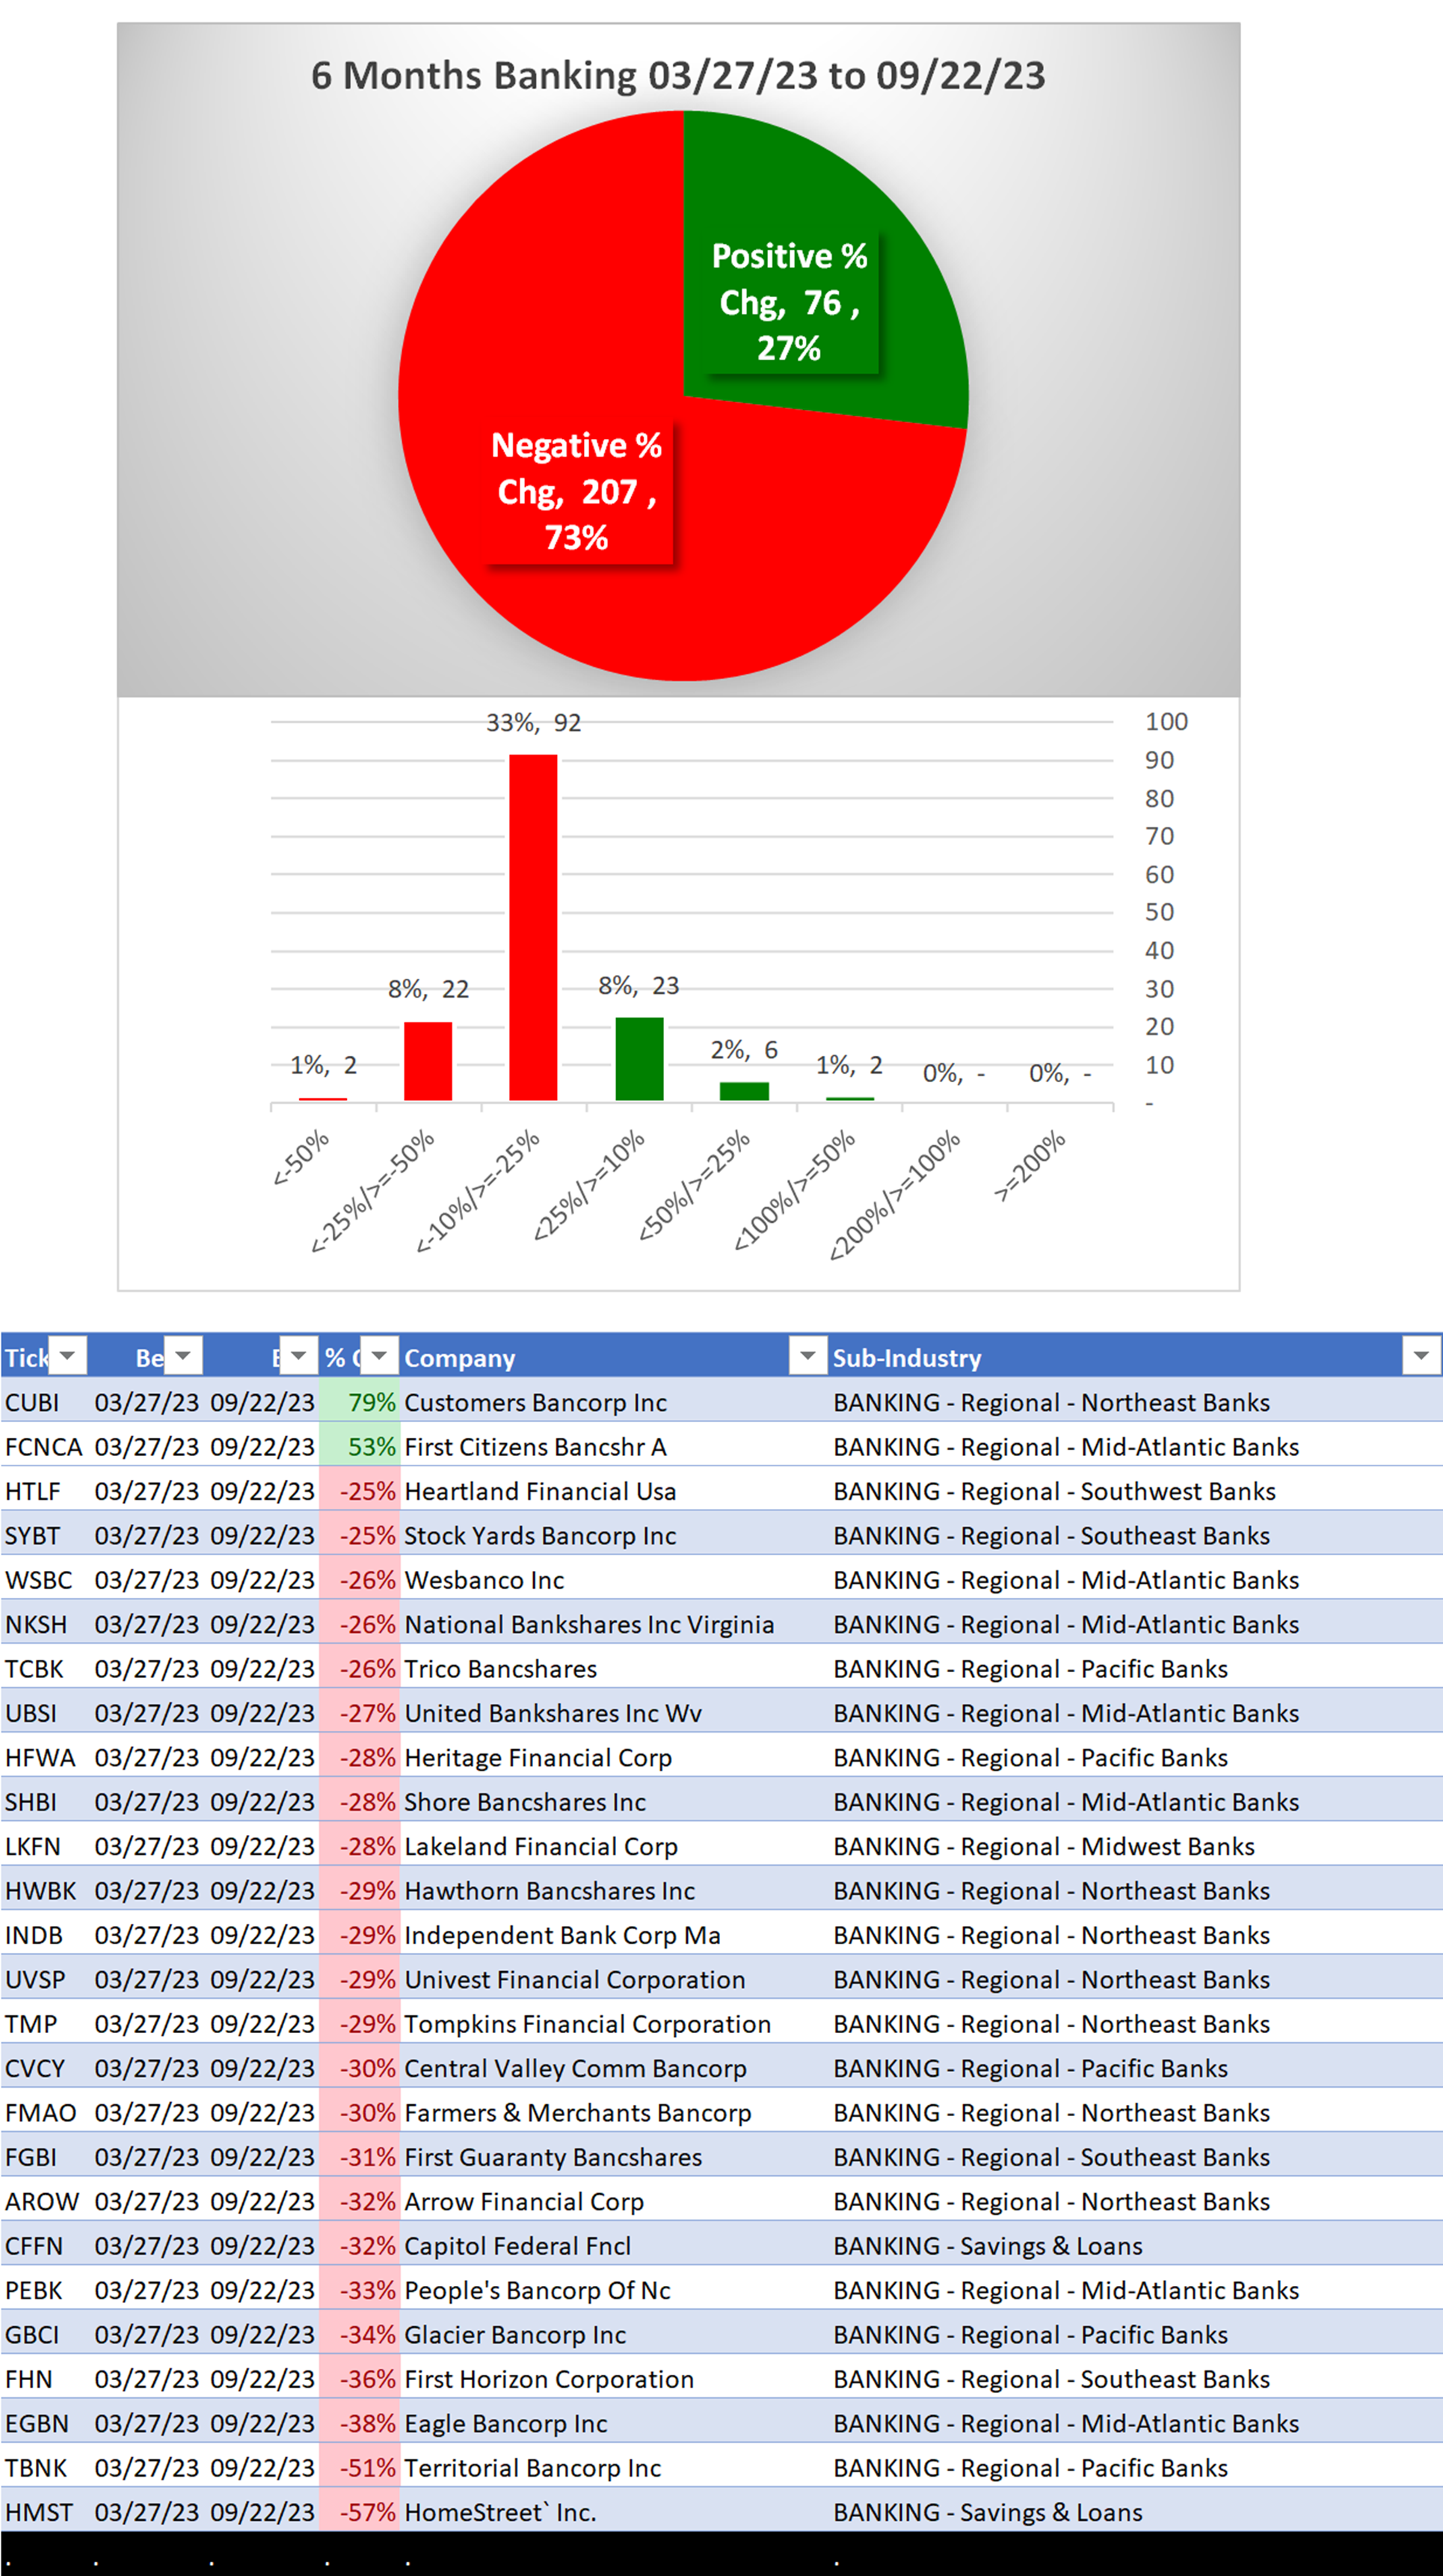
3A. Lookback 6 Months
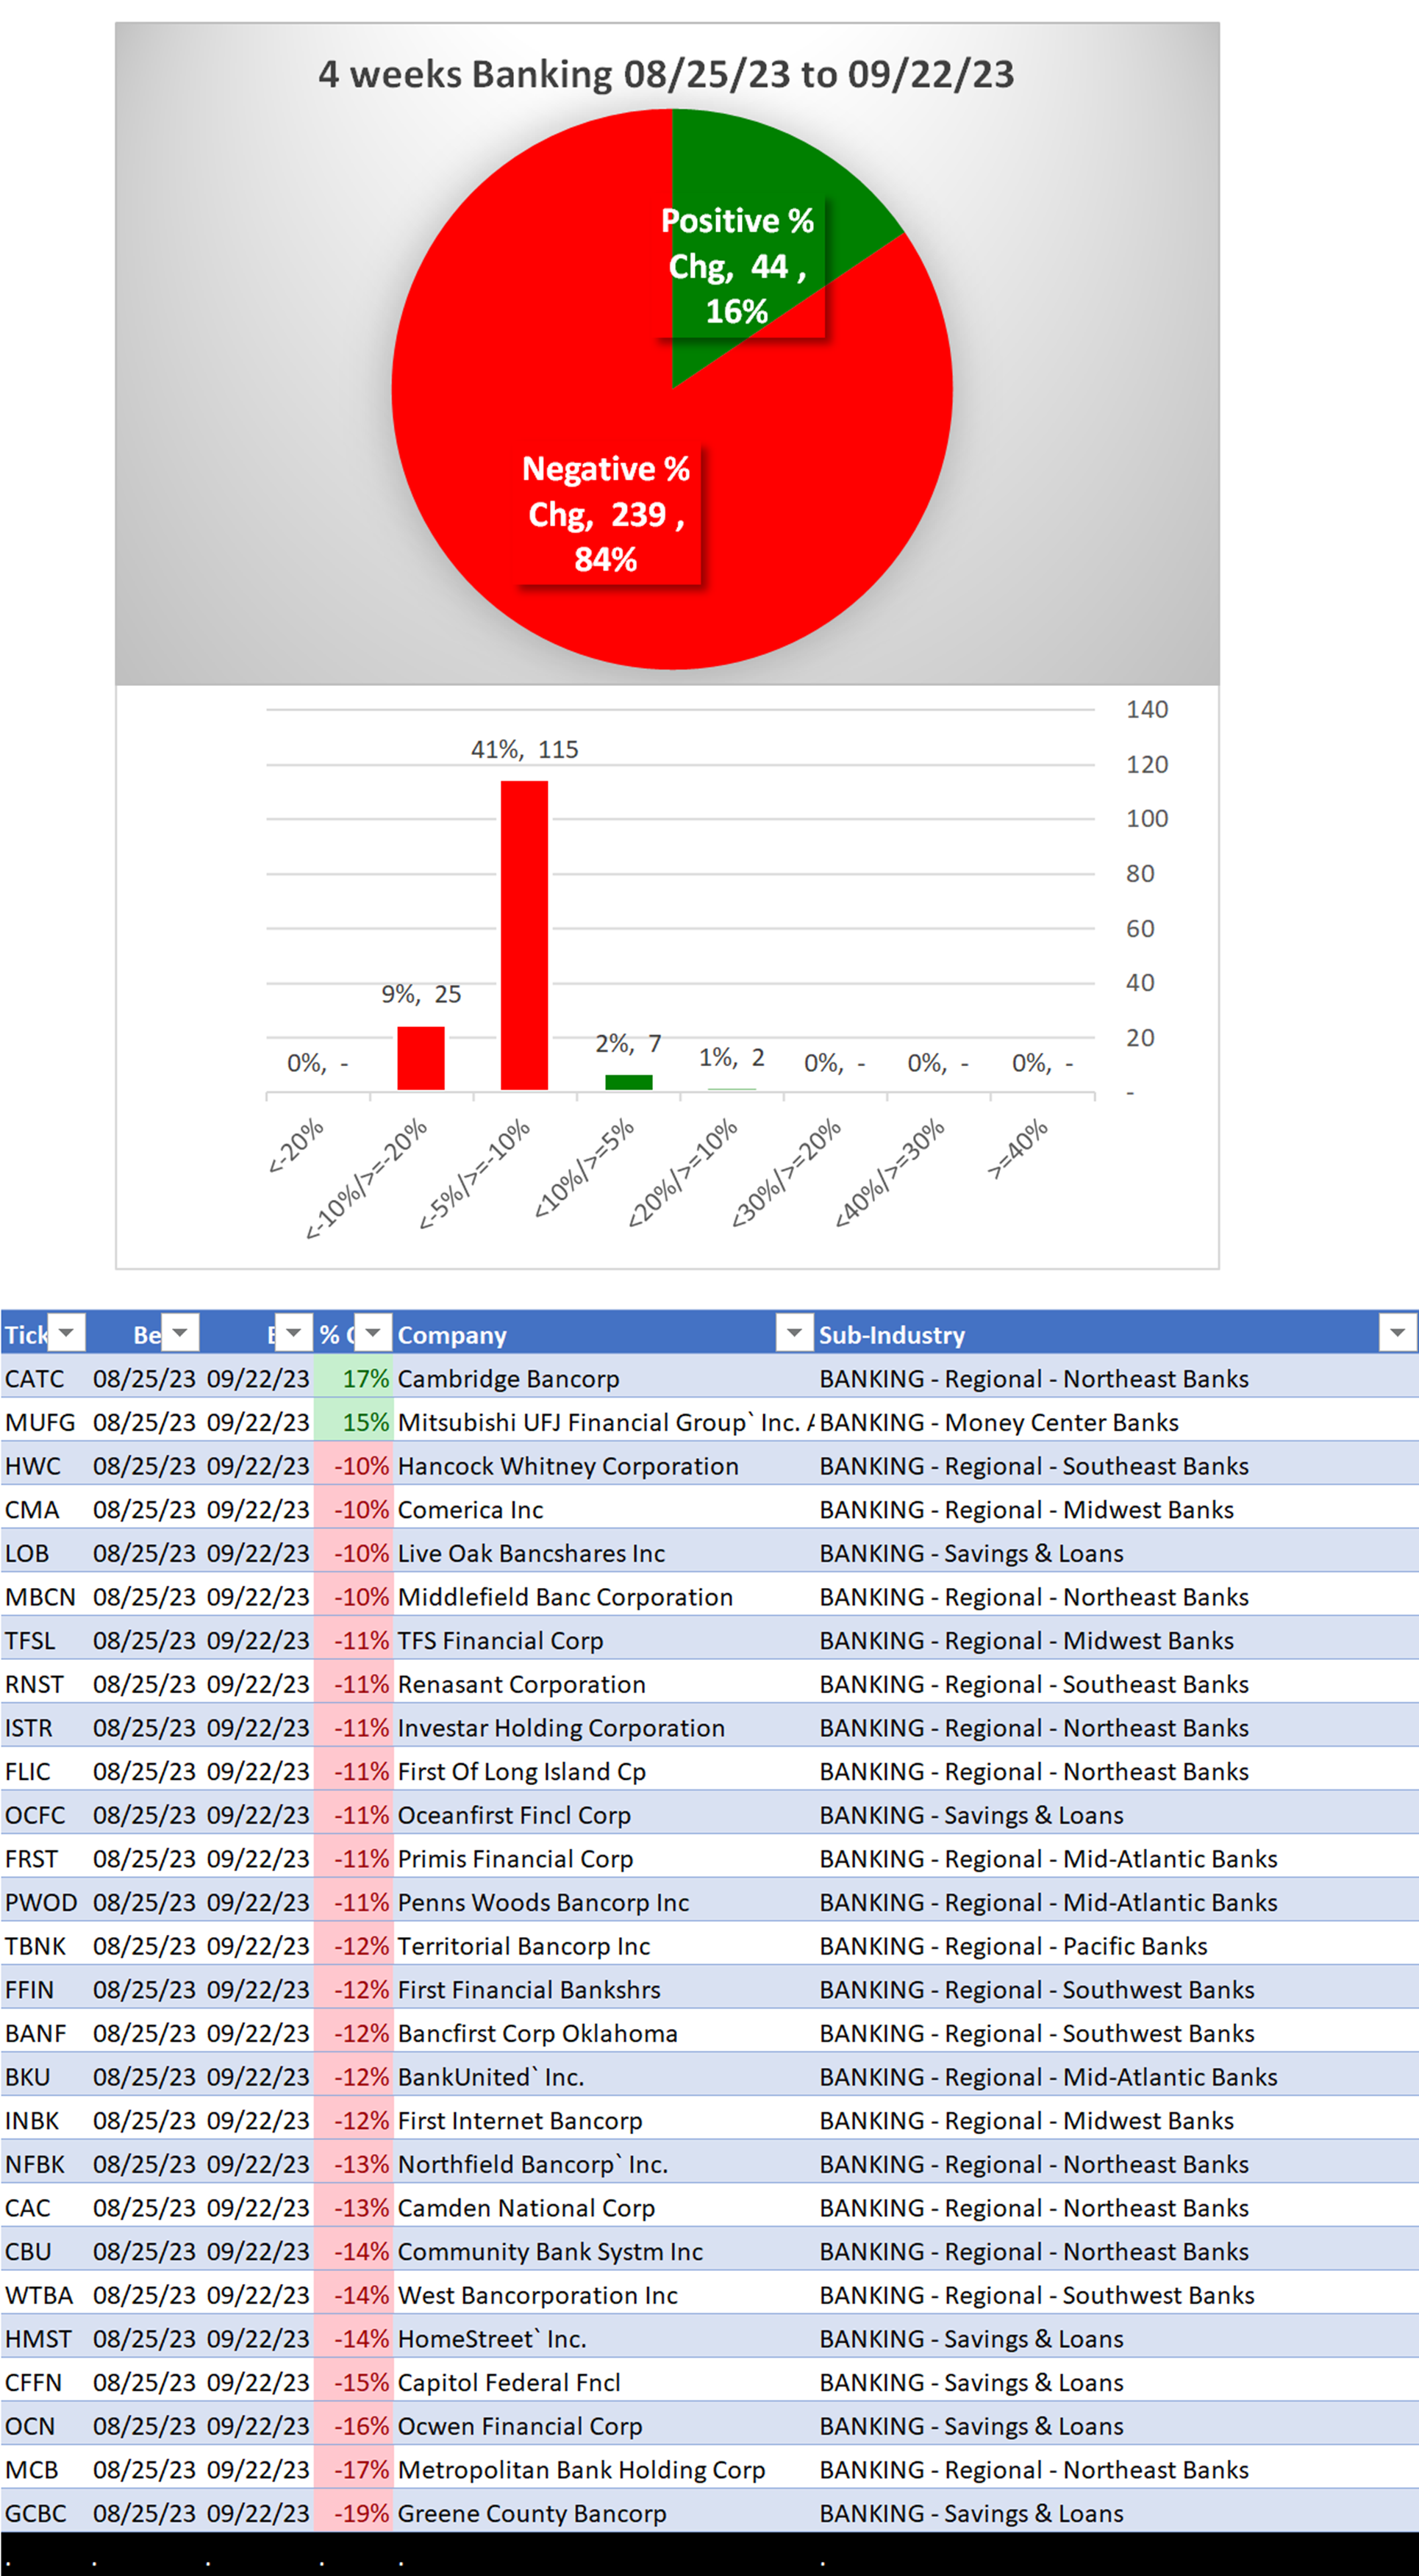
3B. Lookback 4 weeks
3C. Lookback 1 Week
1. INDUSTRY OVERVIEW
1A. Performance
Past 10 Weeks Strengthening/Weakening week-by-week, per the following chart:
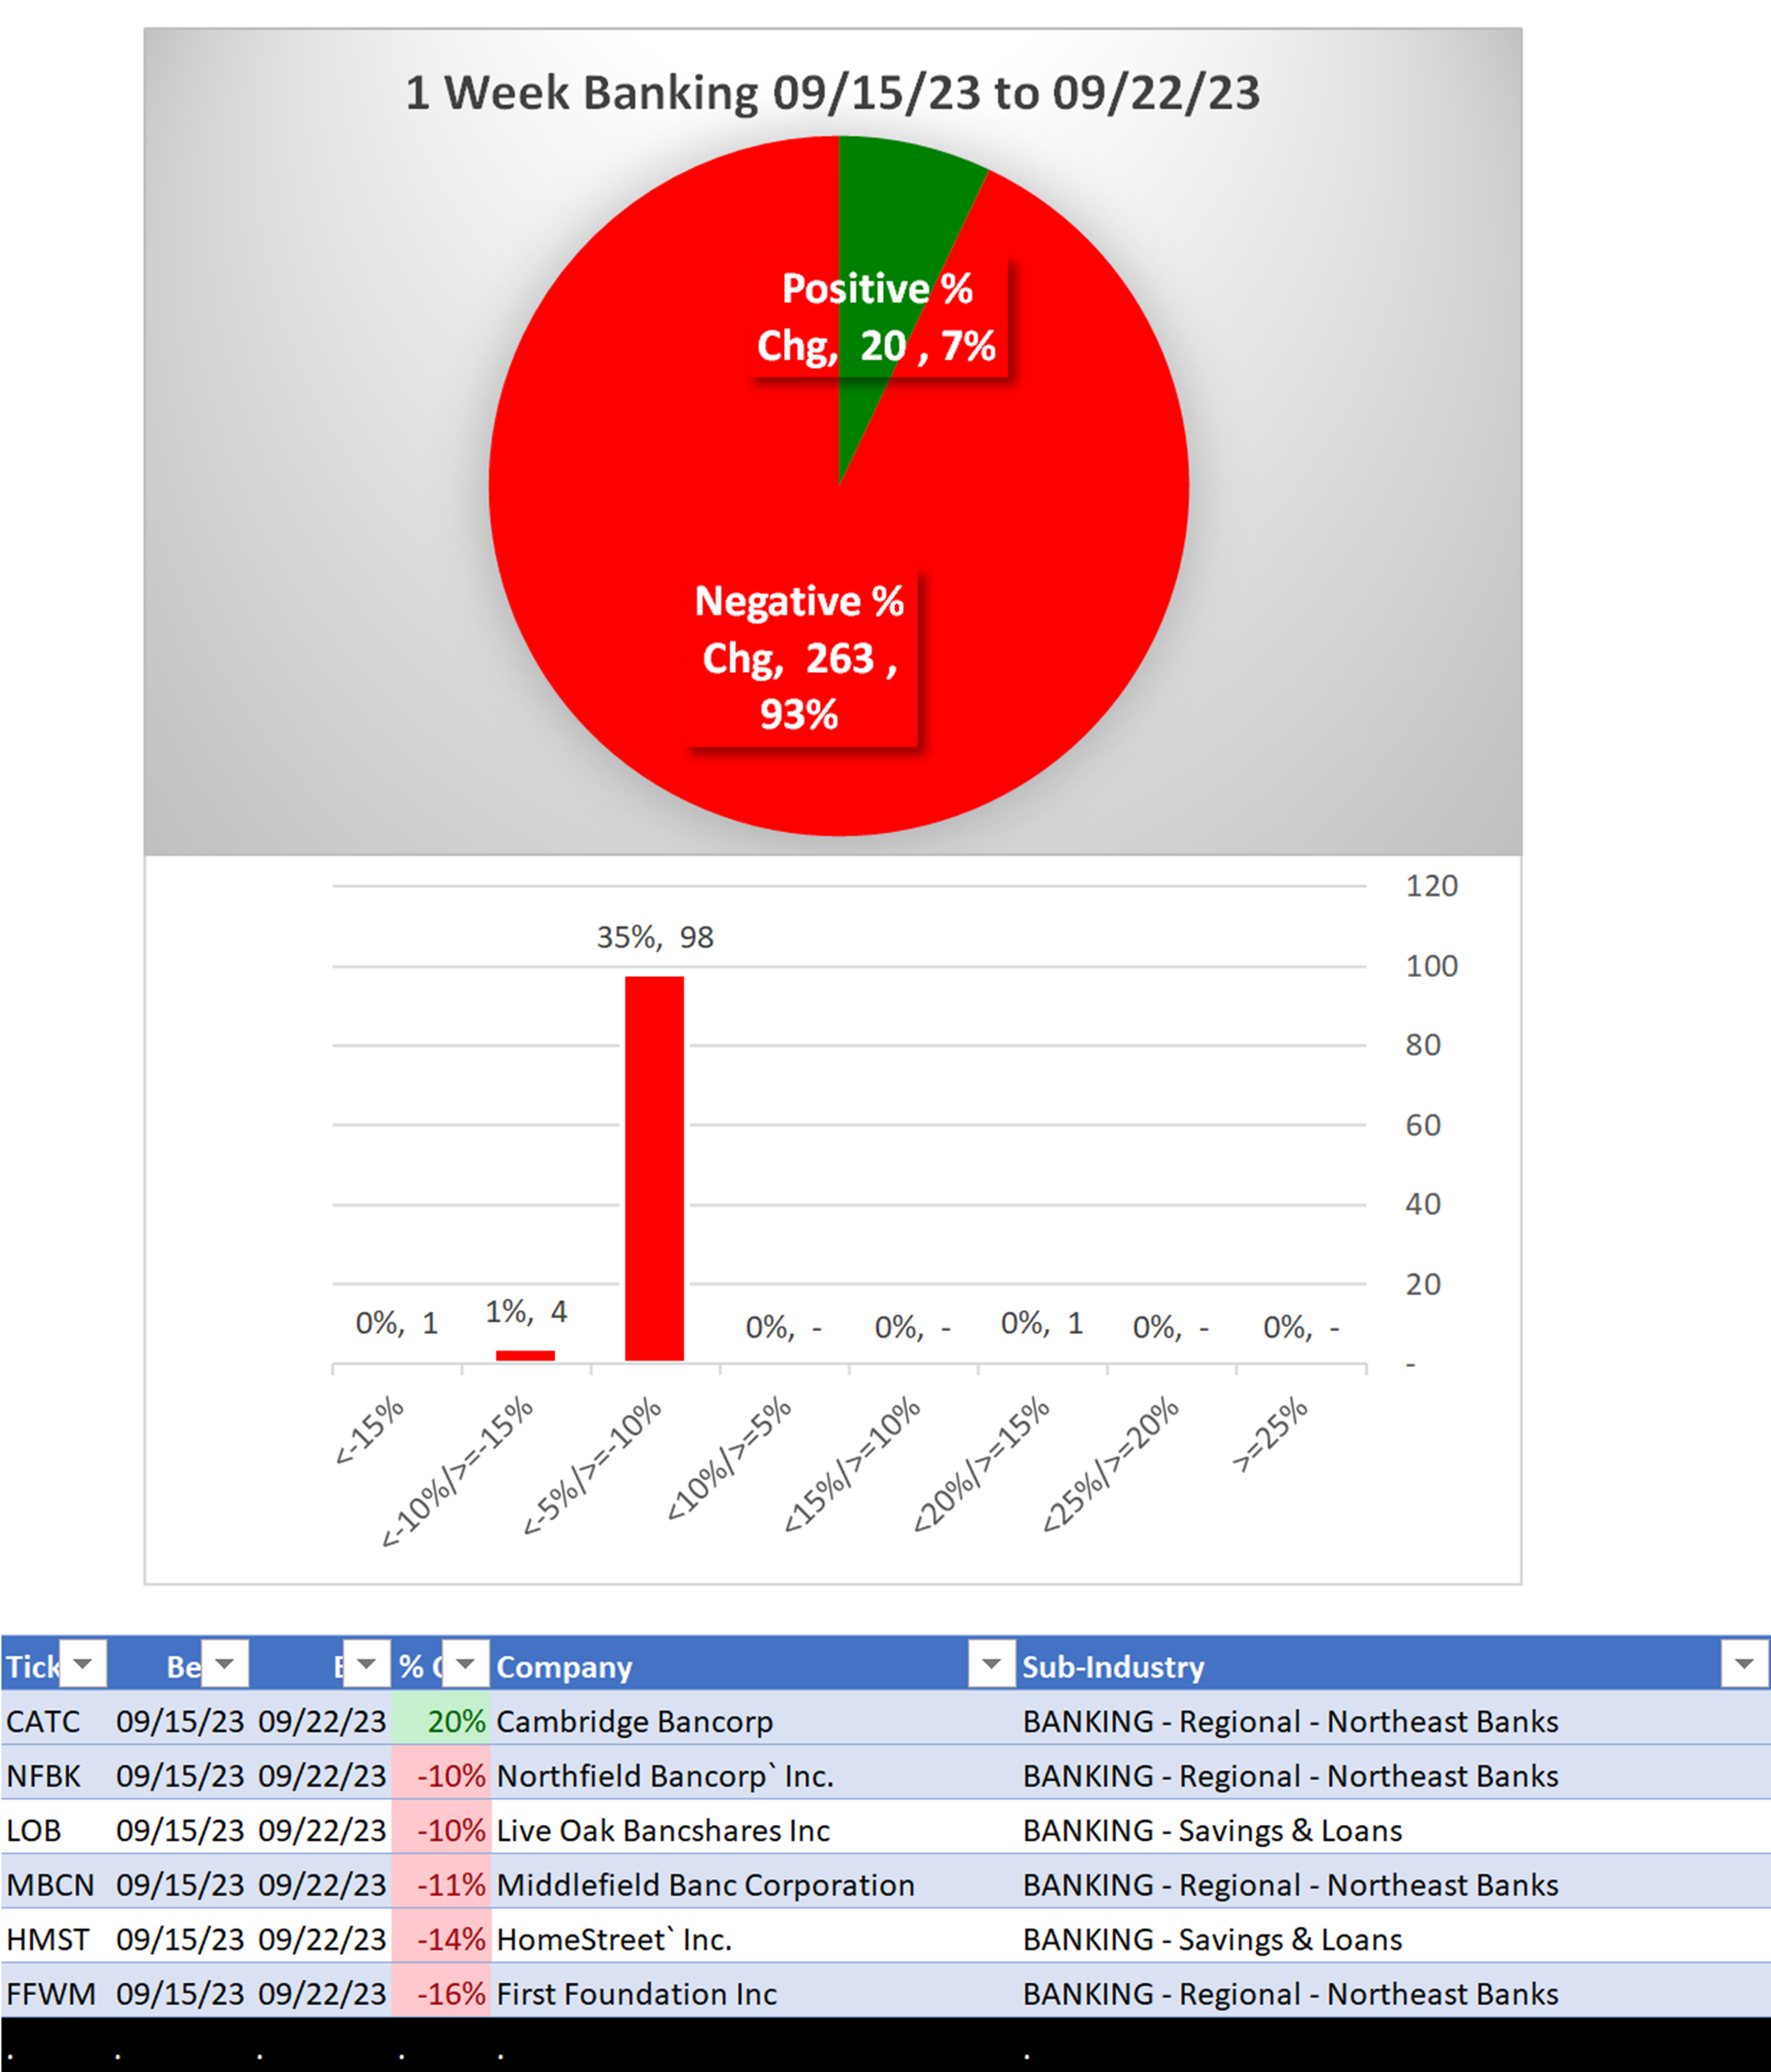
WEAKENING 1 Week vs. Mid- and Longer-Term // 1 week positive/negative stocks ratio is LOWER than both 4 weeks and 6 Months, per the following chart:
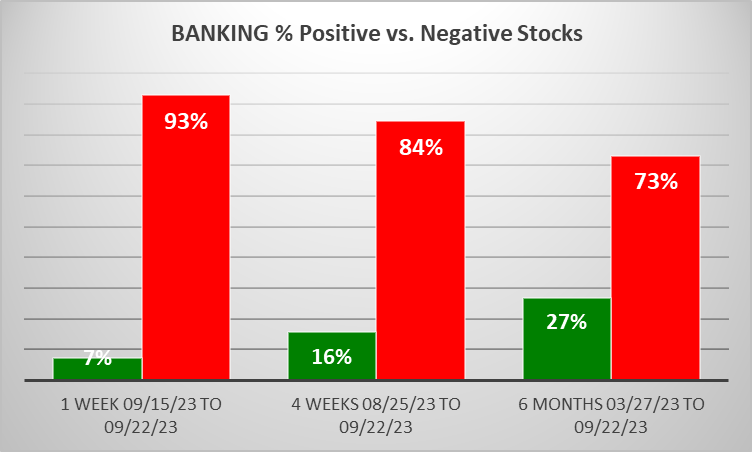
Comments:
- Low % positive stocks ratio for 1 week and 6 months.
- Only 1% Strongest rated stocks vs. 54% Weakest rated stocks.
1B. Background
Largest of 9 sub-industries (283 stocks, average 31):
- Regional - Northeast Banks (96 stocks)
- Regional - Mid-Atlantic Banks (34 stocks)
- Regional - Pacific Banks (33 stocks)
- Savings & Loans (31 stocks)
- Regional - Midwest Banks (28 stocks)
Top 10 by Market Capitalization:
JPM/JPMorgan Chase and Co, BAC/Bank Of America Corp, HSBC/Hsbc Holdings Plc, WFC/Wells Fargo & Company, RY/Royal Bank Of Canada, TD/Toronto Dominion Bank (The), C/Citigroup, MUFG/Mitsubishi UFJ Financial Group Inc. ADS, SAN/Banco Santander SA, BMO/Bank Of Montreal
2. SUB-INDUSTRIES AND STOCKS DETAIL
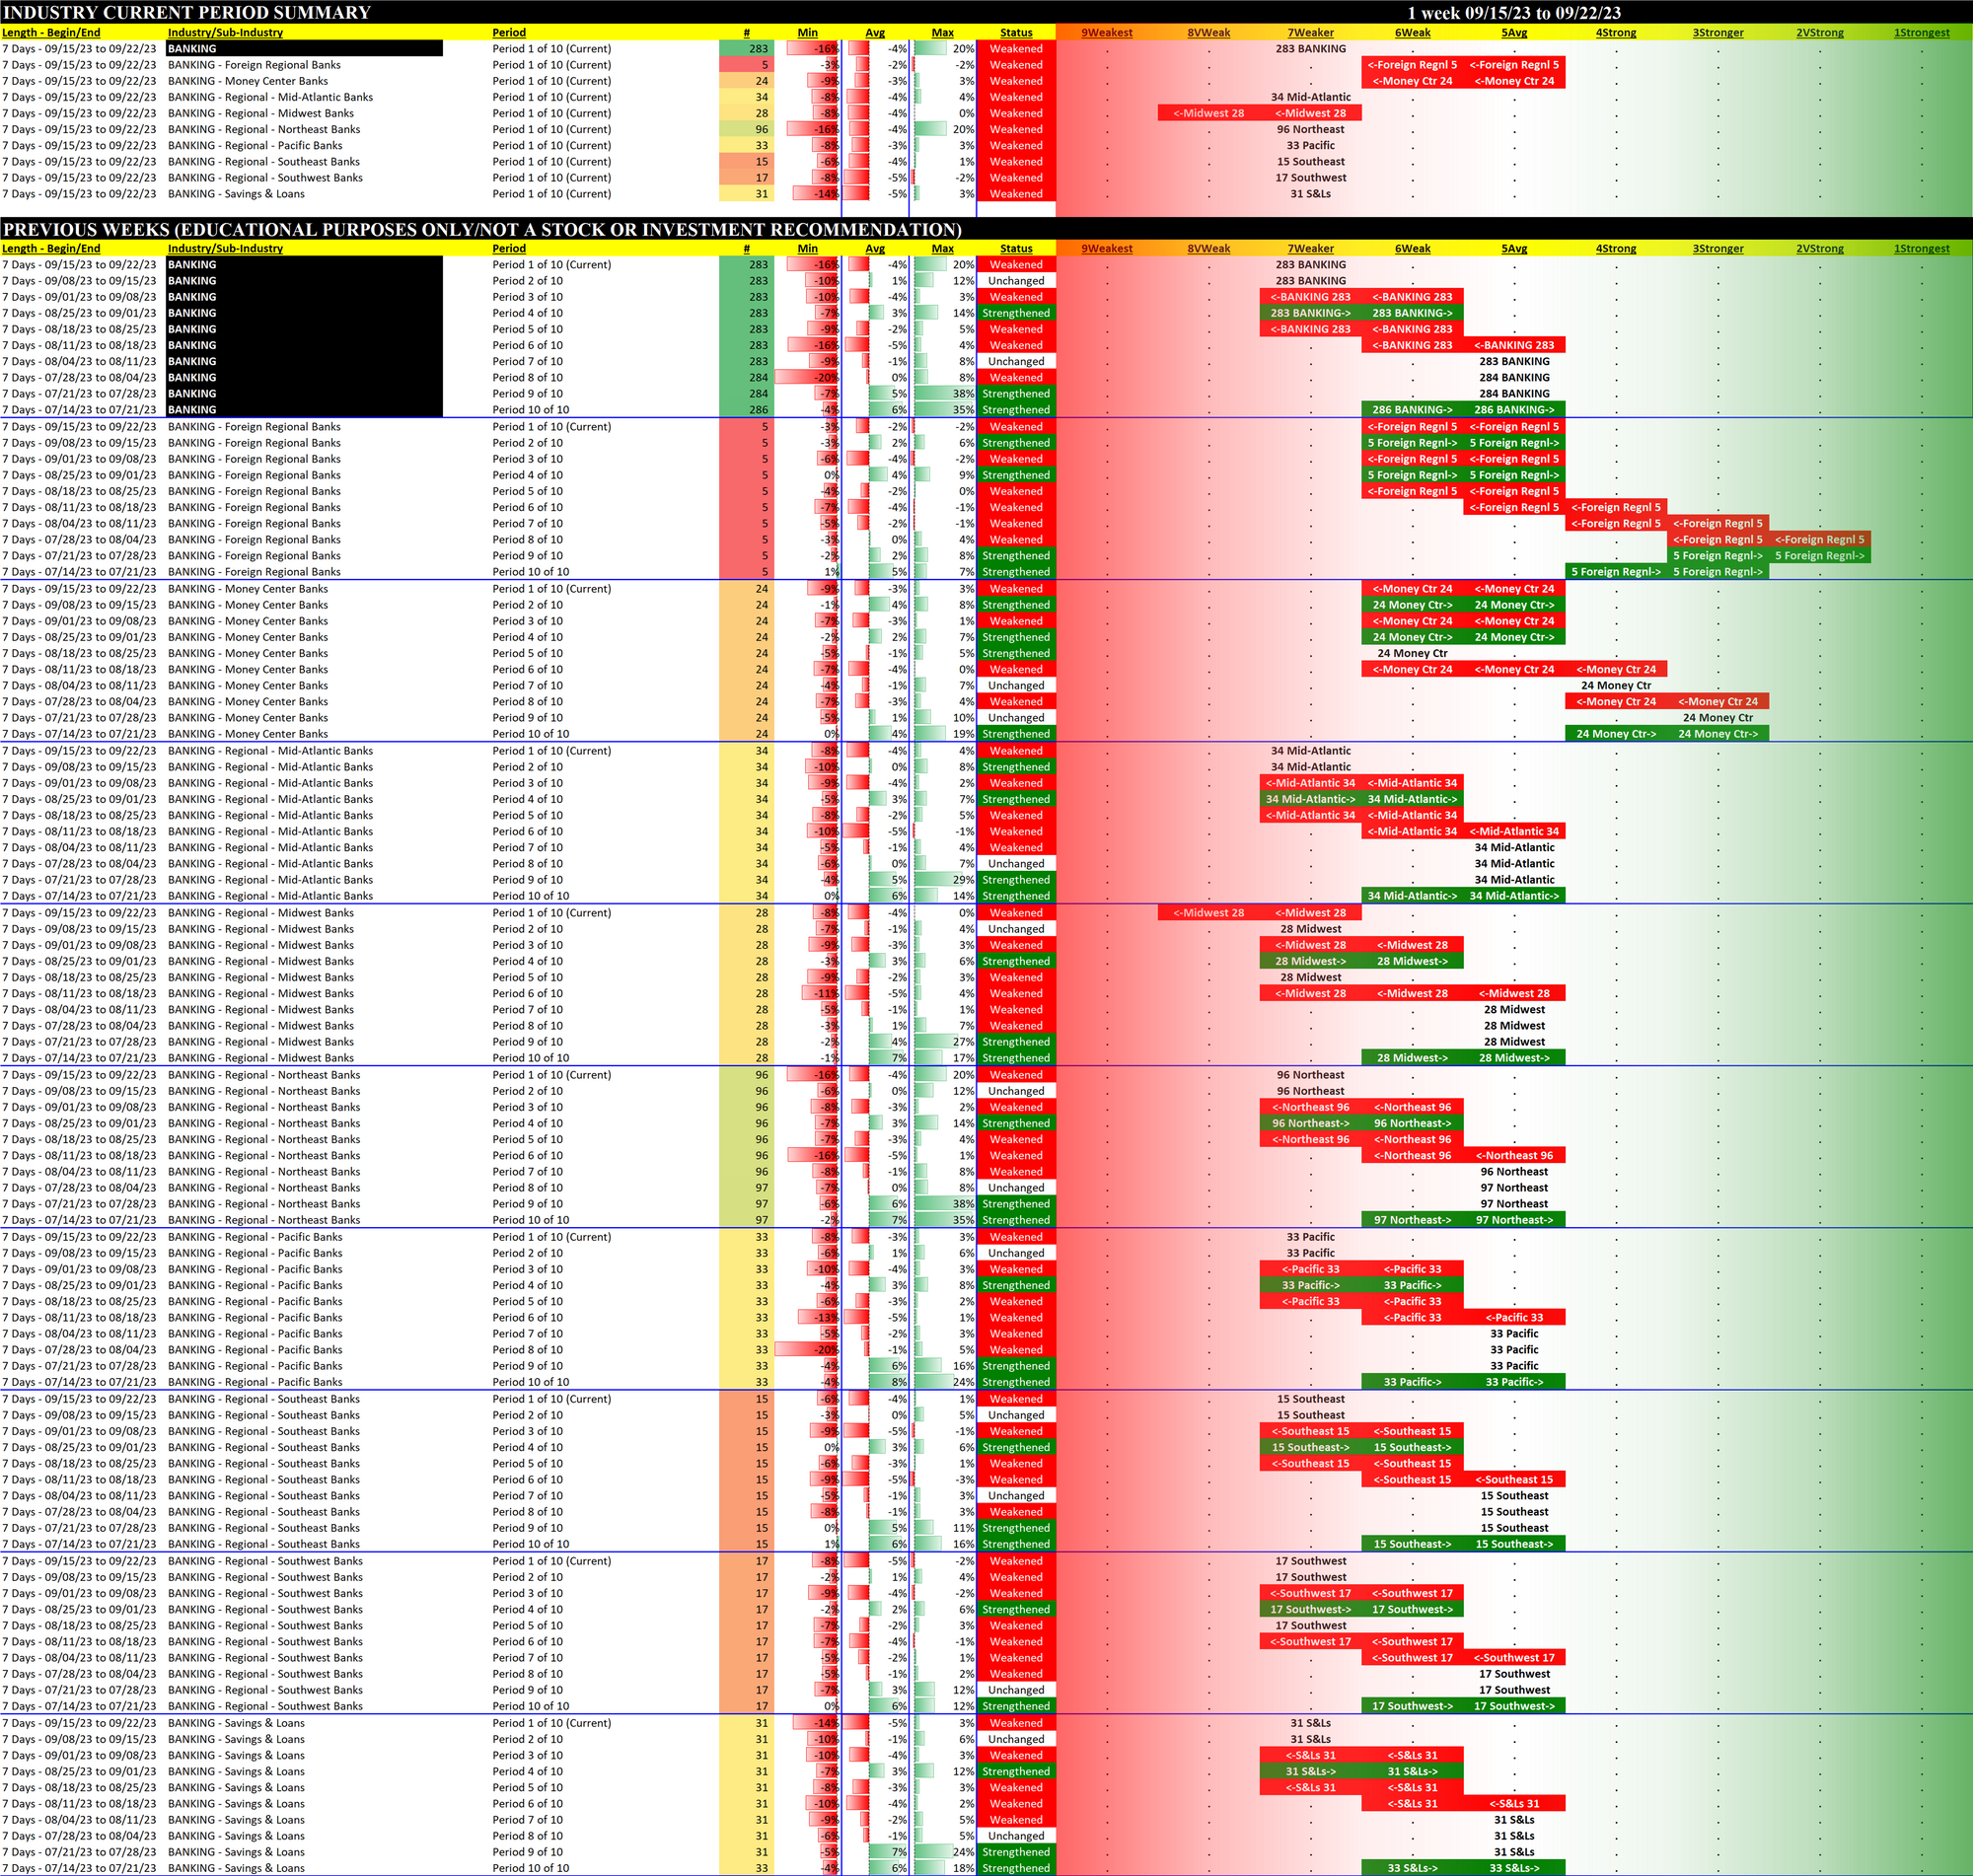
2A. Sub-Industries Overview
Strengthened: 0/9 sub-industries
Weakened: 3/9 sub-industries
STRONGEST at Weak rating/6th strongest of 9 levels:
- Foreign Regional Banks (5 stocks)
- Money Center Banks (24 stocks)
WEAKEST at Very Weak rating/8th strongest of 9 levels:
- Regional - Midwest Banks (28 stocks)
2B. Sub-Industries 10-Week Strengthening Analysis
What: recent week-by-week strength changes for the industry and each underlying sub-industry
Why: objective measurement of strengthening and weakening enabling comparison within and across industries and sub-industries
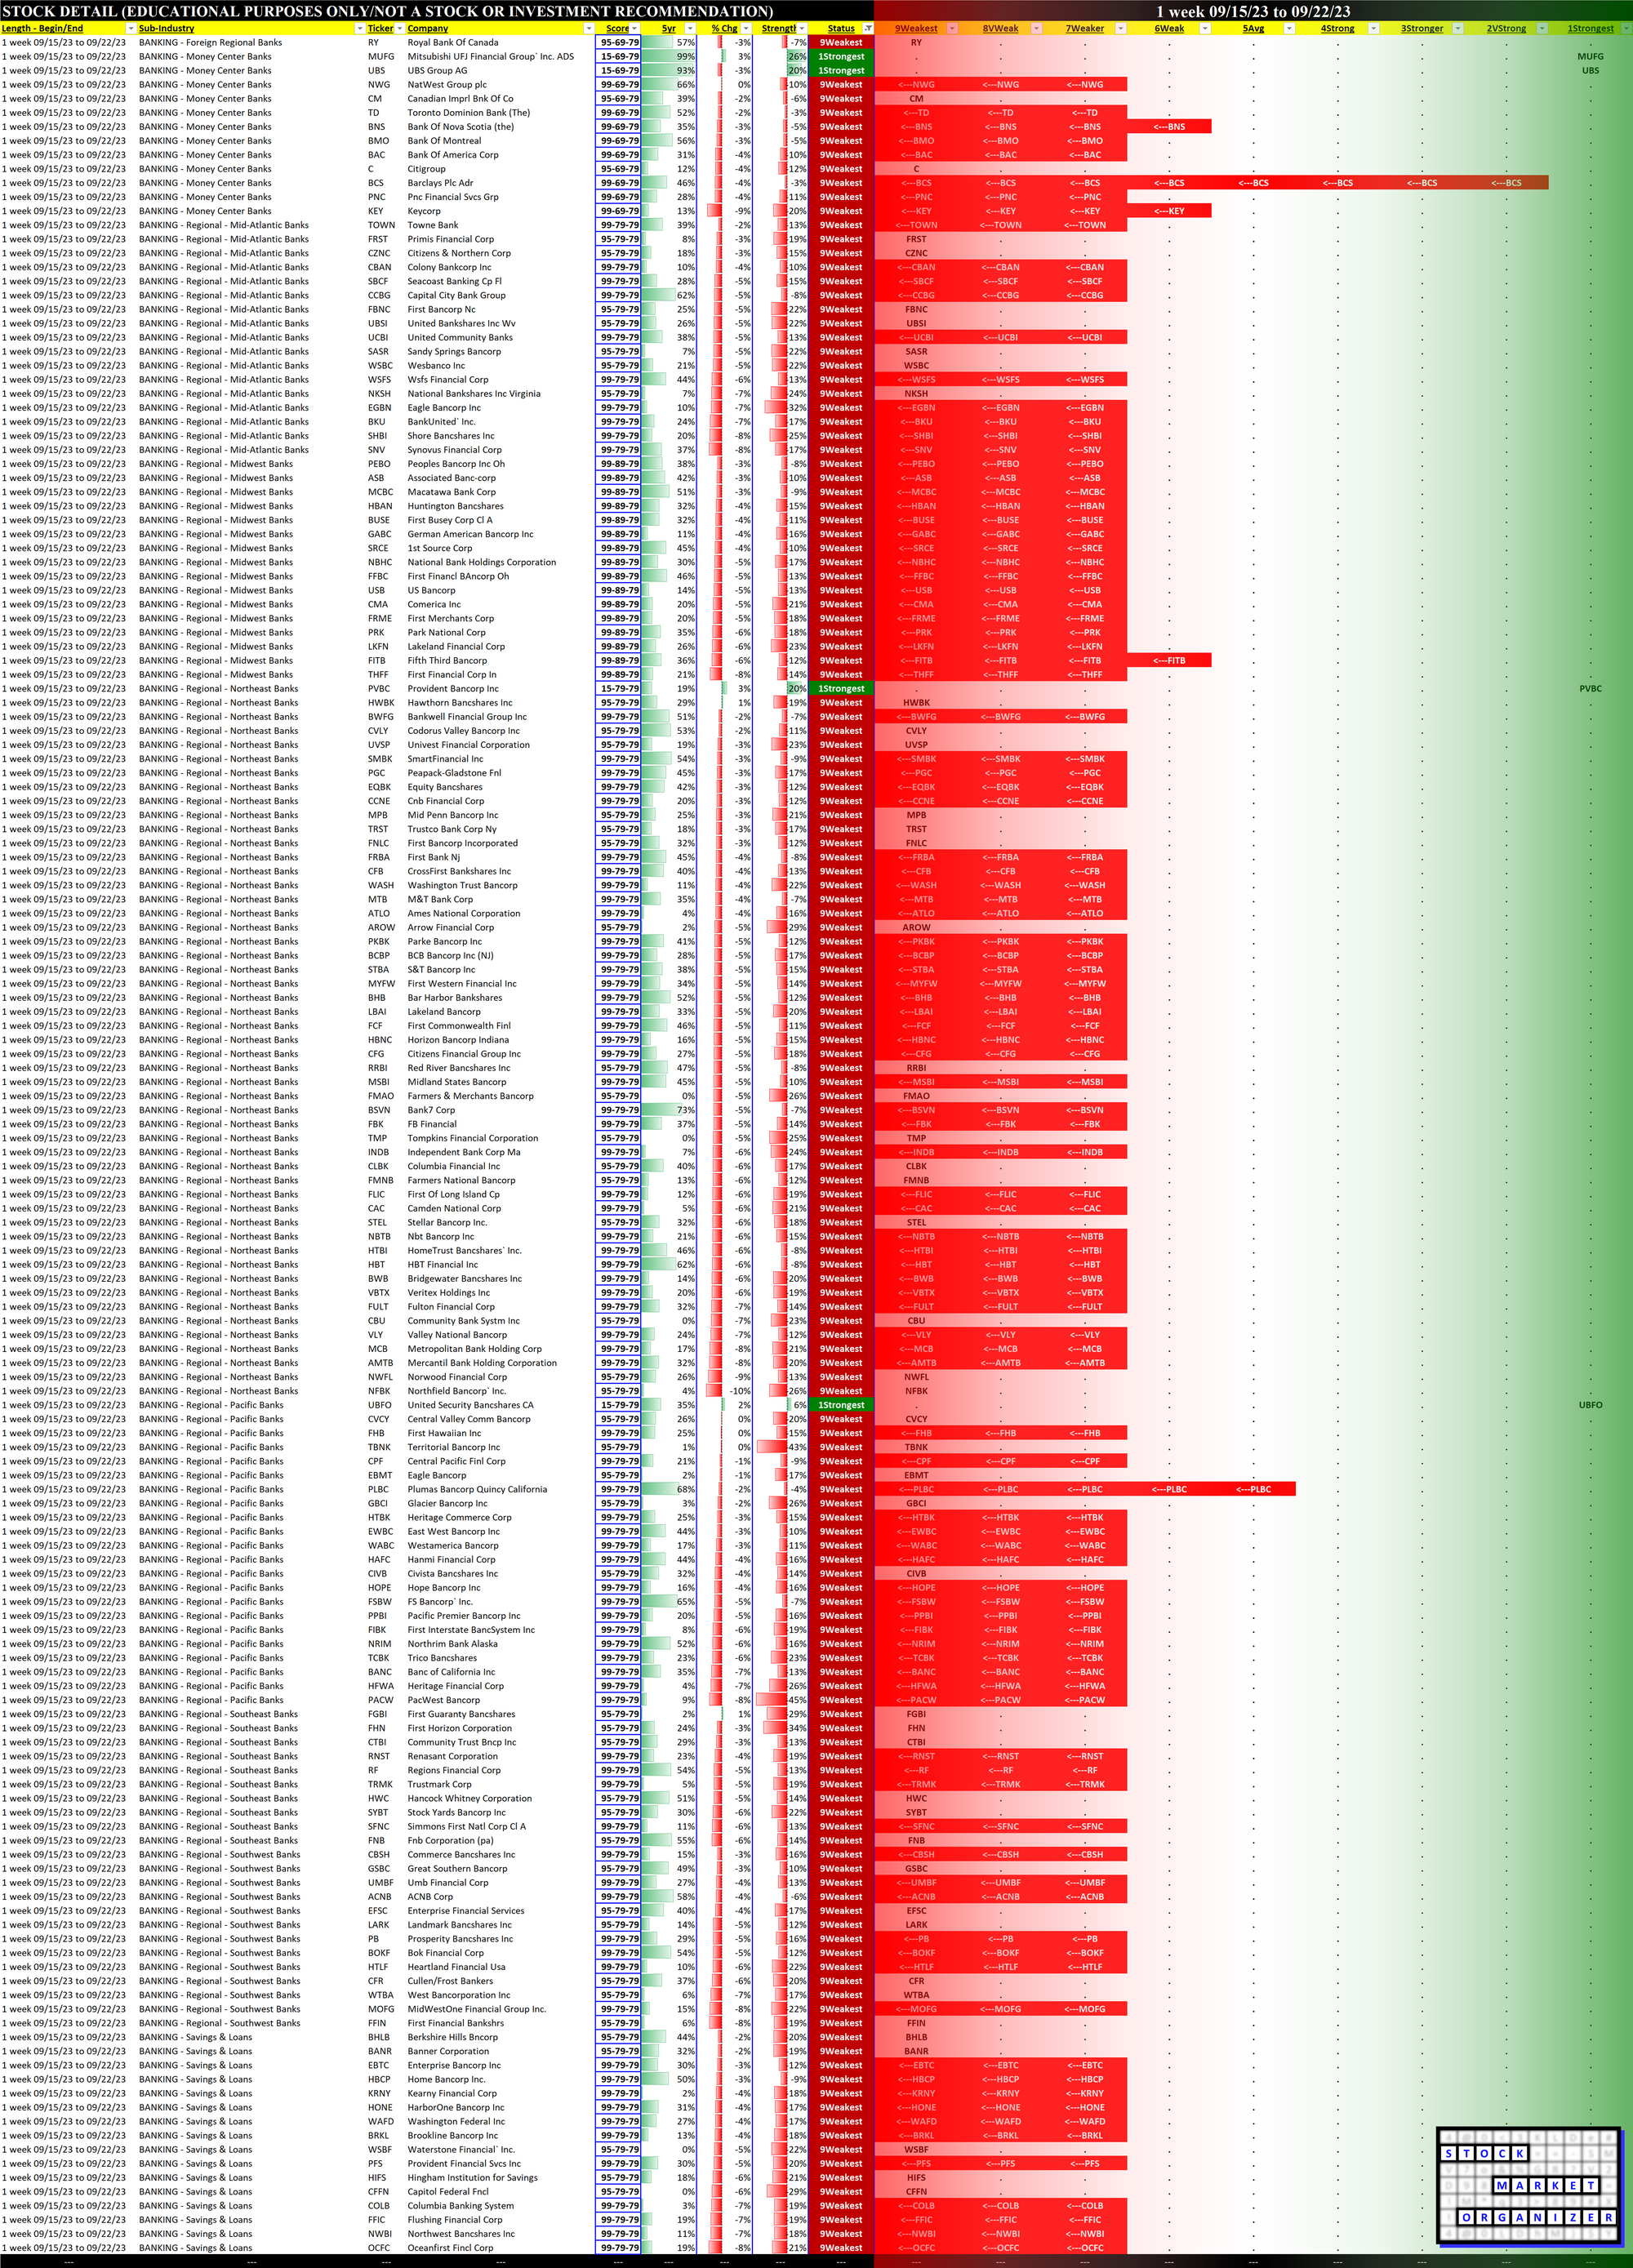
2C. Stocks 1 Week Strongest and Weakest
What: stocks currently rated Strongest/Weakest (highest/lowest of 9 strength ratings)
Why: most interesting stocks for available capital because
- the Strongest have the least amount of overhead supply to dampen breakouts while
- the Weakest may be prone to volatility, subject to big pops from bottom-fishing and short-covering BUT ALSO to bigger and faster falls.
(Not guaranteed and not a recommendation - weak stocks in weakening sub-industries may be better shorts than high-flyers.)
3. STRENGTH BY LOOKBACK PERIOD (with Best/Worst stocks)
3A. Lookback 6 Months
3B. Lookback 4 weeks
3C. Lookback 1 Week